Deploy Collector (Agent)
10 minutesCollector (Agent)
Now we will deploy a collector. At first this will be configured to go directly to the back-end, but we will change the configuration and restart the collector to use the gateway.
The steps:
- Click the Data Management icon in the toolbar
- Click the + Add integration button
- Click Deploy the Splunk OpenTelemetry Collector button
- Click Next
- Select Linux
- Leave the mode as Host monitoring (agent)
- Set the environment to prod
- Leave the rest as defaults
- Choose the access token for this workshop
- Click Next
- Copy the installer script and run it in the provided linux environment.
This collector is sending host metrics, so you can find it in common navigators:
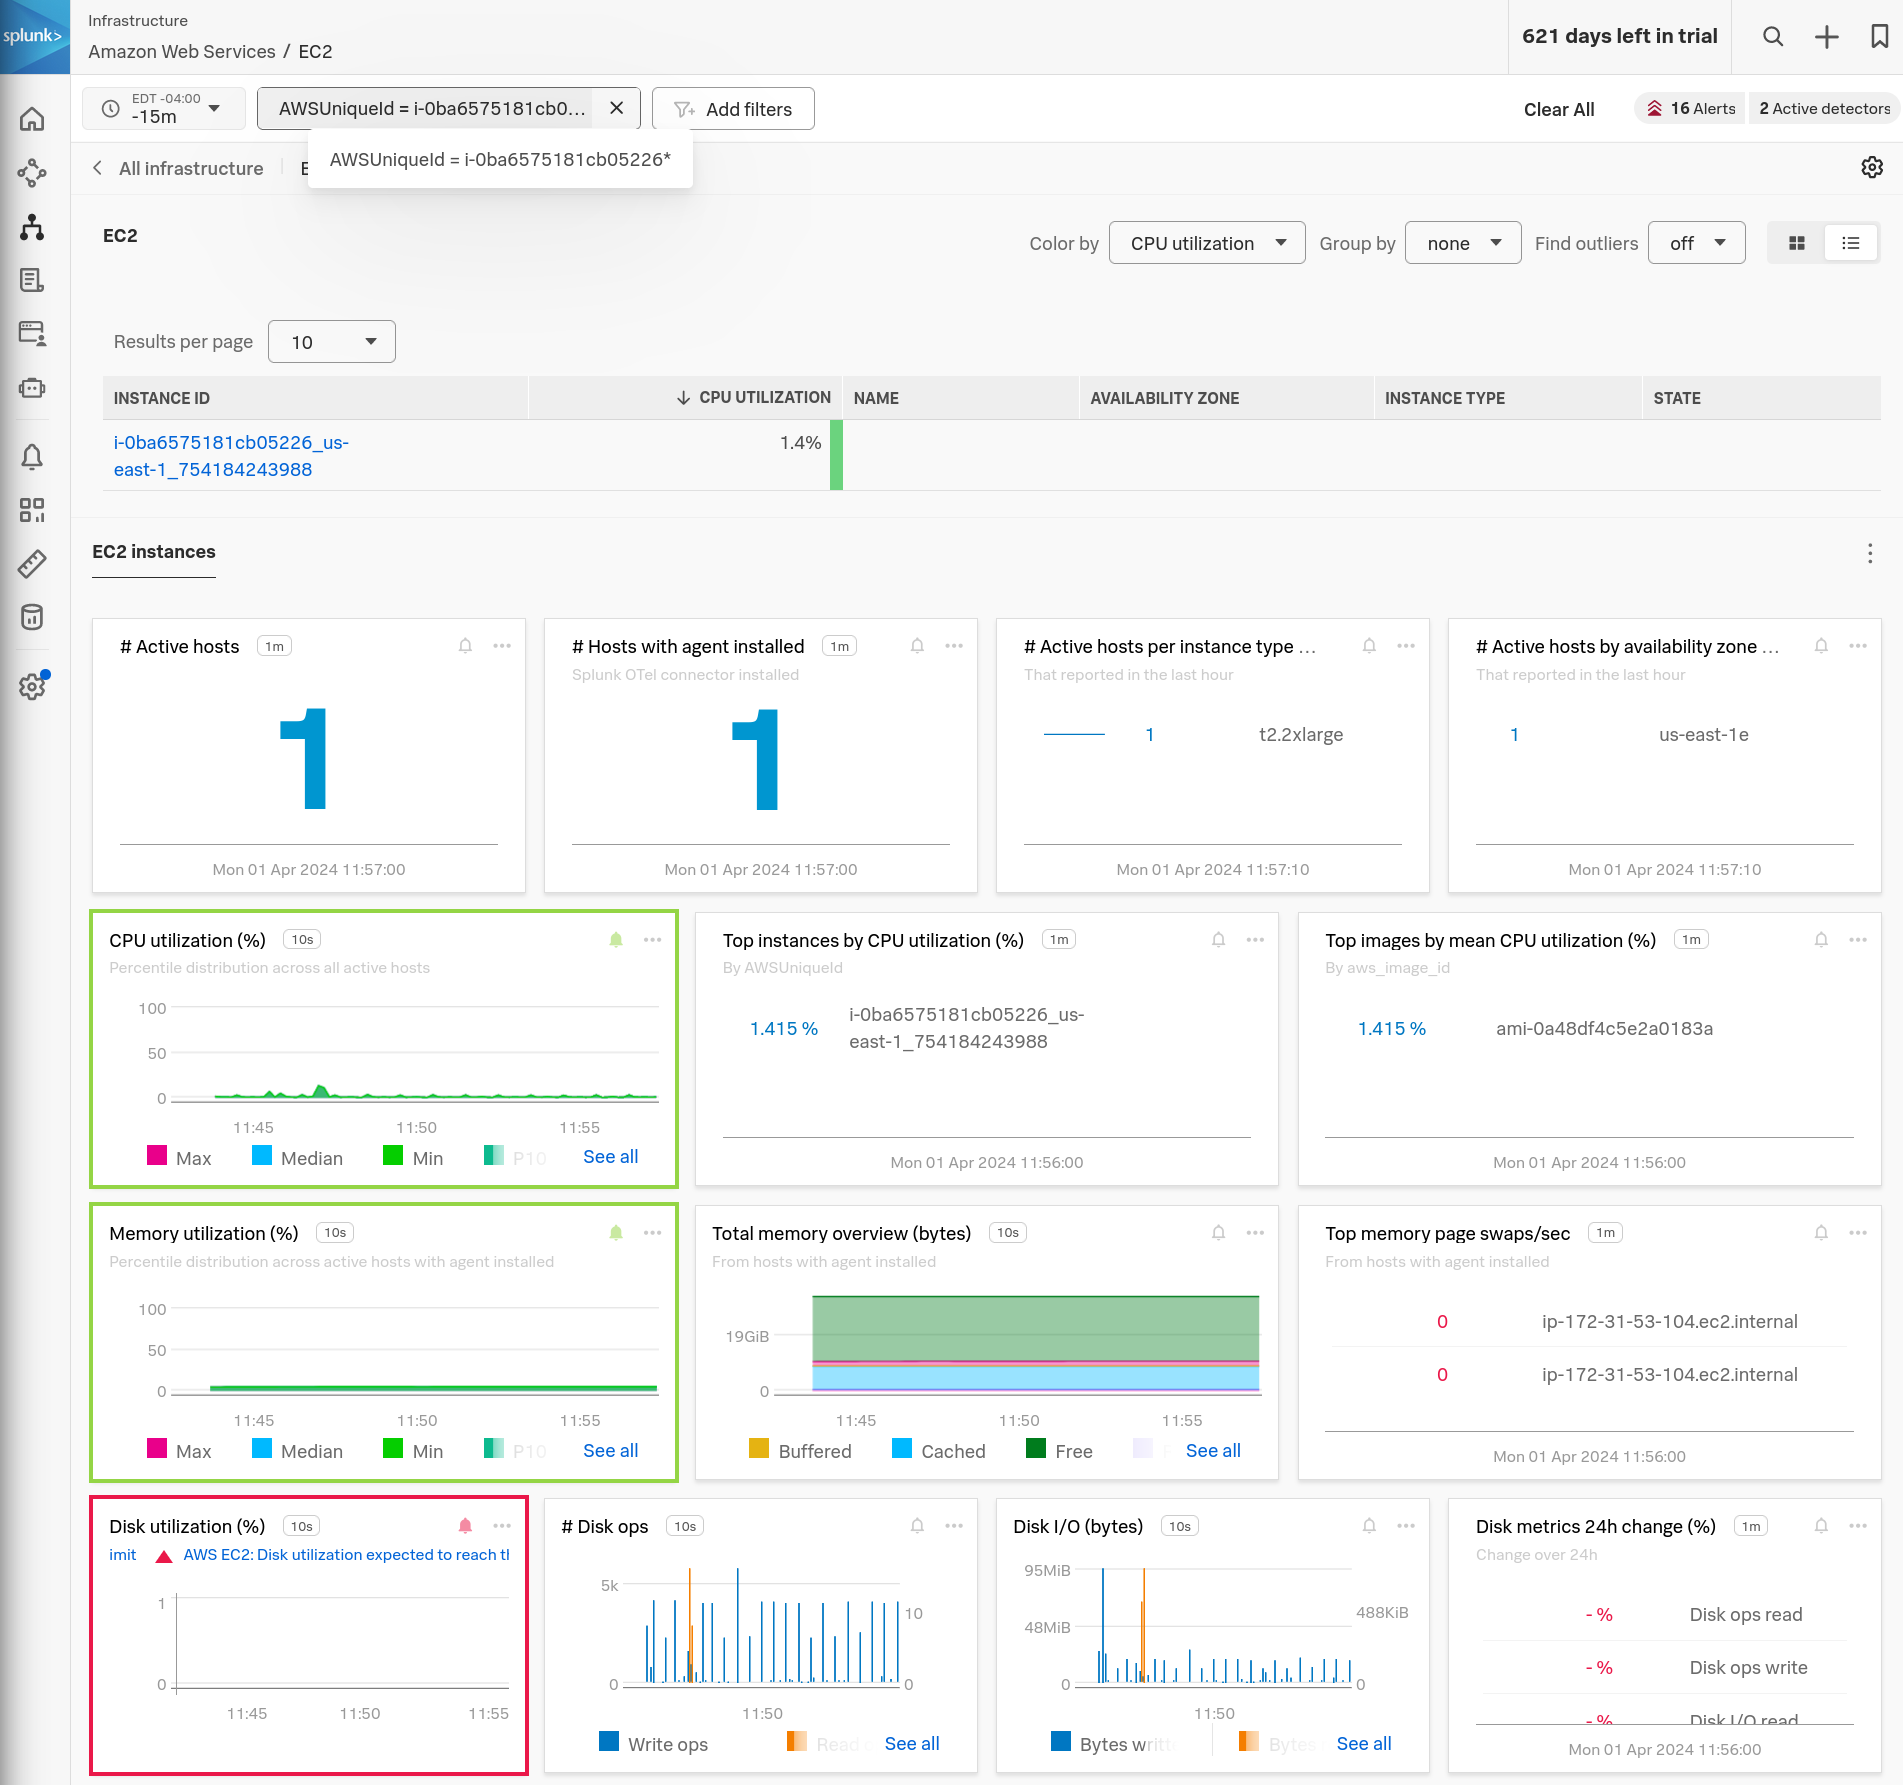
- Click the Infrastructure icon in the toolbar
- Click the EC2 panel under Amazon Web Services
- The
AWSUniqueIdis the easiest thing to find; add a filter and look for it with a wildcard (i.e.i-0ba6575181cb05226*)
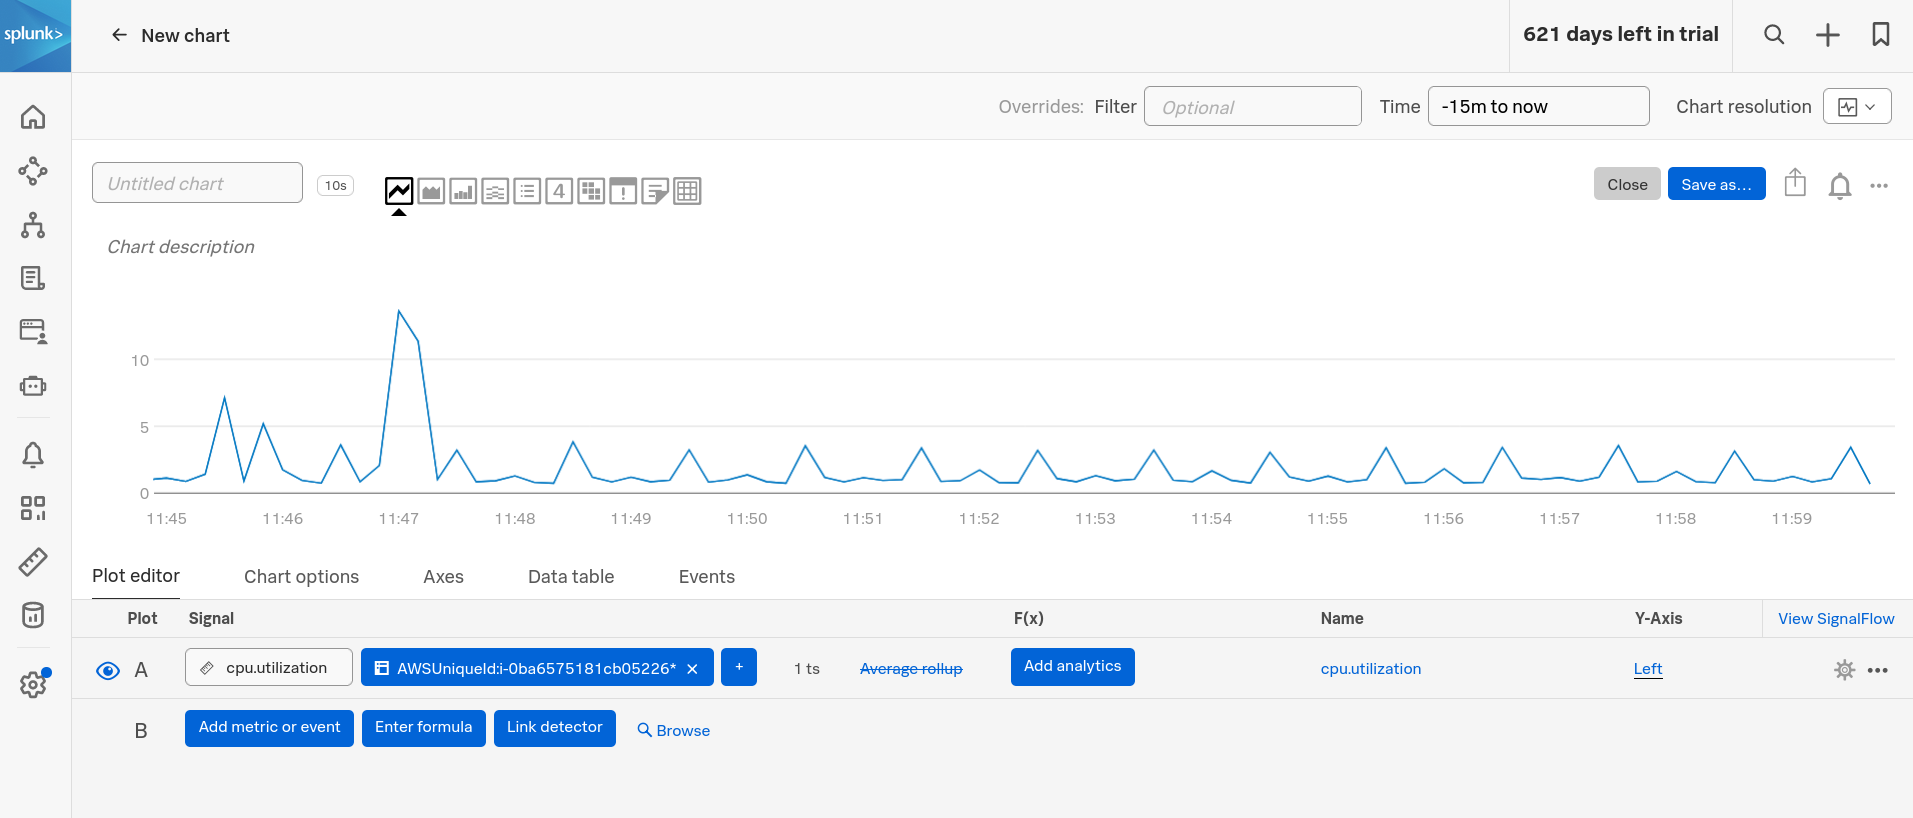
We can also simply look at the cpu.utilization metric. Create a new chart to display it, filtered on the AWSUniqueId:
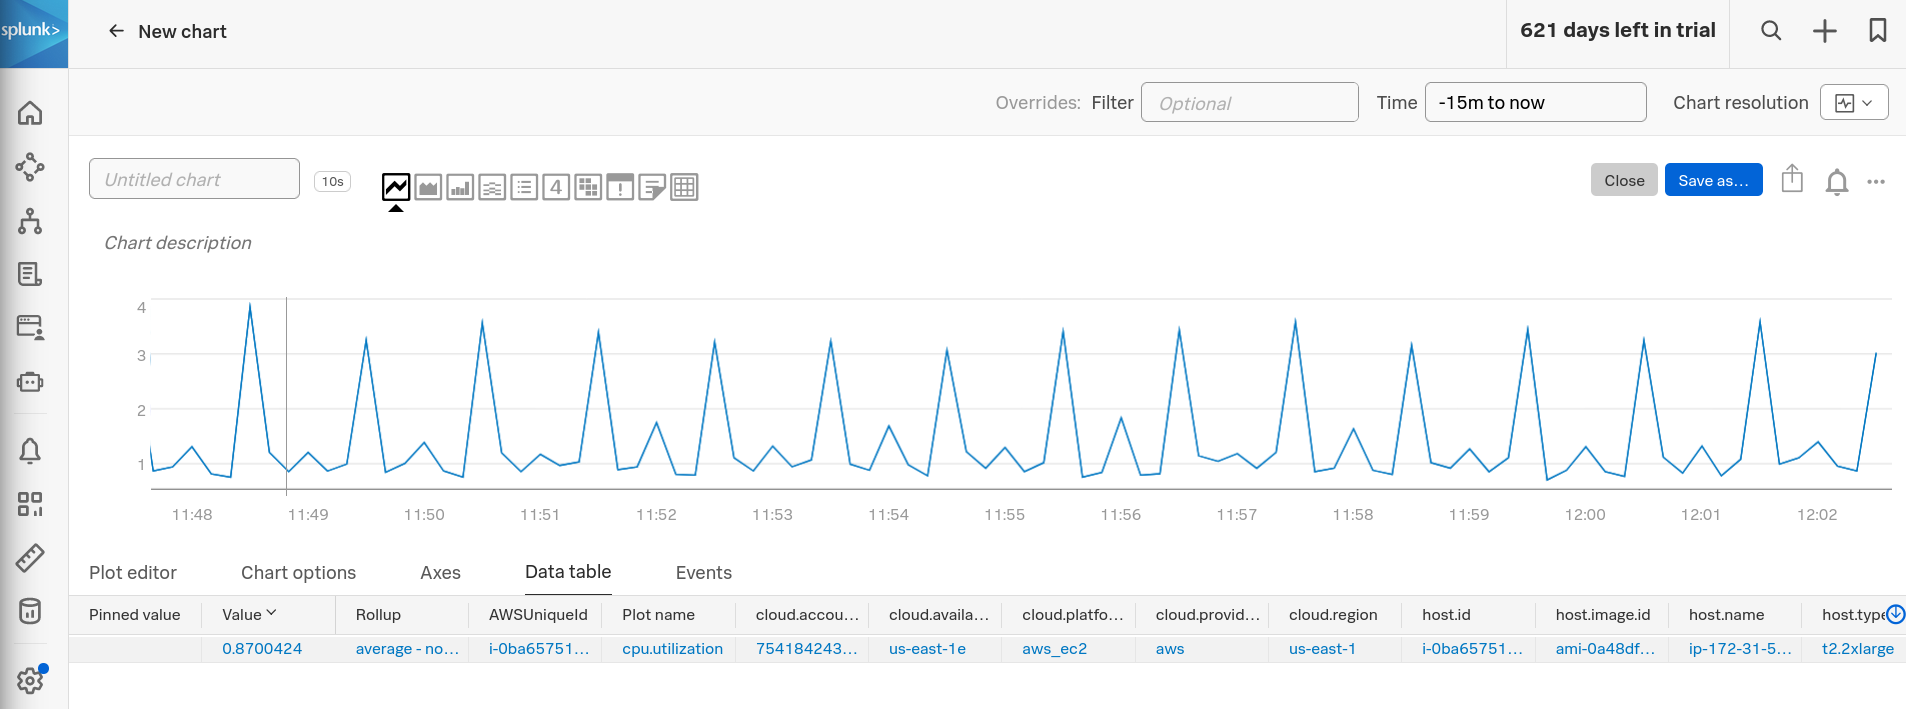
The reason we wanted to do that is so we can easily see the new dimension added on once we send the collector through the gateway. You can click on the Data table to see the dimensions currently being sent:
Next
Next we’ll reconfigure the collector to send to the gateway.