Build the Sample Application
10 minutesIntroduction
For this workshop, we’ll be using a microservices-based application. This application is for an online retailer and normally includes more than a dozen services. However, to keep the workshop simple, we’ll be focusing on two services used by the retailer as part of their payment processing workflow: the credit check service and the credit processor service.
Pre-requisites
You will start with an EC2 instance and perform some initial steps in order to get to the following state:
- Deploy the Splunk distribution of the OpenTelemetry Collector
- Build and deploy
creditcheckserviceandcreditprocessorservice - Deploy a load generator to send traffic to the services
Initial Steps
The initial setup can be completed by executing the following steps on the command line of your EC2 instance:
cd workshop/tagging
./0-deploy-collector-with-services.sh
View your application in Splunk Observability Cloud
Now that the setup is complete, let’s confirm that it’s sending data to Splunk Observability Cloud. Note that when the application is deployed for the first time, it may take a few minutes for the data to appear.
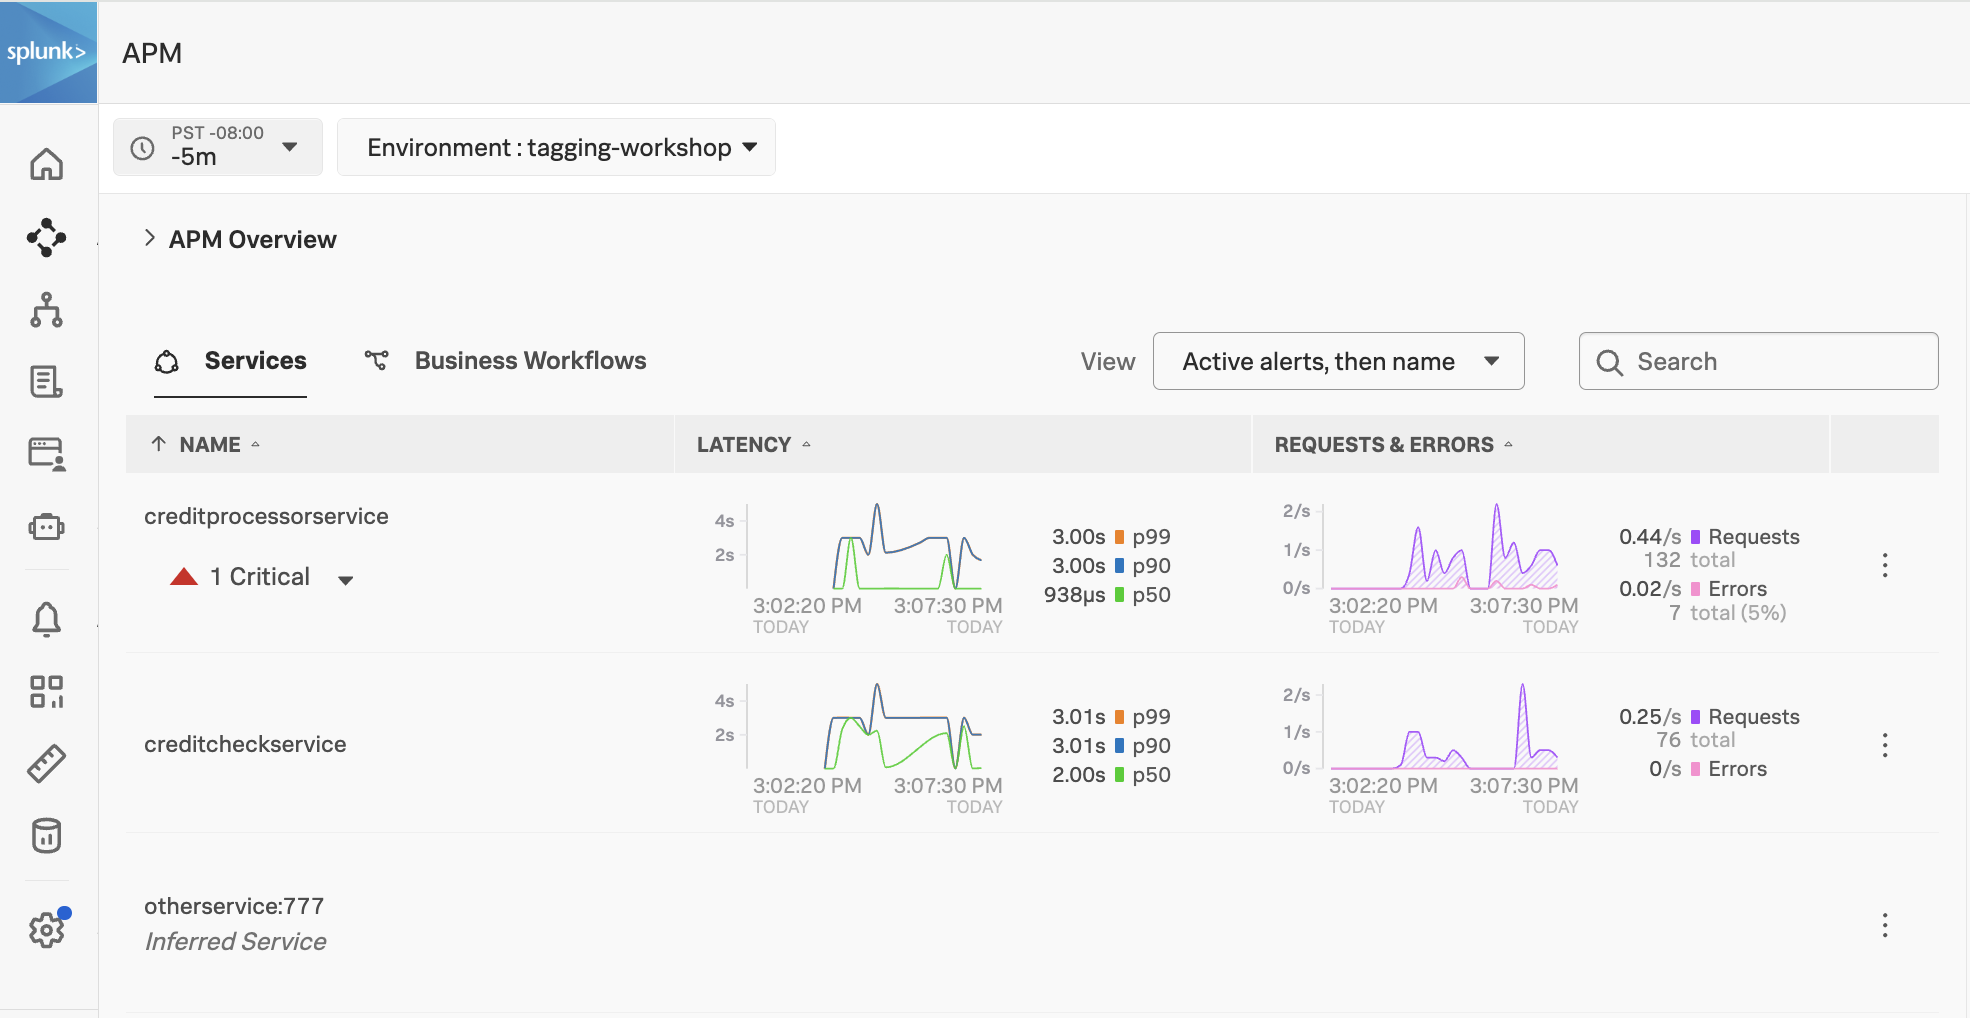
Navigate to APM, then use the Environment dropdown to select your environment (i.e. tagging-workshop-instancename).
If everything was deployed correctly, you should see creditprocessorservice and creditcheckservice displayed in the list of services:
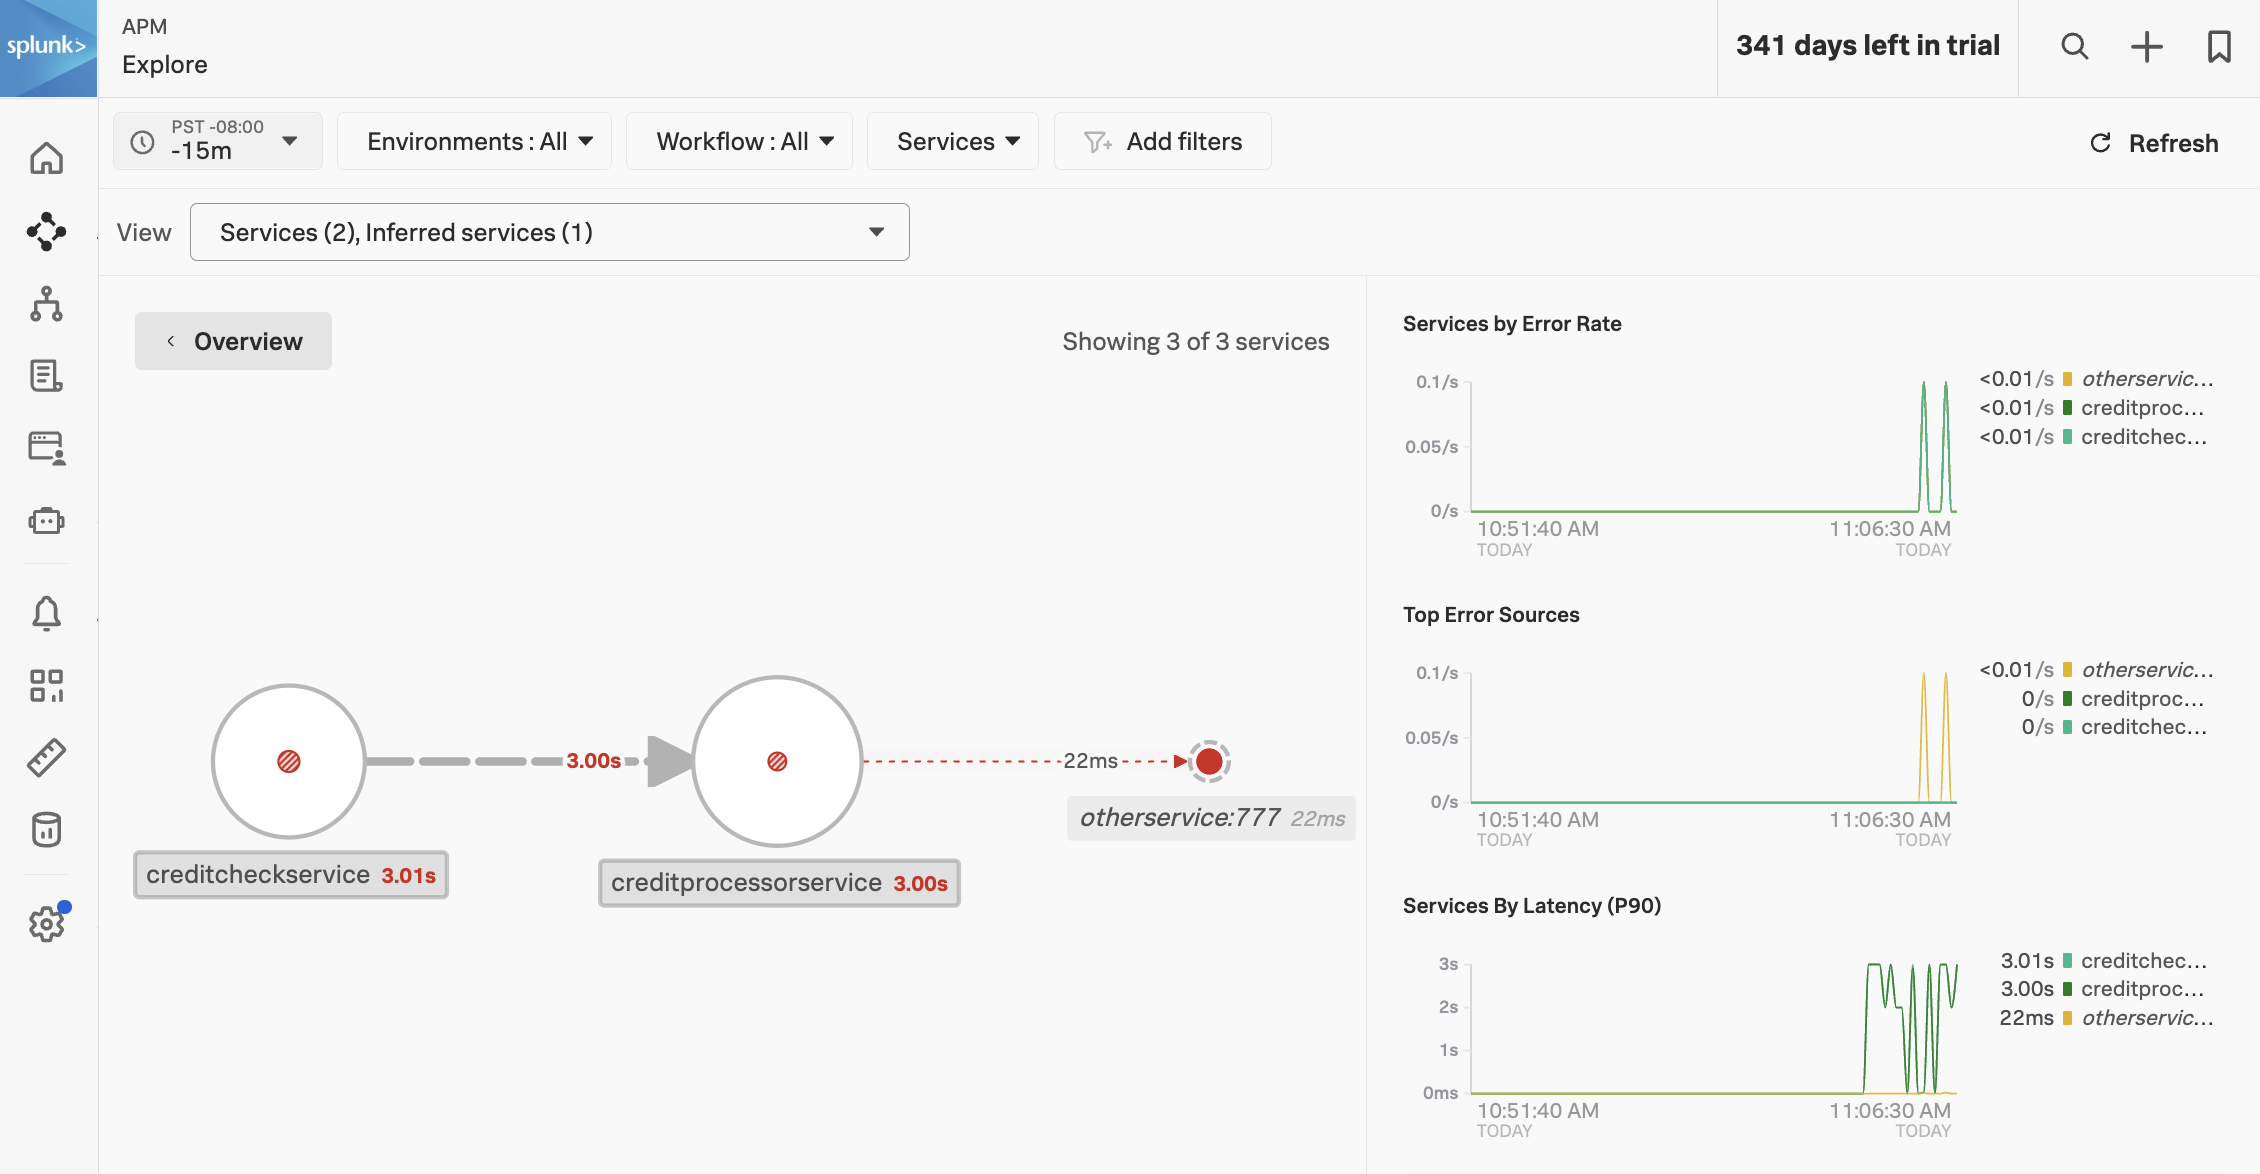
Click on Explore on the right-hand side to view the service map. We can see that the creditcheckservice makes calls to the creditprocessorservice, with an average response time of at least 3 seconds:
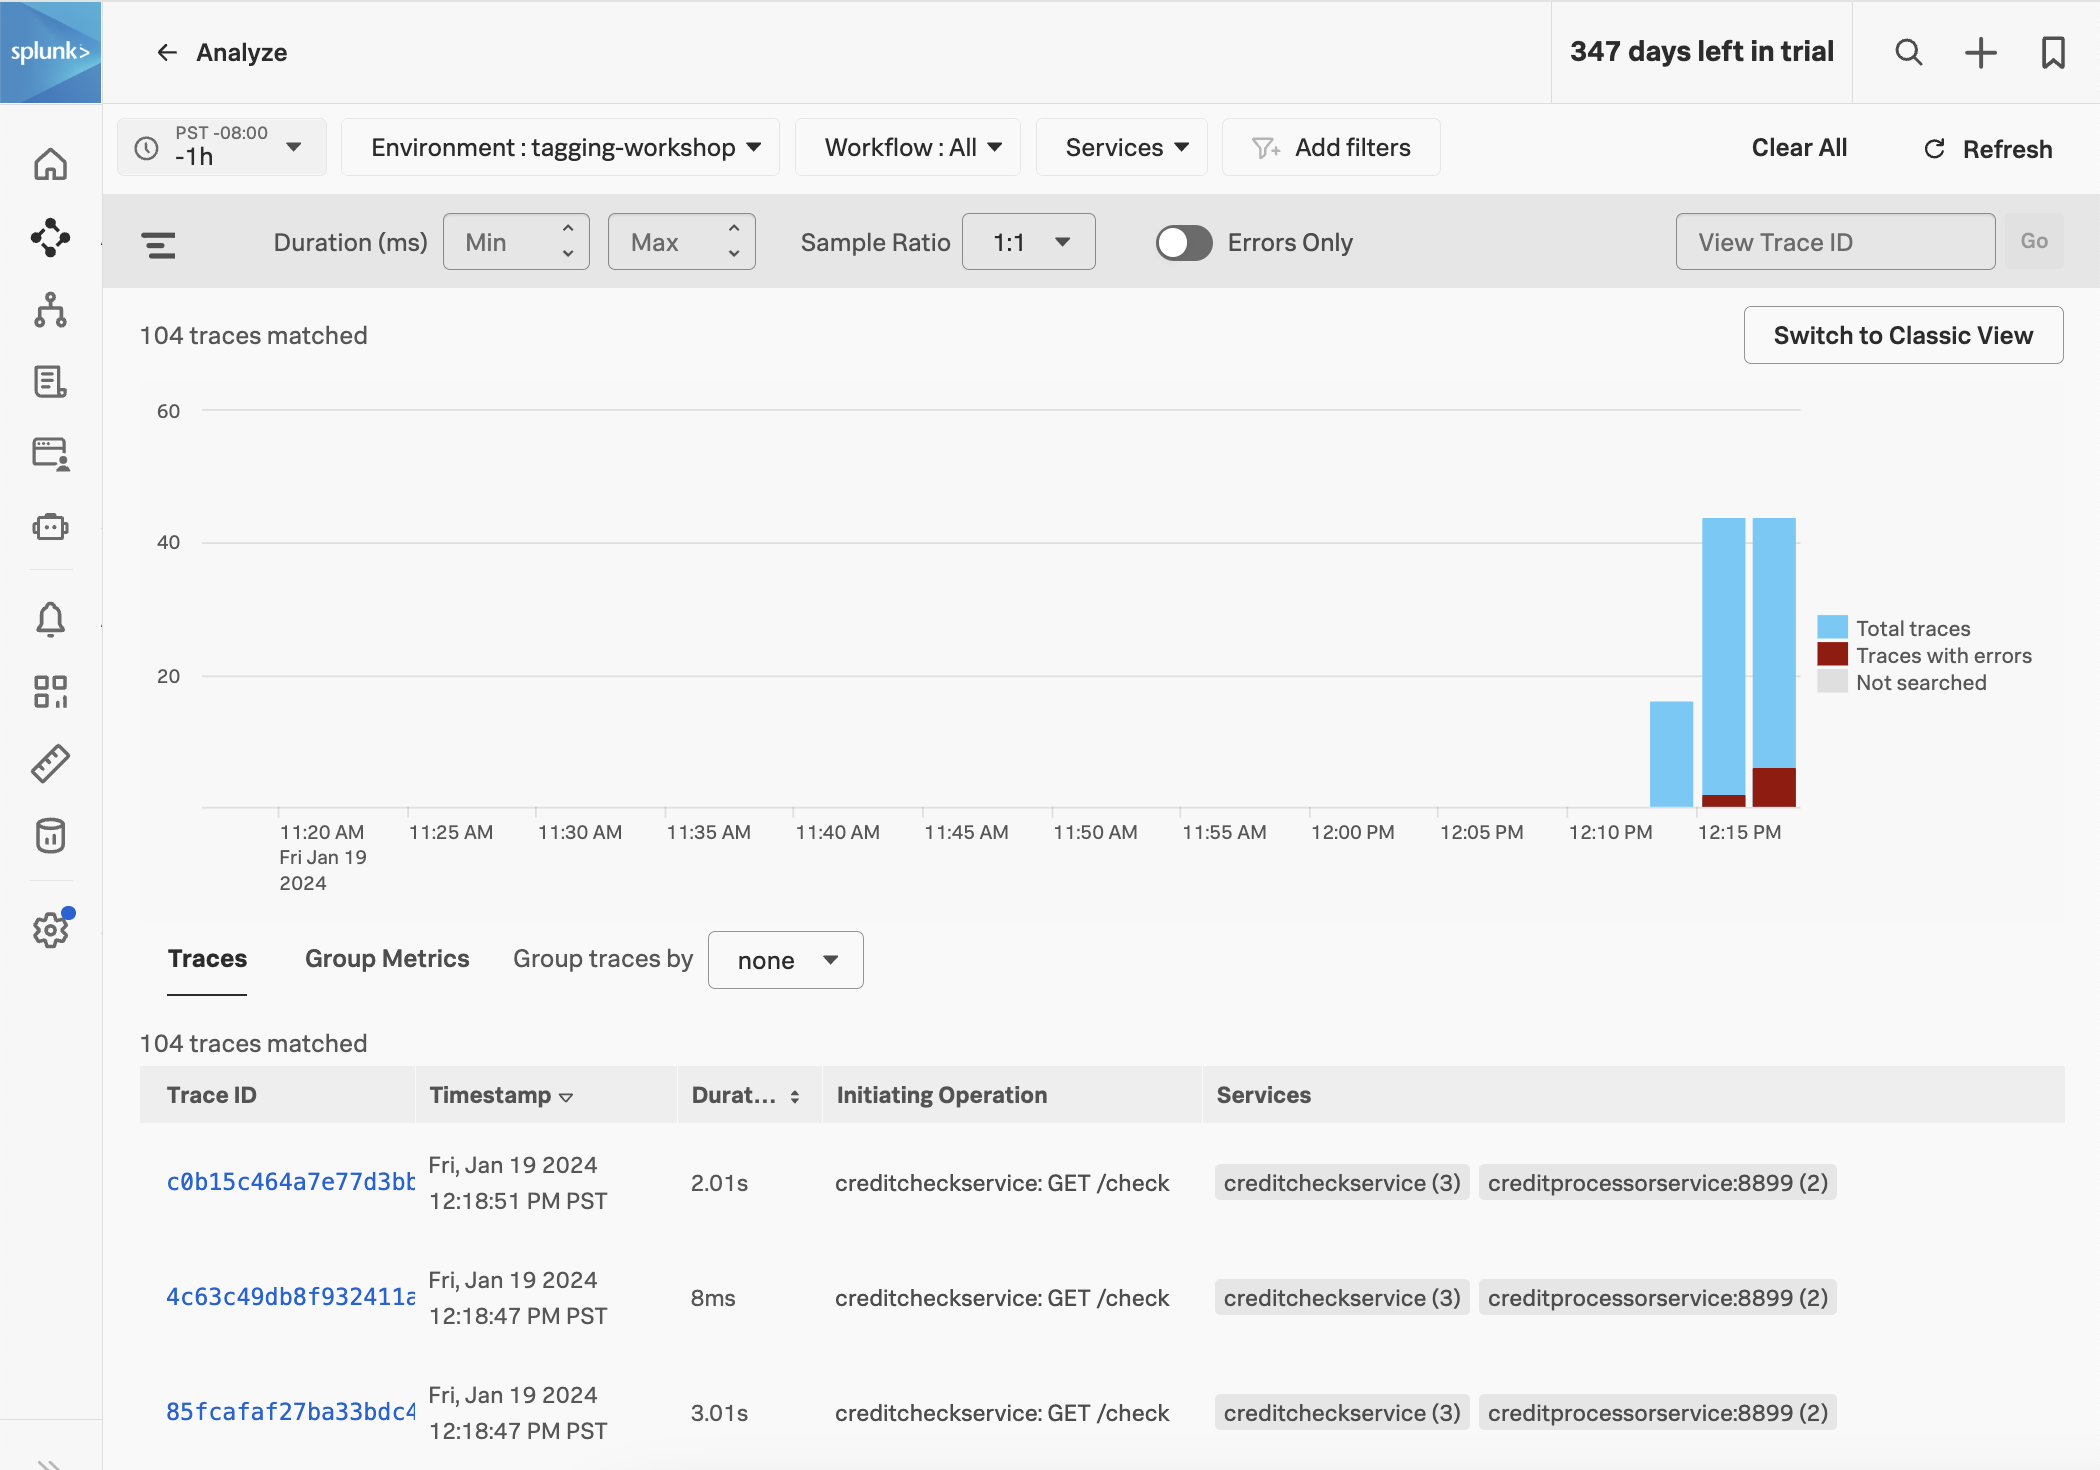
Next, click on Traces on the right-hand side to see the traces captured for this application. You’ll see that some traces run relatively fast (i.e. just a few milliseconds), whereas others take a few seconds.
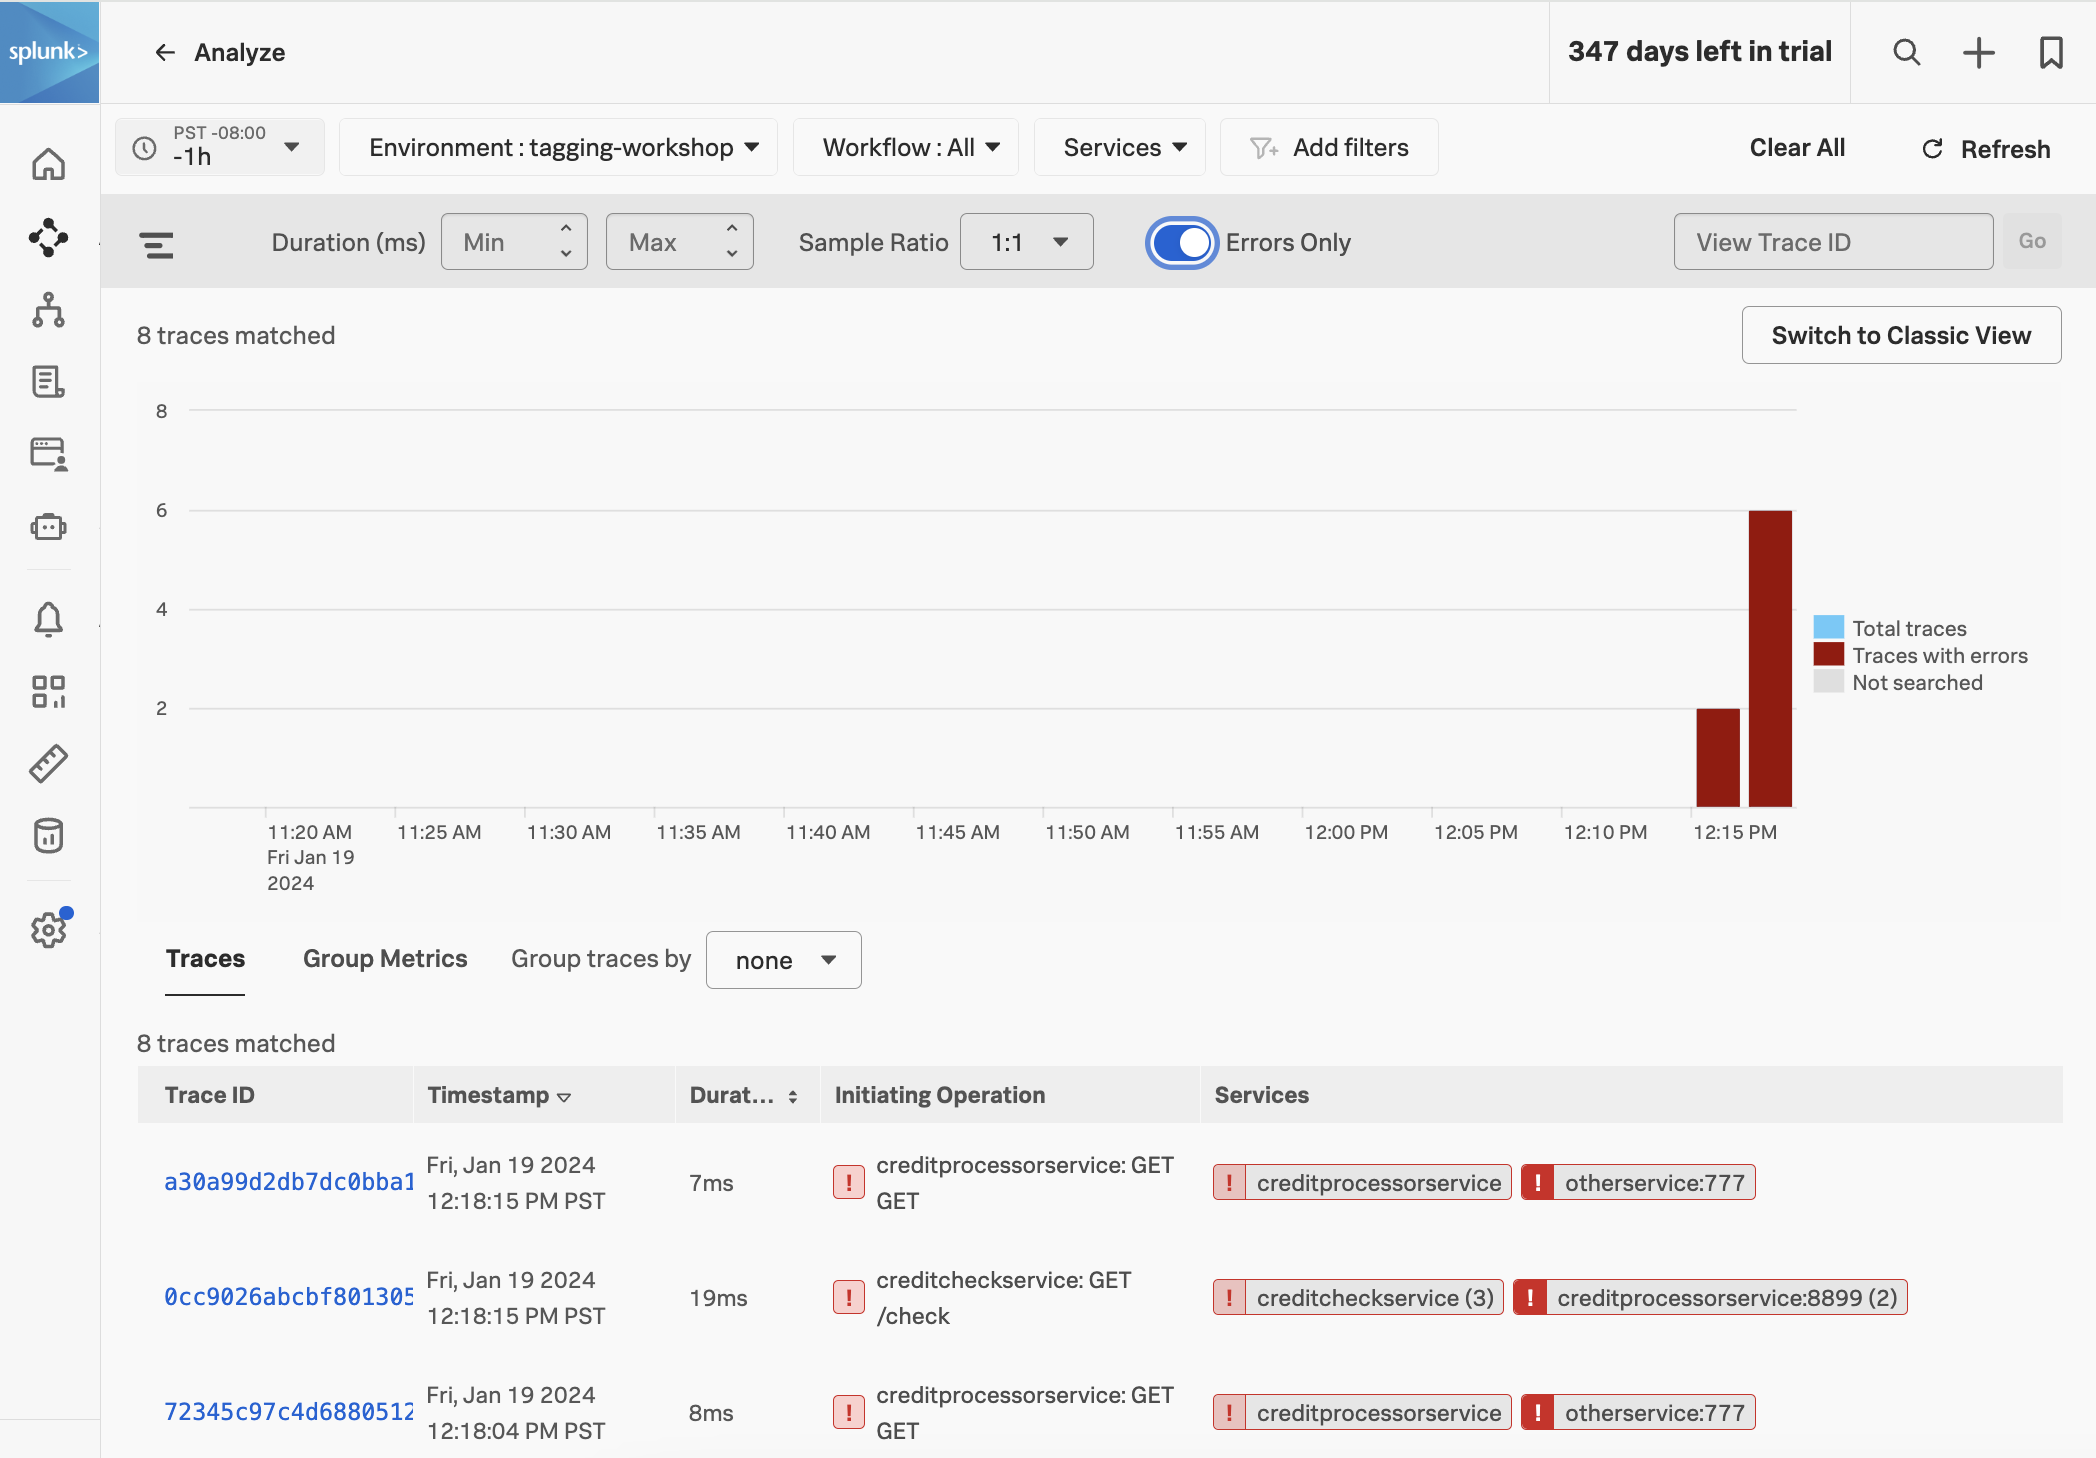
If you toggle Errors only to on, you’ll also notice that some traces have errors:
Toggle Errors only back to off and sort the traces by duration, then click on one of the longer running traces. In this example, the trace took five seconds, and we can see that most of the time was spent calling the /runCreditCheck operation, which is part of the creditprocessorservice.
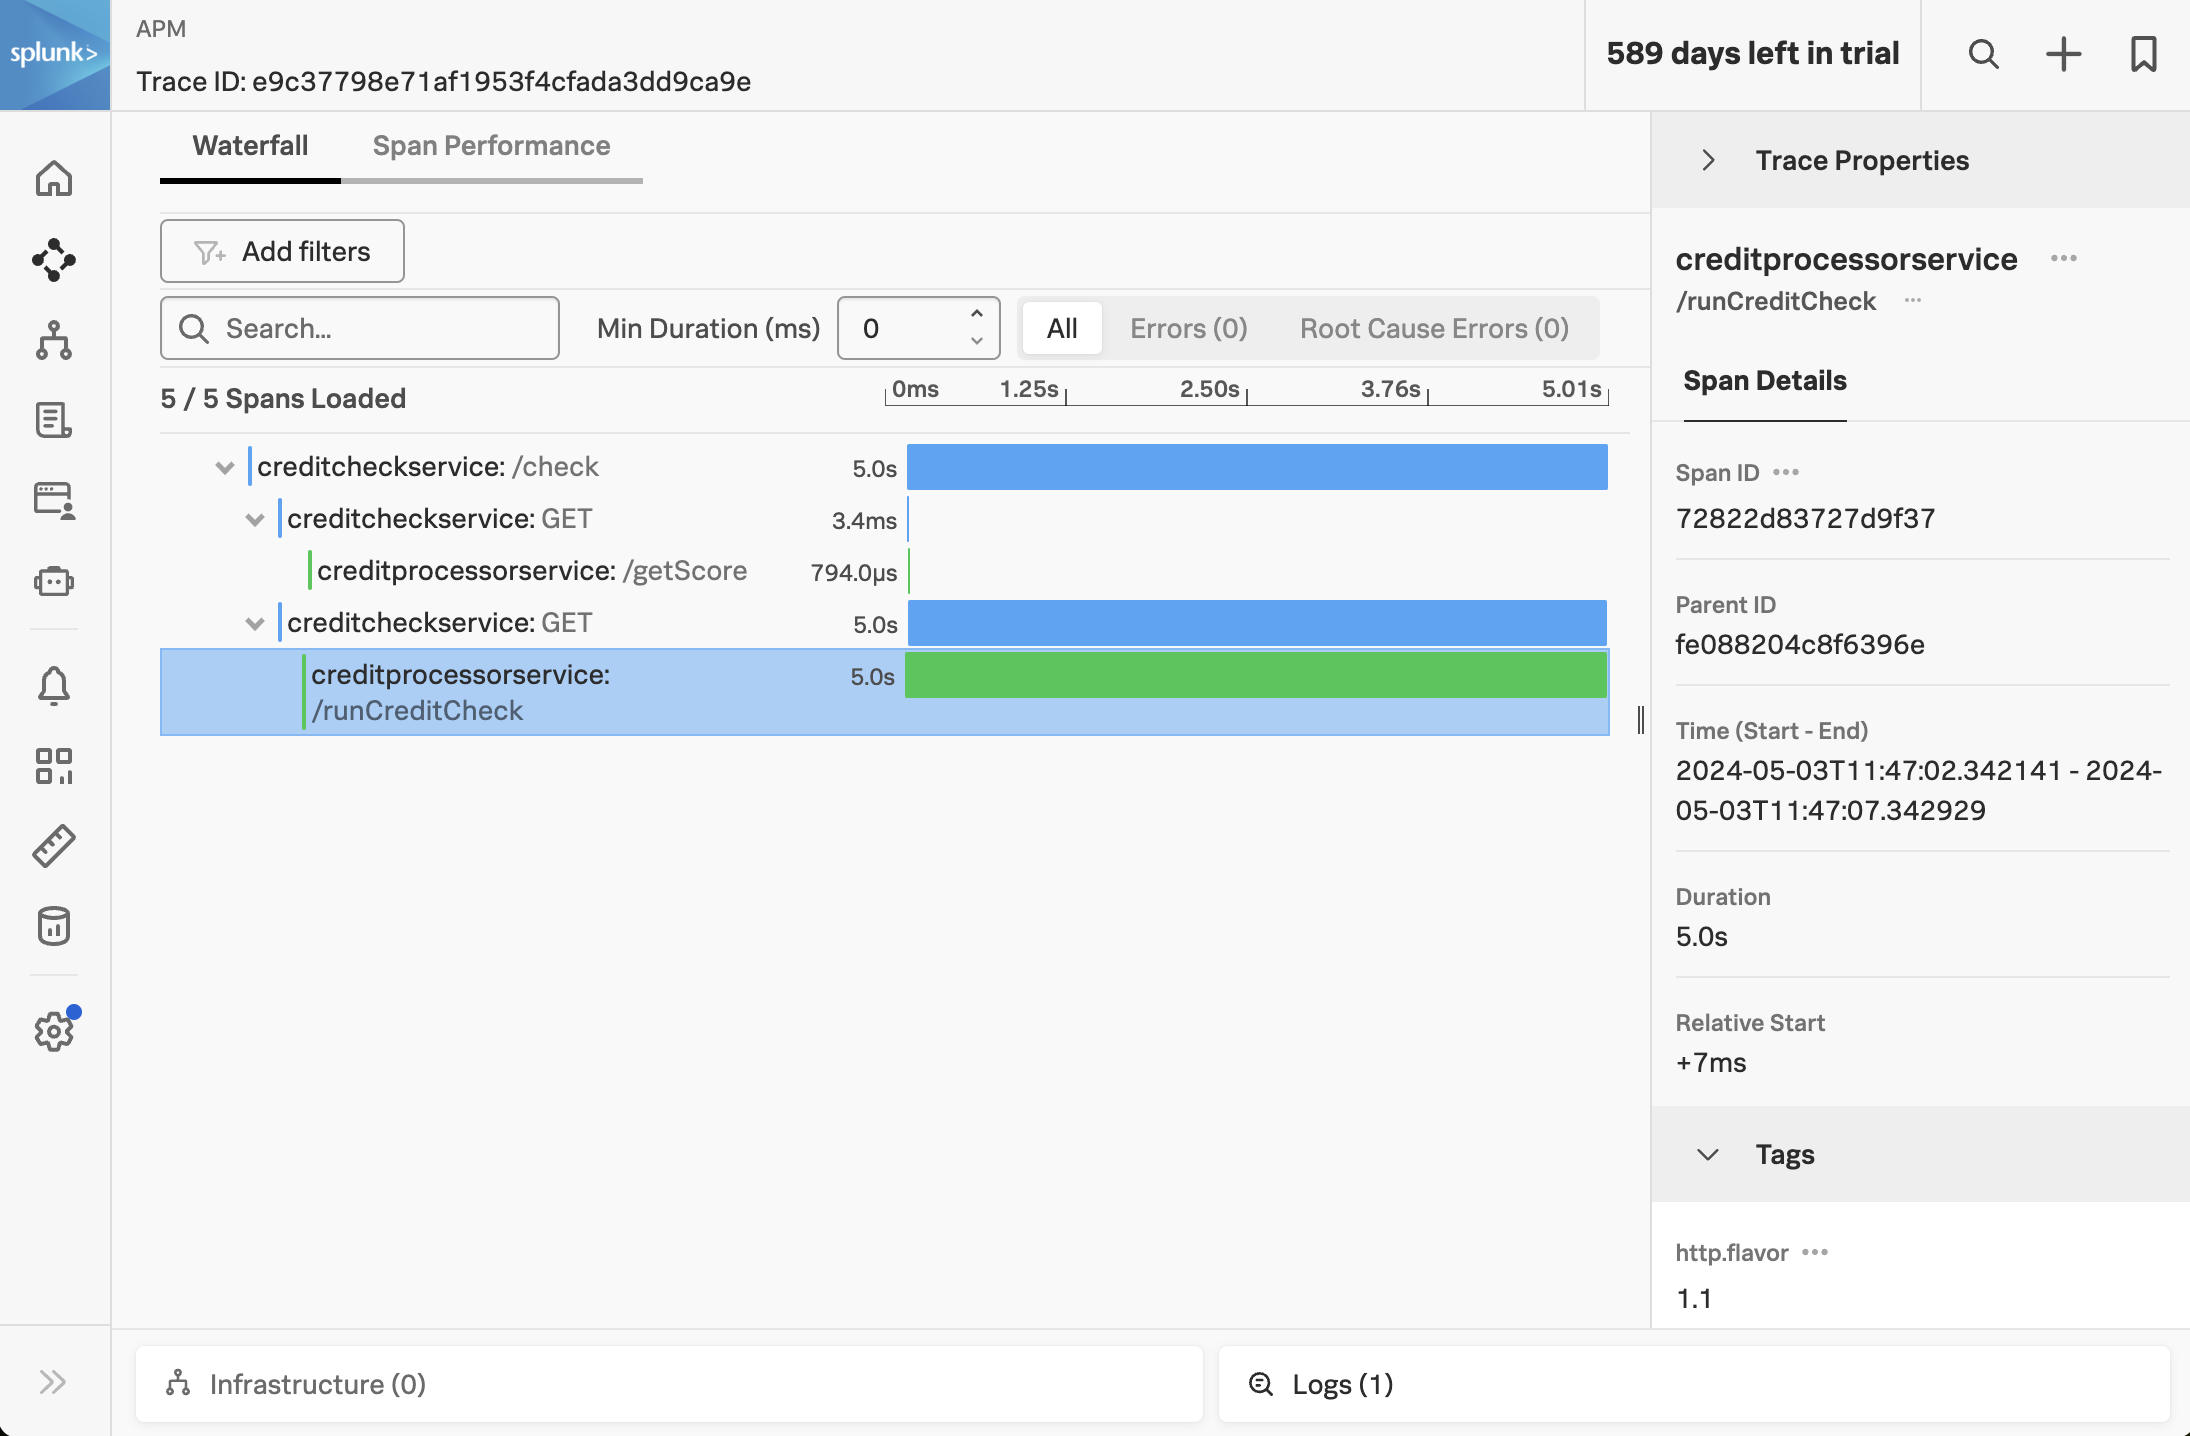
Currently, we don’t have enough details in our traces to understand why some requests finish in a few milliseconds, and others take several seconds. To provide the best possible customer experience, this will be critical for us to understand.
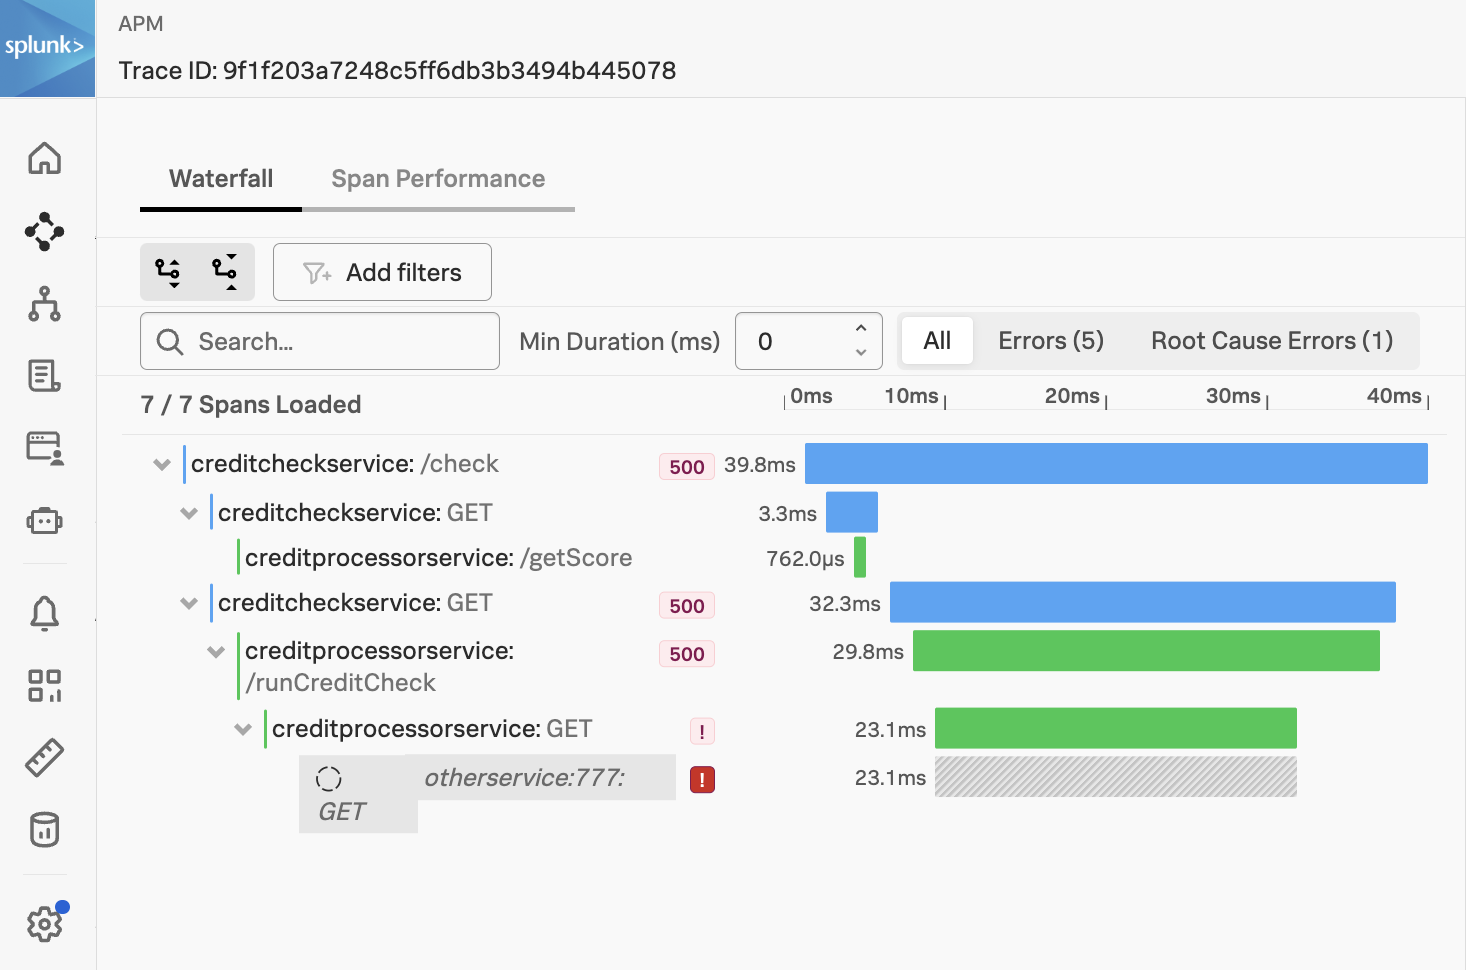
We also don’t have enough information to understand why some requests result in errors, and others don’t. For example, if we look at one of the error traces, we can see that the error occurs when the creditprocessorservice attempts to call another service named otherservice. But why do some requests results in a call to otherservice, and others don’t?
We’ll explore these questions and more in the workshop.