Explore Trace Data
5 minutesNow that we’ve captured several tags from our application, let’s explore some of the trace data we’ve captured that include this additional context, and see if we can identify what’s causing a poor user experience in some cases.
Use Trace Analyzer
Navigate to APM, then select Traces. This takes us to the Trace Analyzer, where we can add filters to search for traces of interest. For example, we can filter on traces where the credit score starts with 7:
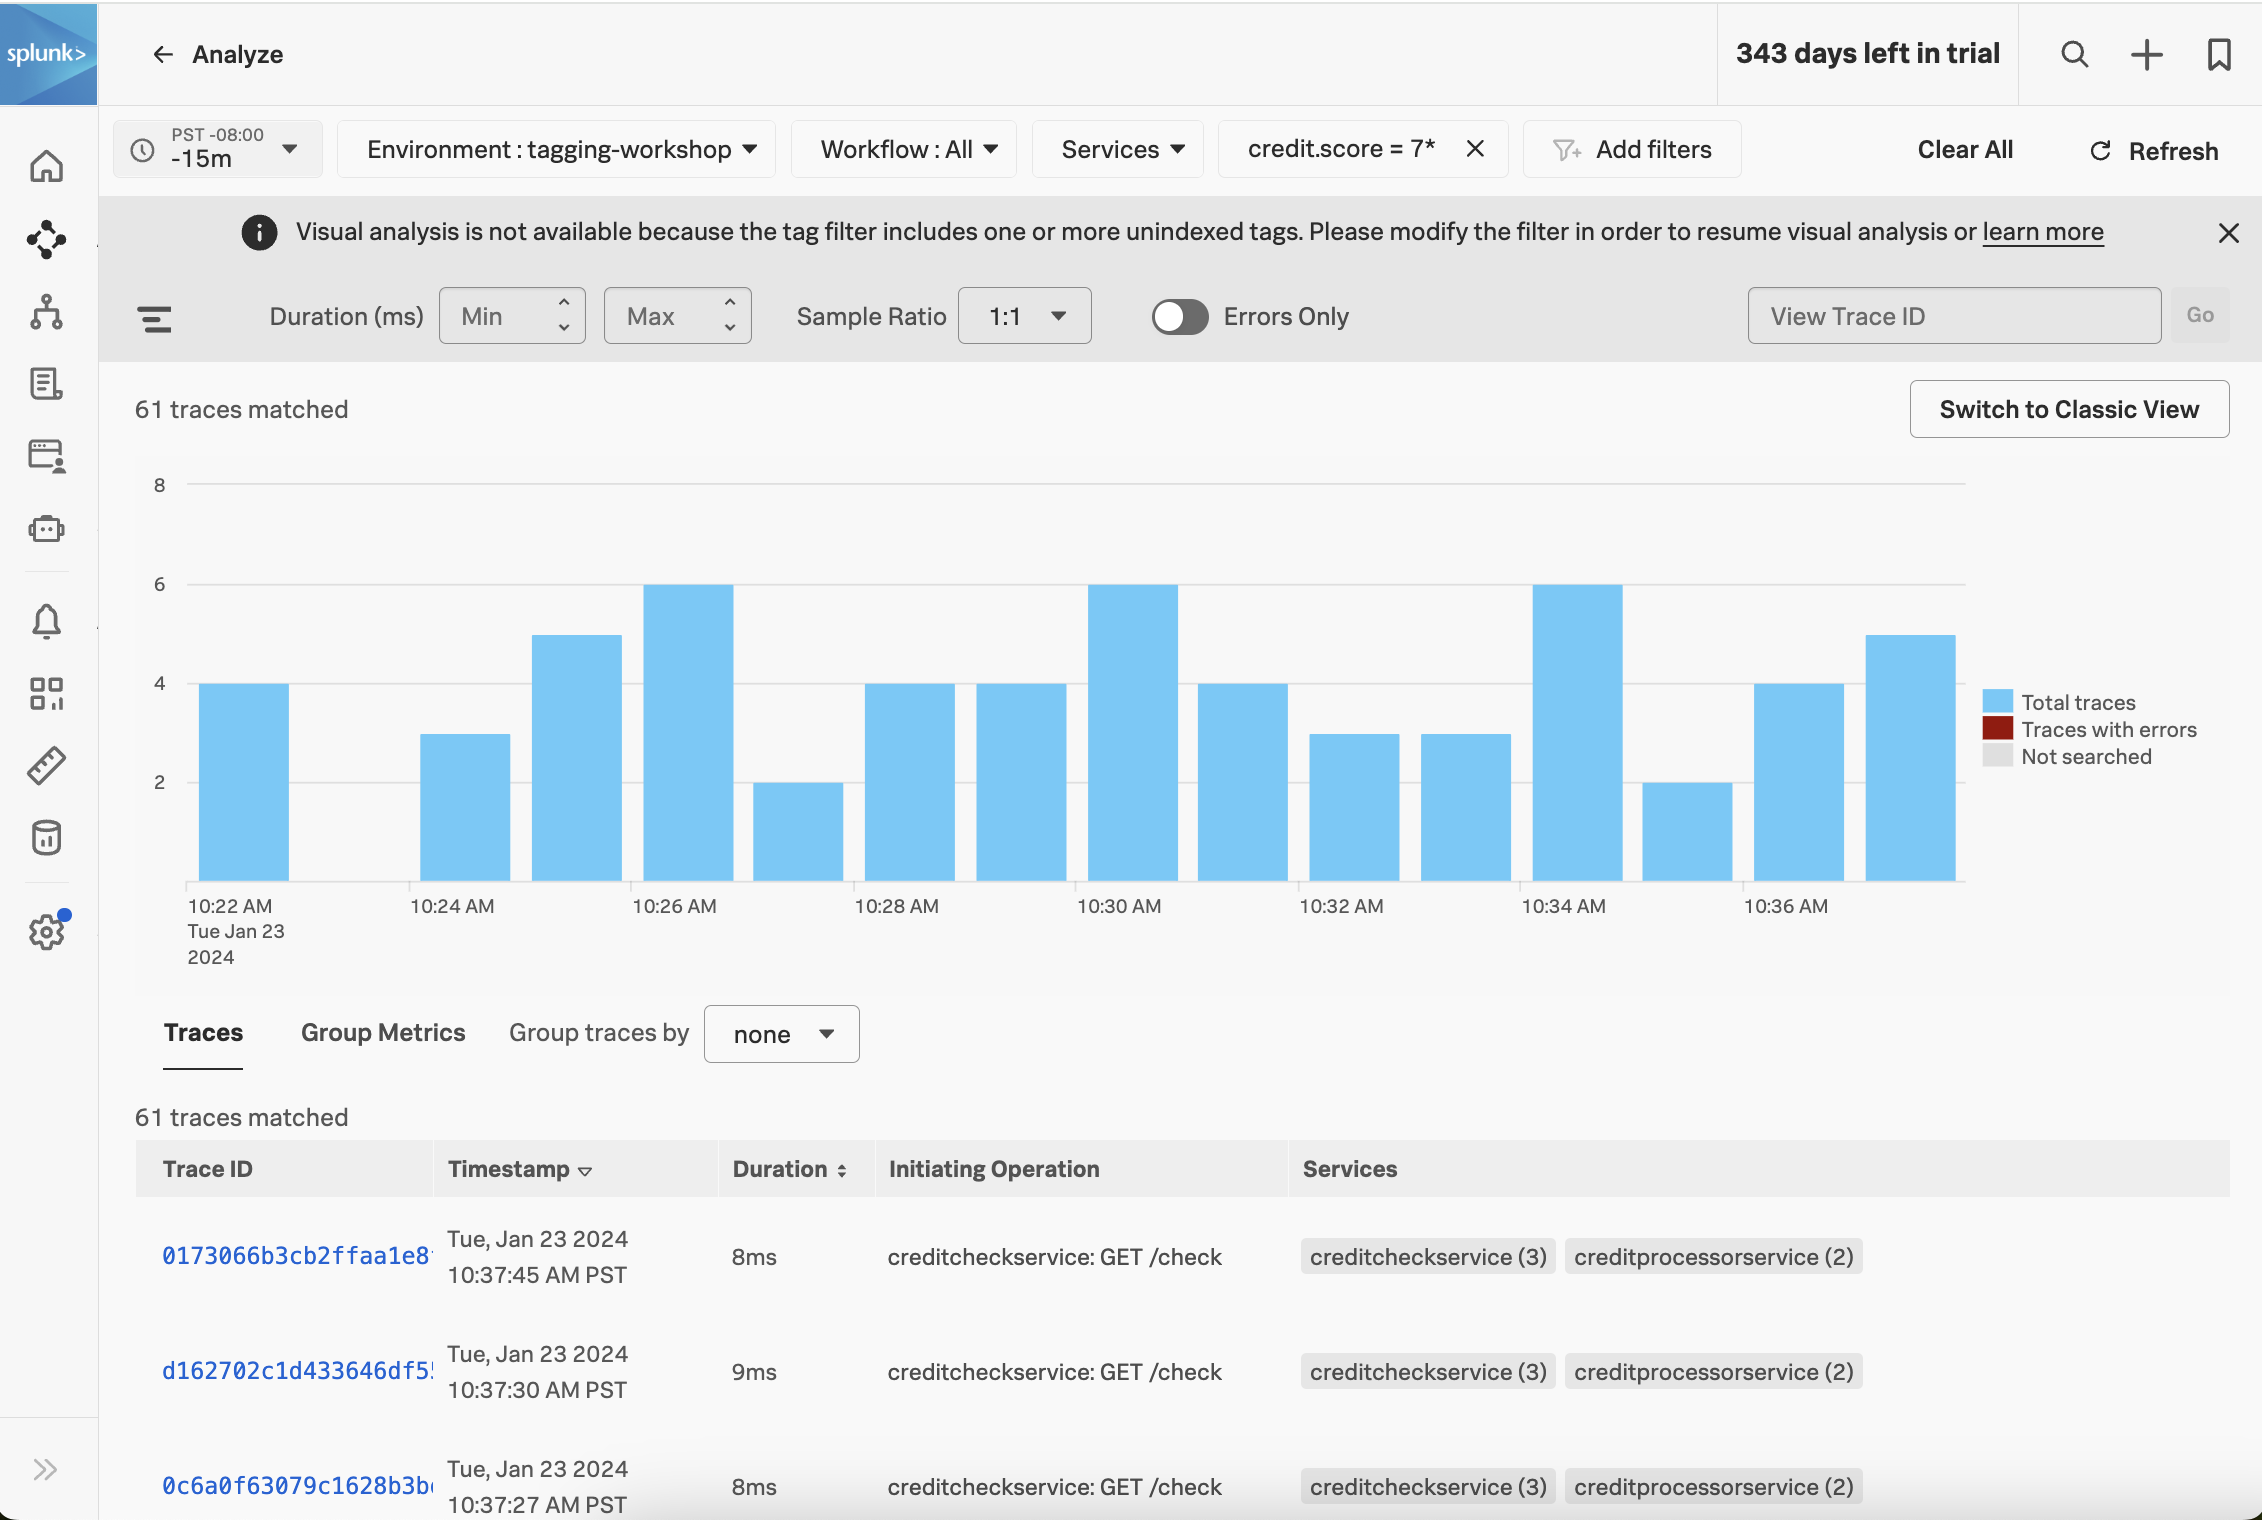
If you load one of these traces, you’ll see that the credit score indeed starts with seven.
We can apply similar filters for the customer number, credit score category, and credit score result.
Explore Traces With Errors
Let’s remove the credit score filter and toggle Errors only to on, which results in a list of only those traces where an error occurred:
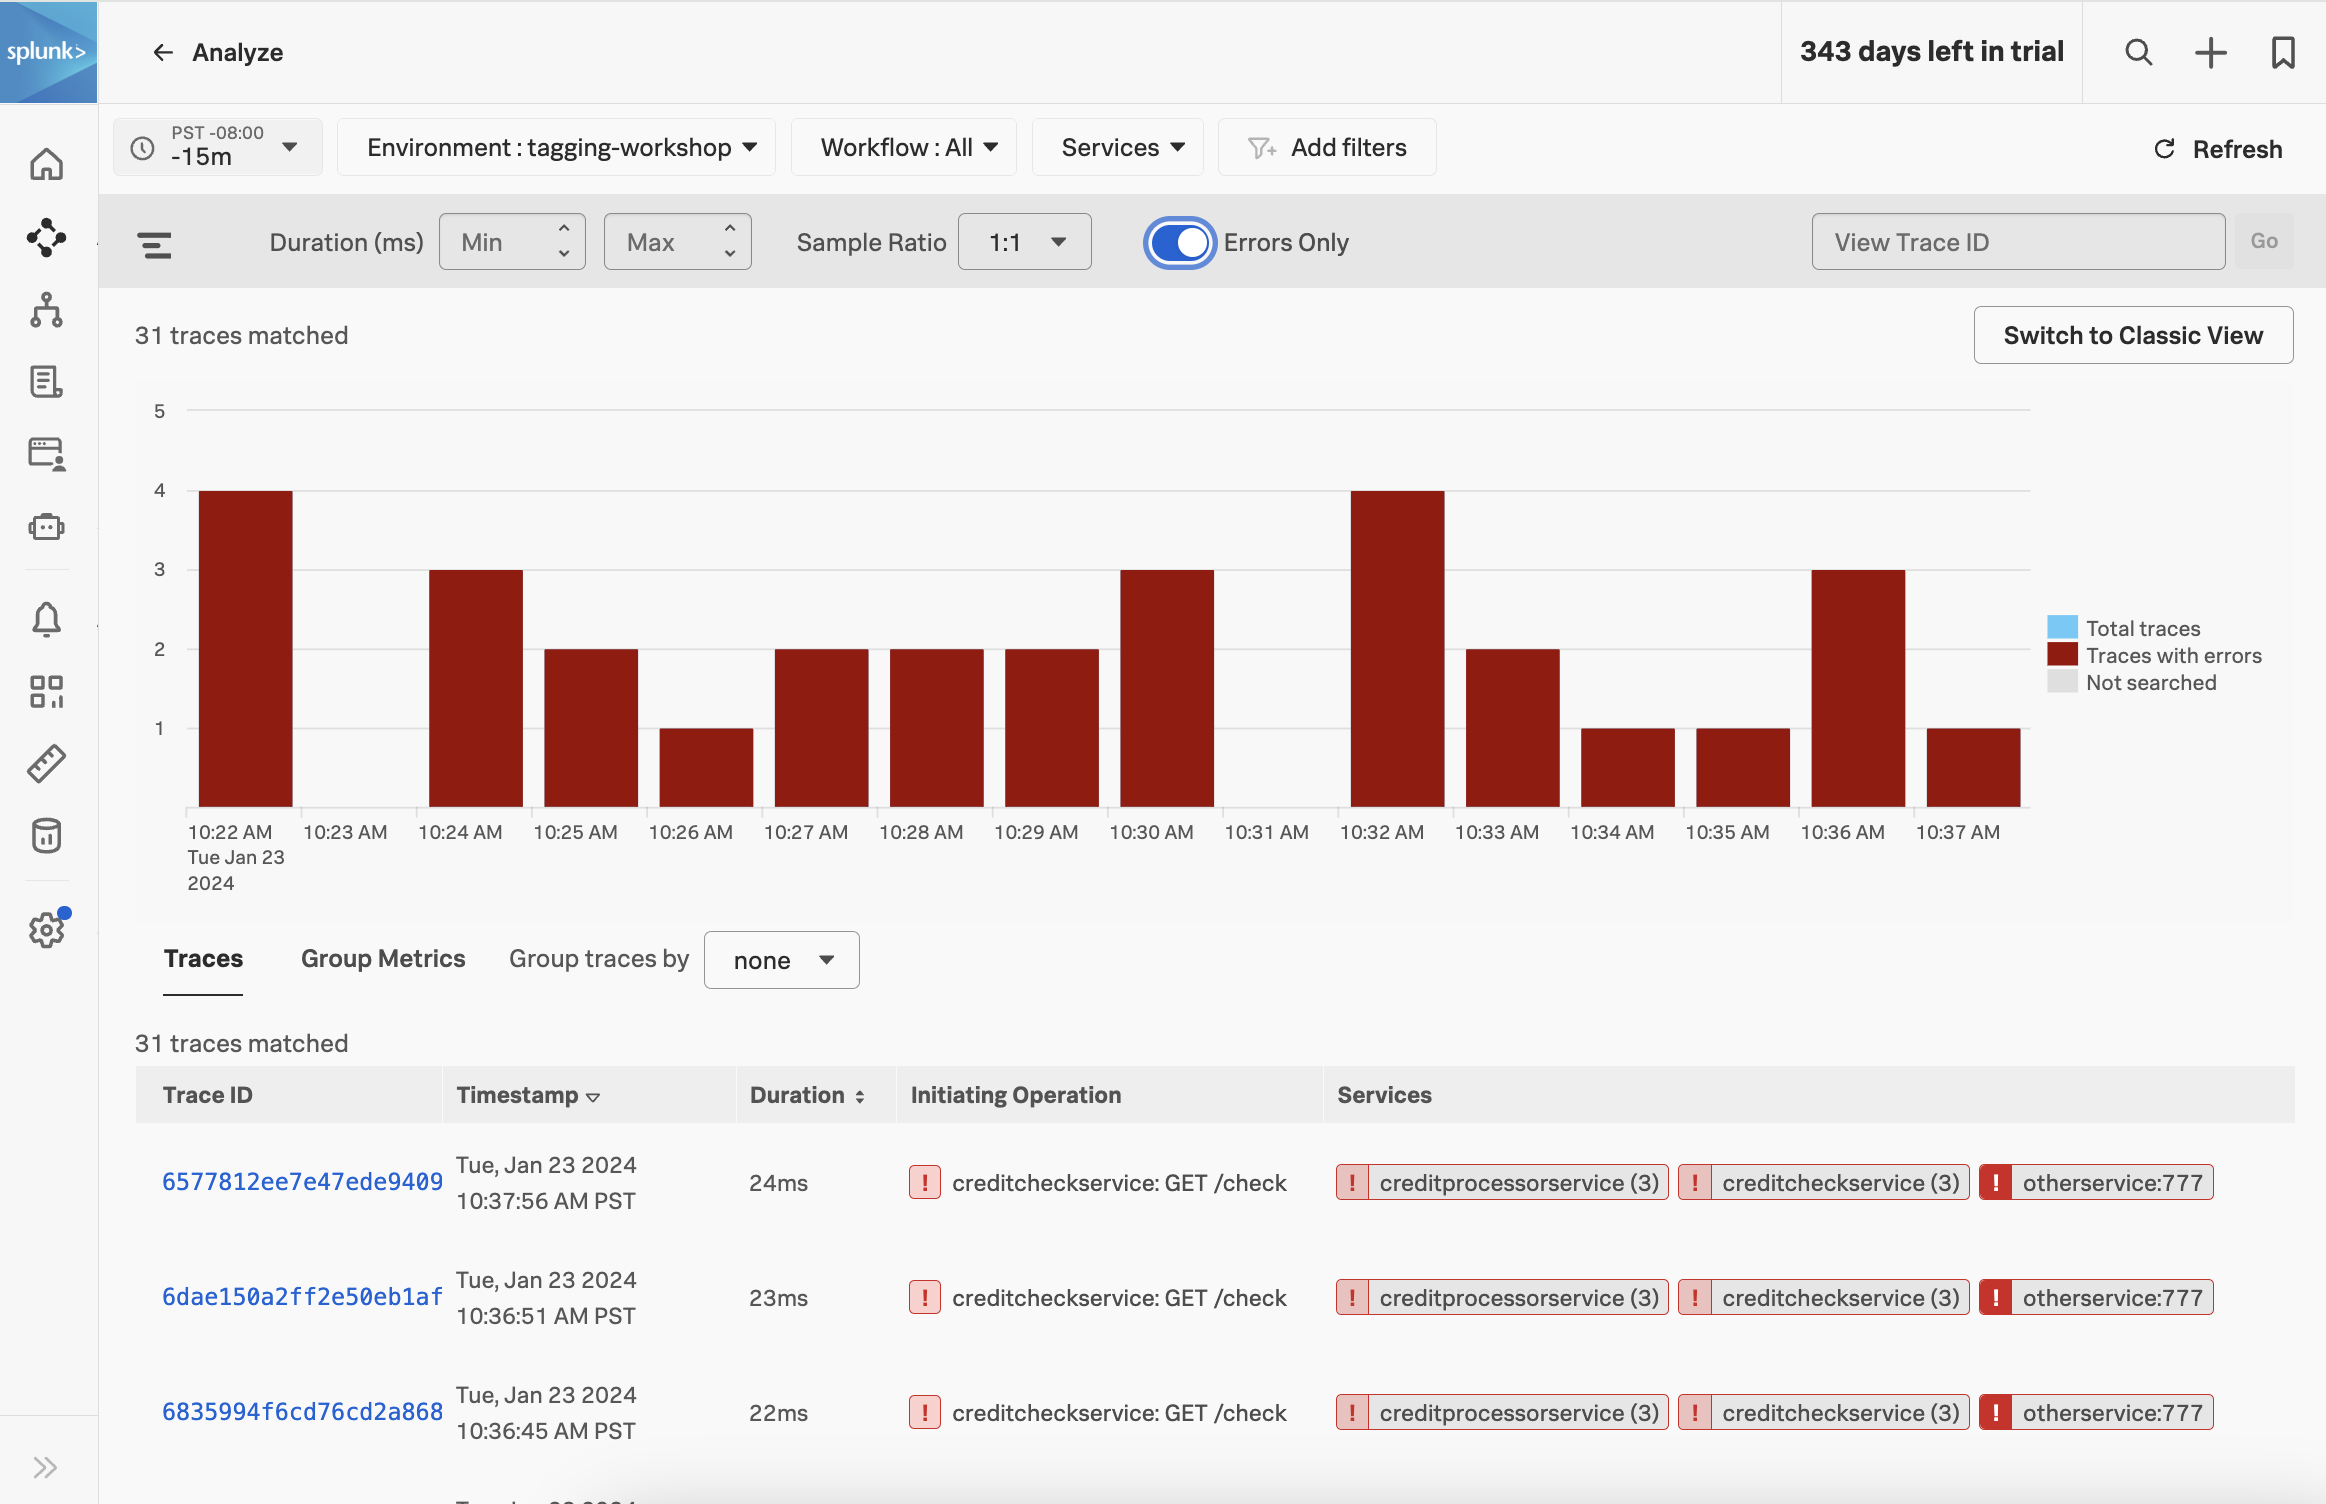
Click on a few of these traces, and look at the tags we captured. Do you notice any patterns?
Next, toggle Errors only to off, and sort traces by duration. Look at a few of the slowest running traces, and compare them to the fastest running traces. Do you notice any patterns?
If you found a pattern that explains the slow performance and errors - great job! But keep in mind that this is a difficult way to troubleshoot, as it requires you to look through many traces and mentally keep track of what you saw, so you can identify a pattern.
Thankfully, Splunk Observability Cloud provides a more efficient way to do this, which we’ll explore next.