Use Tags with Alerting and Dashboards
10 minutesEarlier, we created a Troubleshooting Metric Set on the credit.score.category tag, which allowed us to use Tag Spotlight with that tag and identify a pattern to explain why some users received a poor experience.
In this section of the workshop, we’ll explore a related concept: Monitoring MetricSets.
What are Monitoring MetricSets?
Monitoring MetricSets go beyond troubleshooting and allow us to use tags for alerting and dashboards.
Create a Monitoring MetricSet
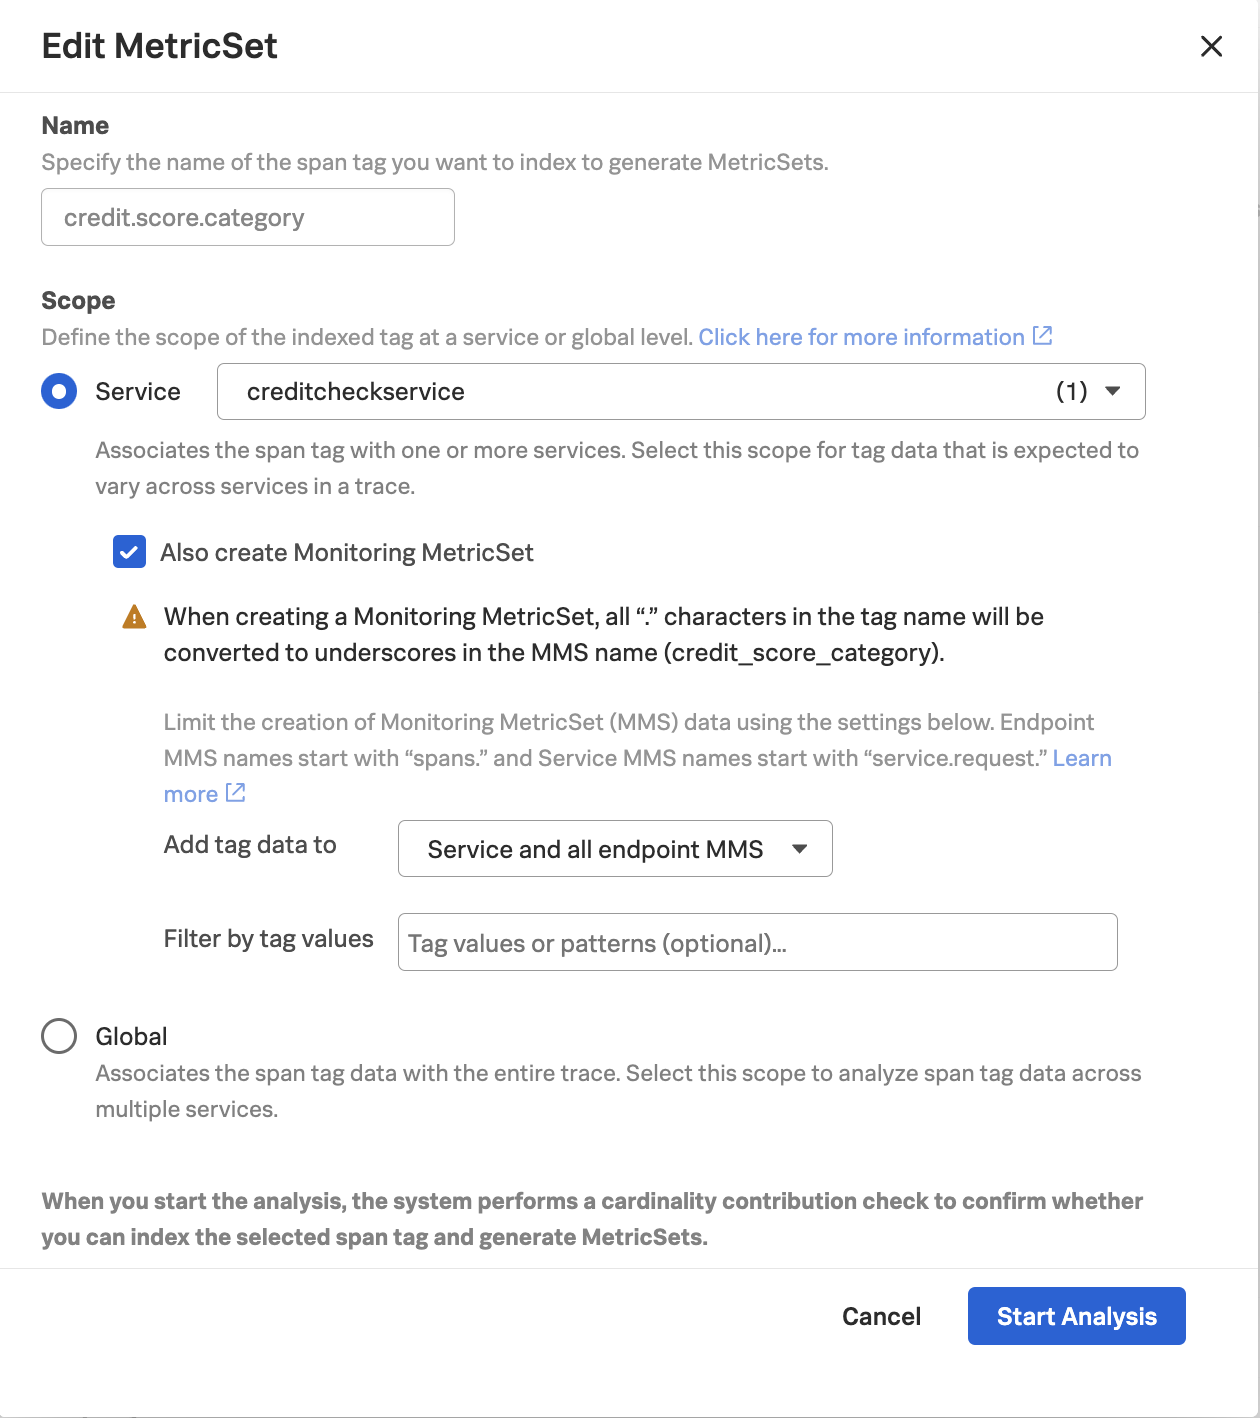
Let’s navigate to Settings -> APM MetricSets, and click the edit button (i.e. the little pencil) beside the MetricSet for credit.score.category.
Check the box beside Also create Monitoring MetricSet then click Start Analysis (note: your workshop instructor will do this for you)
The credit.score.category tag appears again as a Pending MetricSet. After a few moments, a checkmark should appear. Click this checkmark to enable the Pending MetricSet.
Using Monitoring MetricSets
Next, let’s explore how we can use this Monitoring MetricSet.
Dashboards
Navigate to Metric Finder, then type in the name of the tag, which is credit_score_category (note that the dots in the tag name were replaced by underscores when the MMS was created). You’ll see that multiple metrics include this tag as a dimension:
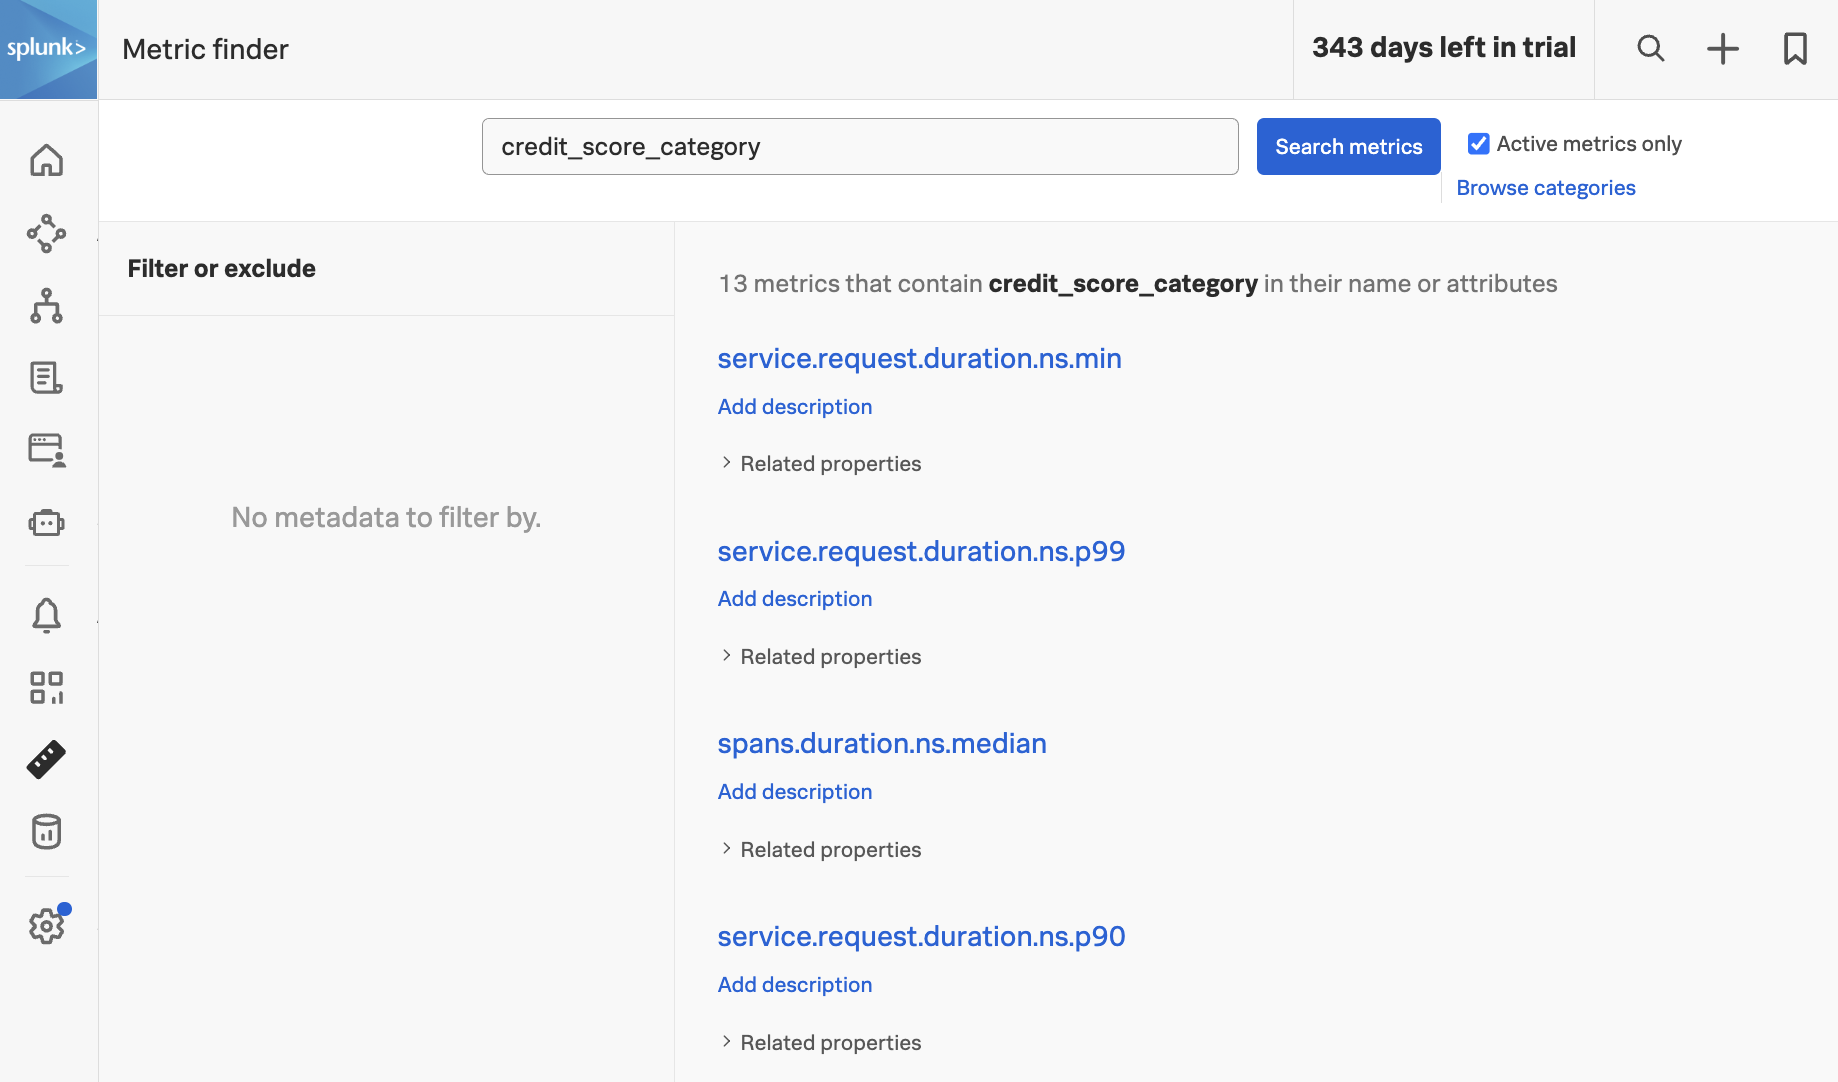
By default, Splunk Observability Cloud calculates several metrics using the trace data it receives. See Learn about MetricSets in APM for more details.
By creating an MMS, credit_score_category was added as a dimension to these metrics, which means that this dimension can now be used for alerting and dashboards.
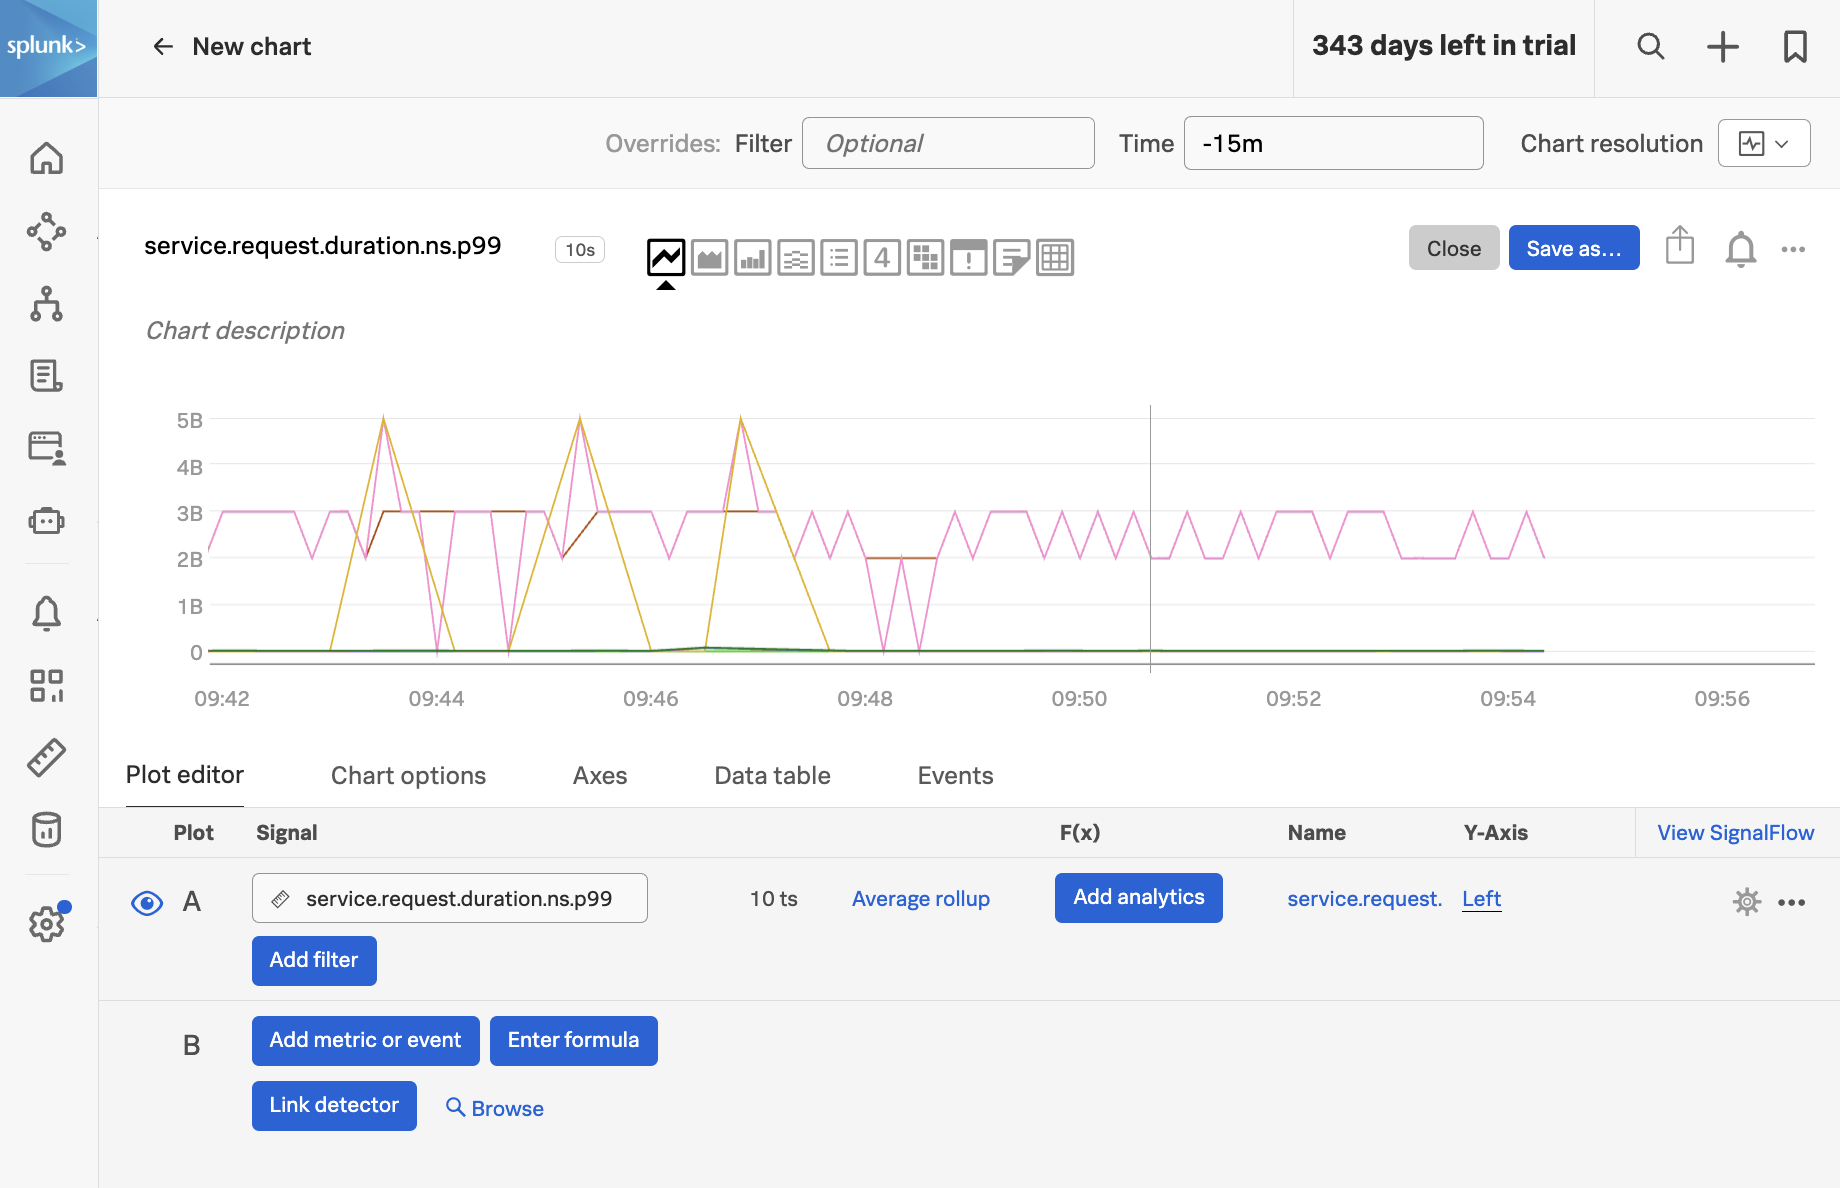
To see how, let’s click on the metric named service.request.duration.ns.p99, which brings up the following chart:
Add filters for sf_environment, sf_service, and sf_dimensionalized. Then set the Extrapolation policy to Last value and the Display units to Nanosecond:
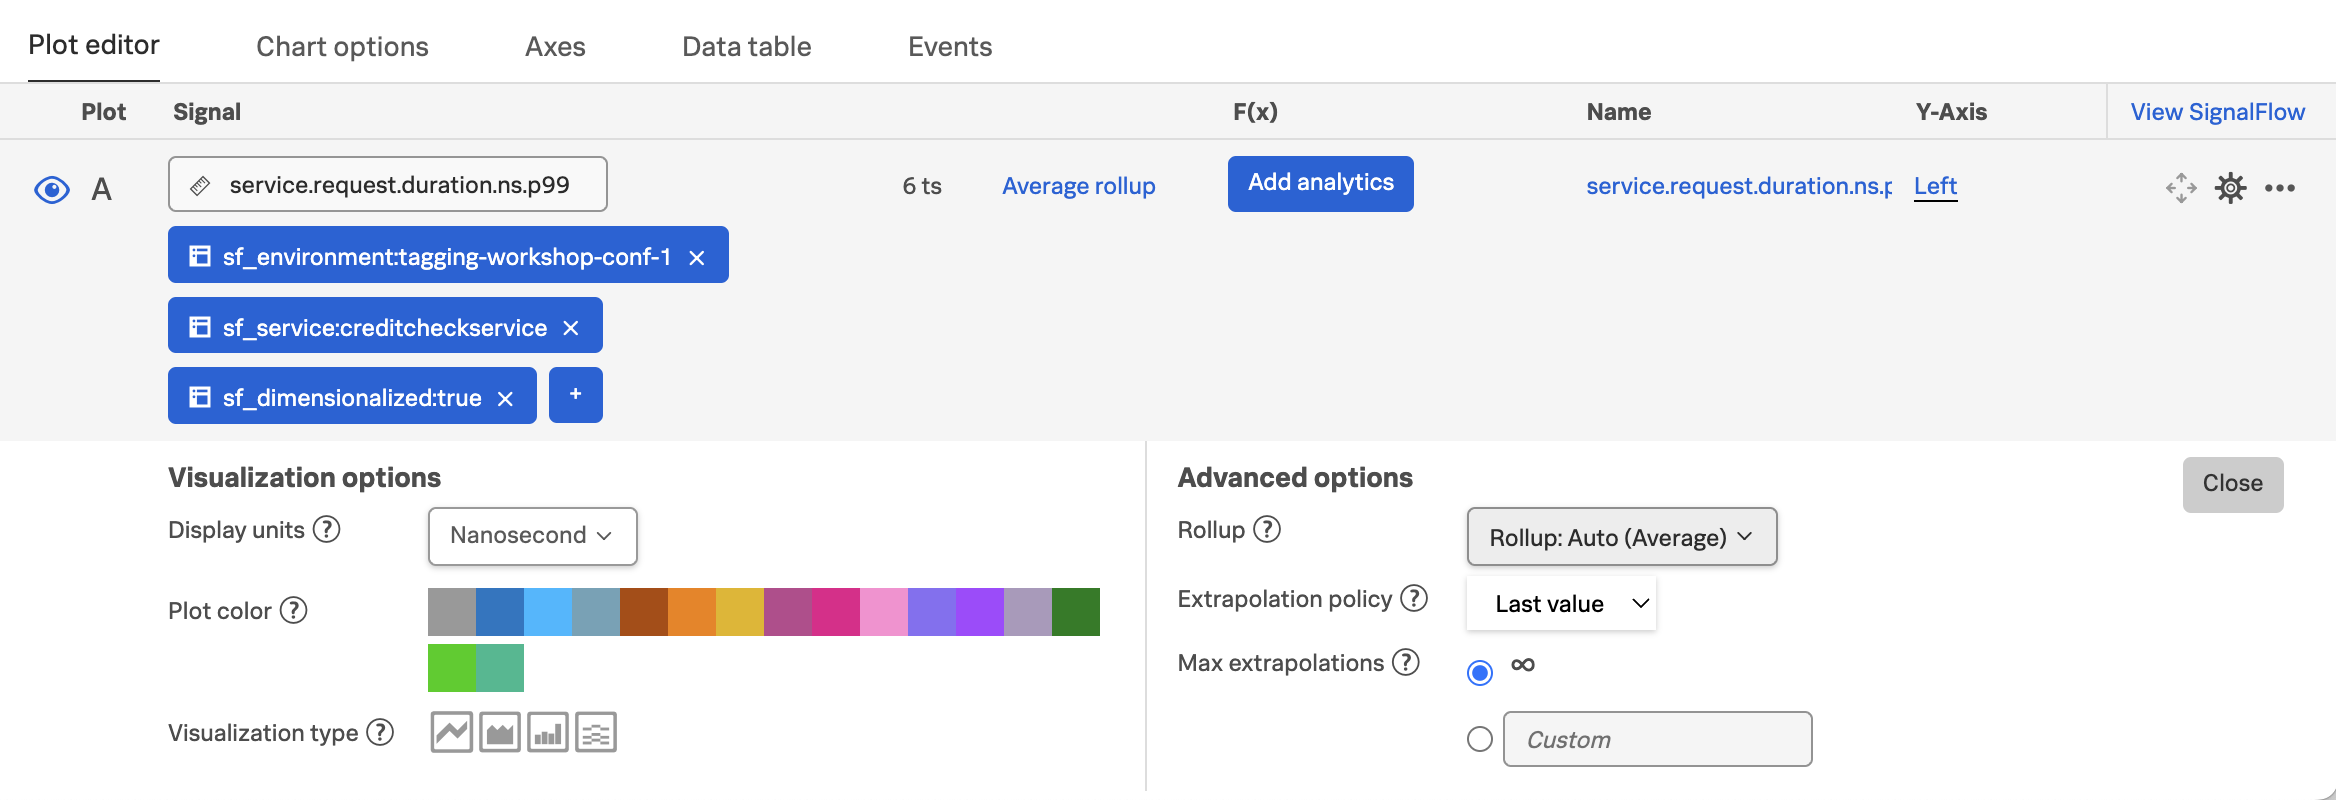
With these settings, the chart allows us to visualize the service request duration by credit score category:
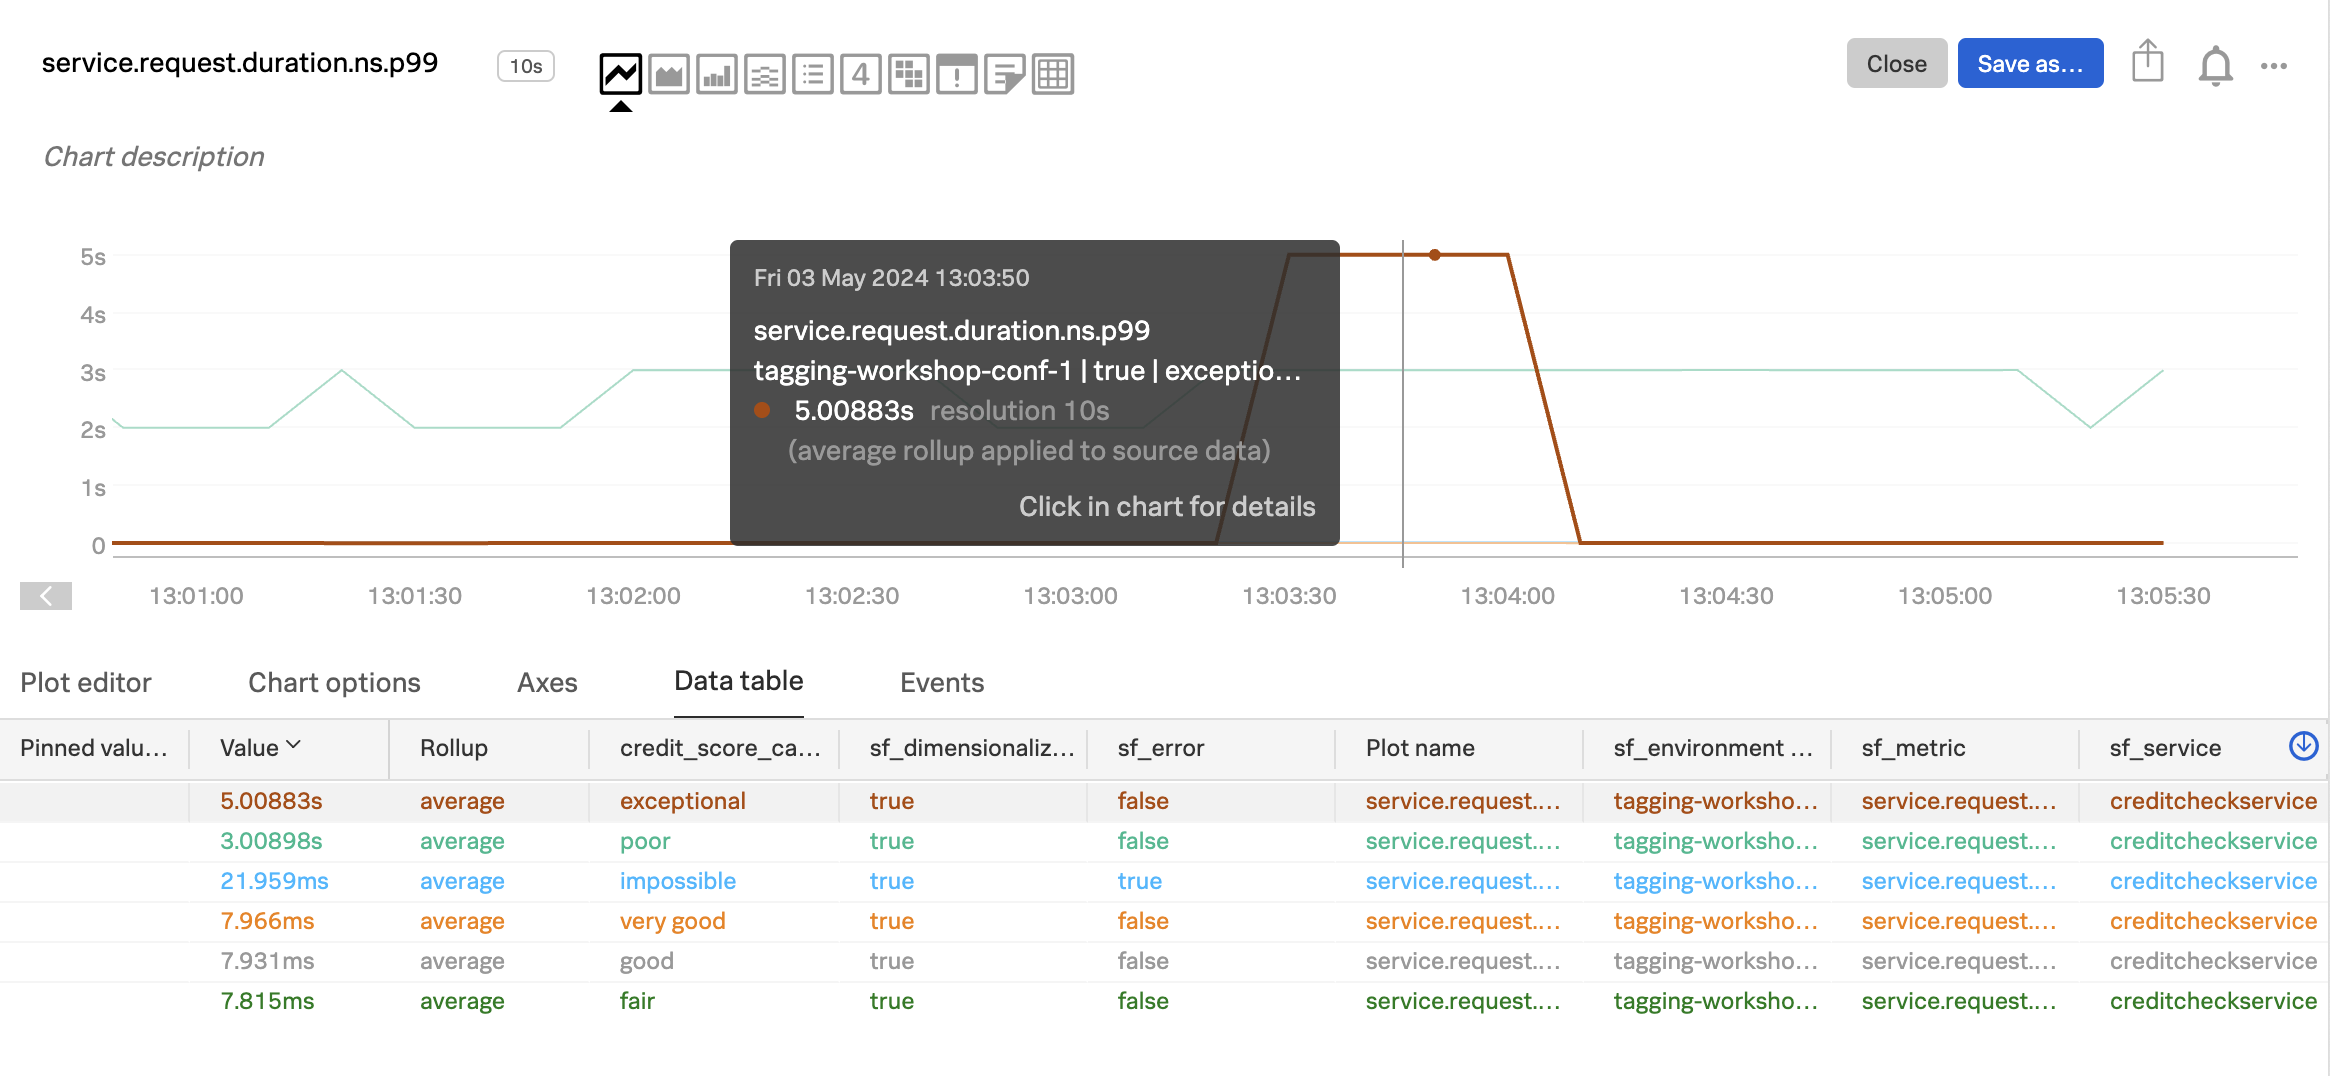
Now we can see the duration by credit score category. In my example, the red line represents the exceptional category, and we can see that the duration for these requests sometimes goes all the way up to 5 seconds.
The orange represents the very good category, and has very fast response times.
The green line represents the poor category, and has response times between 2-3 seconds.
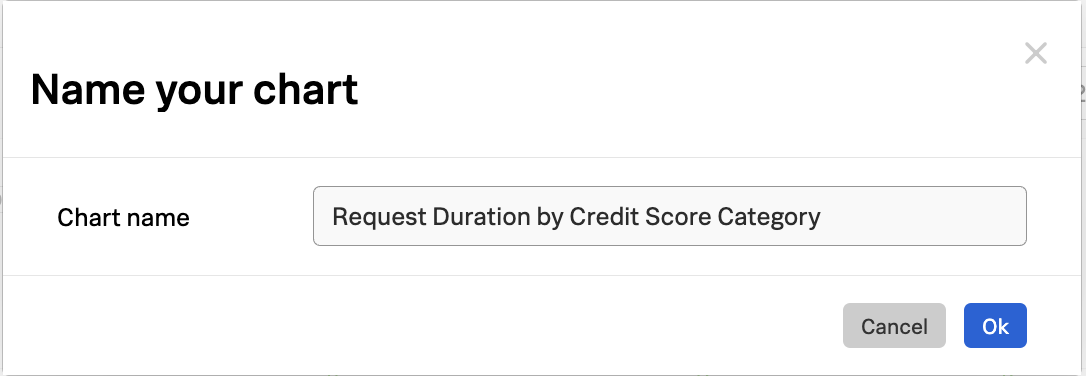
It may be useful to save this chart on a dashboard for future reference. To do this, click on the Save as… button and provide a name for the chart:
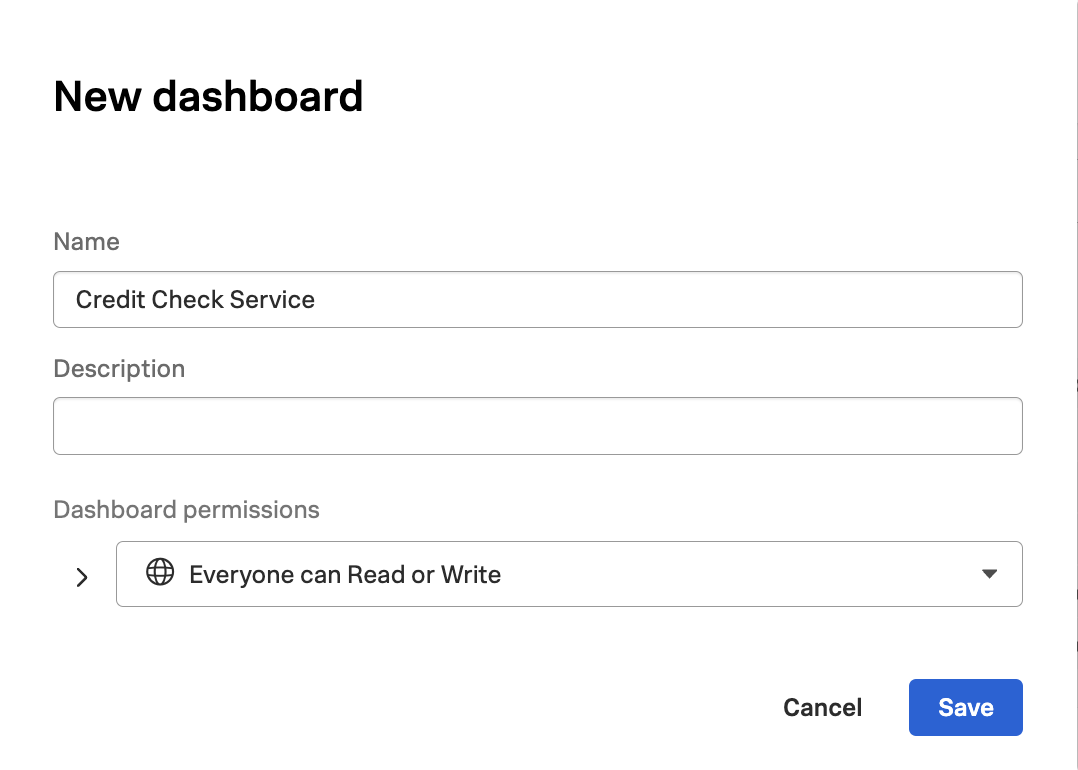
When asked which dashboard to save the chart to, let’s create a new one named Credit Check Service - Your Name (substituting your actual name):
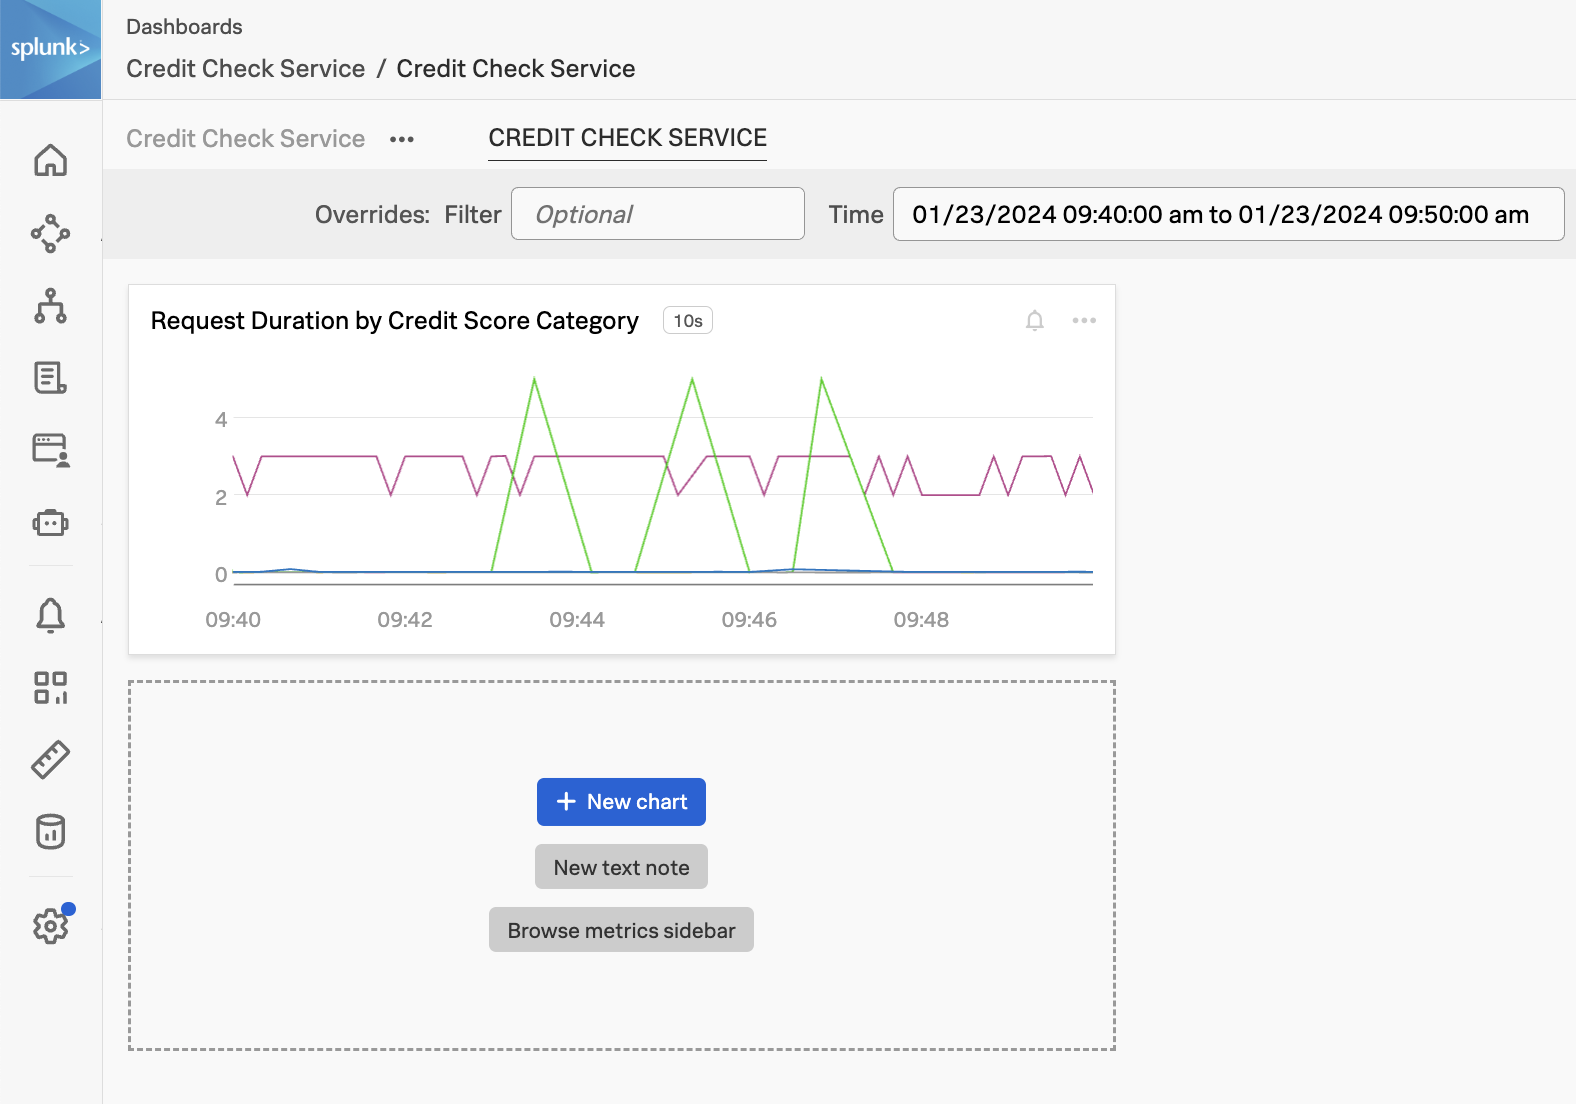
Now we can see the chart on our dashboard, and can add more charts as needed to monitor our credit check service:
Alerts
It’s great that we have a dashboard to monitor the response times of the credit check service by credit score, but we don’t want to stare at a dashboard all day.
Let’s create an alert so we can be notified proactively if customers with exceptional credit scores encounter slow requests.
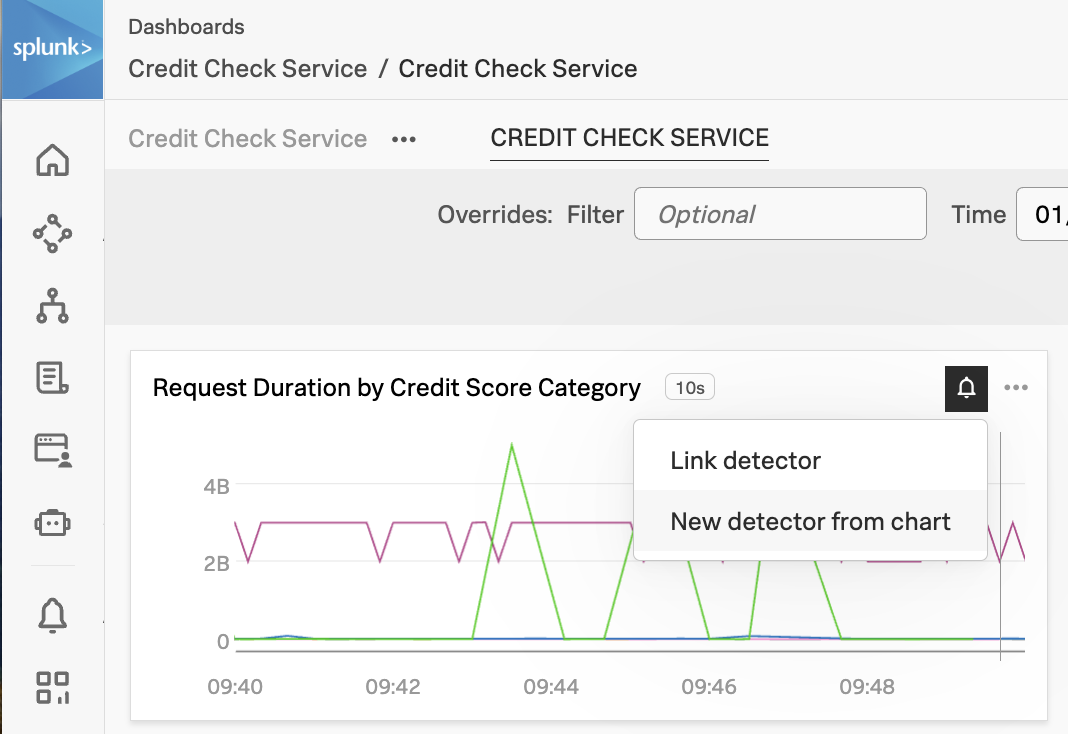
To create this alert, click on the little bell on the top right-hand corner of the chart, then select New detector from chart:
Let’s call the detector Latency by Credit Score Category. Set the environment to your environment name (i.e. tagging-workshop-yourname) then select creditcheckservice as the service. Since we only want to look at performance for customers with exceptional credit scores, add a filter using the credit_score_category dimension and select exceptional:
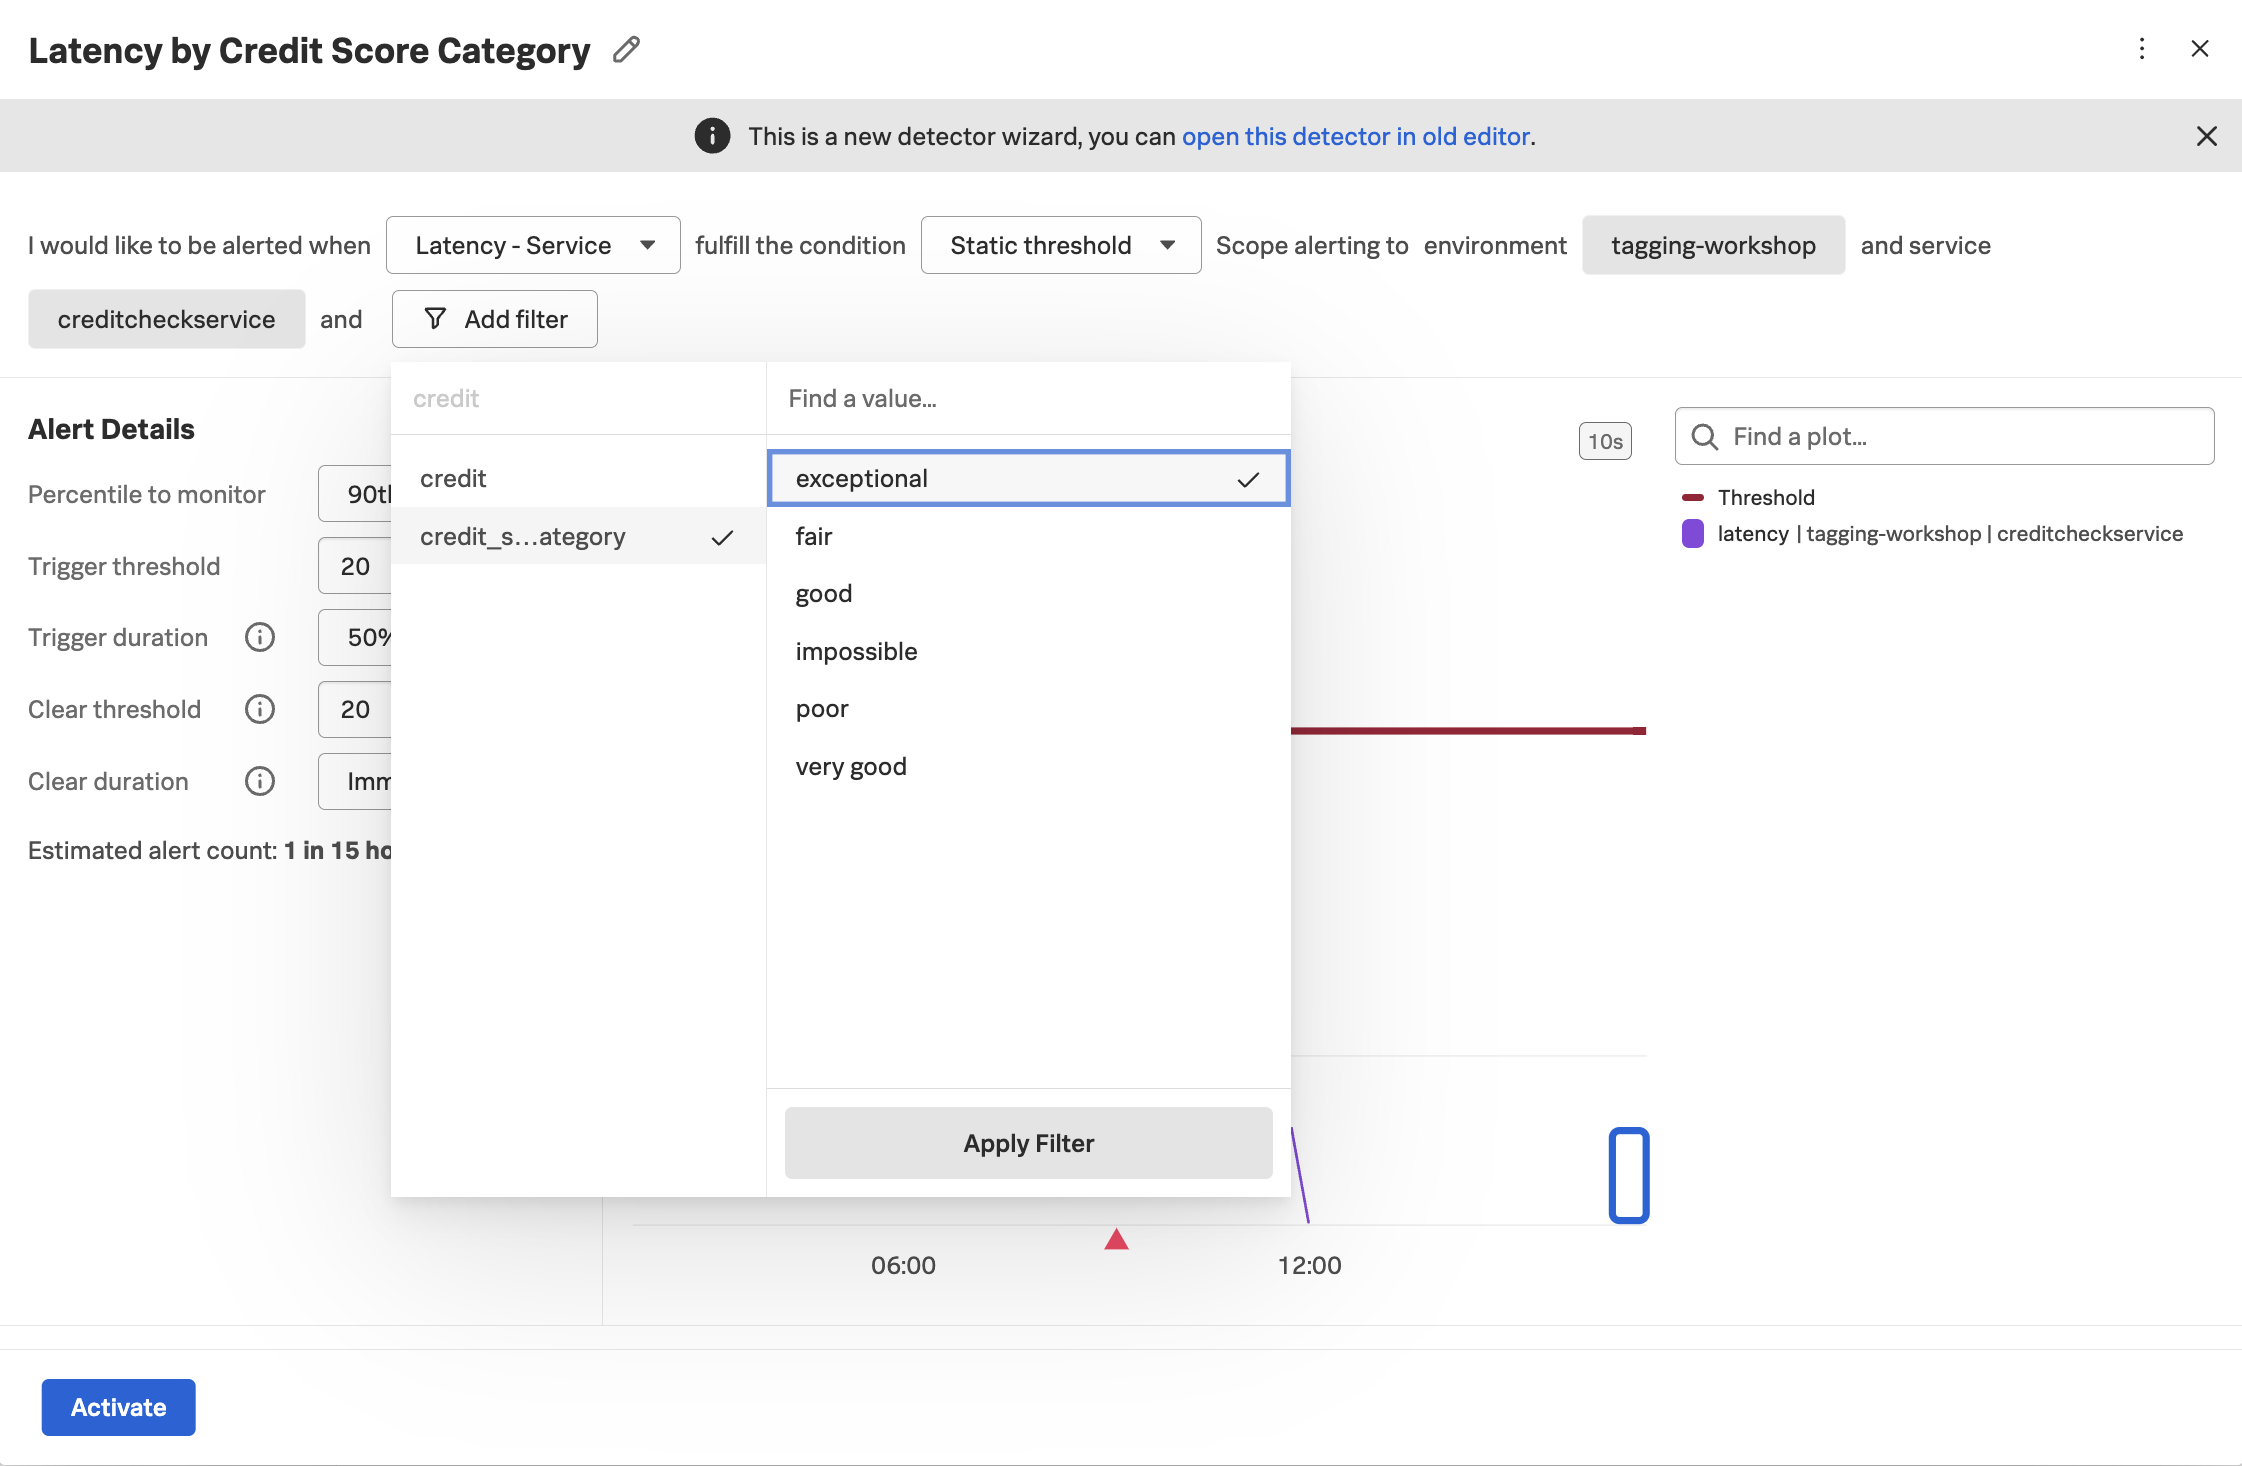
We can then set the remainder of the alert details as we normally would. The key thing to remember here is that without capturing a tag with the credit score category and indexing it, we wouldn’t be able to alert at this granular level, but would instead be forced to bucket all customers together, regardless of their importance to the business.