[!splunk] Welcome
Get insights into your applications and infrastructure in real-time with the help of the monitoring, analytics and response tools of the Splunk Observability Cloud
These workshops are going to take you through the best-in-class observability platform for ingesting, monitoring, visualizing and analyzing metrics, traces and logs.
In this workshop, we will be showing how Splunk Observability Cloud provides instant visibility of the user experience – from the perspective of the front-end application to its back-end services – Letting you experience some of the most compelling product features and differentiators of Splunk Observability Cloud.
Congratulations, you have completed the Splunk4Rookies - Observability Cloud Workshop. Today, you have become familiar with how to use Splunk Observability Cloud to monitor your applications and infrastructure.
This scenario is for ITOps teams managing a hybrid infrastructure that need to troubleshoot cloud-native performance issues, by correlating real-time metrics with logs to troubleshoot faster, improve MTTD/MTTR, and optimize costs.
Use Splunk Real User Monitoring (RUM) and Synthetics to get insight into end user experience, and proactively test scenarios to improve that experience.
This scenario helps platform engineering (or central tools) teams enable engineers with self-service observability tooling at scale, so developers and SREs can spend less time managing their toolchain and more time building and delivering cool software.
When deploying OpenTelemetry in a large organization, it’s critical to define a standardized naming convention for tagging, and a governance process to ensure the convention is adhered to.
Splunk IMSplunk delivers real-time monitoring and troubleshooting to help you maximize infrastructure performance with complete visibility.
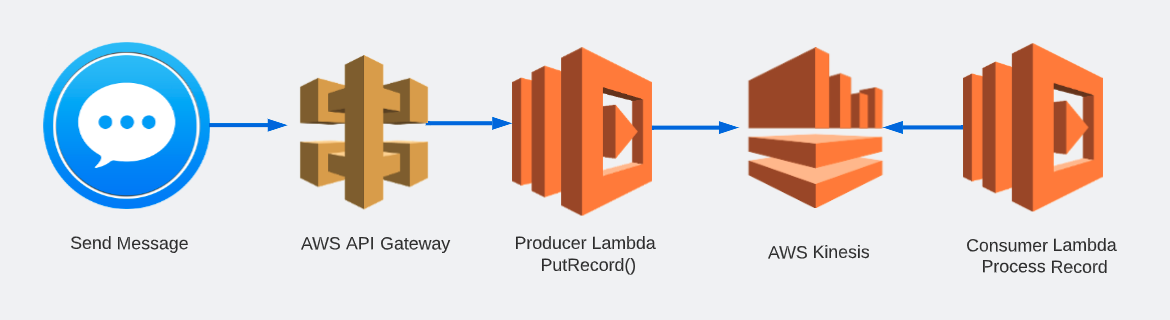
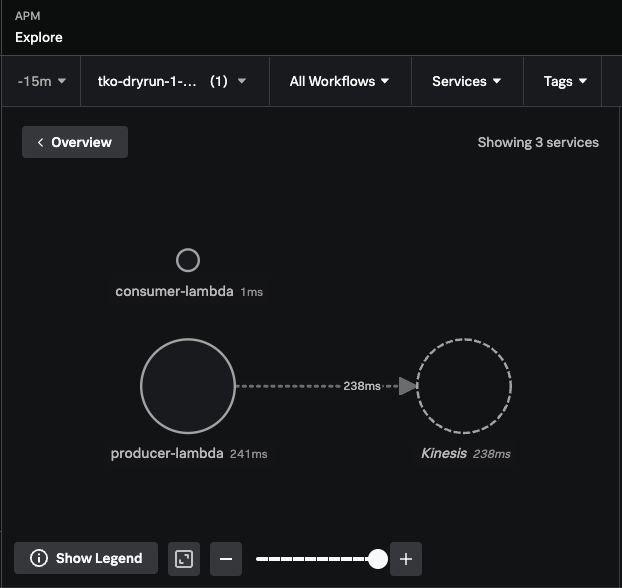
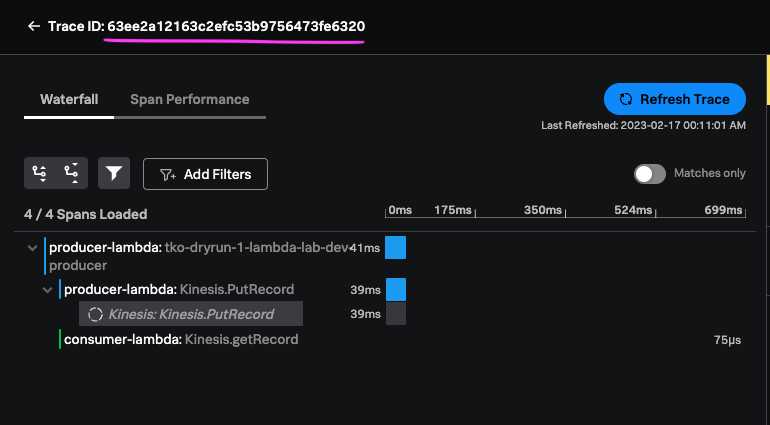
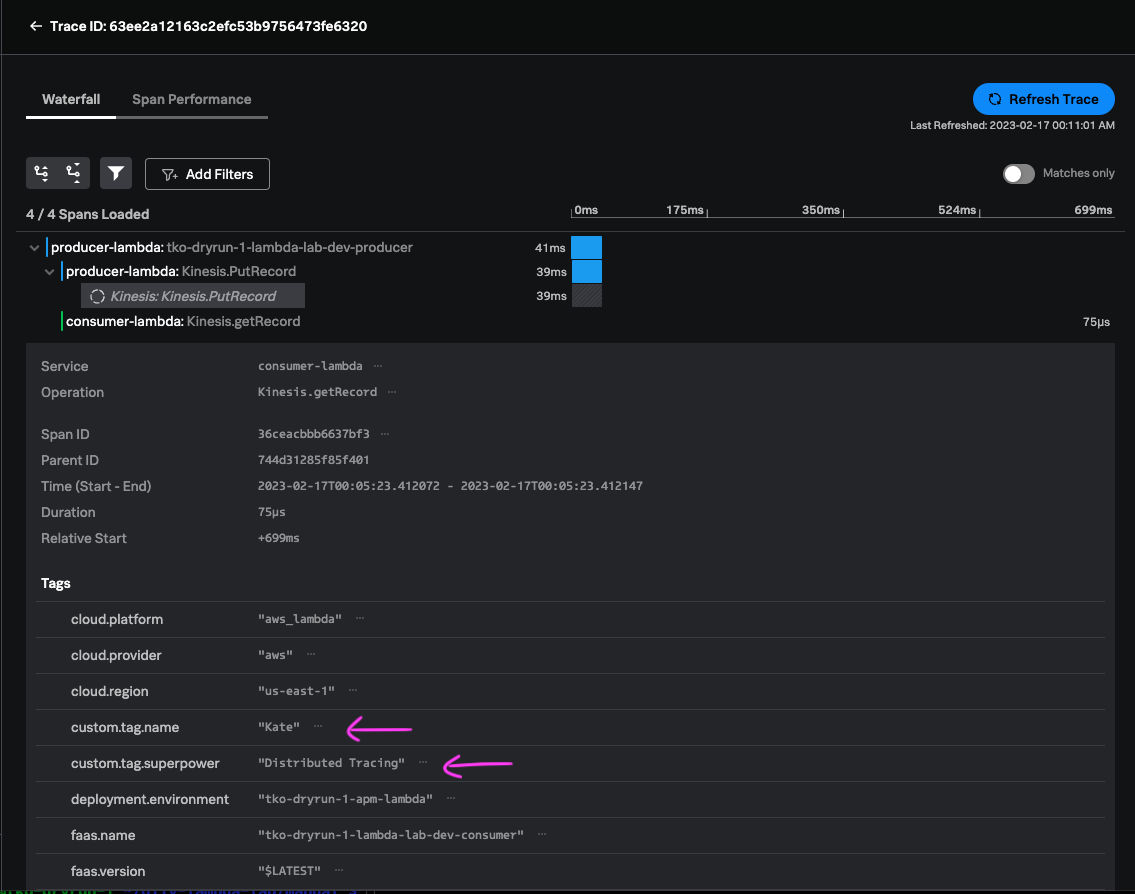
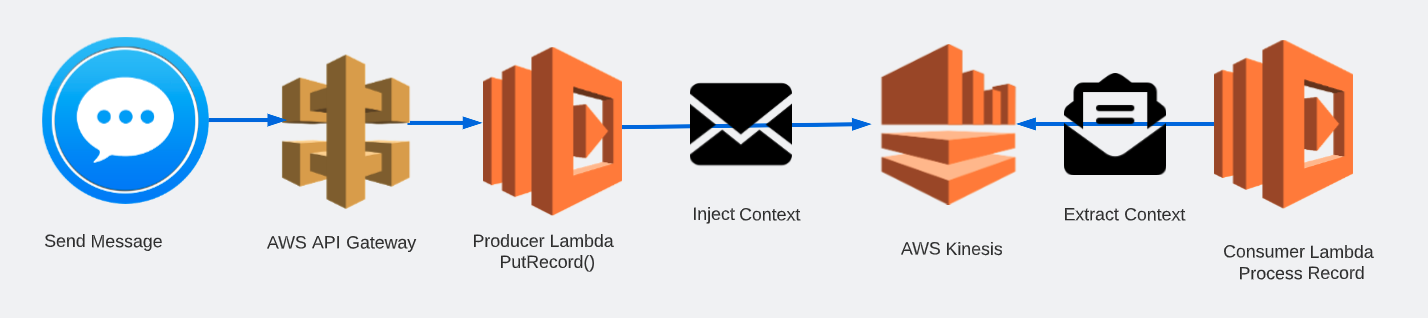
Build a Distributed Trace in Lambda and KinesisThis workshop will equip you with how a distributed trace is constructed for a small serverless application that runs on AWS Lambda, producing and consuming a message via AWS Kinesis
Getting Data In (GDI) with OTel and UFLearn how to get data into Splunk Observability Cloud with OpenTelemetry and the Splunk Universal Forwarder.
This workshop will equip you with how a distributed trace is constructed for a small serverless application that runs on AWS Lambda, producing and consuming a message via AWS Kinesis
Make expensive service outages a thing of the past. Remediate issues faster, reduce on-call burnout and keep your services up and running.
Subsections of Splunk Observability Workshops
Splunk4Rookies - Observability Cloud
2 minutesAuthors
Robert Castley
Pieter Hagen
In this workshop, we will be showing how Splunk Observability Cloud provides instant visibility of the user experience – from the perspective of the front-end application to its back-end services – Letting you experience some of the most compelling product features and differentiators of Splunk Observability Cloud:
Finding root causes with tag analytics and error stacks
Related content
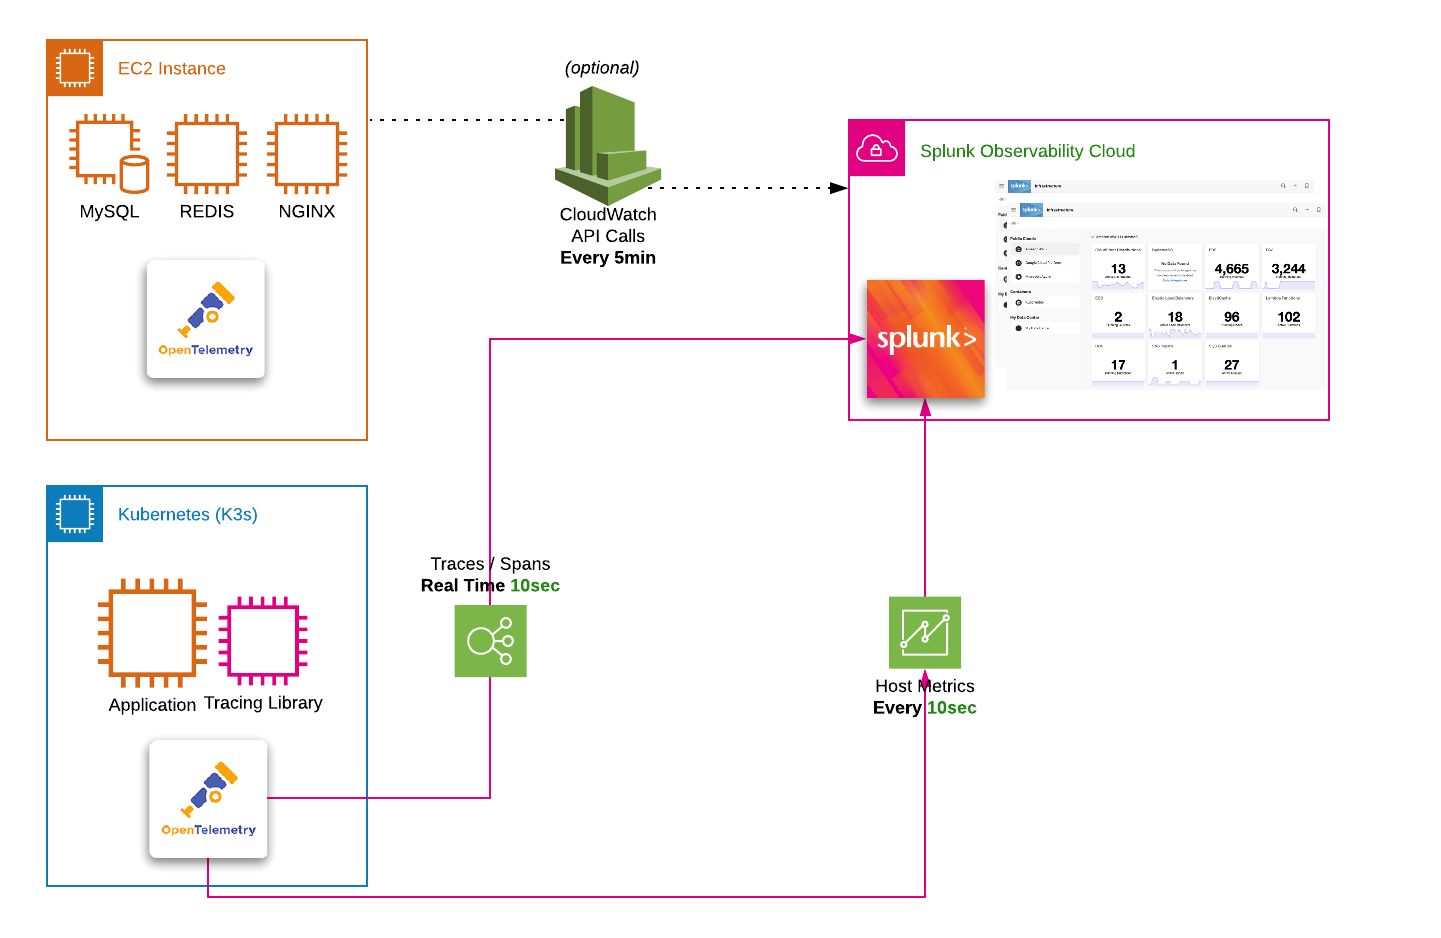
A key factor in building the Splunk Observability Cloud is to unify telemetry data to create a complete picture of an end-user experience and your application stack.
The workshop uses a microservices-based application that is deployed on AWS EC2 instances. The application is a simple e-commerce application that allows users to browse products, add them to a cart, and checkout. The application is instrumented with OpenTelemetry.
OpenTelemetry is a collection of tools, APIs, and software development kits (SDKs), used to instrument, generate, collect, and export telemetry data (metrics, traces, and logs) to help you analyze your software’s performance and behavior.
The OpenTelemetry community is growing. As a joint project between Splunk, Google, Microsoft, Amazon, and many other organizations, it currently has the second-largest number of contributors in the Cloud Native Computing Foundation after Kubernetes.
Subsections of Splunk4Rookies - Observability Cloud
Workshop Overview
2 minutes
Introduction
The goal of this workshop is to experience an issue and use Splunk Observability Cloud to troubleshoot and identify the root cause. For this, we have provided a complete microservices-based application running in Kubernetes that has been instrumented to send metrics, traces, and logs to Splunk Observability Cloud.
Who should attend?
Those wanting to gain an understanding of Splunk Observability in a hands-on environment. This workshop is designed for people with little or no experience with Splunk Observability.
What you’ll need
Just you, your laptop, and a browser that can access external websites. We run these workshops in person or on Zoom, if you don’t have the Zoom client on your device you will be able to access them via a web browser.
What’s covered in this workshop?
This 3-hour session will take you through the basics of Splunk Observability, the only observability platform with streaming analytics, NoSample™ Full Fidelity distributed tracing in a hands-on environment.
OpenTelemetry
A Quick introduction to why OpenTelemetry and why is it important for Observability.
Tour of the Splunk Observability User Interface
A walkthrough of the various components of Splunk Observability Cloud showing you how to easily navigate the 5 main components:- APM, RUM, Log Observer, Synthetics and Infrastructure.
Generate Real User Data
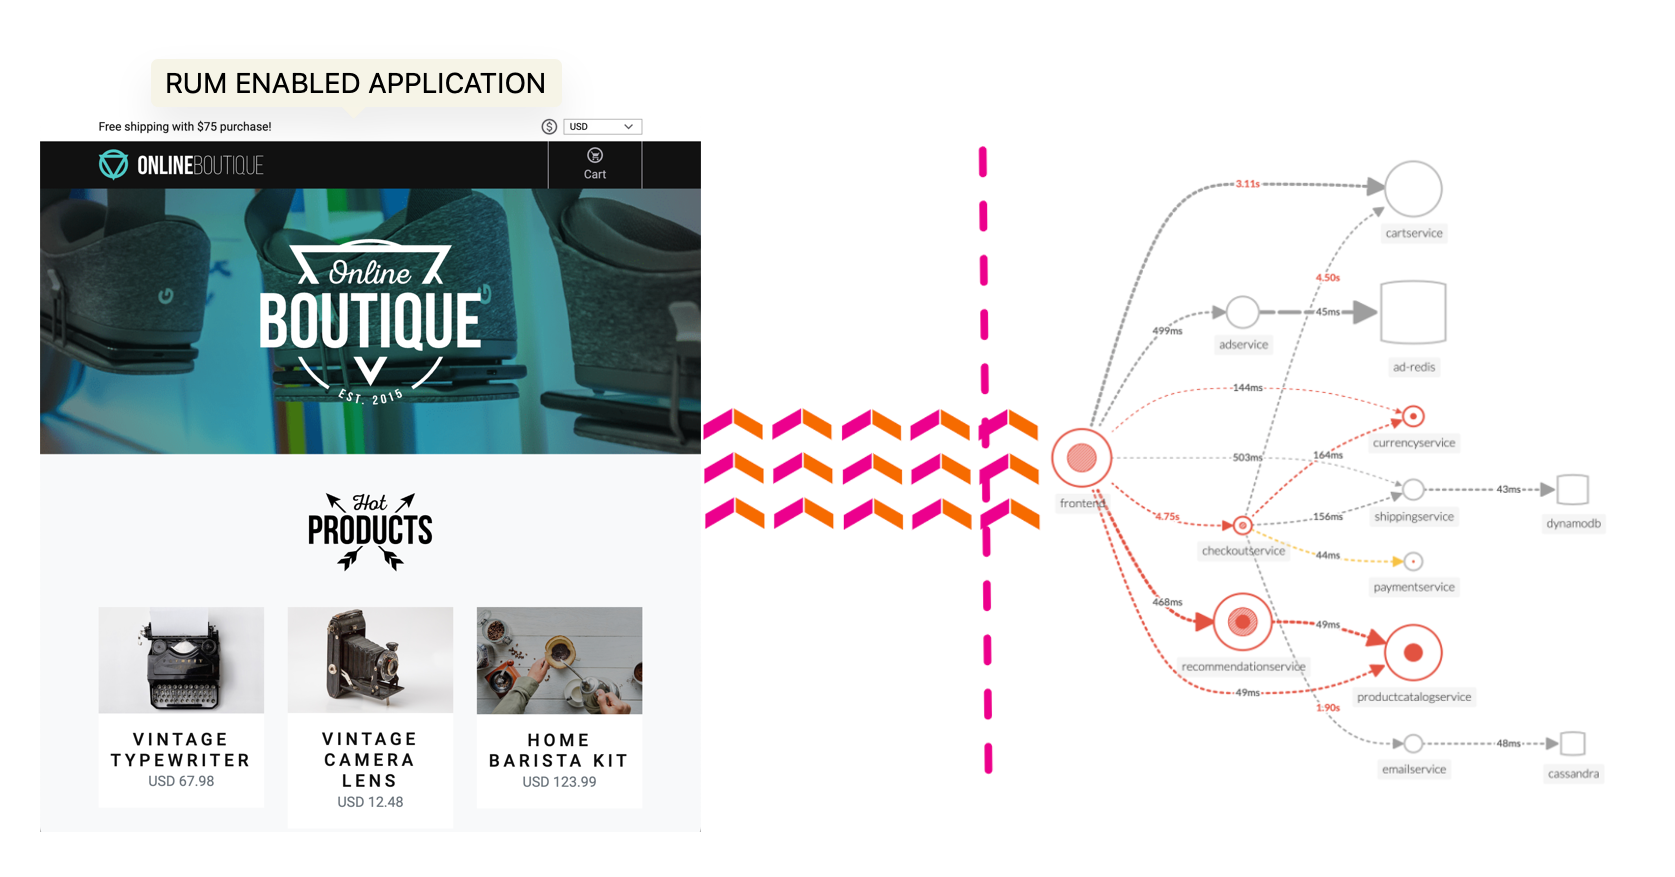
Enjoy some retail therapy using the Online Boutique Website. Use your browser, mobile or tablet to spend some hard-earned virtual money to send metrics (do we have a problem?), traces (where is the problem?) and logs (what is the problem?).
Splunk Real User Monitoring (RUM)
Examine the real user data that has been provided by the telemetry received from all participants’ browser sessions. The goal is to find a browser, mobile or tablet session that performed poorly and begin the troubleshooting process.
Splunk Application Performance Monitoring (APM)
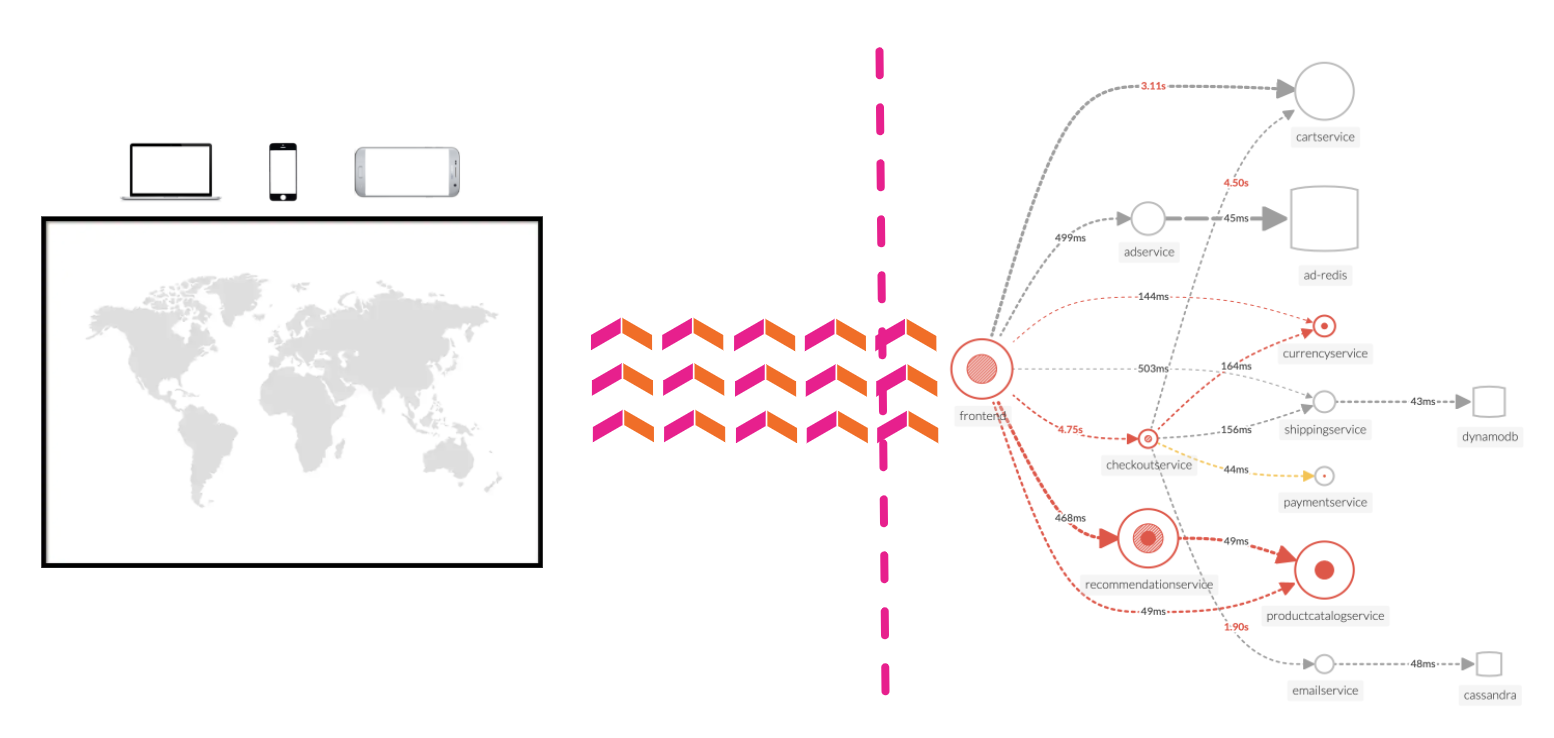
Discover the power of full end-to-end visibility by jumping from a RUM trace (front-end) to an APM trace (back-end). All the services are sending telemetry (traces and spans) that Splunk Observability Cloud can visualize, analyze and use to detect anomalies and errors.
Splunk Log Observer (LO)
Related Content is a powerful feature that allows you to jump from one component to another. In this case, we will jump from the APM trace to the logs to the related logs.
Splunk Synthetics
Wouldn’t it be great if we could have 24/7 monitoring of our application, and be alerted when there is a problem? This is where Synthetics comes in. We will show you a simple test that runs every 1 minute and checks the performance and availability of a typical user journey through the Online Boutique.
What is OpenTelemetry & why should you care?
2 minutes
OpenTelemetry
With the rise of cloud computing, microservices architectures, and ever-more complex business requirements, the need for Observability has never been greater. Observability is the ability to understand the internal state of a system by examining its outputs. In the context of software, this means being able to understand the internal state of a system by examining its telemetry data, which includes metrics, traces, and logs.
To make a system observable, it must be instrumented. That is, the code must emit traces, metrics, and logs. The instrumented data must then be sent to an Observability back-end such as Splunk Observability Cloud.
Metrics
Traces
Logs
Do I have a problem?
Where is the problem?
What is the problem?
OpenTelemetry does two important things:
Allows you to own the data that you generate rather than be stuck with a proprietary data format or tool.
Allows you to learn a single set of APIs and conventions
These two things combined enable teams and organizations the flexibility they need in today’s modern computing world.
There are a lot of variables to consider when getting started with Observability, including the all-important question: “How do I get my data into an Observability tool?”. The industry-wide adoption of OpenTelemetry makes this question easier to answer than ever.
Why Should You Care?
OpenTelemetry is completely open-source and free to use. In the past, monitoring and Observability tools relied heavily on proprietary agents meaning that the effort required to change or set up additional tooling required a large amount of changes across systems, from the infrastructure level to the application level.
Since OpenTelemetry is vendor-neutral and supported by many industry leaders in the Observability space, adopters can switch between supported Observability tools at any time with minor changes to their instrumentation. This is true regardless of which distribution of OpenTelemetry is used – like with Linux, the various distributions bundle settings and add-ons but are all fundamentally based on the community-driven OpenTelemetry project.
Splunk has fully committed to OpenTelemetry so that our customers can collect and use ALL their data, in any type, any structure, from any source, on any scale, and all in real-time. OpenTelemetry is fundamentally changing the monitoring landscape, enabling IT and DevOps teams to bring data to every question and every action. You will experience this during these workshops.
UI - Quick Tour 🚌
We are going to start with a short walkthrough of the various components of Splunk Observability Cloud. The aim of this is to get you familiar with the UI.
Signing in to Splunk Observability Cloud
Real User Monitoring (RUM)
Application Performance Monitoring (APM)
Log Observer
Synthetics
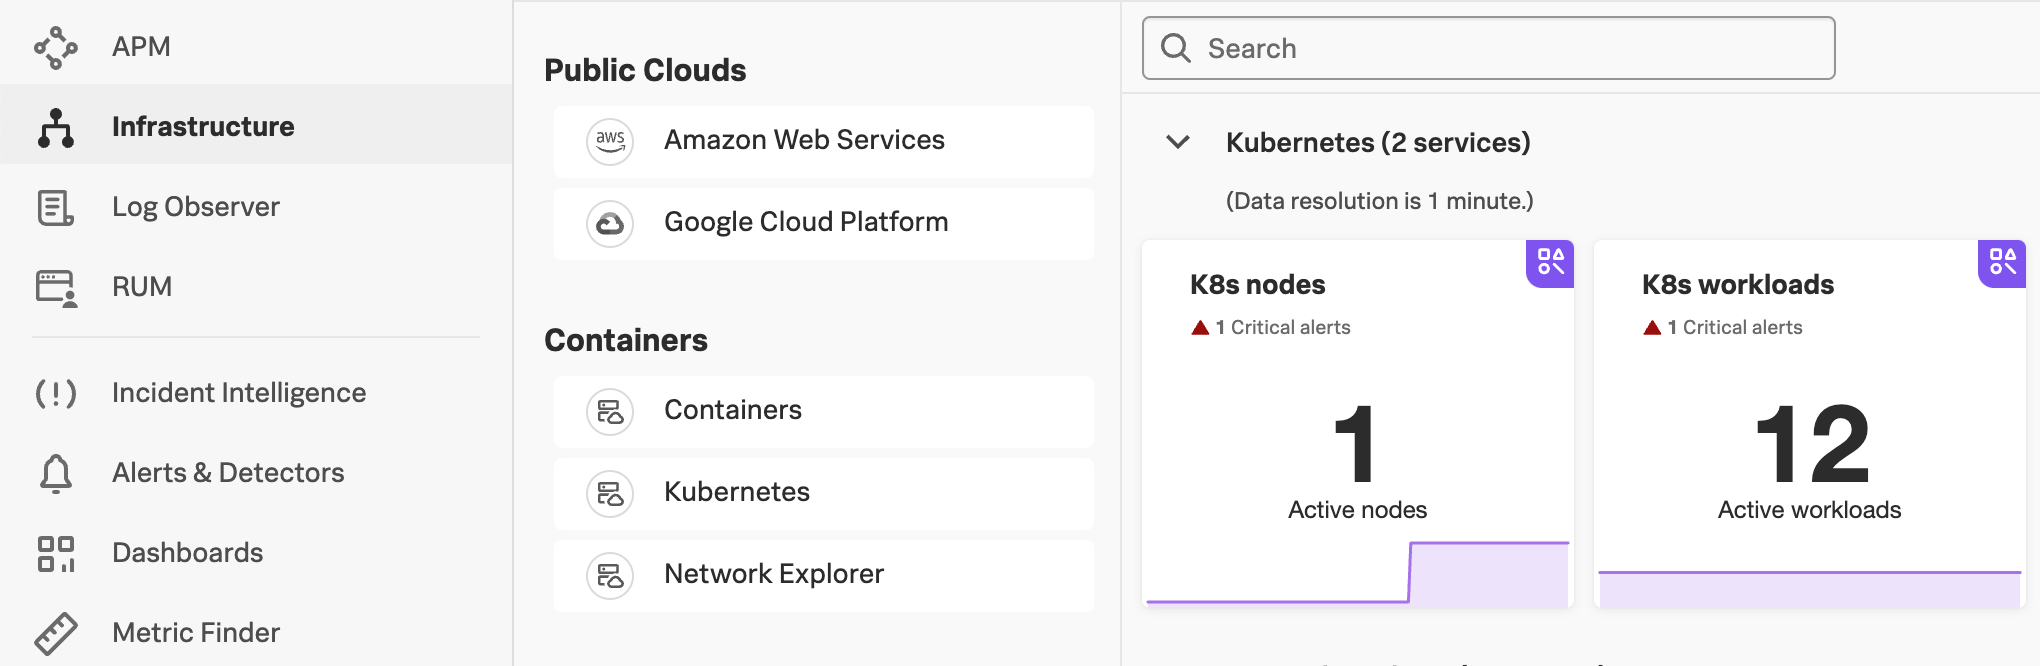
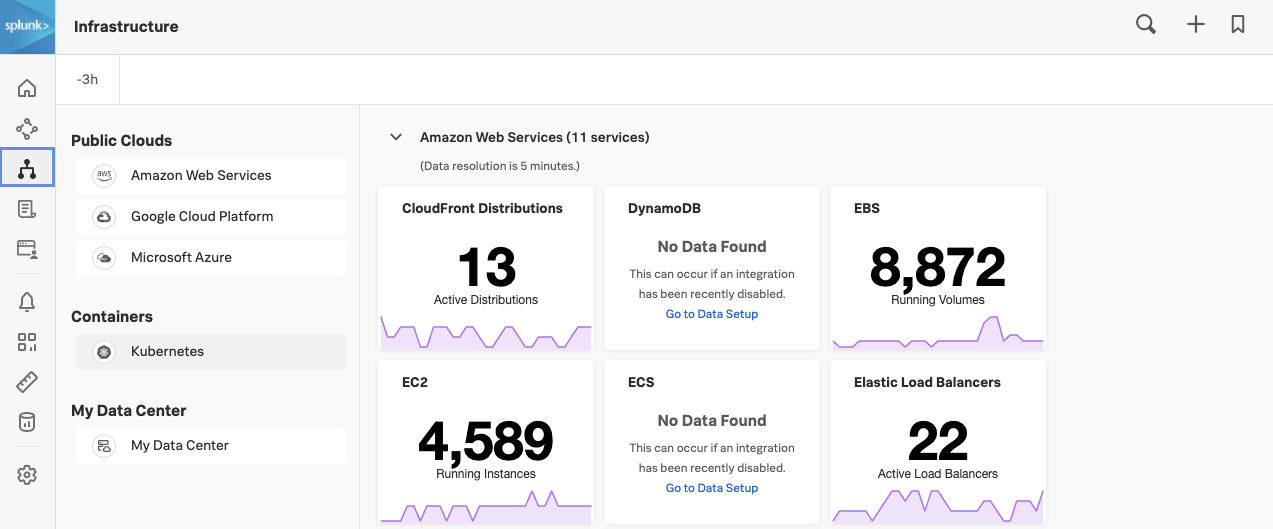
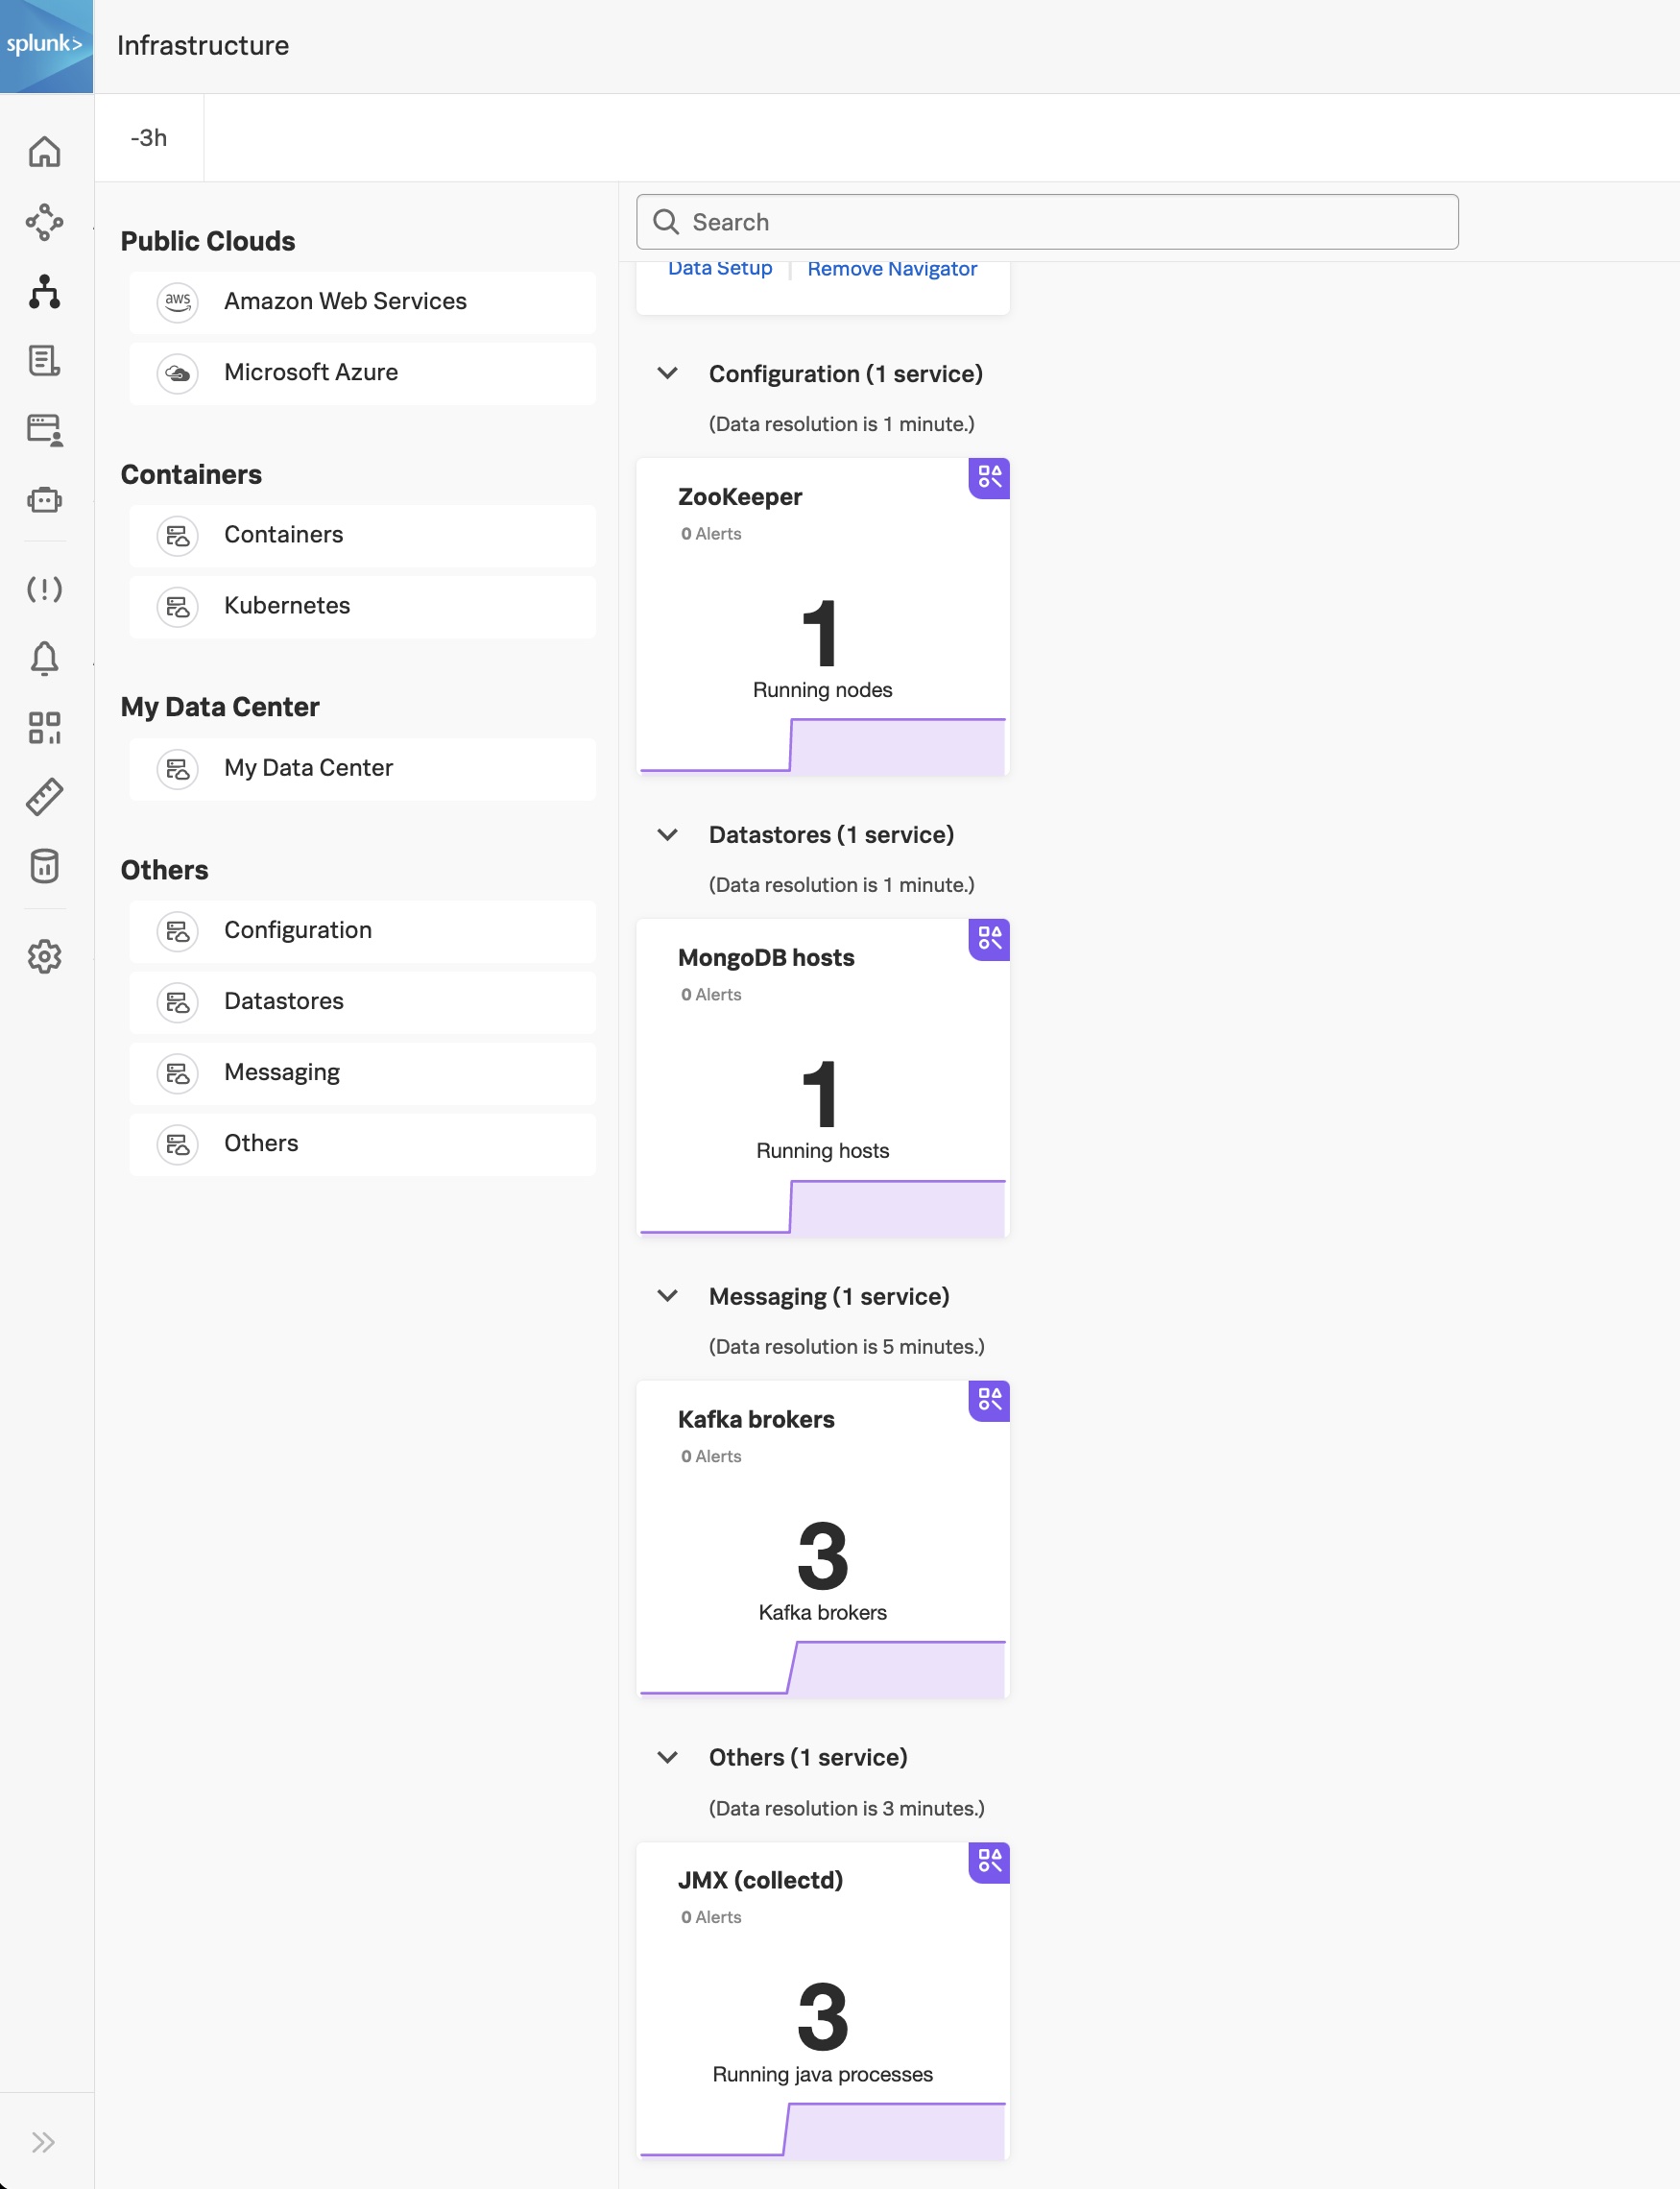
Infrastructure Monitoring
Tip
The easiest way to navigate through this workshop is by using:
the left/right arrows (< | >) on the top right of this page
the left (◀️) and right (▶️) cursor keys on your keyboard
Subsections of UI - Quick Tour 🚌
Getting Started
2 minutes
1. Sign in to Splunk Observability Cloud
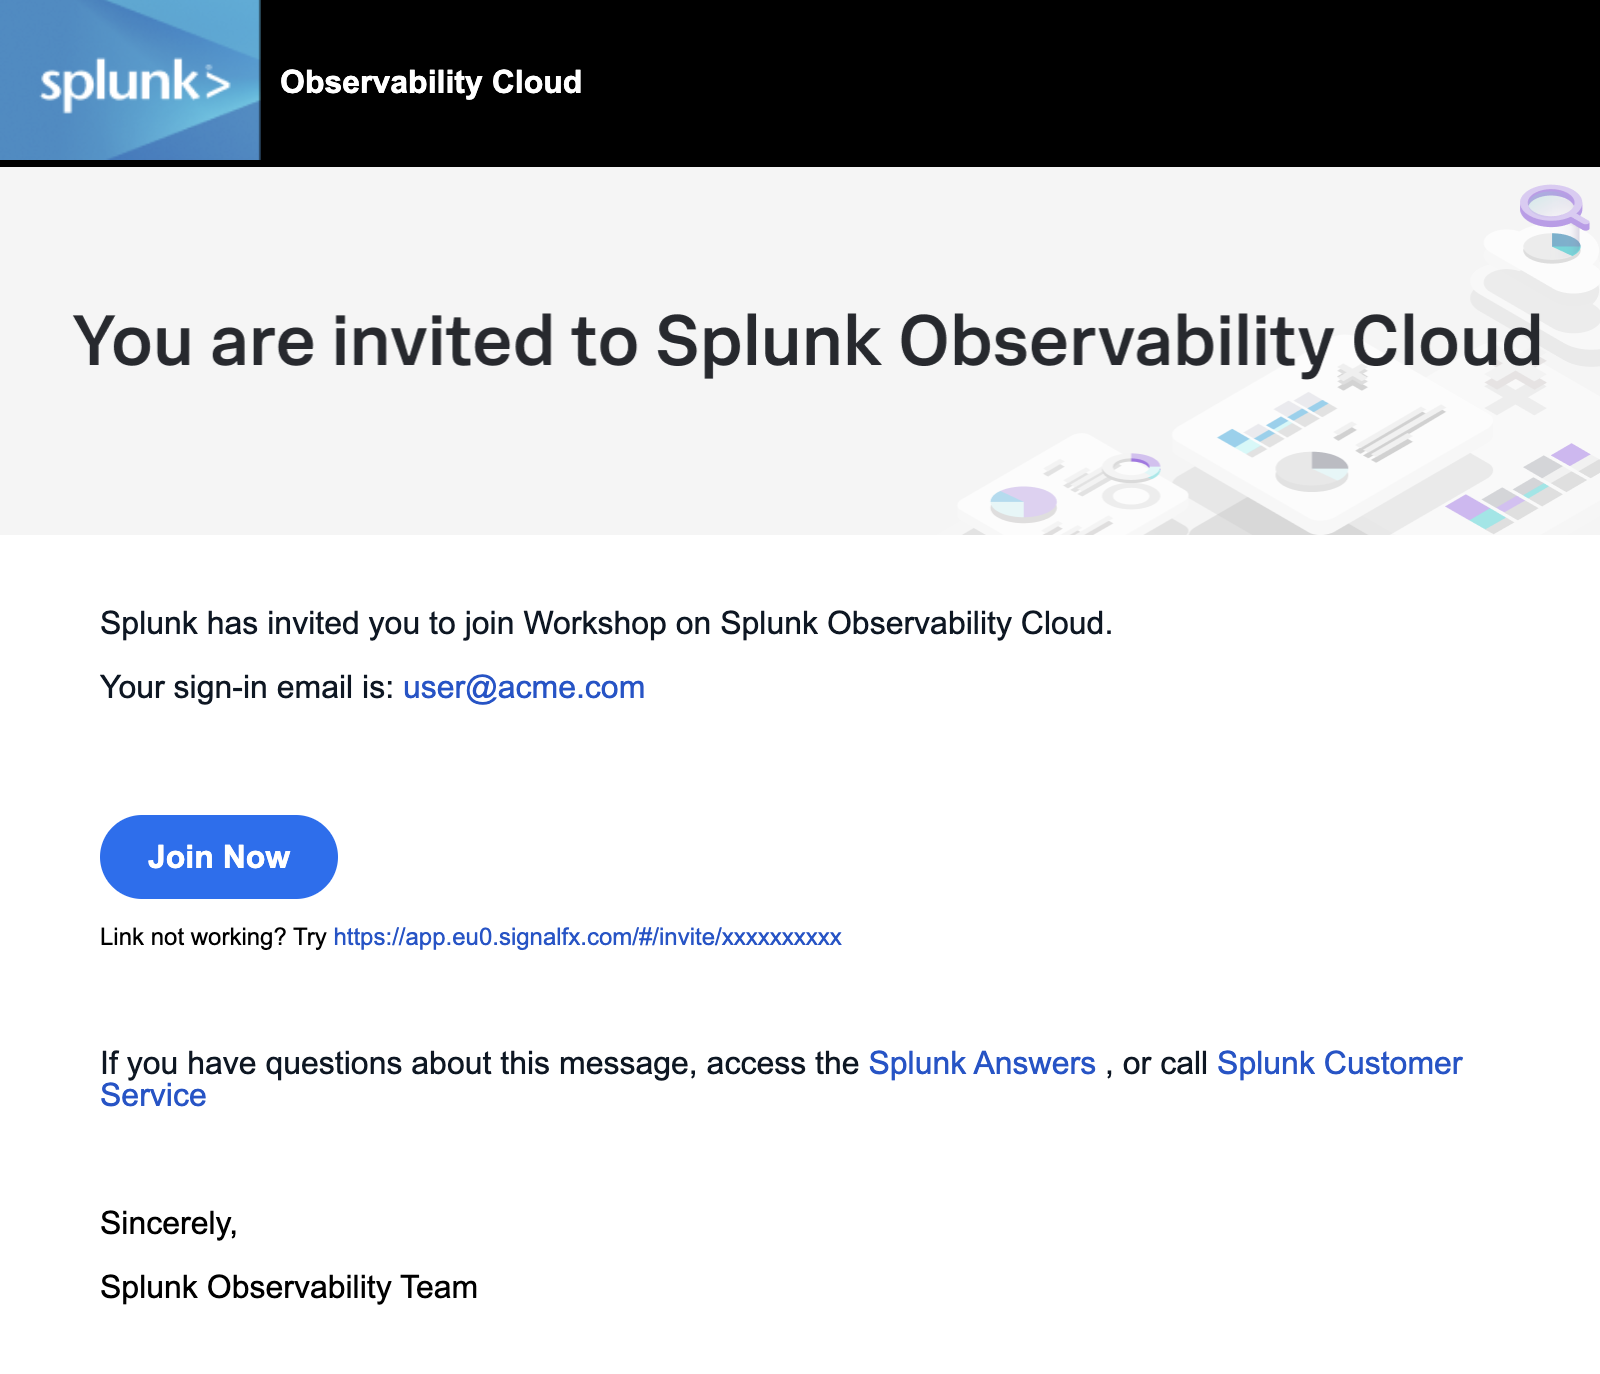
You should have received an e-mail from Splunk inviting you to the Workshop Org. This e-mail will look like the screenshot below, if you cannot find it, please check your Spam/Junk folders or inform your Instructor. You can also check for other solutions in our login F.A.Q..
To proceed click the Join Now button or click on the link provided in the e-mail.
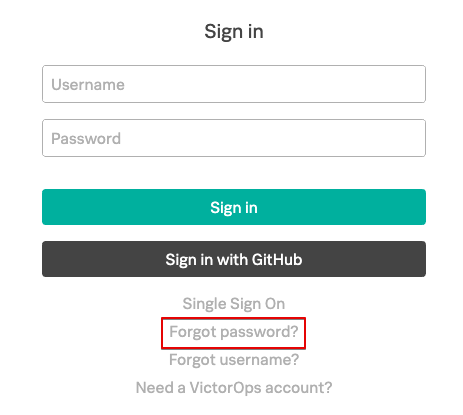
If you have already completed the registration process you can skip the rest and proceed directly to Splunk Observability Cloud and log in:
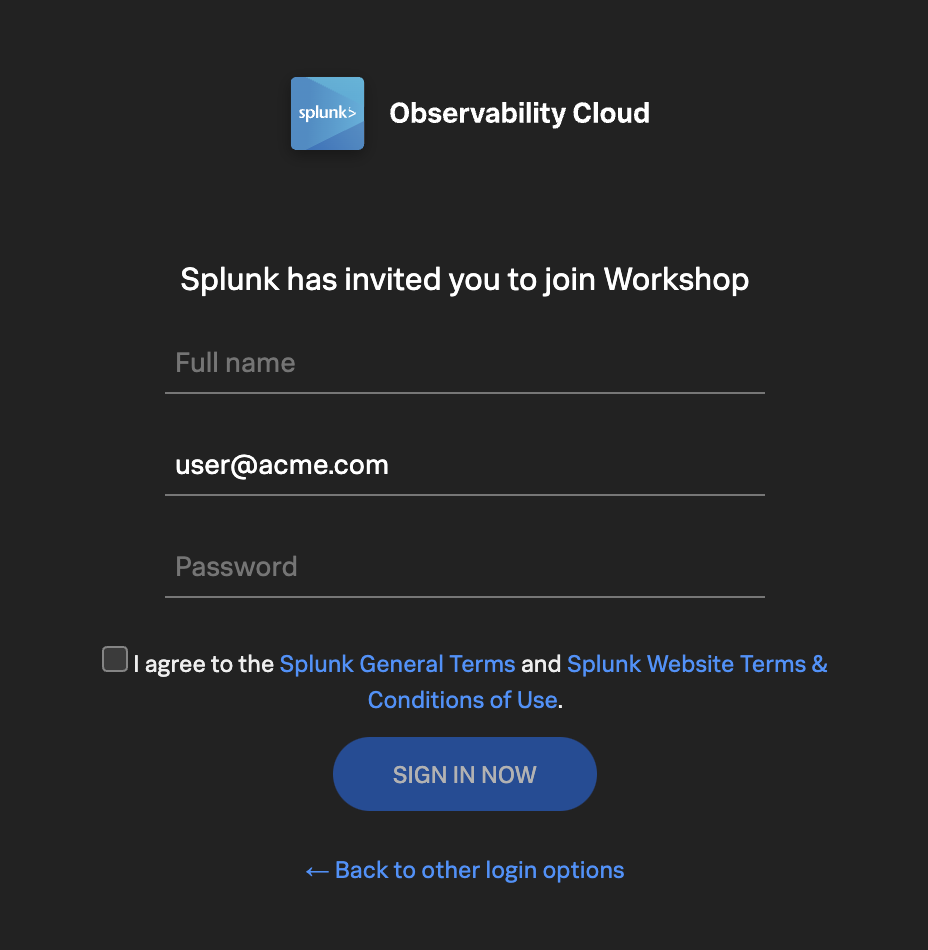
If this is your first time using Splunk Observability Cloud, you will be presented with the registration form. Enter your full name, and desired password. Please note that the password requirements are:
Must be between 8 and 32 characters
Must contain at least one capital letter
Must have at least one number
Must have at least one symbol (e.g. !@#$%^&*()_+)
Click the checkbox to agree to the terms and conditions and click the SIGN IN NOW button.
Subsections of Getting Started
Home Page
5 minutes
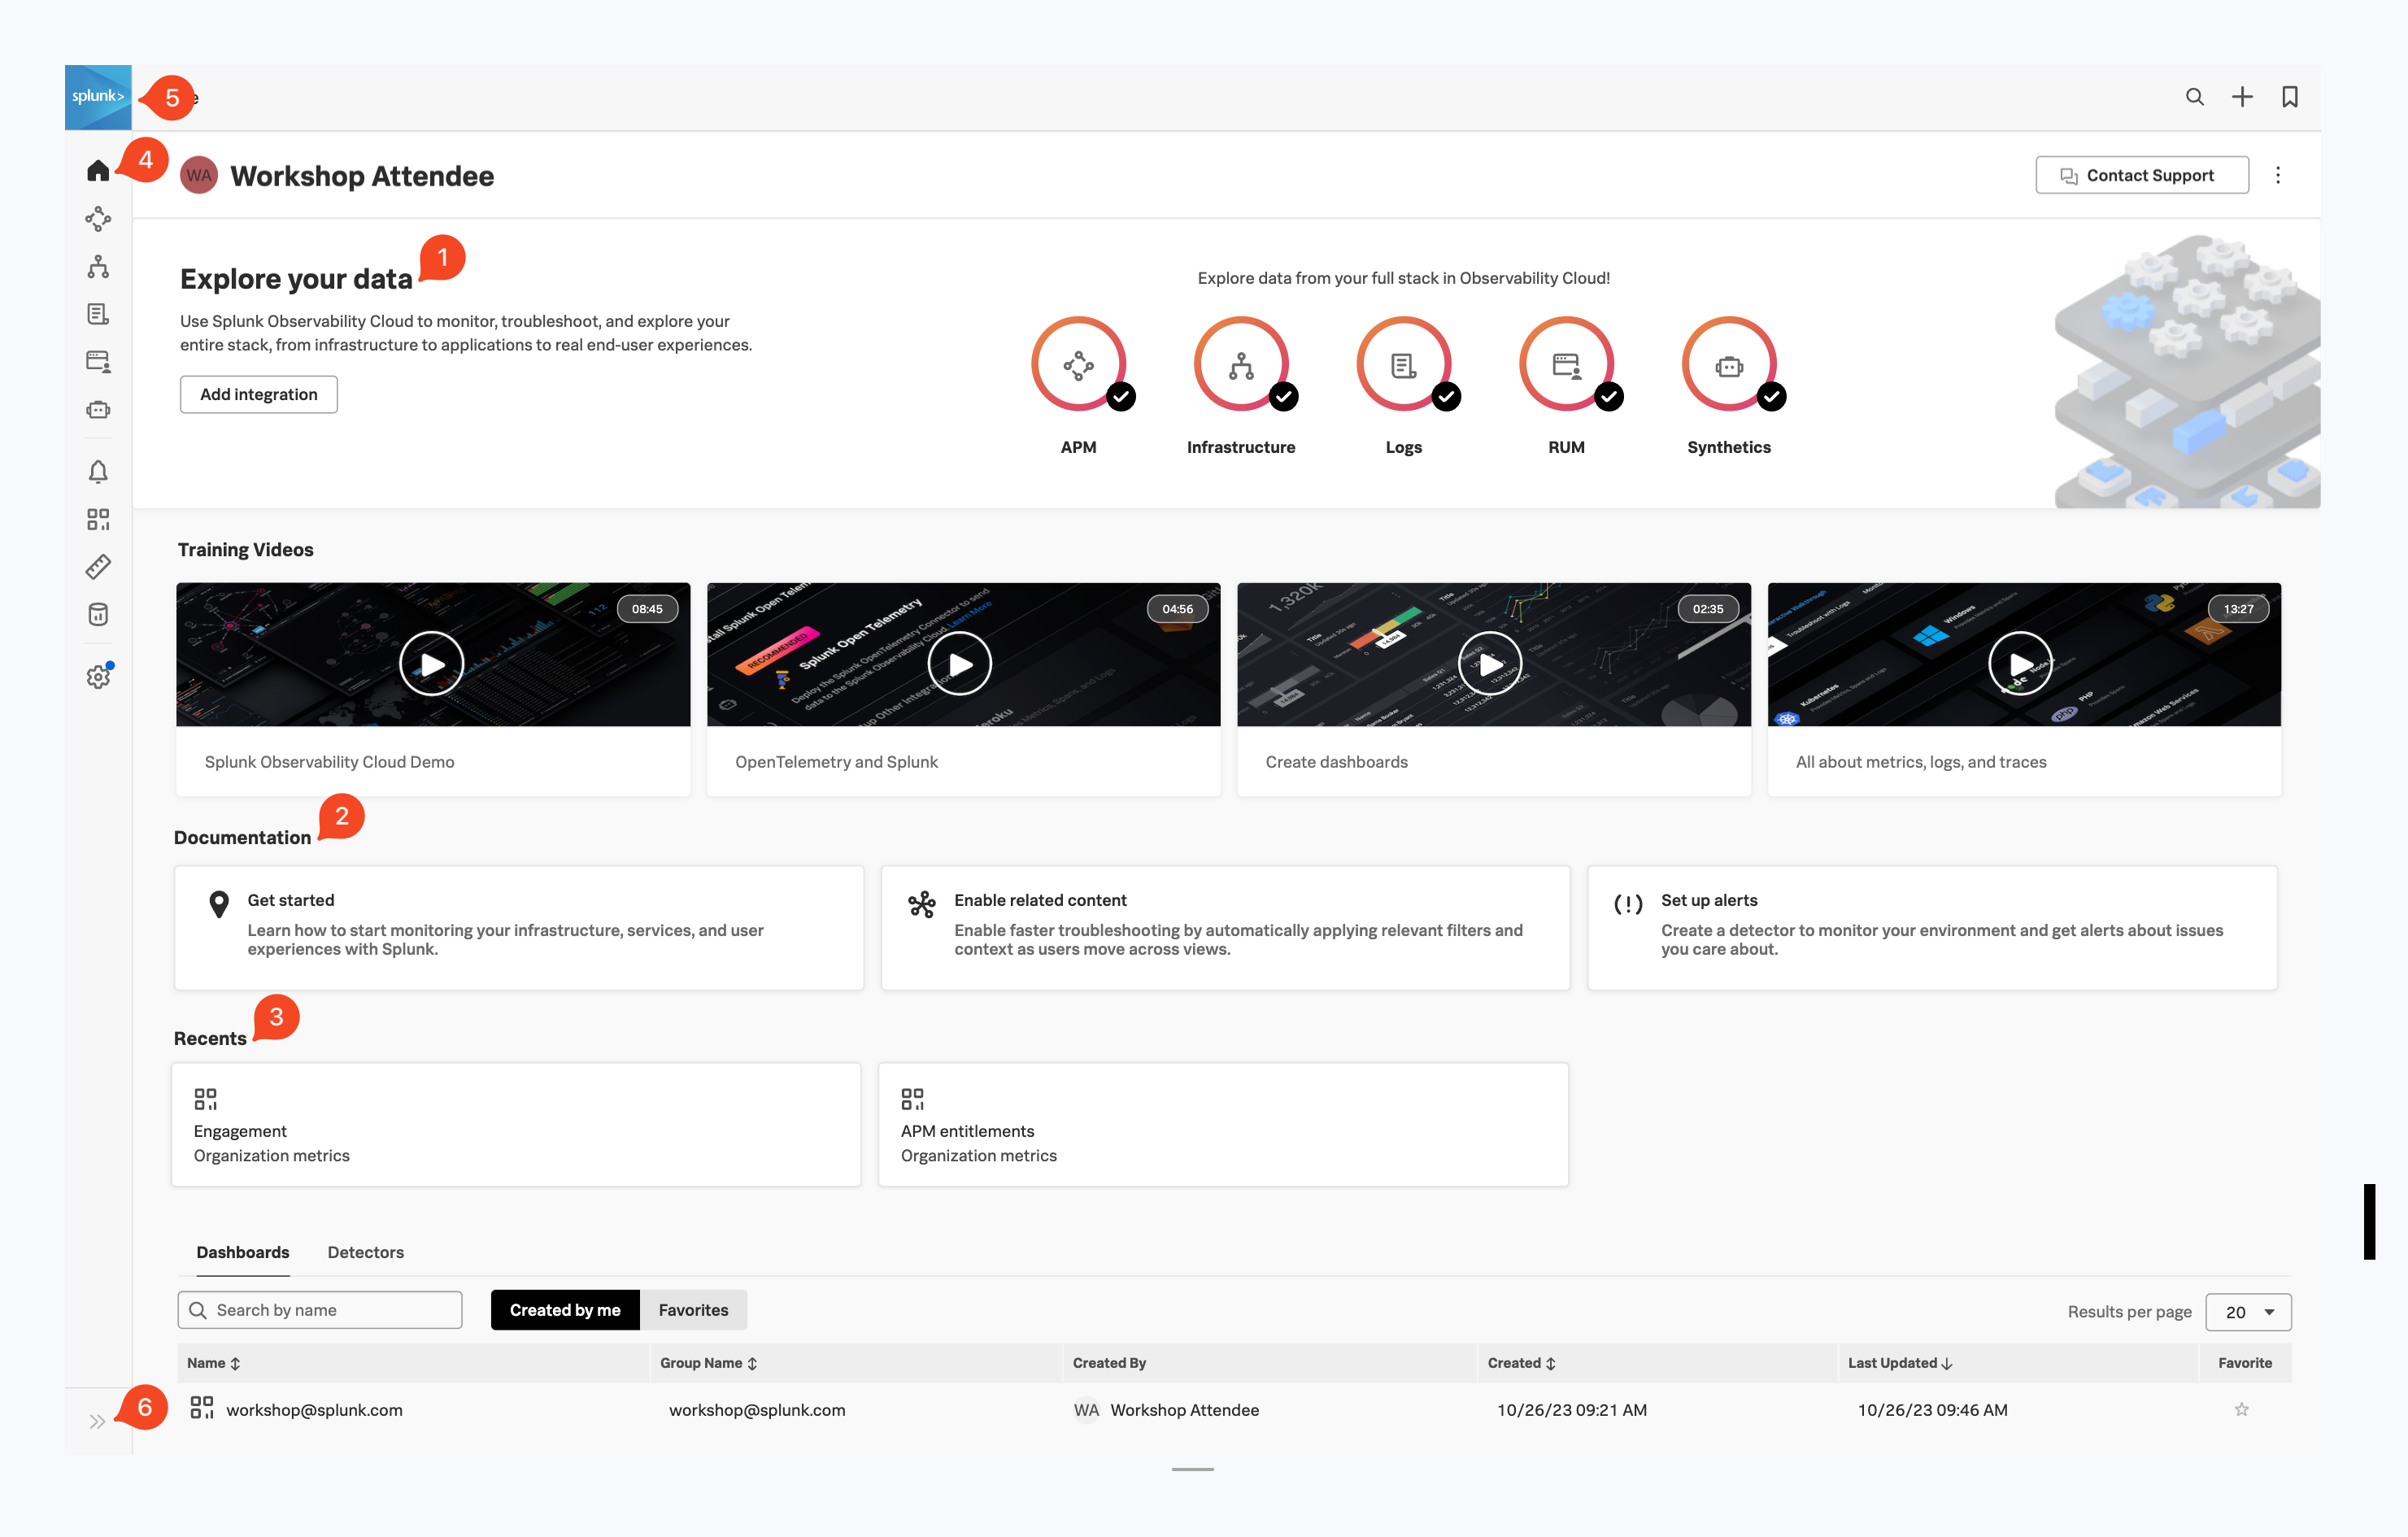
After you have registered and logged into Splunk Observability Cloud you will be taken to the home or landing page. Here, you will find several useful features to help you get started.
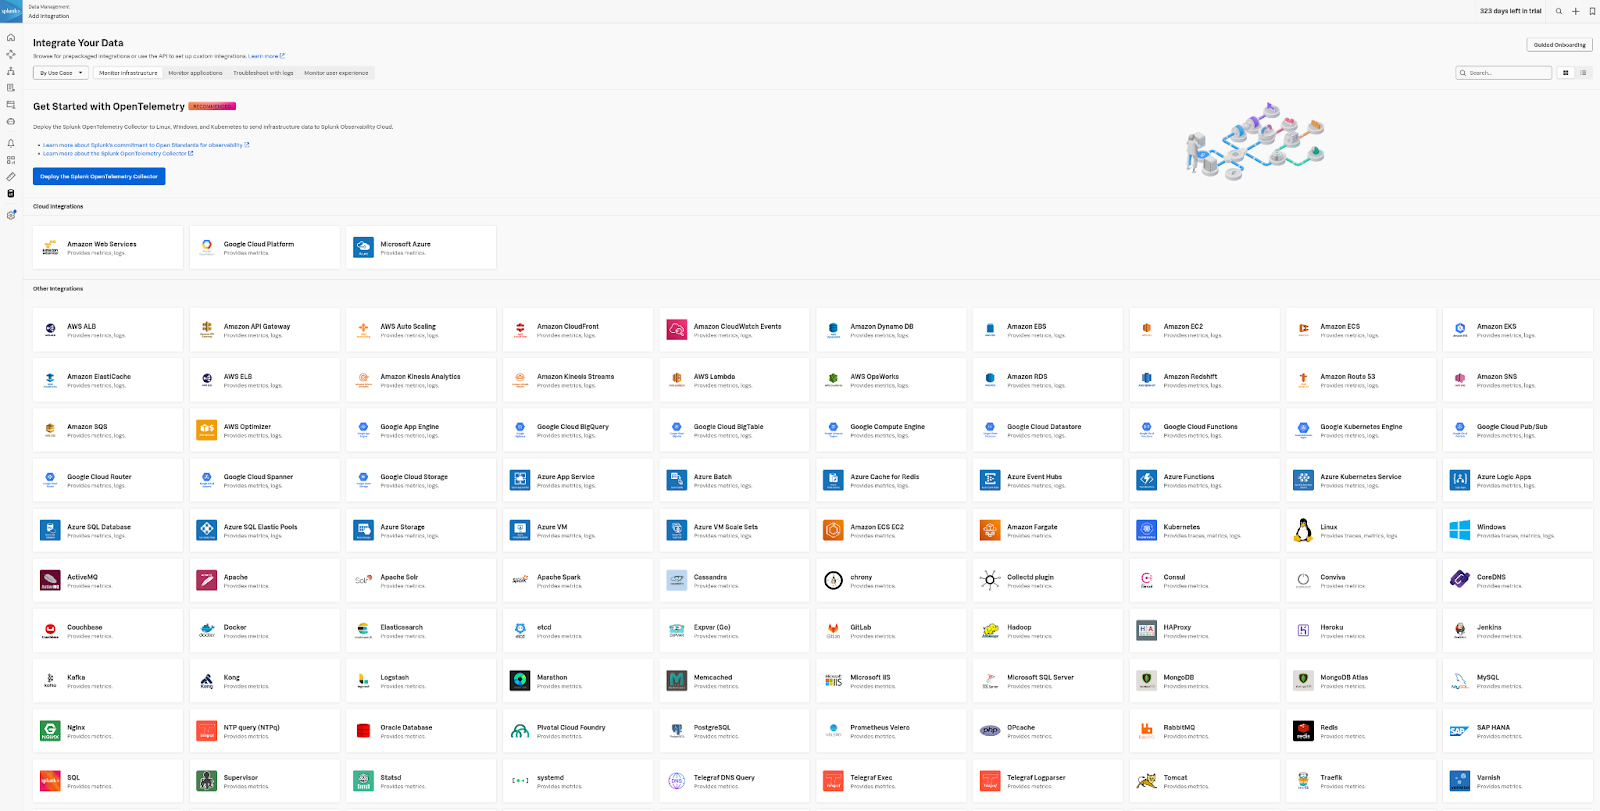
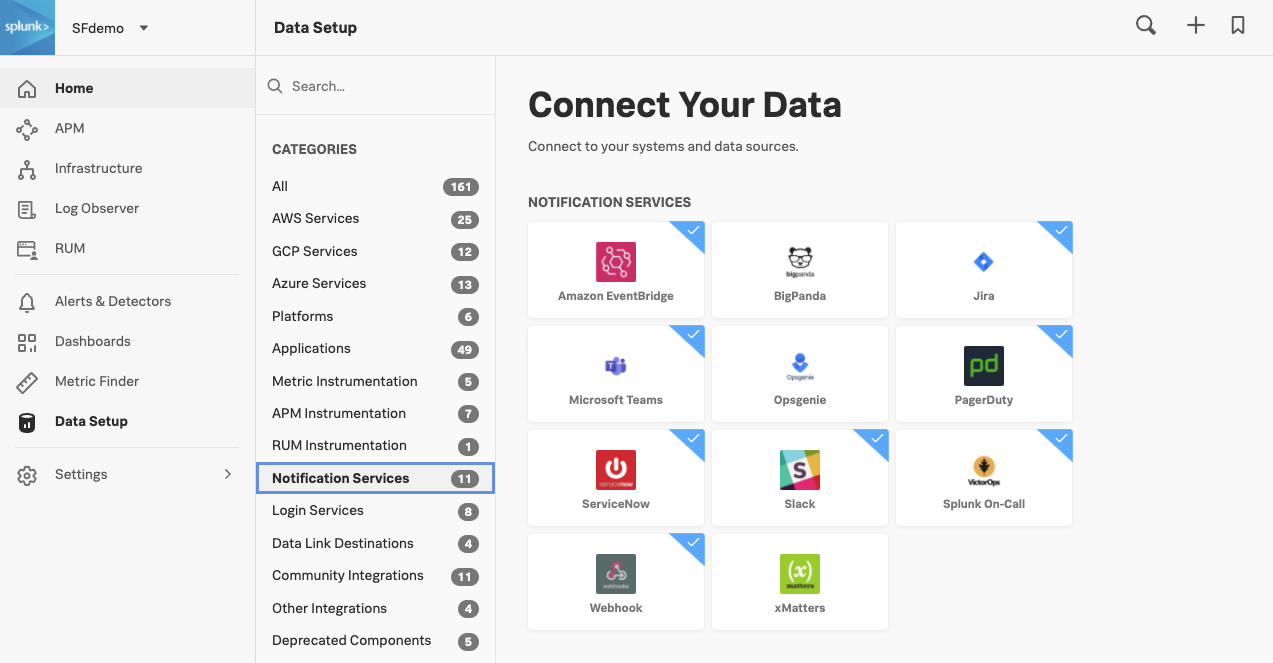
Explore your data pane: Displays which integrations are enabled and allows you to add additional integrations if you are an Administrator.
Documentation pane: Training videos and links to documentation to get you started with Splunk Observability Cloud.
Recents pane: Recently created/visited dashboards and/or detectors for quick access.
Main Menu pane: Navigate the components of Splunk Observability Cloud.
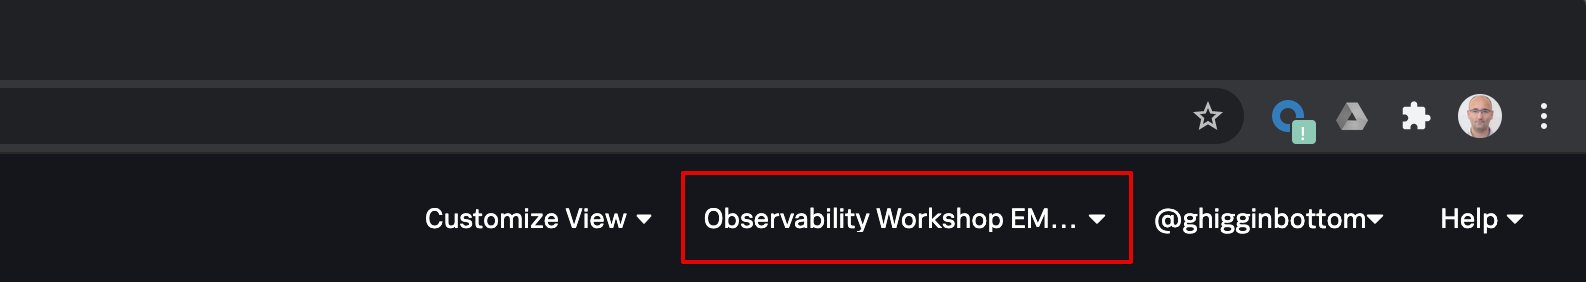
Org Switcher: Easily switch between Organizations (if you are a member of more than one Organization).
Expand/Contract Main Menu: Expand » / Collapse « the main menu if space is at a premium.
Let’s start with our first exercise:
Exercise
Expand the Main Menu and click on Settings.
Check in the Org Switcher if you have access to more than one Organization.
Tip
If you have used Splunk Observability before, you may be placed in an Organization you have used previously. Make sure you are in the correct workshop organization. Verify this with your instructor if you have access to multiple Organizations.
Exercise
Click Onboarding Guidance (Here you can toggle the visibility of the onboarding panes. This is useful if you know the product well enough, and can use the space to show more information).
Hide the Onboarding Content for the Home Page.
At the bottom of the menu, select your preferred appearance: Light, Dark or Auto mode.
Did you also notice this is where the Sign Out option is? Please don’t 😊 !
Click < to get back to the main menu.
Next, let’s check out Splunk Real User Monitoring (RUM).
Real User Monitoring Overview
5 minutes
Splunk RUM is the industry’s only end-to-end, NoSample™ RUM solution - providing visibility into the full user experience of every web and mobile session to uniquely combine all front-end traces with back-end metrics, traces, and logs as they happen. IT Operations and Engineering teams can quickly scope, prioritize and isolate errors, measure how performance impacts real users and optimize end-user experiences by correlating performance metrics alongside video reconstructions of all user interactions.
Full user session analysis: Streaming analytics capture full user sessions from single and multi-page apps, measuring the customer impact of every resource, image, route change and API call. Correlate issues faster: Infinite cardinality and full transaction analysis help you pinpoint and correlate issues faster across complex distributed systems. Isolate latency and errors: Easily identify latency, errors and poor performance for each code change and deployment. Measure how content, images and third-party dependencies impact your customers. Benchmark and improve page performance: Leverage core web vitals to measure and improve your page load experience, interactivity and visual stability. Find and fix impactful JavaScript errors, and easily understand which pages to improve first. Explore meaningful metrics: Instantly visualize the customer impact with metrics on specific workflows, custom tags and auto-suggest un-indexed tags to quickly find the root cause of issues. Optimize end-user experience: Correlate performance metrics alongside video reconstructions of all user interactions to optimize end-user experiences.
Subsections of Real User Monitoring Overview
Real User Monitoring Home Page
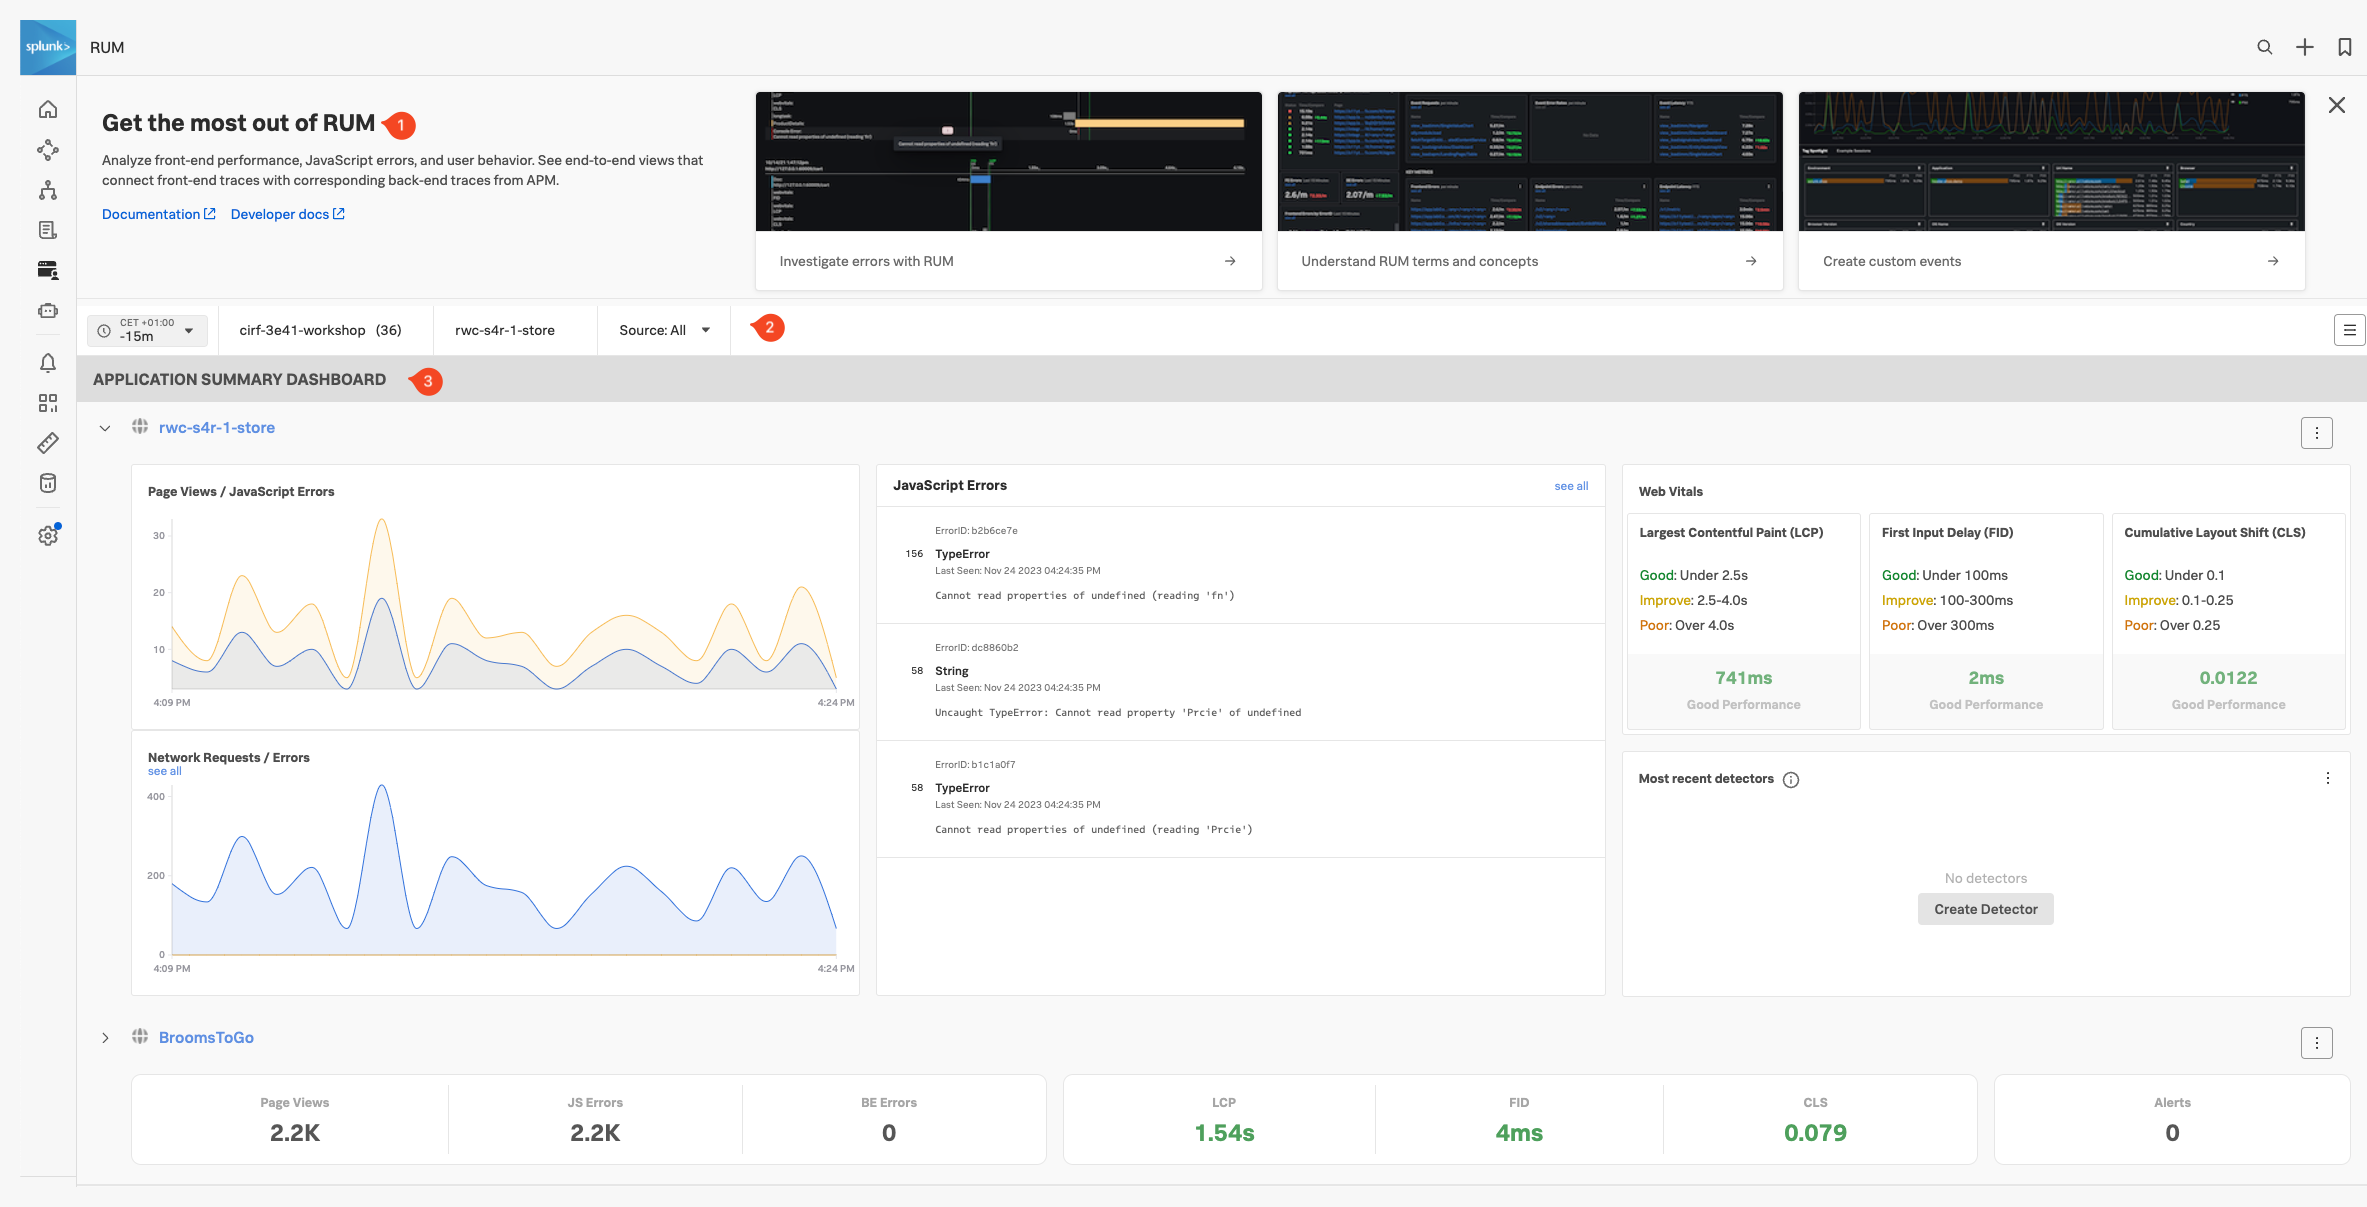
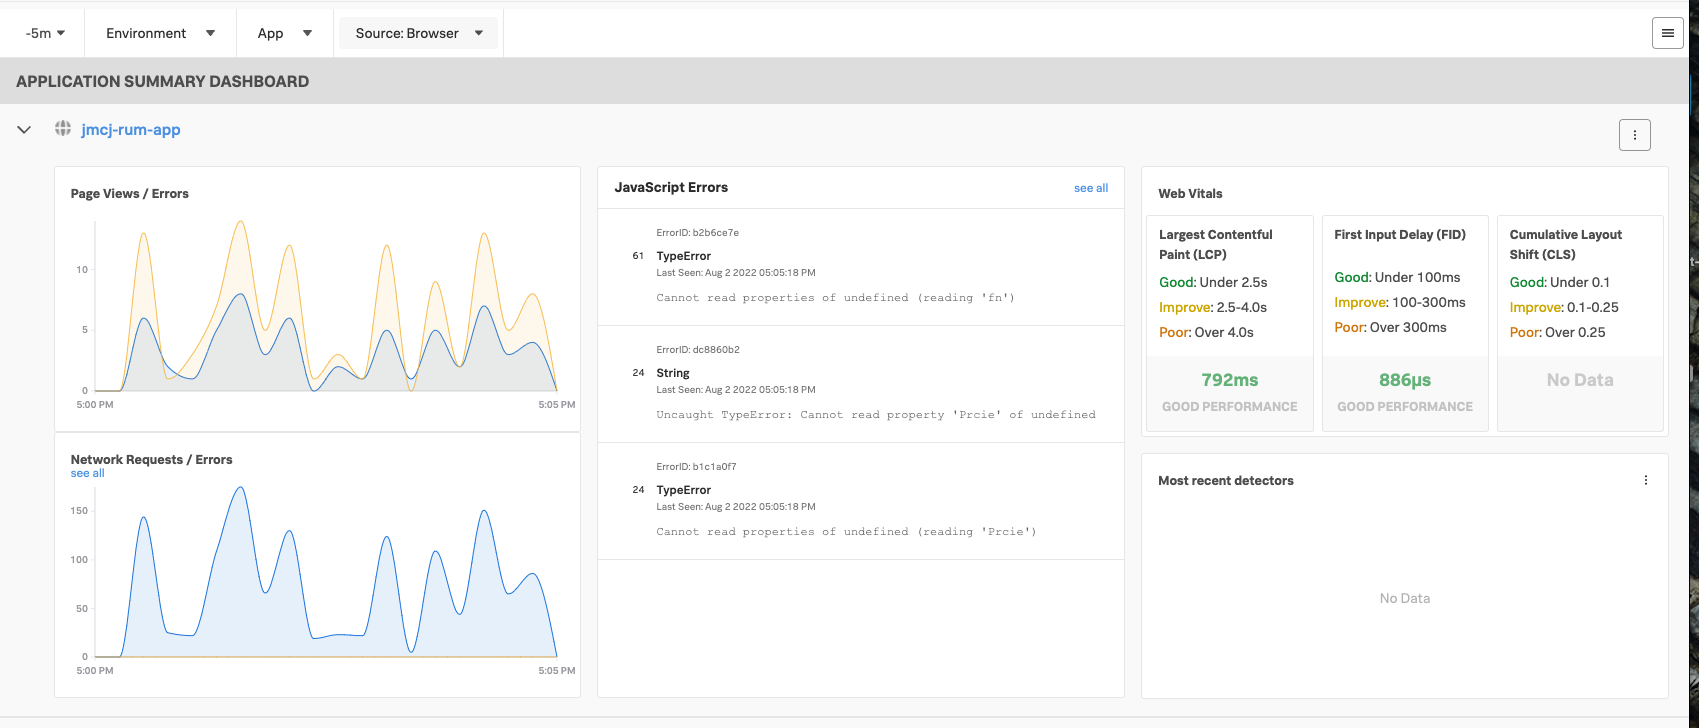
Click RUM in the main menu, this will bring you to the main RUM Home or Landing page. The main concept of this page is to provide you at a glance, the overall status of all selected RUM applications, either in a full dashboard or the compact view.
Independent of the type of Status Dashboard used, the RUM Home Page is made up of 3 distinct sections:
Onboarding Pane: Training videos and links to documentation to get you started with Splunk RUM. (You can hide this pane in case you need the screen real estate).
Filter Pane: Filter on the time frame, environment, application and source type.
Application Summary Pane: Summary of all your applications that send RUM data.
RUM Environments & Application and Source Type
Splunk Observability uses the environments Tag that is sent as part of the RUM trace, (created with every interaction with your website or Mobile App), to separate data coming from different environments like “Production” or “Development”.
A further separation can be made by the Applications Tag. This allows you to distinguish between separate browser/mobile applications running in the same environment.
Splunk RUM is available for both browser and mobile applications, you could use Source Type to distinguish between them, however for this workshop, we will only use browser-based RUM.
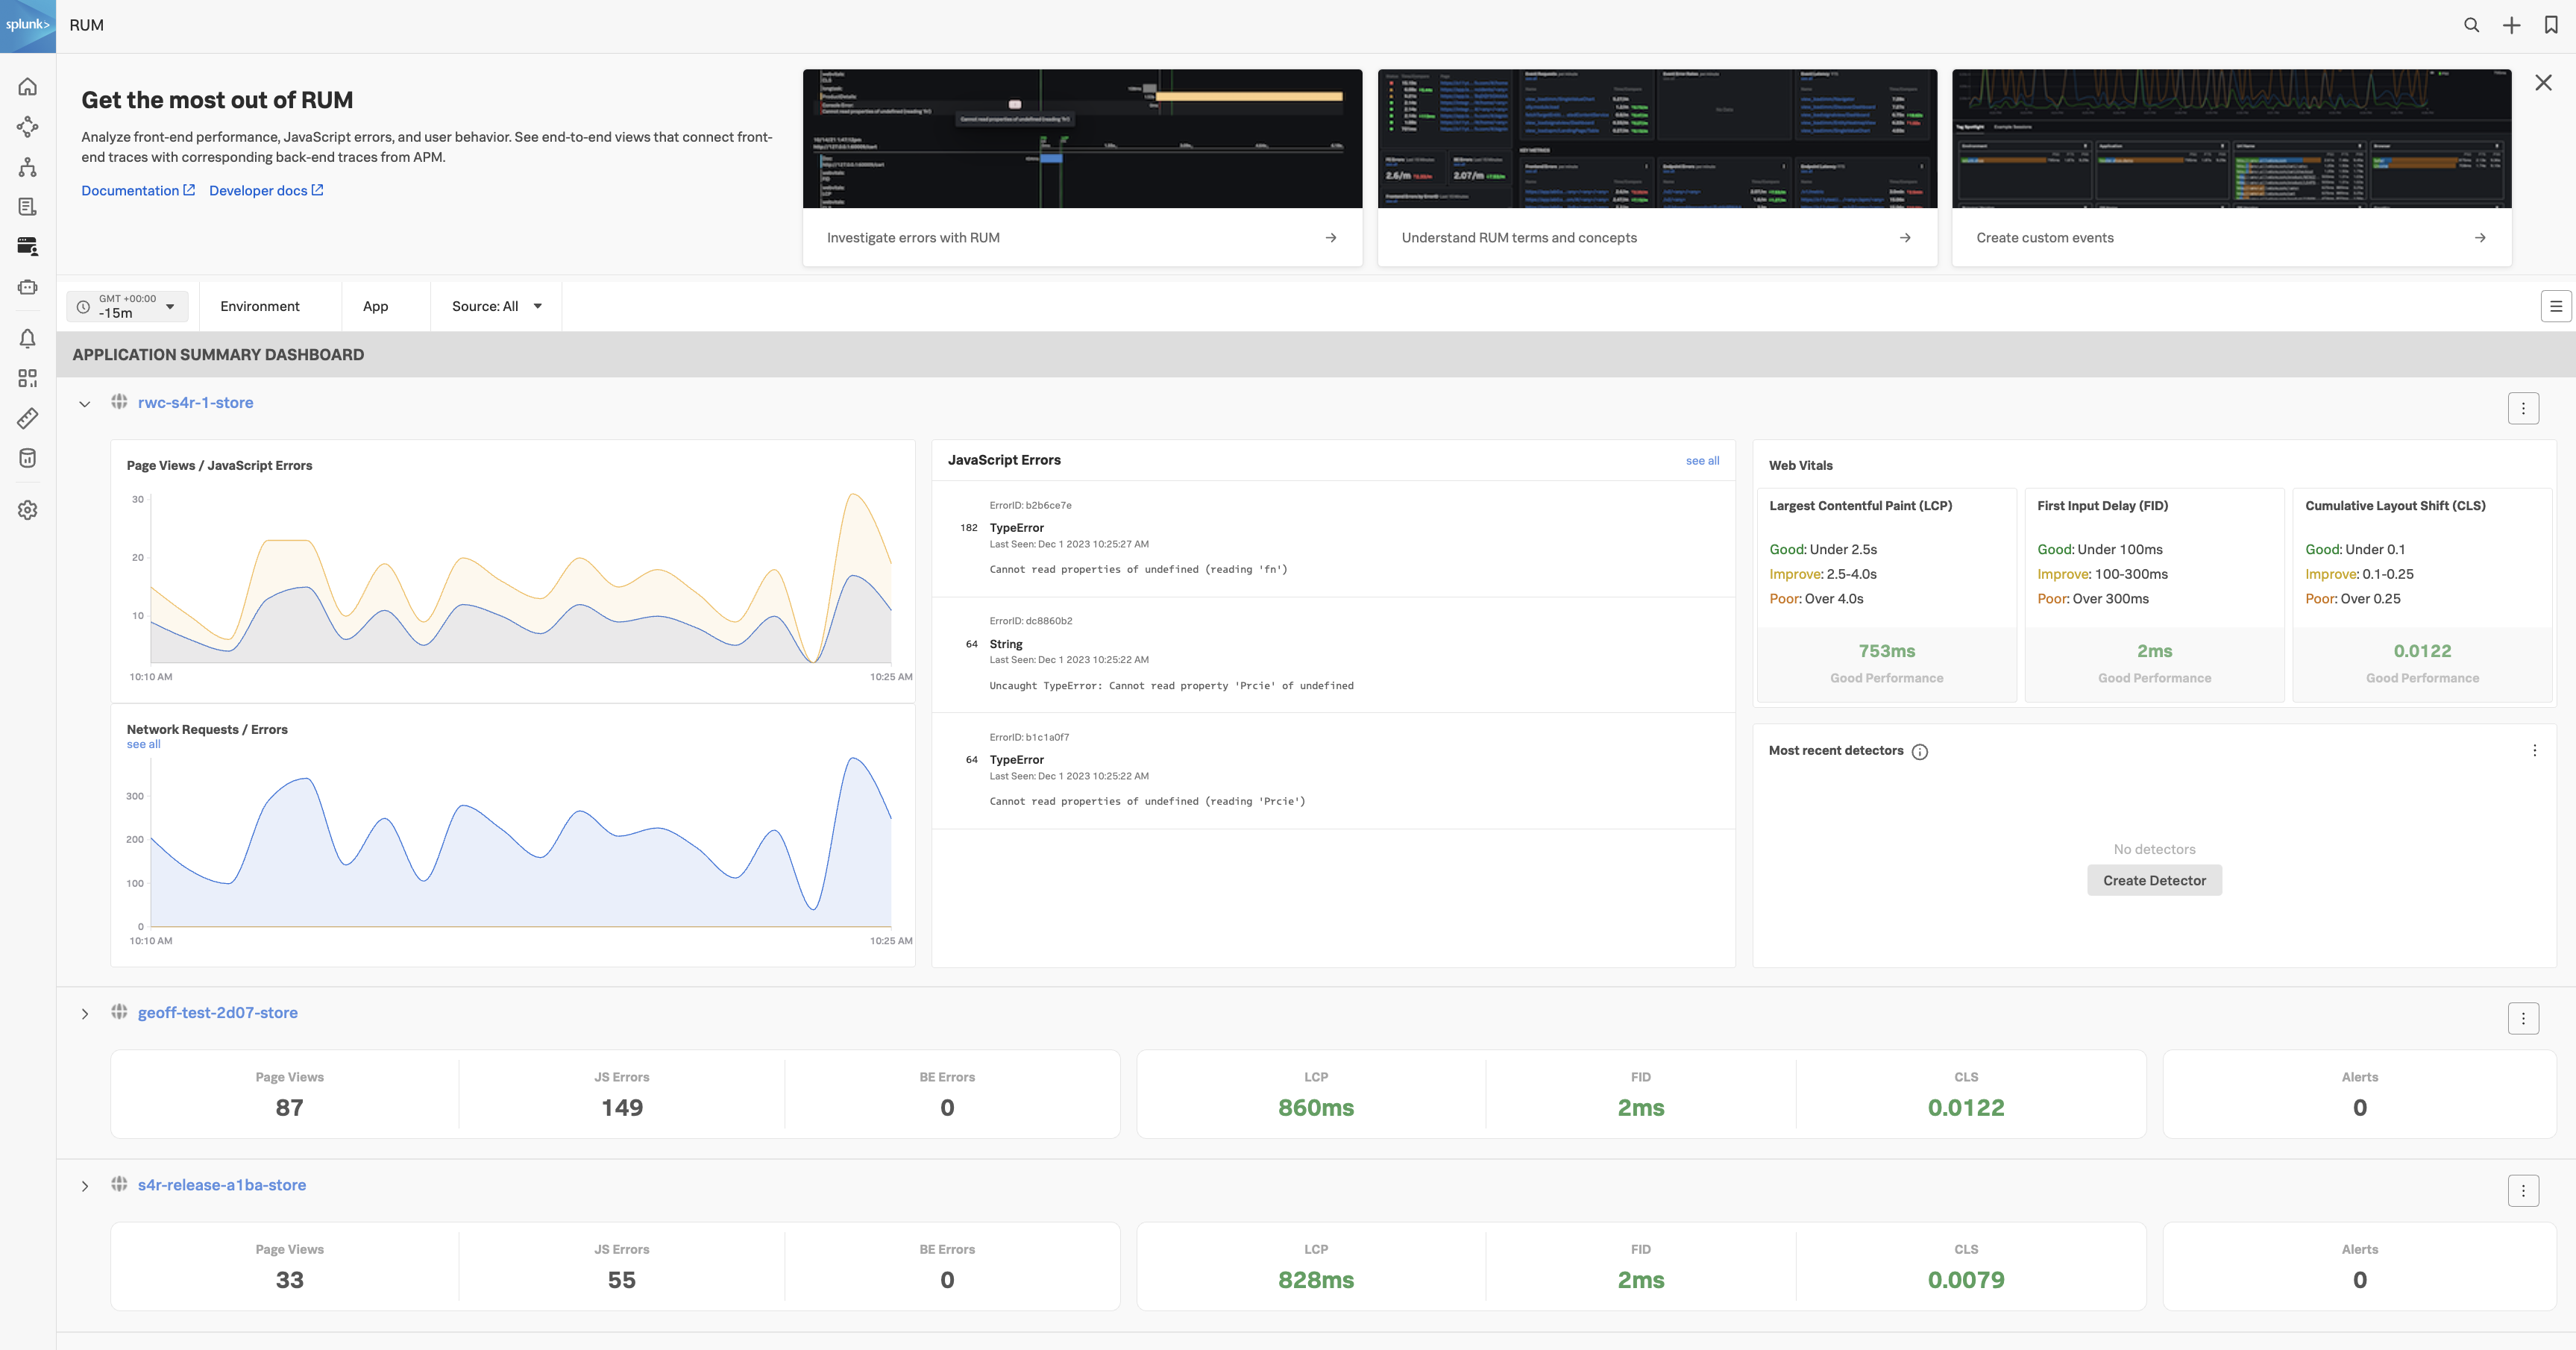
Exercise
Ensure the time window is set to -15m
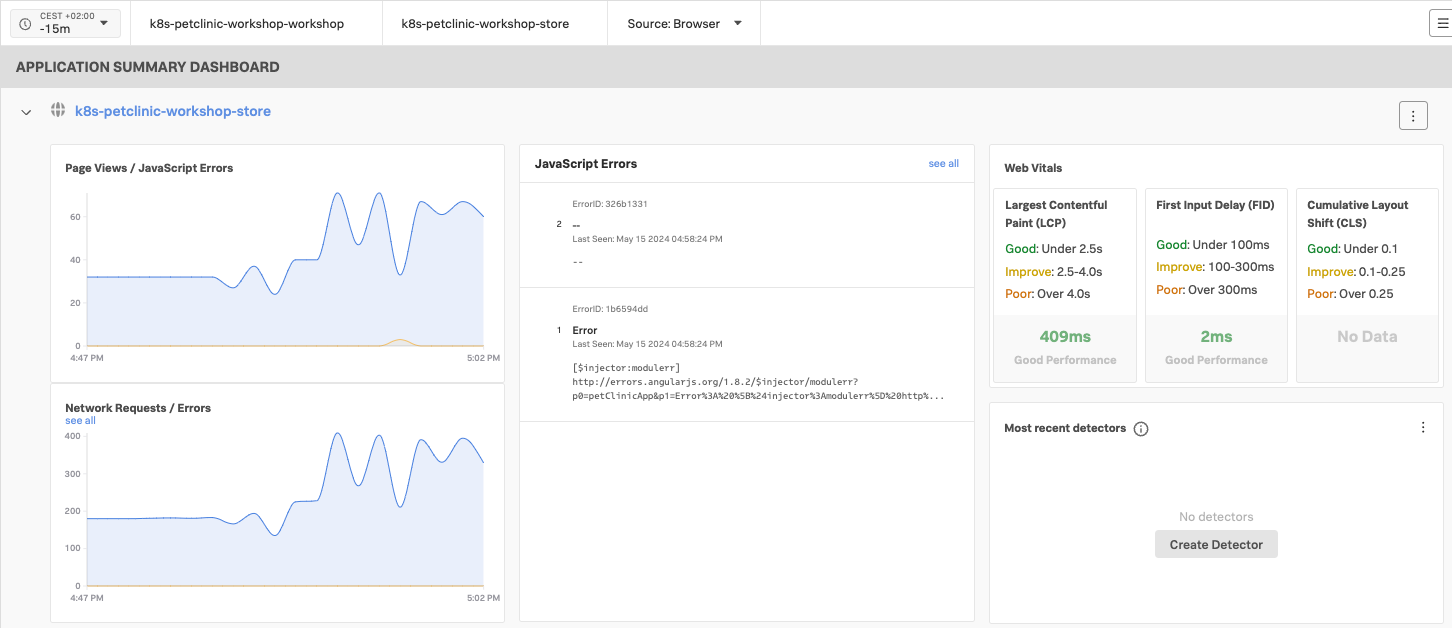
Select the environment for your workshop from the drop-down box. The naming convention is [NAME OF WORKSHOP]-workshop (Selecting this will make sure the workshop RUM application is visible)
Select the App name. There the naming convention is [NAME OF WORKSHOP]-store and leave Source set to All
In the JavaScript Errors tile click on the TypeError entry that says: Cannot read properties of undefined (reading ‘Prcie’) to see more details. Note that you are given a quick indication of what part of the website the error occurred, allowing you to fix this quickly.
Close the pane.
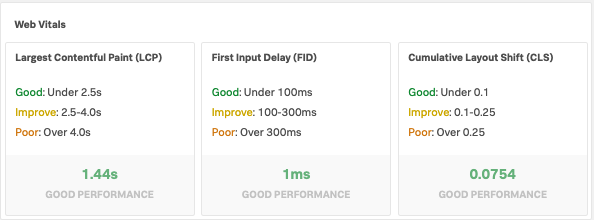
The 3rd tile reports Web Vitals, a metric that focuses on three important aspects of the user experience: loading, interactivity, and visual stability.
Based on the Web Vitals metrics, how do you rate the current web performance of the site?
According to the Web Vitals Metrics, the initial load of the site is OK and is rated Good
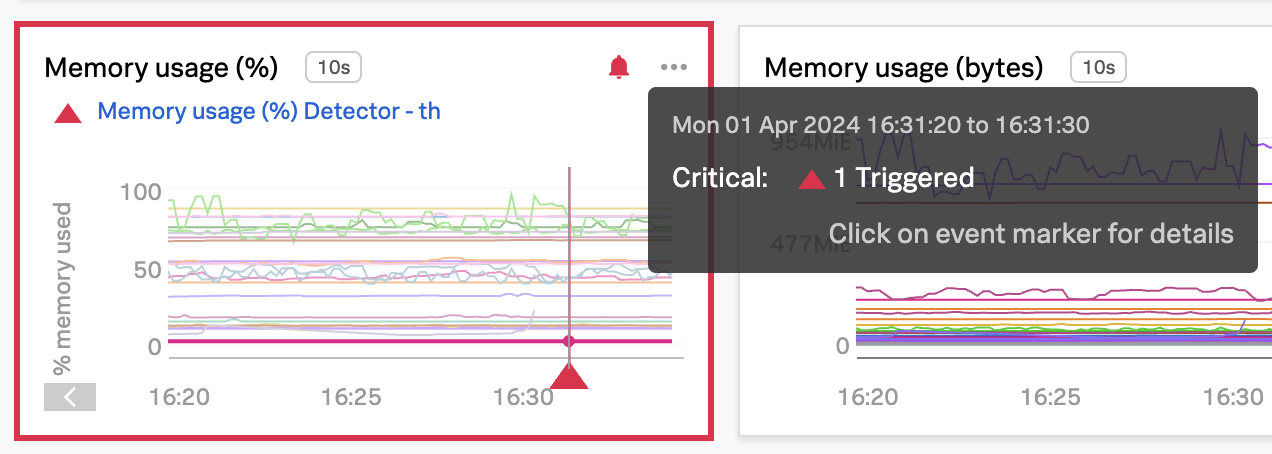
The last tile, Most recent detectors tile, will show if any alerts have been triggered for the application.
Click on the down ⌵ arrow in front of the Application name to toggle the view to the compact style. Note that you have all the main information available in this view as well. Click anywhere in the compact view to go back to the full view.
Next, let’s check out Splunk Application Performance Monitoring (APM).
Application Performance Monitoring Overview
5 minutes
Splunk APM provides a NoSample™ end-to-end visibility of every service and its dependency to solve problems quicker across monoliths and microservices. Teams can immediately detect problems from new deployments, confidently troubleshoot by scoping and isolating the source of an issue, and optimize service performance by understanding how back-end services impact end users and business workflows.
Real-time monitoring and alerting: Splunk provides out-of-the-box service dashboards and automatically detects and alerts on RED metrics (rate, error and duration) when there is a sudden change.
Dynamic telemetry maps: Easily visualize service performance in modern production environments in real-time. End-to-end visibility of service performance from infrastructure, applications, end users, and all dependencies helps quickly scope new issues and troubleshoot more effectively. Intelligent tagging and analysis: View all tags from your business, infrastructure and applications in one place to easily compare new trends in latency or errors to their specific tag values. AI-directed troubleshooting identifies the most impactful issues: Instead of manually digging through individual dashboards, isolate problems more efficiently. Automatically identify anomalies and the sources of errors that impact services and customers the most. Complete distributed tracing analyses every transaction: Identify problems in your cloud-native environment more effectively. Splunk distributed tracing visualizes and correlates every transaction from the back-end and front-end in context with your infrastructure, business workflows and applications. Full stack correlation: Within Splunk Observability, APM links traces, metrics, logs and profiling together to easily understand the performance of every component and its dependency across your stack. Monitor database query performance: Easily identify how slow and high execution queries from SQL and NoSQL databases impact your services, endpoints and business workflows — no instrumentation required.
Subsections of Application Performance Monitoring Overview
Application Performance Monitoring Home page
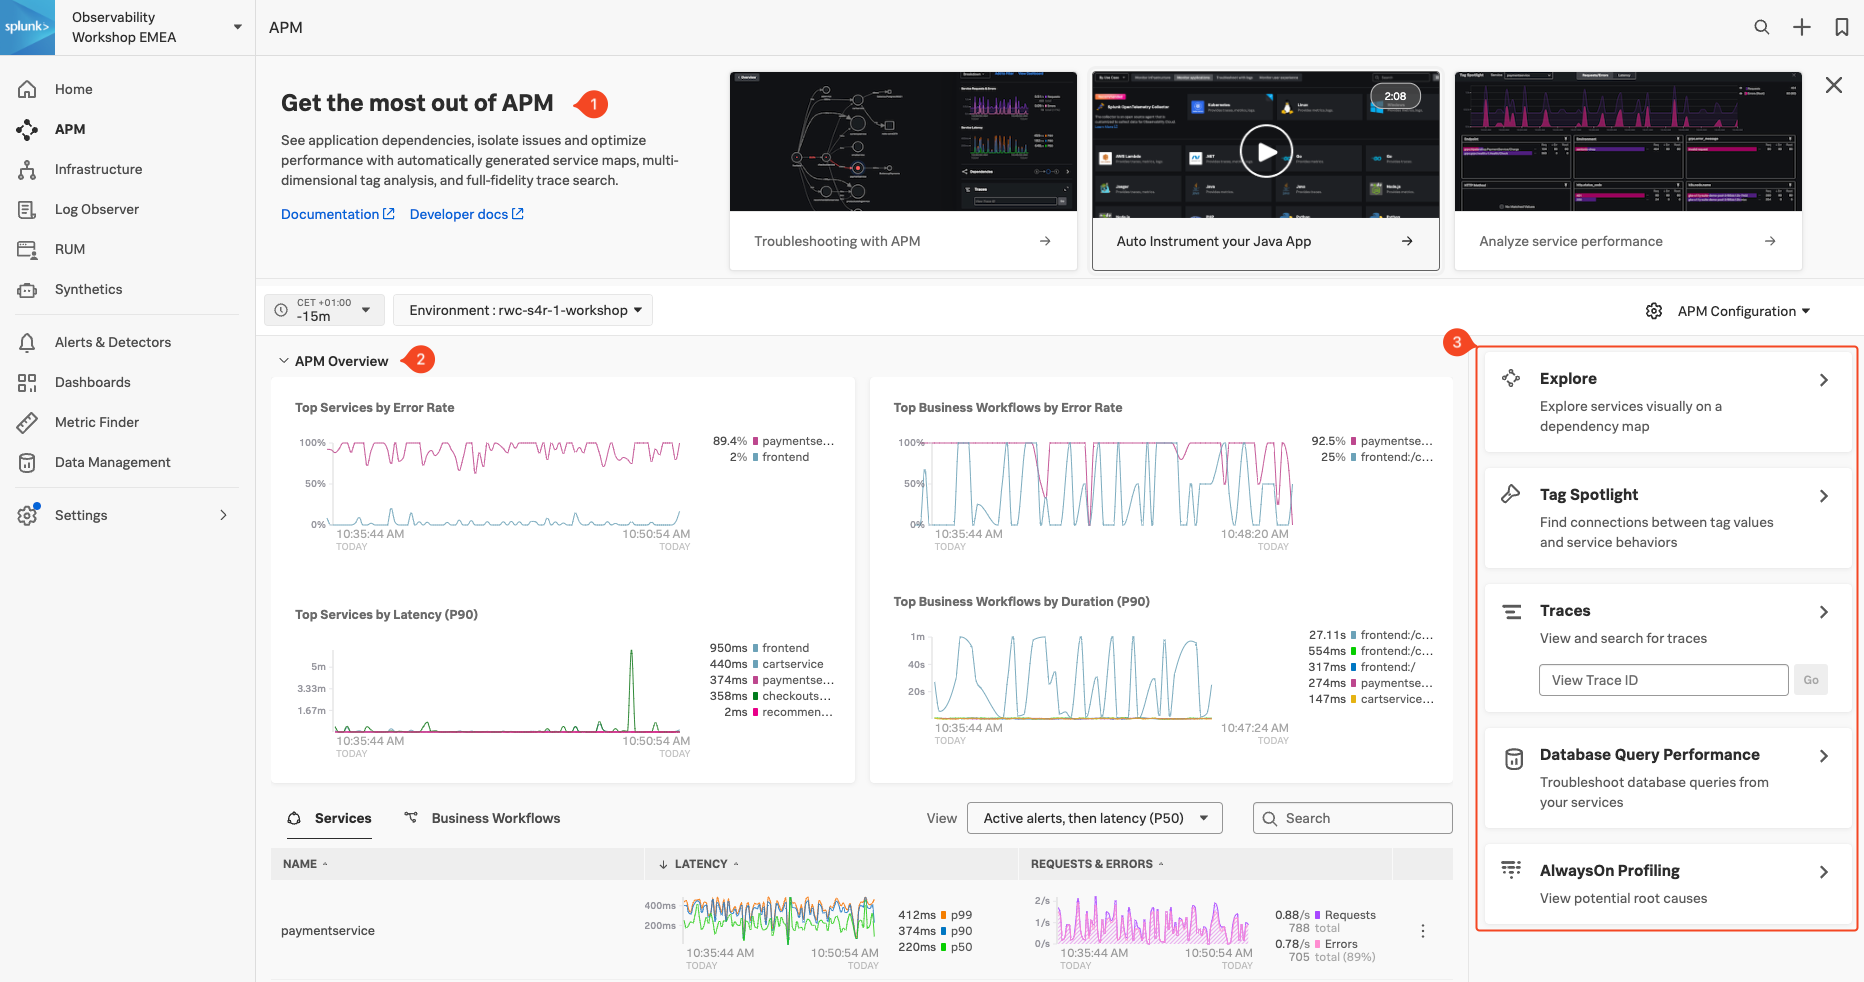
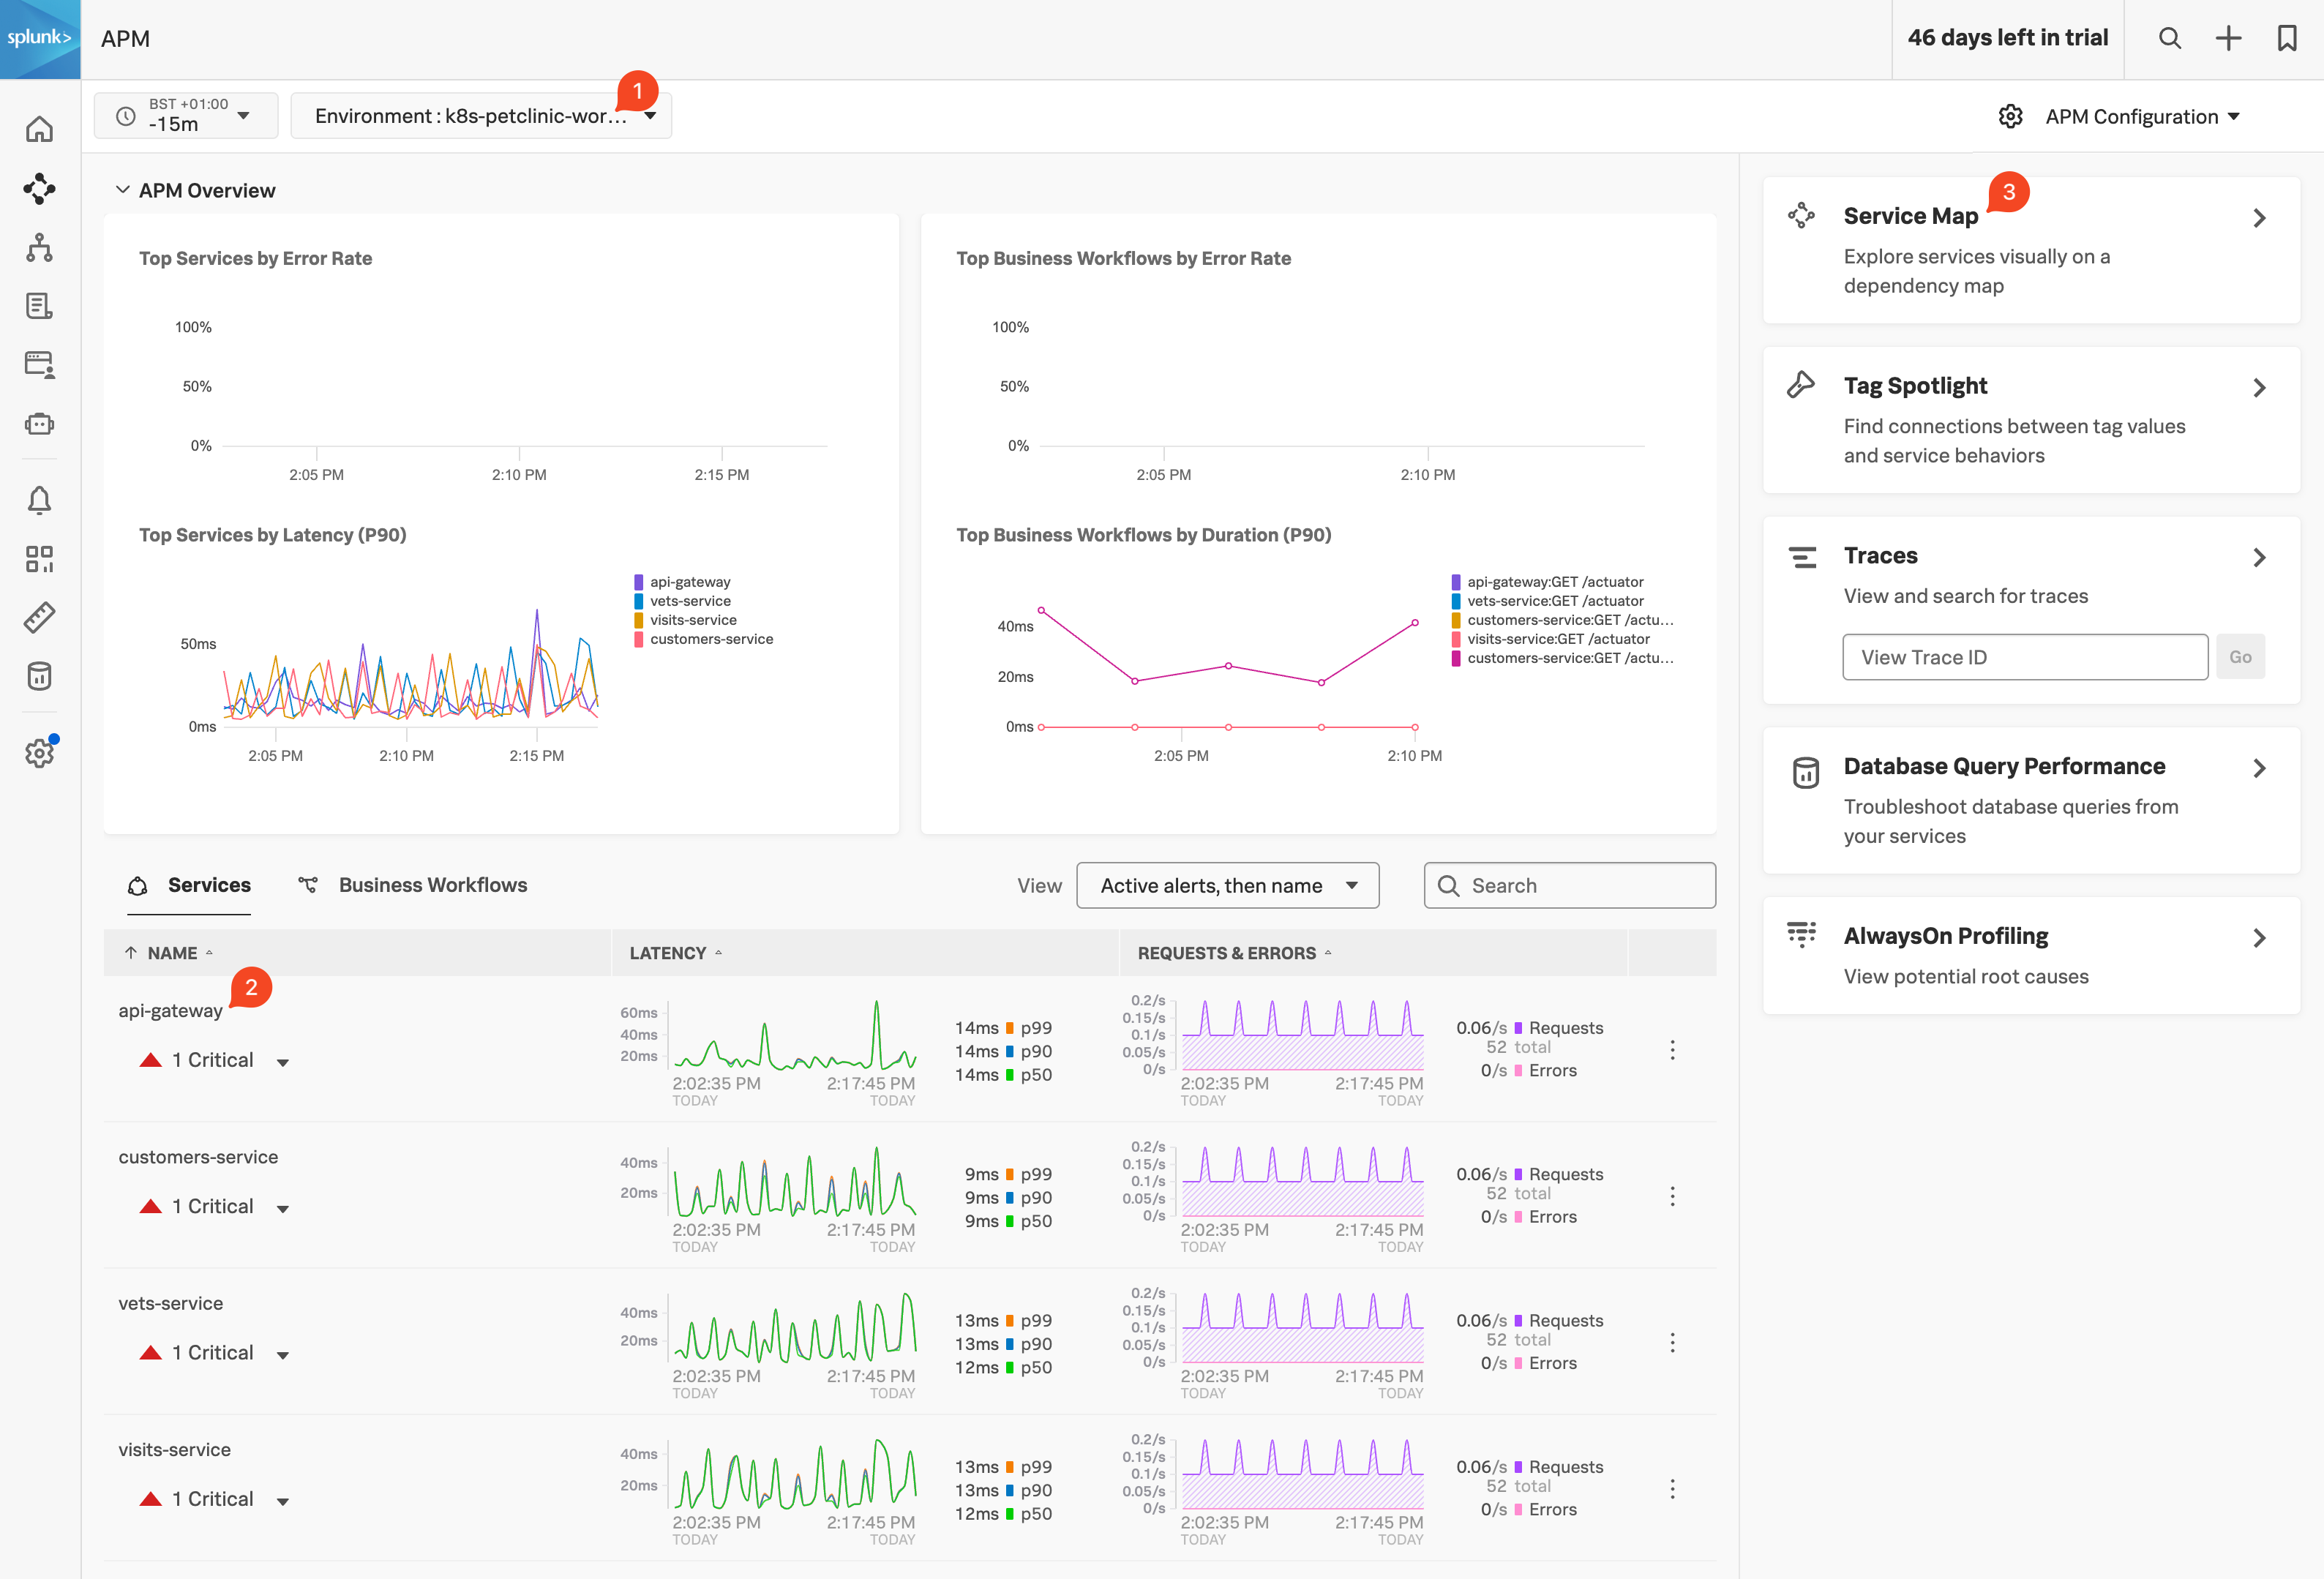
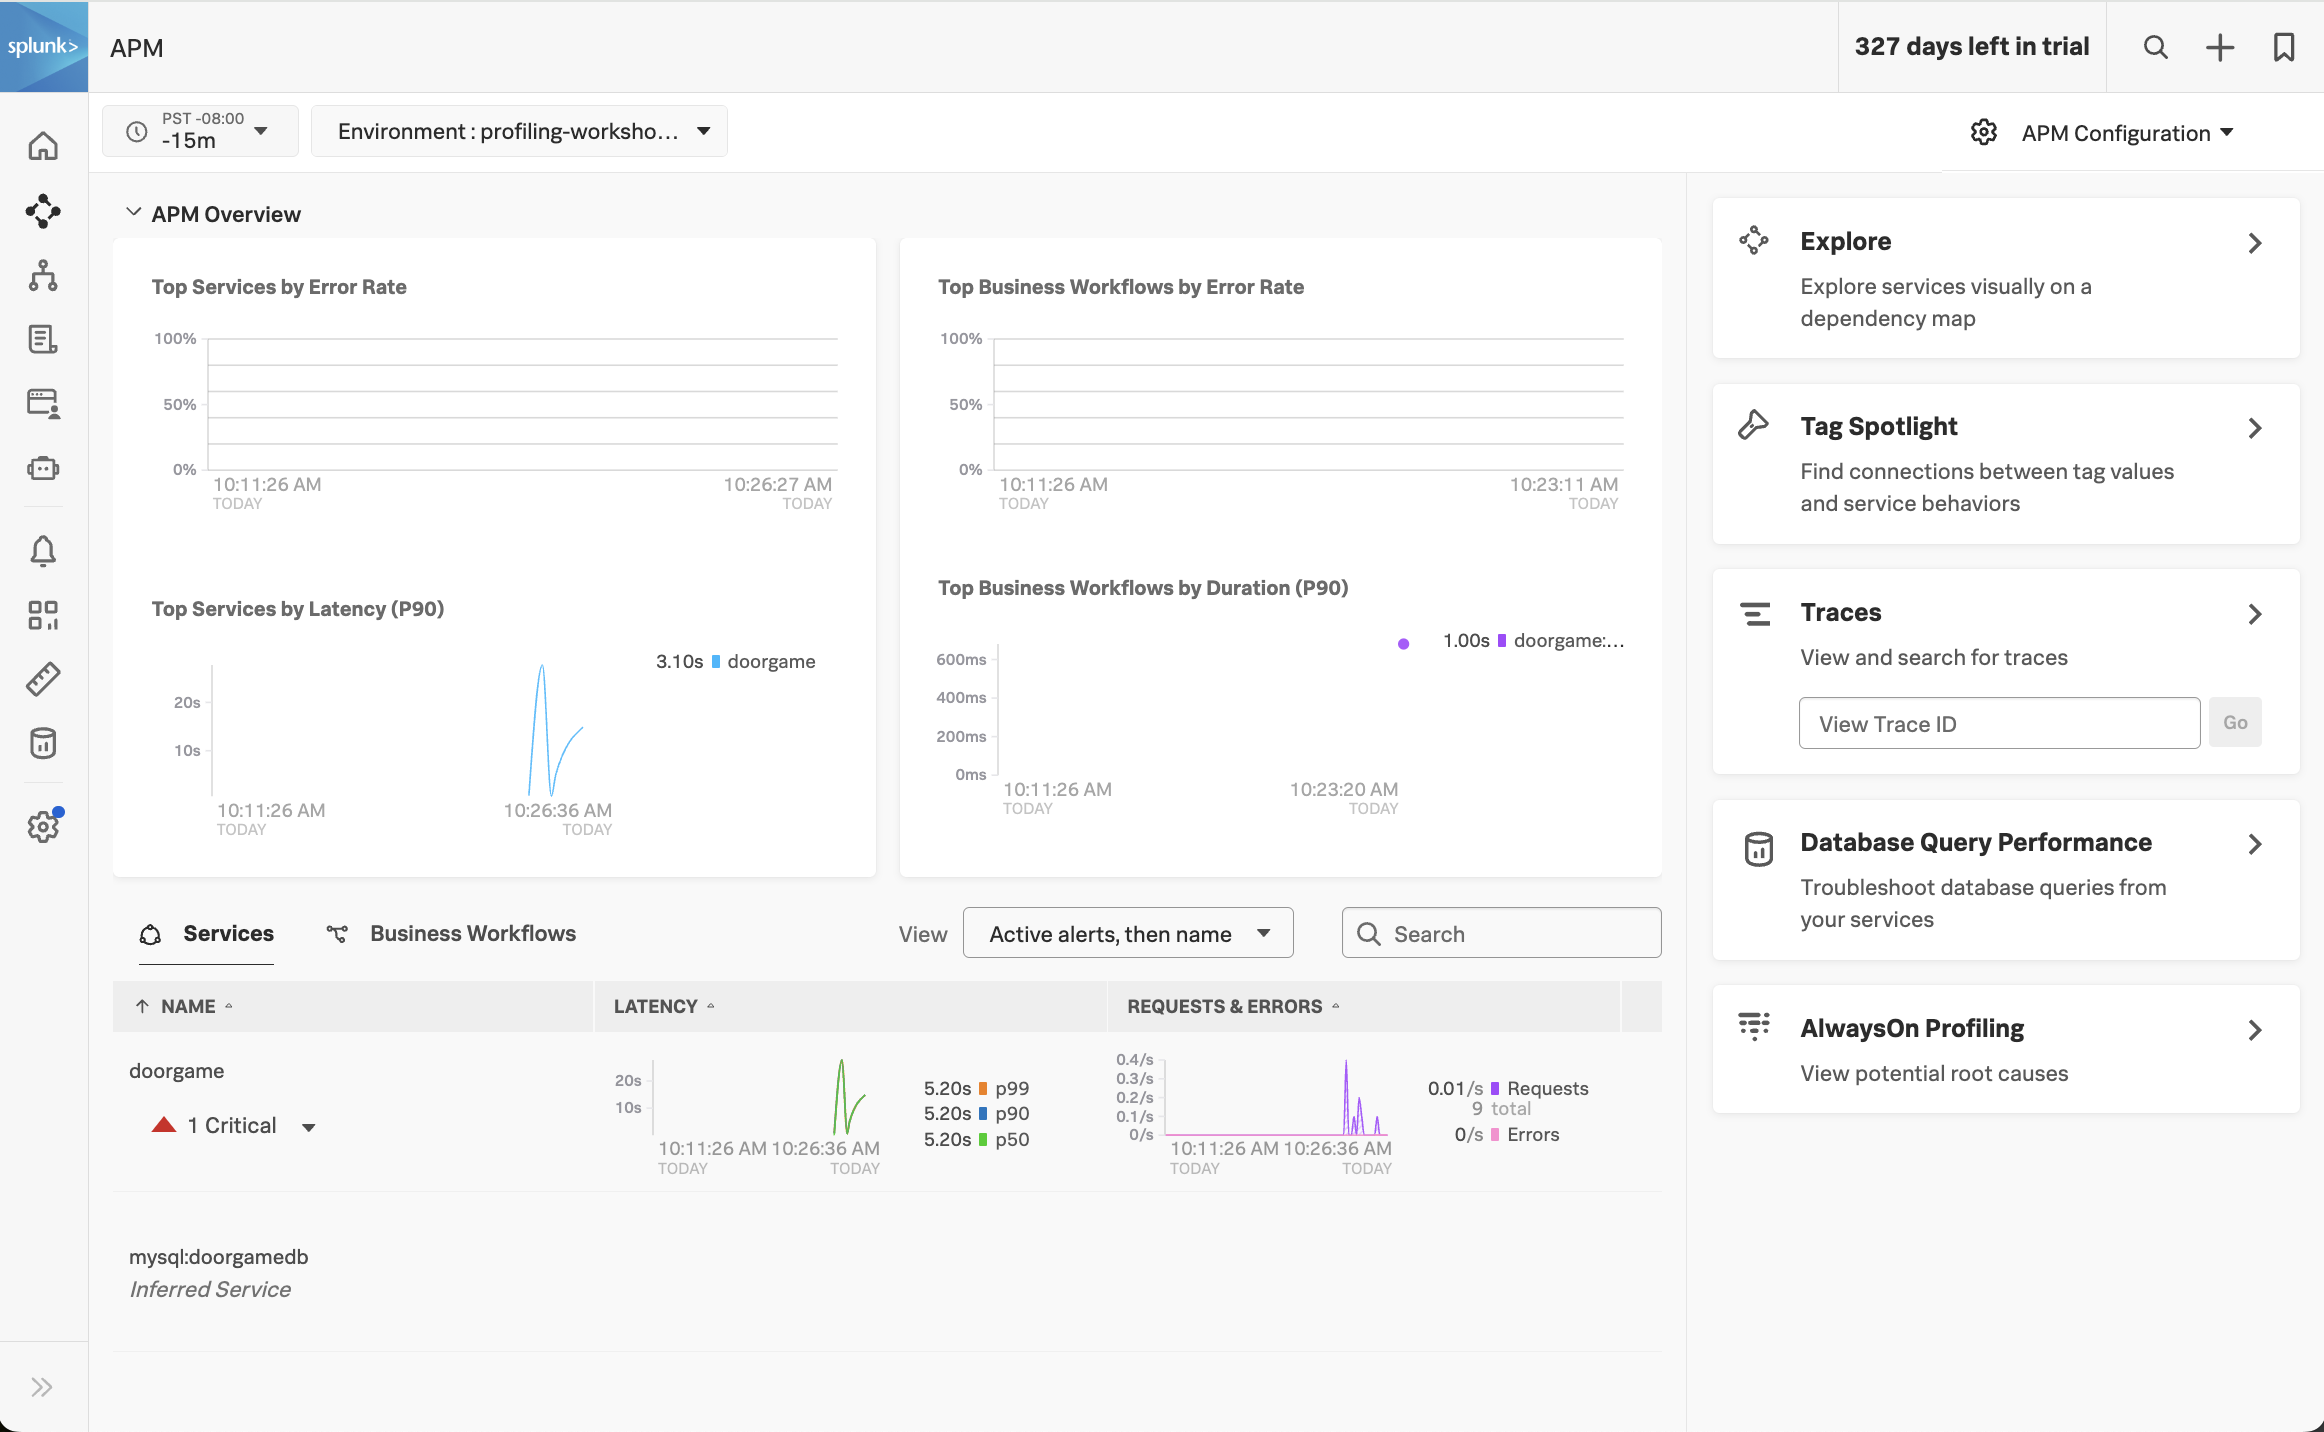
Click APM in the main menu, the APM Home Page is made up of 3 distinct sections:
Onboarding Pane Pane: Training videos and links to documentation to get you started with Splunk APM.
APM Overview Pane: Real-time metrics for the Top Services and Top Business Workflows.
Functions Pane: Links for deeper analysis of your services, tags, traces, database query performance and code profiling.
The APM Overview pan provides a high-level view of the health of your application. It includes a summary of the services, latency and errors in your application. It also includes a list of the top services by error rate and the top business workflows by error rate (a business workflow is the start-to-finish journey of the collection of traces associated with a given activity or transaction and enables monitoring of end-to-end KPIs and identifying root causes and bottlenecks).
About Environments
To easily differentiate between multiple applications, Splunk uses environments. The naming convention for workshop environments is [NAME OF WORKSHOP]-workshop. Your instructor will provide you with the correct one to select.
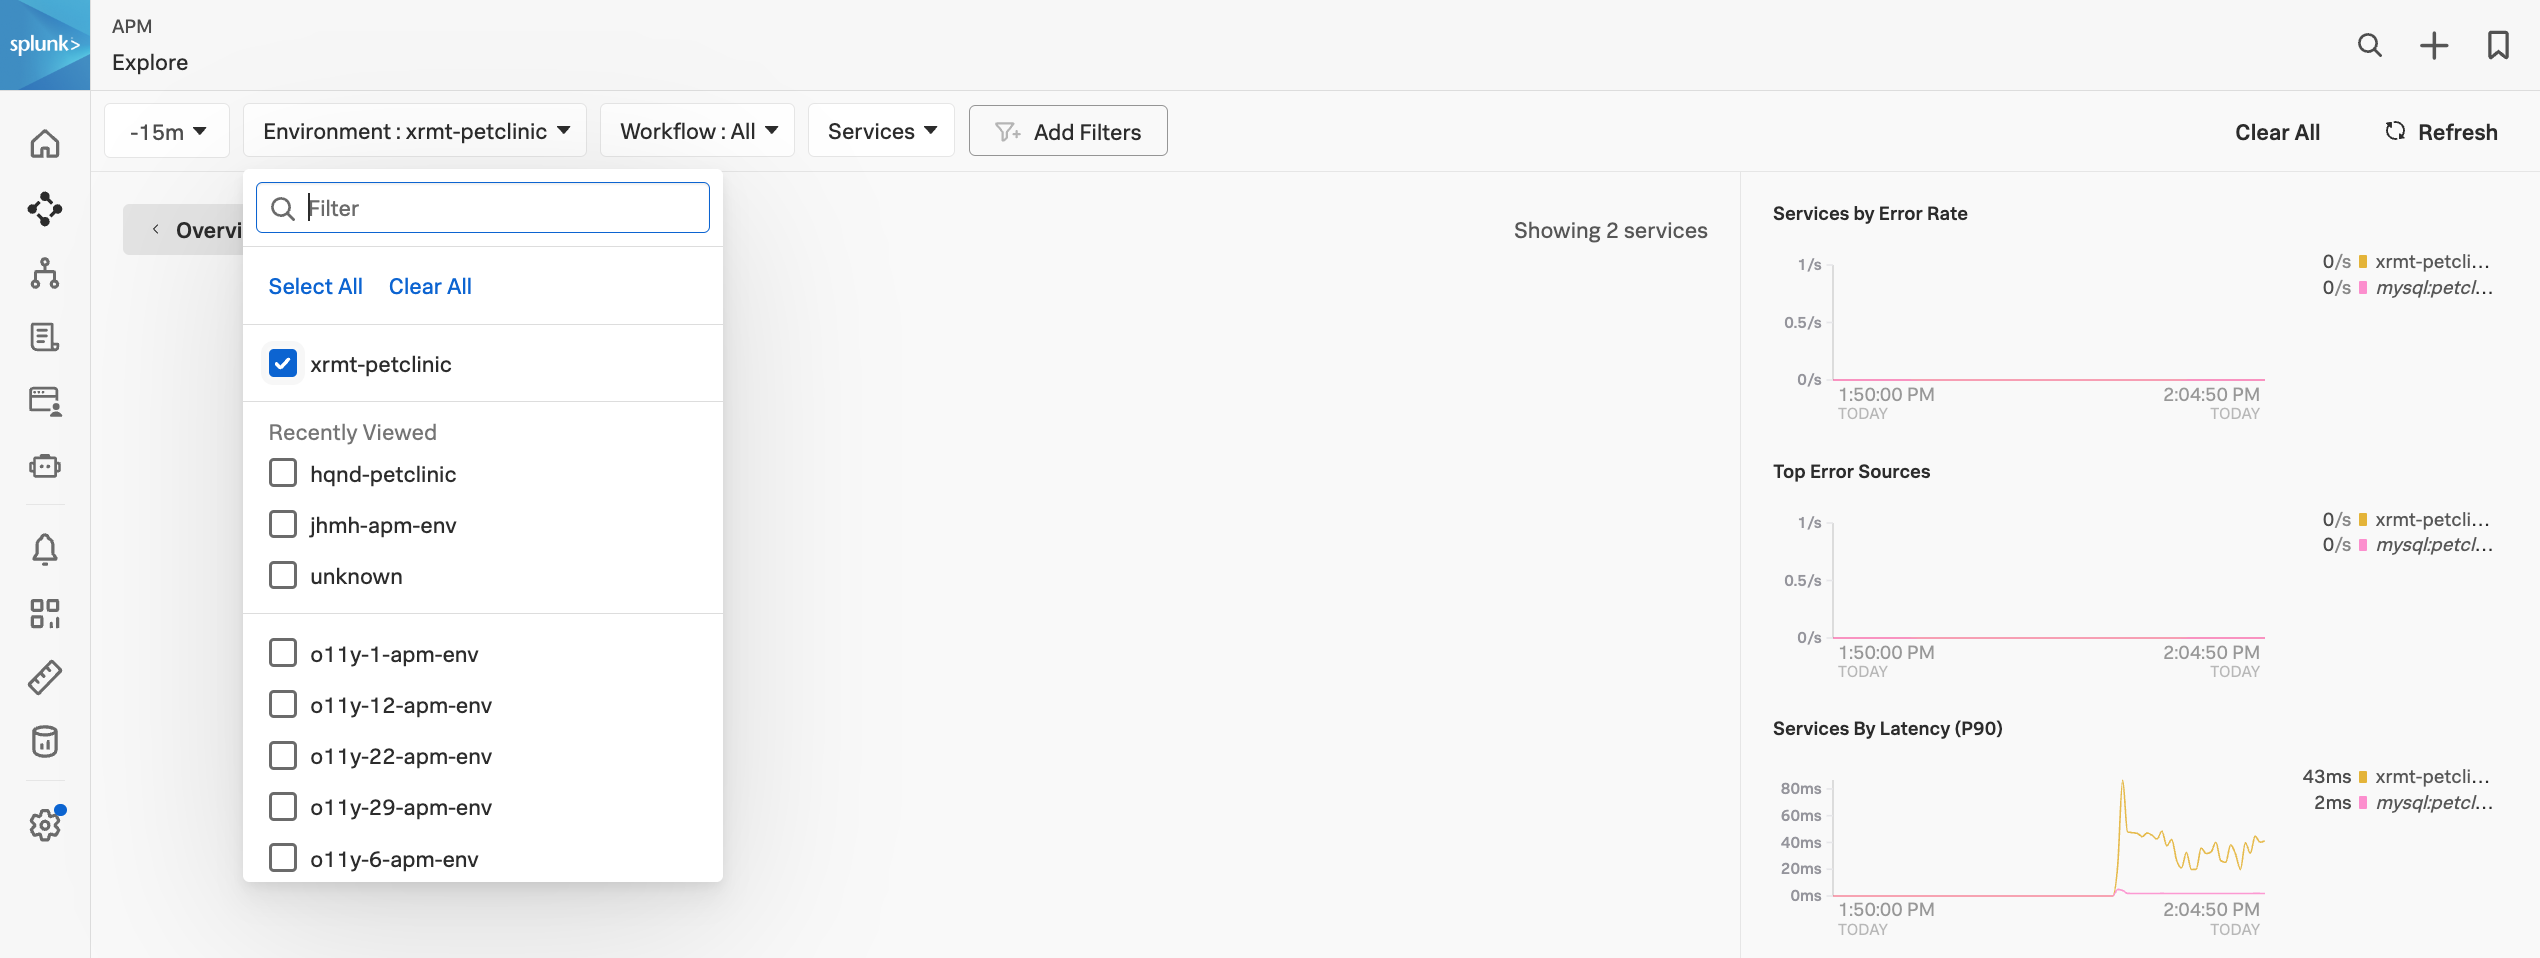
Exercise
Verify that the time window we are working with is set to the last 15 minutes (-15m).
Change the environment to the workshop one by selecting its name from the drop-down box and make sure that is the only one selected.
What can you conclude from the Top Services by Error Rate chart?
The paymentservice has a high error rate
If you scroll down the Overview Page you will notice some services listed have Inferred Service next to them.
Splunk APM can infer the presence of the remote service, or inferred service if the span calling the remote service has the necessary information. Examples of possible inferred services include databases, HTTP endpoints, and message queues. Inferred services are not instrumented, but they are displayed on the service map and the service list.
Next, let’s check out Splunk Log Observer (LO).
Log Observer Overview
5 minutes
Log Observer Connect allows you to seamlessly bring in the same log data from your Splunk Platform into an intuitive and no-code interface designed to help you find and fix problems quickly. You can easily perform log-based analysis and seamlessly correlate your logs with Splunk Infrastructure Monitoring’s real-time metrics and Splunk APM traces in one place.
End-to-end visibility: By combining the powerful logging capabilities of Splunk Platform with Splunk Observability Cloud’s traces and real-time metrics for deeper insights and more context of your hybrid environment. Perform quick and easy log-based investigations: By reusing logs that are already ingested in Splunk Cloud Platform or Enterprise in a simplified and intuitive interface (no need to know SPL!) with customizable and out-of-the-box dashboards Achieve higher economies of scale and operational efficiency: By centralizing log management across teams, breaking down data and team silos, and getting better overall support
Subsections of Log Observer Overview
Log Observer Home Page
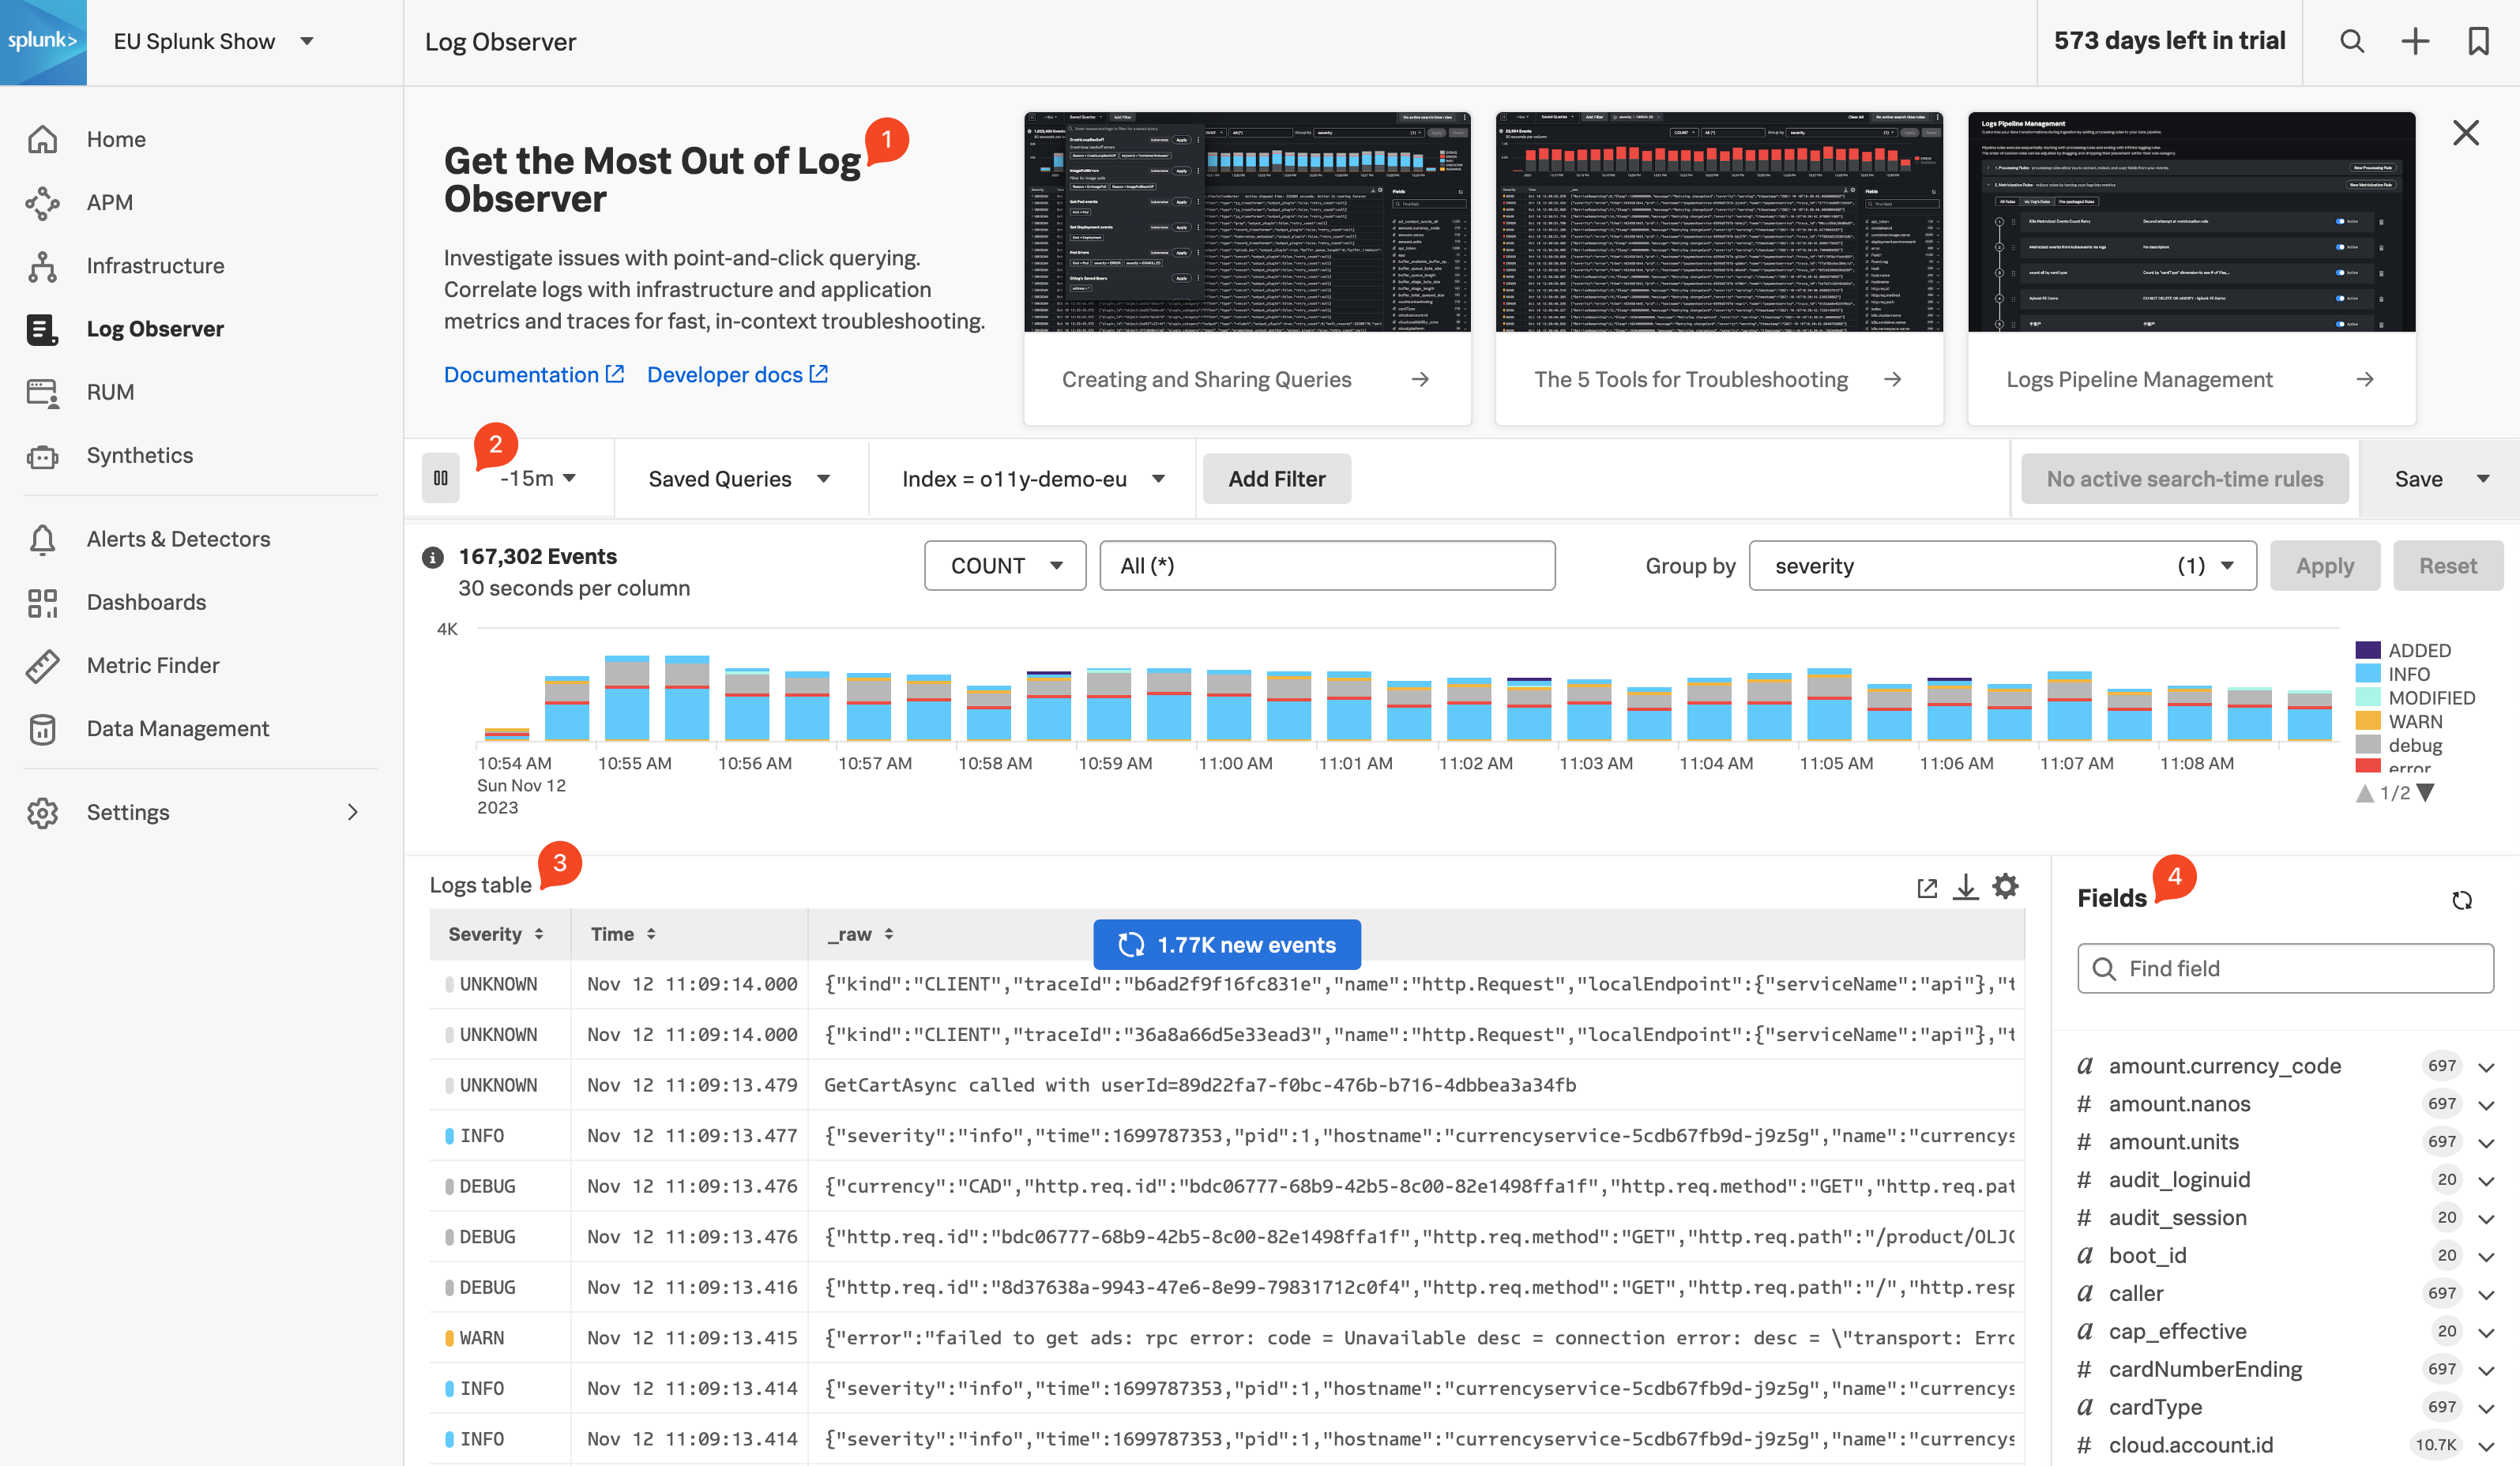
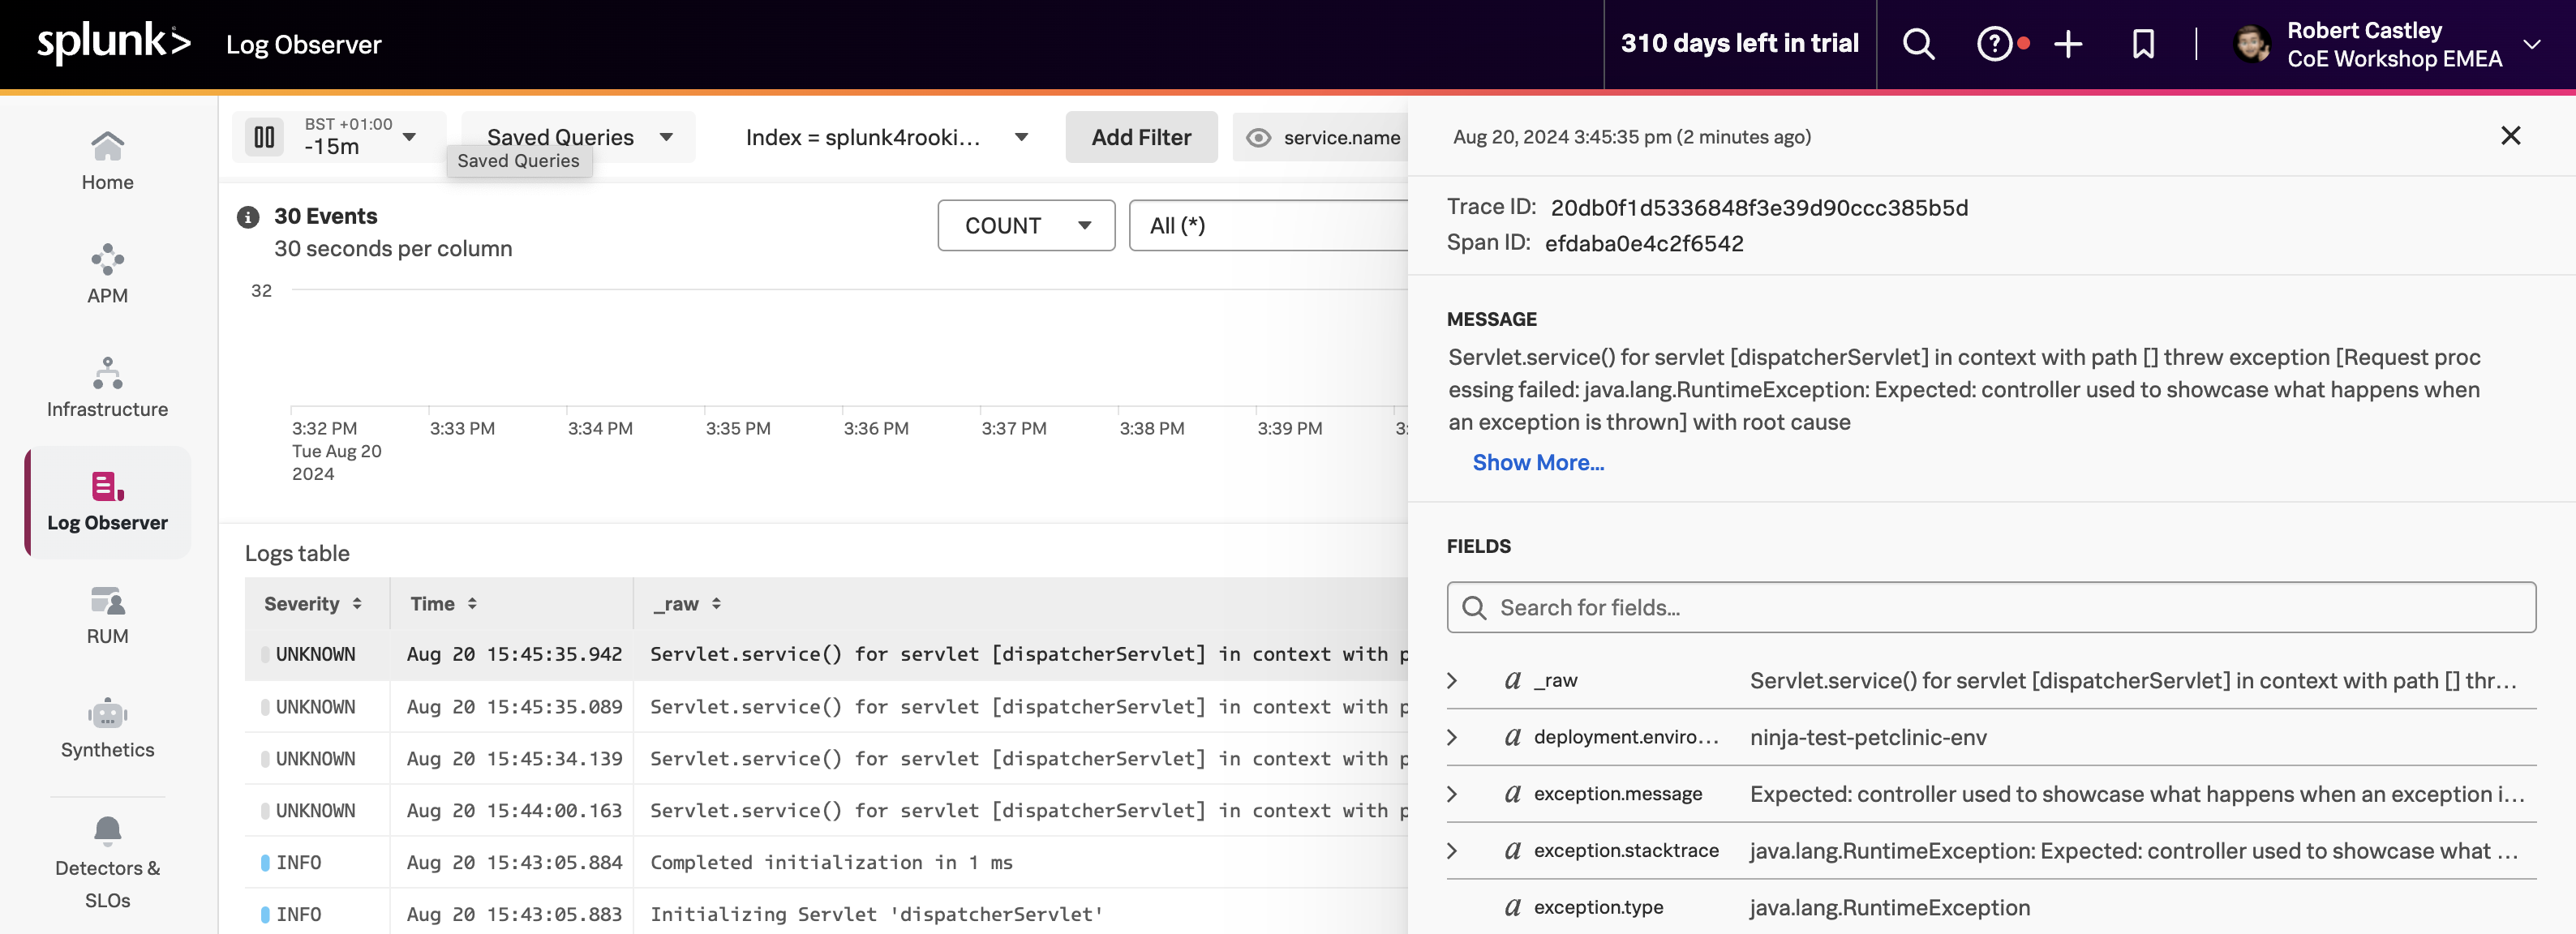
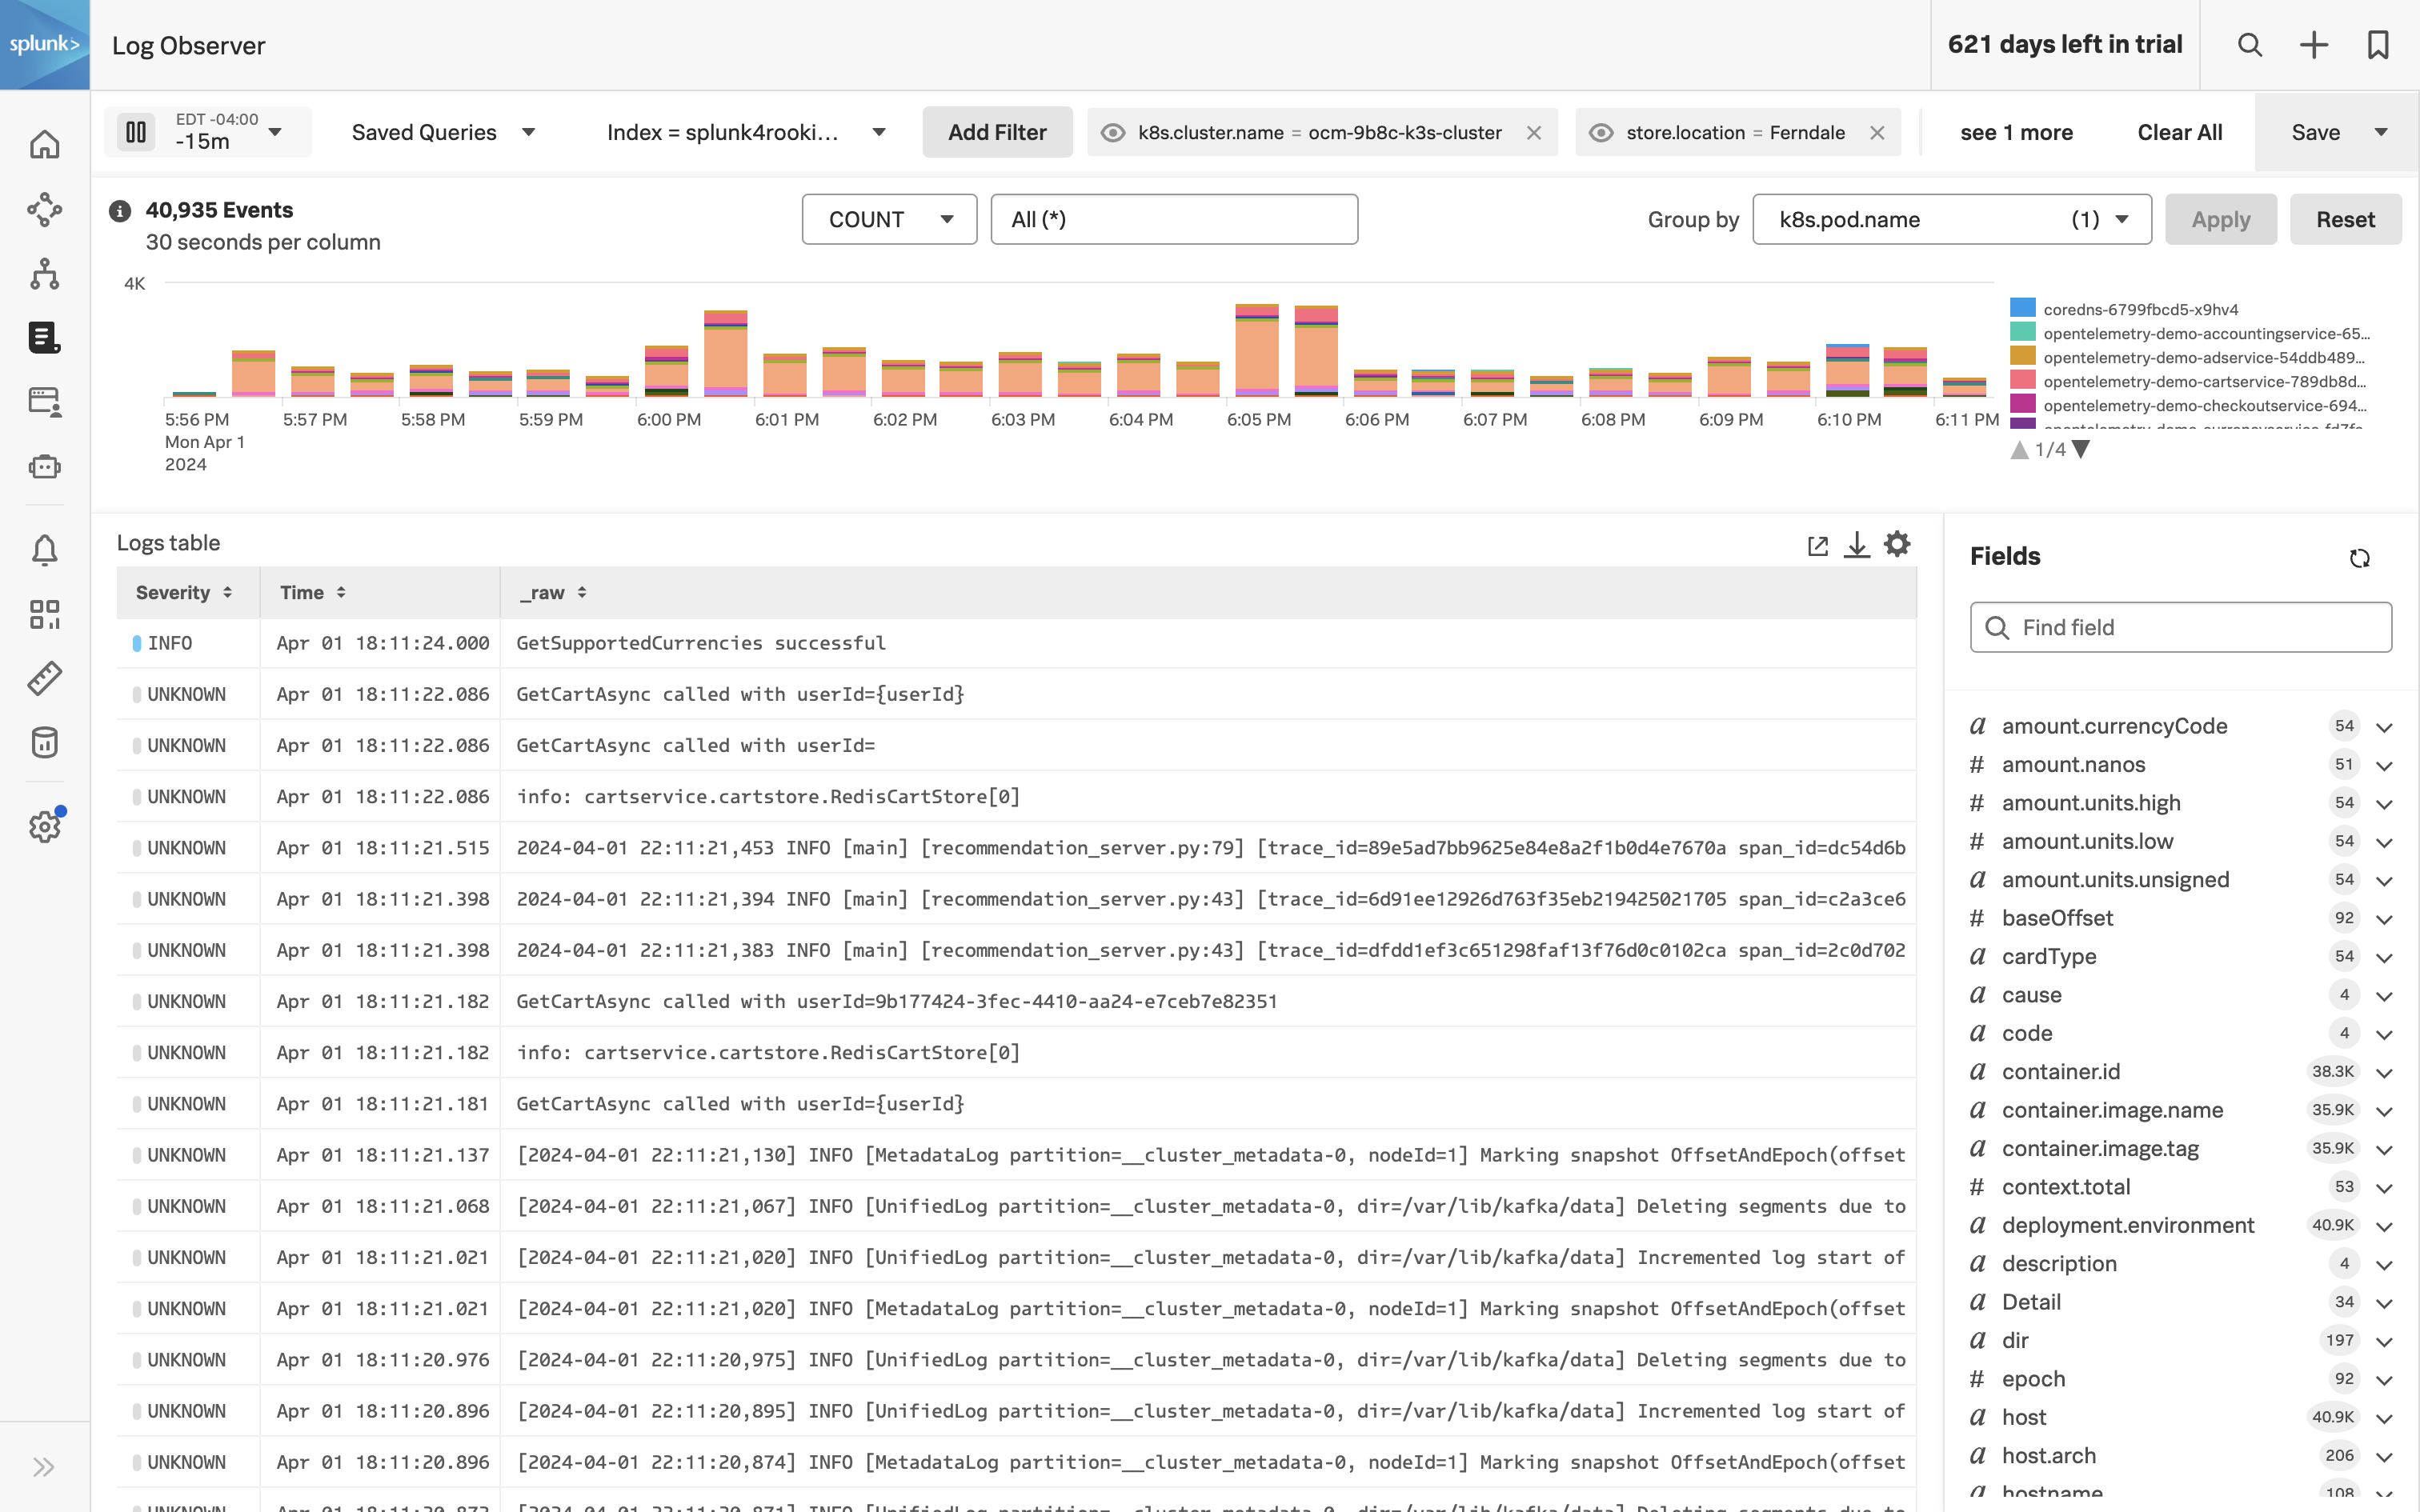
Click Log Observer in the main menu, the Log Observer Home Page is made up of 4 distinct sections:
Onboarding Pane: Training videos and links to documentation to get you started with Splunk Log Observer.
Filter Bar: Filter on time, indexes, and fields and also Save Queries.
Logs Table Pane: List of log entries that match the current filter criteria.
Fields Pane: List of fields available in the currently selected index.
Splunk indexes
Generally, in Splunk, an “index” refers to a designated place where your data is stored. It’s like a folder or container for your data. Data within a Splunk index is organized and structured in a way that makes it easy to search and analyze. Different indexes can be created to store specific types of data. For example, you might have one index for web server logs, another for application logs, and so on.
Tip
If you have used Splunk Enterprise or Splunk Cloud before, you are probably used to starting investigations with logs. As you will see in the following exercise, you can do that with Splunk Observability Cloud as well. This workshop, however, will use all the OpenTelemetry signals for investigations.
Let’s run a little search exercise:
Exercise
Set the time frame to -15m.
Click on Add Filter in the filter bar then click on Fields in the dialog.
Type in cardType and select it.
Under Top values click on visa, then click on = to add it to the filter.
Click on one of the log entries in the Logs table to validate that the entry contains cardType: "visa".
Let’s find all the orders that have been shipped. Click on Clear All in the filter bar to remove the previous filter.
Click again on Add Filter in the filter bar, then select Keyword. Next just type order: in the Enter Keyword… box and press enter.
You should now only have log lines that contain the word “order:”. There are still a lot of log lines, so let’s filter some more.
Add another filter, this time select the Fields box, then type severity in the Find a field… search box and select it.
Make sure you click the Exclude all logs with this fields at the bottom of the dialog box, as the order log line does not have a severity assigned. This will remove the others.
You may need to scroll down the page if you still have the onboarding content displayed at the top to see the Exclude all logs with this fields button.
You should now have a list of orders sold for the last 15 minutes.
Next, let’s check out Splunk Synthetics.
Synthetics Overview
5 minutes
Splunk Synthetic Monitoring provides visibility across URLs, APIs and critical web services to solve problems faster. IT Operations and engineering teams can easily detect, alert and prioritize issues, simulate multi-step user journeys, measure business impact from new code deployments and optimize web performance with guided step-by-step recommendations to ensure better digital experiences.
Ensure Availability: Proactively monitor and alert on the health and availability of critical services, URLs and APIs with customizable browser tests to simulate multi-step workflows that make up the user experience. Improve Metrics: Core Web Vitals and modern performance metrics allow users to view all their performance defects in one place, measure and improve page load, interactivity and visual stability, and find and fix JavaScript errors to improve page performance. front-end to back-end: Integrations with Splunk APM, Infrastructure Monitoring, On-Call and ITSI help teams view endpoint uptime against back-end services, the underlying infrastructure and within their incident response coordination so they can troubleshoot across their entire environment, in a single UI. Detect and Alert: Monitor and simulate end-user experiences to detect, communicate and resolve issues for APIs, service endpoints and critical business transactions before they impact customers. Business Performance: Easily define multi-step user flows for key business transactions and start recording and testing your critical user journeys in minutes. Track and report SLAs and SLOs for uptime and performance. Filmstrips and Video Playback: View screen recordings, film strips, and screenshots alongside modern performance scores, competitive benchmarking, and metrics to visualize artificial end-user experiences. Optimize how fast you deliver visual content, and improve page stability and interactivity to deploy better digital experiences.
Subsections of Synthetics Overview
Synthetics Home Page
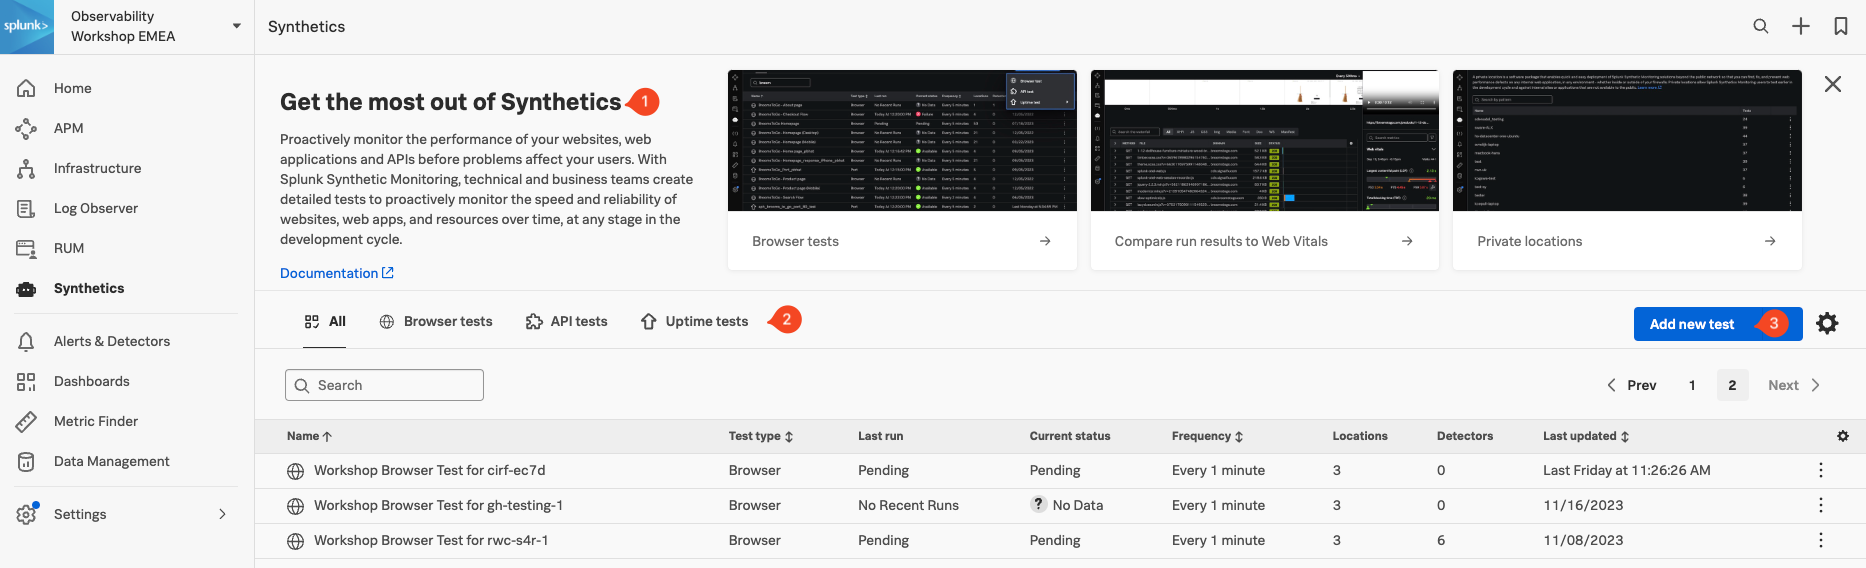
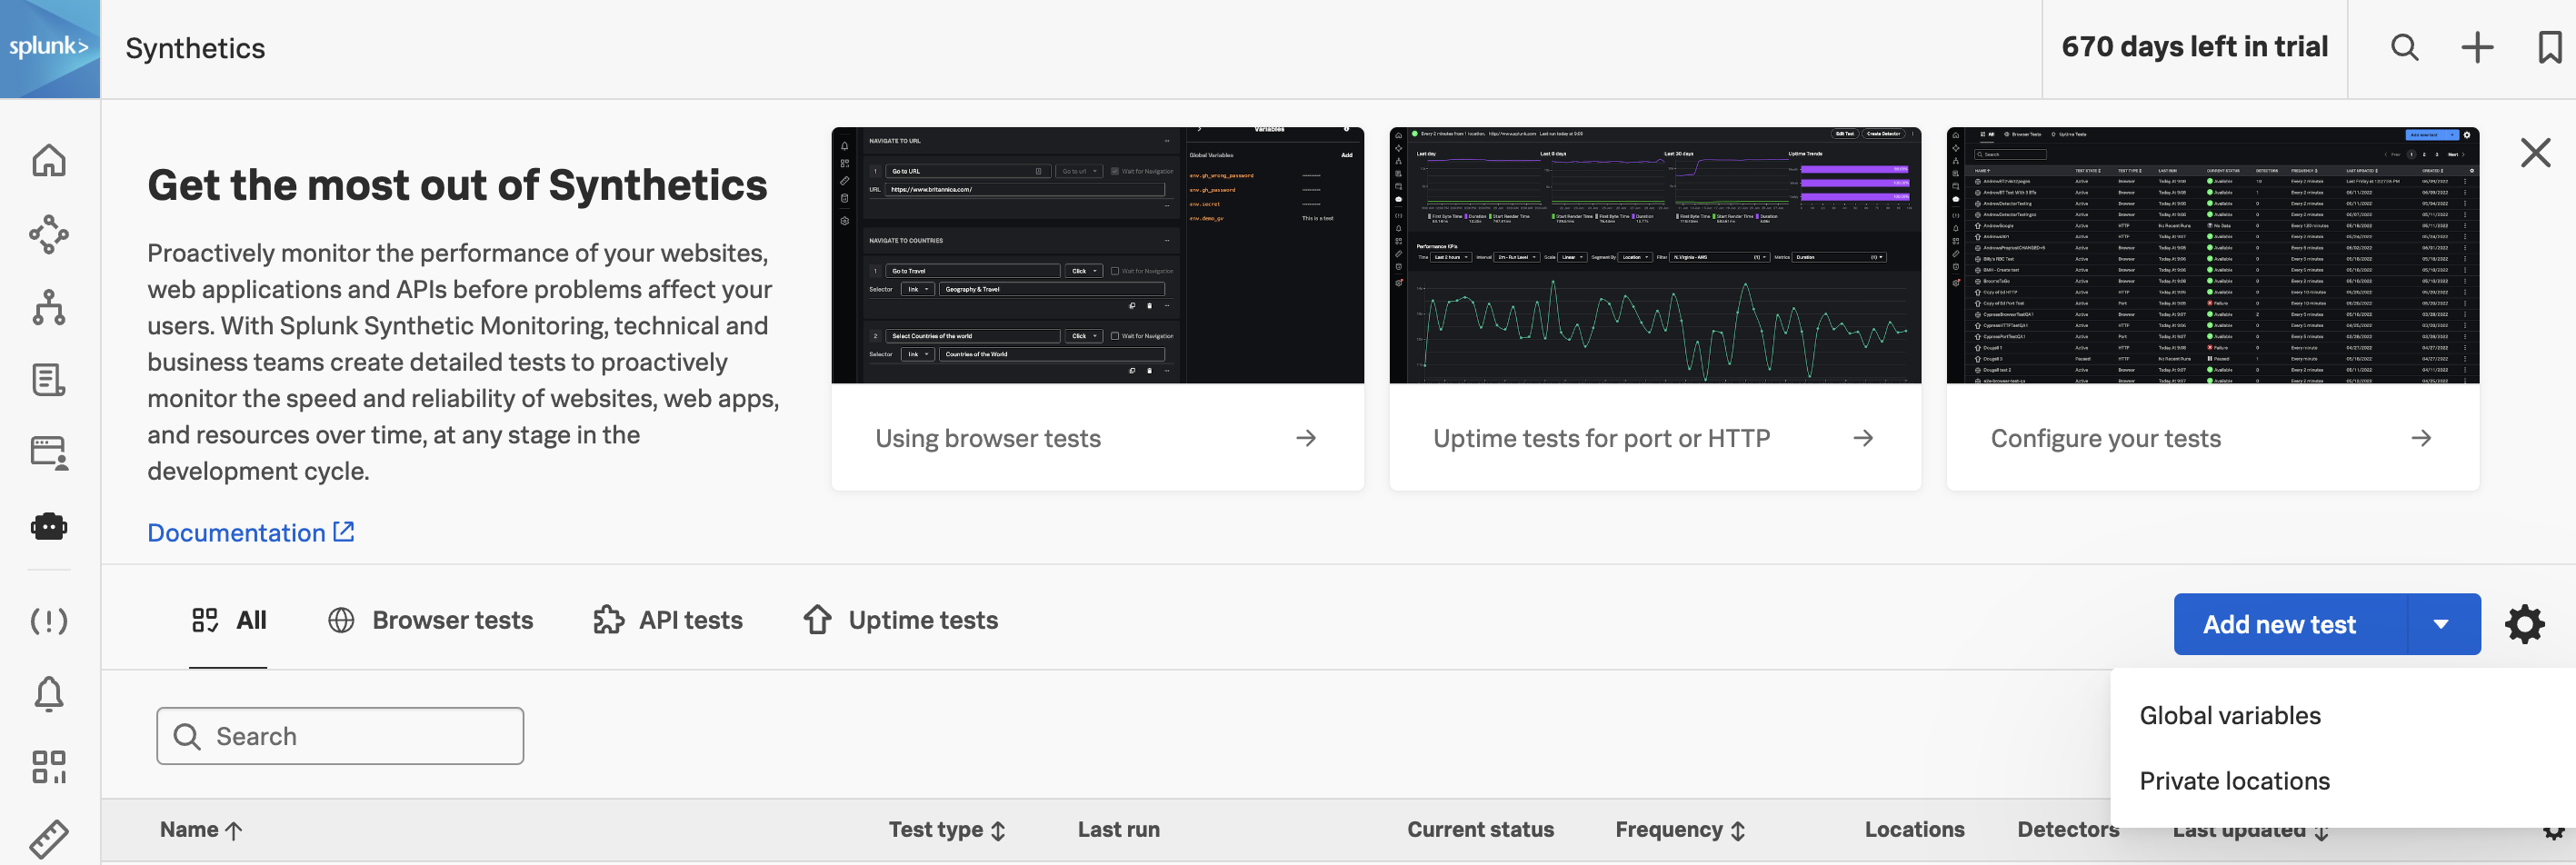
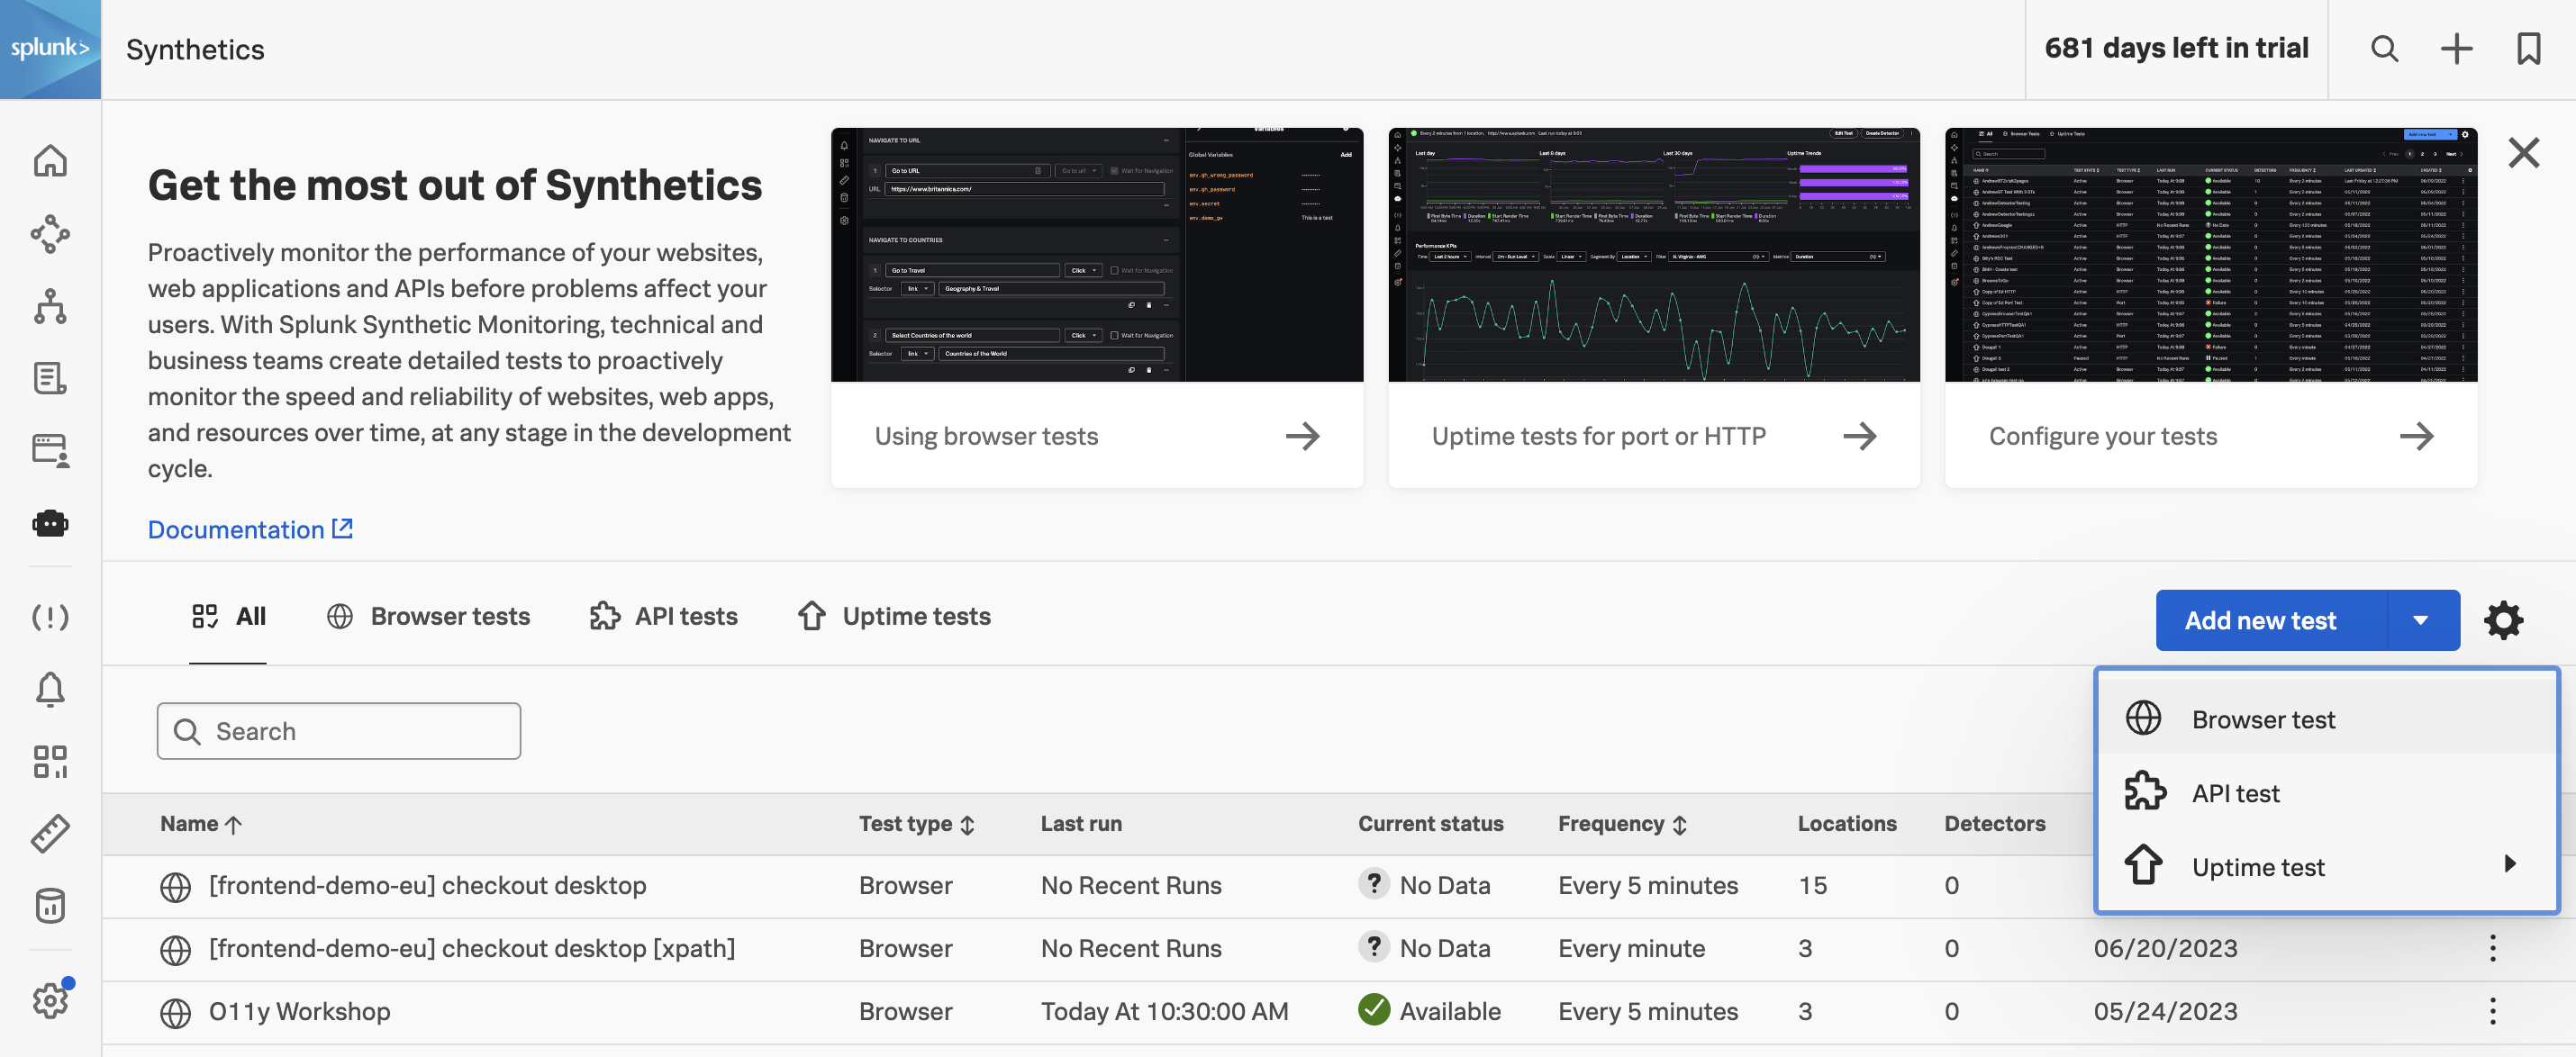
Click on Synthetics in the main menu. This will bring us to the Synthetics Home Page. It has 3 distinct sections that provide either useful information or allow you to pick or create a Synthetic Test.
Onboarding Pane: Training videos and links to documentation to get you started with Splunk Synthetics.
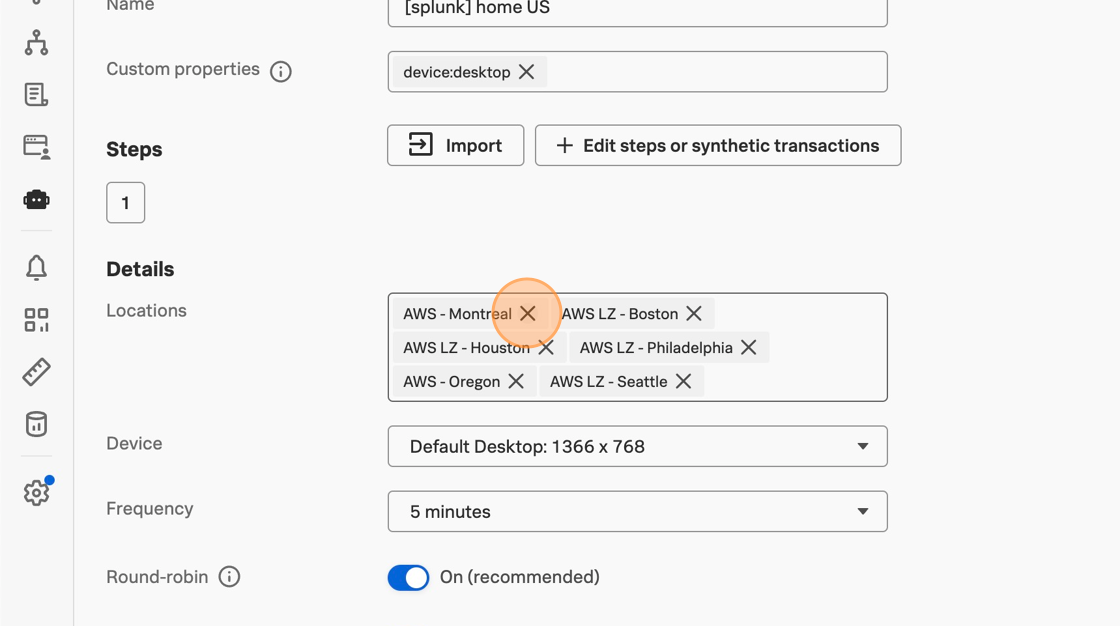
Test Pane: List of all the tests that are configured (Browser, API and Uptime)
Create Test Pane: Drop-down for creating new Synthetic tests.
Info
As part of the workshop we have created a default browser test against the application we are running. You find it in the Test Pane (2). It will have the following name Workshop Browser Test for, followed by the name of your Workshop (your instructor should have provided that to you).
To continue our tour, let’s look at the result of our workshop’s automatic browser test.
Exercise
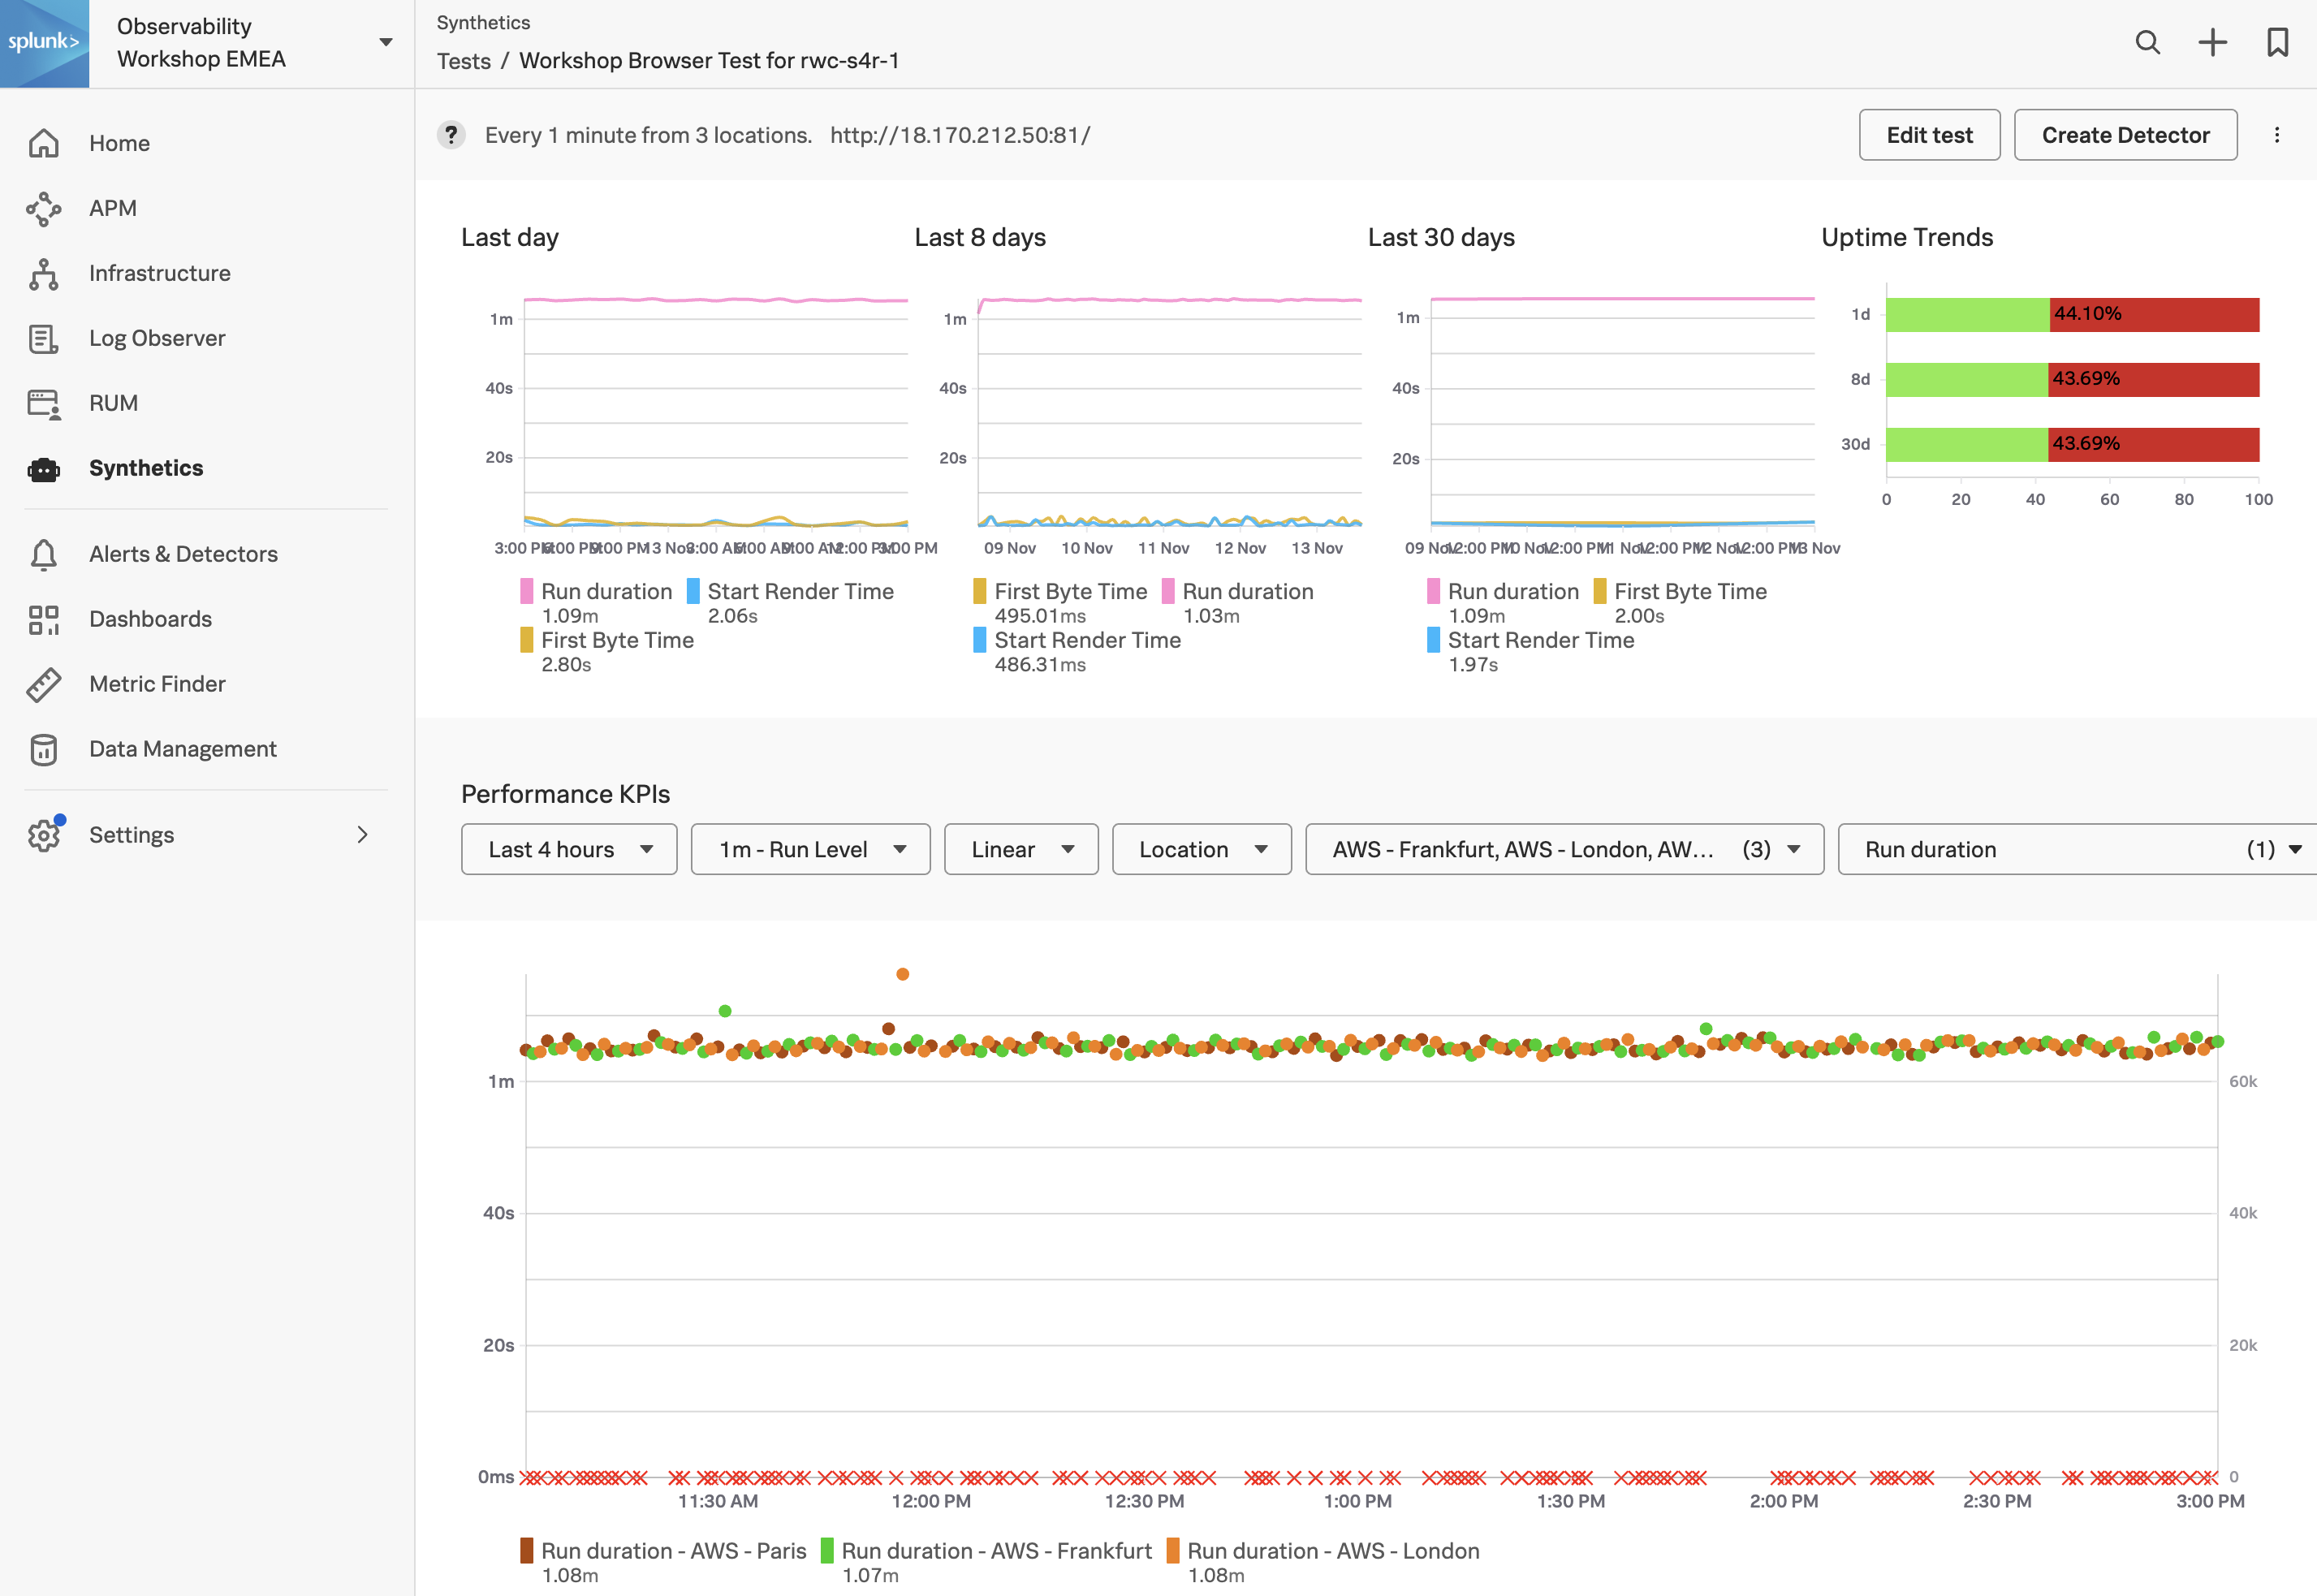
In the Test Pane, click on the line that contains the name of your workshop. The result should look like this:
Note, On the Synthetic Tests Page, the first pane will show the performance of your site for the last day, 8 days and 30 days. As shown in the screenshot above, only if a test started far enough in the past, the corresponding chart will contain valid data. For the workshop, this depends on when it was created.
In the Performance KPI drop-down, change the time from the default 4 hours to the 1 last hour.
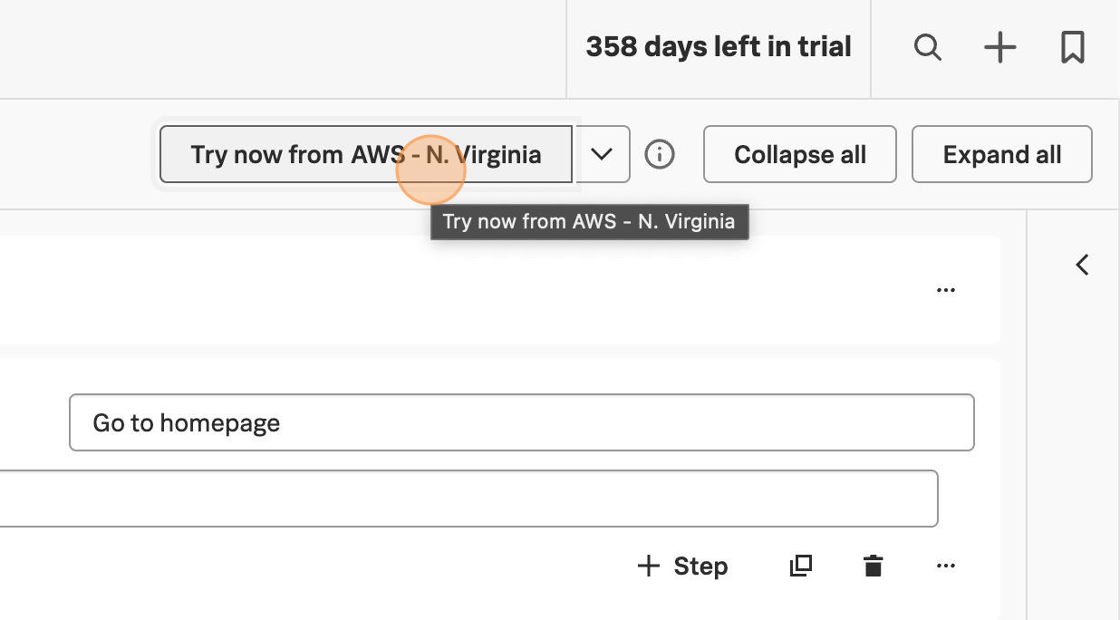
How often is the test run, and from where?
The test runs at a 1-minute round-robin interval from Frankfurt, London and Paris
Next, let’s examine the infrastructure our application is running on using Splunk Infrastructure Monitoring (IM).
Infrastructure Overview
5 minutes
Splunk Infrastructure Monitoring (IM) is a market-leading monitoring and observability service for hybrid cloud environments. Built on a patented streaming architecture, it provides a real-time solution for engineering teams to visualize and analyze performance across infrastructure, services, and applications in a fraction of the time and with greater accuracy than traditional solutions.
OpenTelemetry standardization: Gives you full control over your data — freeing you from vendor lock-in and implementing proprietary agents. Splunk’s OTel Collector: Seamless installation and dynamic configuration, auto-discovers your entire stack in seconds for visibility across clouds, services, and systems. 300+ Easy-to-use OOTB content: Pre-built navigators and dashboards, deliver immediate visualizations of your entire environment so that you can interact with all your data in real time. Kubernetes navigator: Provides an instant, comprehensive out-of-the-box hierarchical view of nodes, pods, and containers. Ramp up even the most novice Kubernetes user with easy-to-understand interactive cluster maps. AutoDetect alerts and detectors: Automatically identify the most important metrics, out-of-the-box, to create alert conditions for detectors that accurately alert from the moment telemetry data is ingested and use real-time alerting capabilities for important notifications in seconds. Log views in dashboards: Combine log messages and real-time metrics on one page with common filters and time controls for faster in-context troubleshooting. Metrics pipeline management: Control metrics volume at the point of ingest without re-instrumentation with a set of aggregation and data-dropping rules to store and analyze only the needed data. Reduce metrics volume and optimize observability spend.
Subsections of Infrastructure Overview
Let's go shopping 💶
5 minutes
Persona
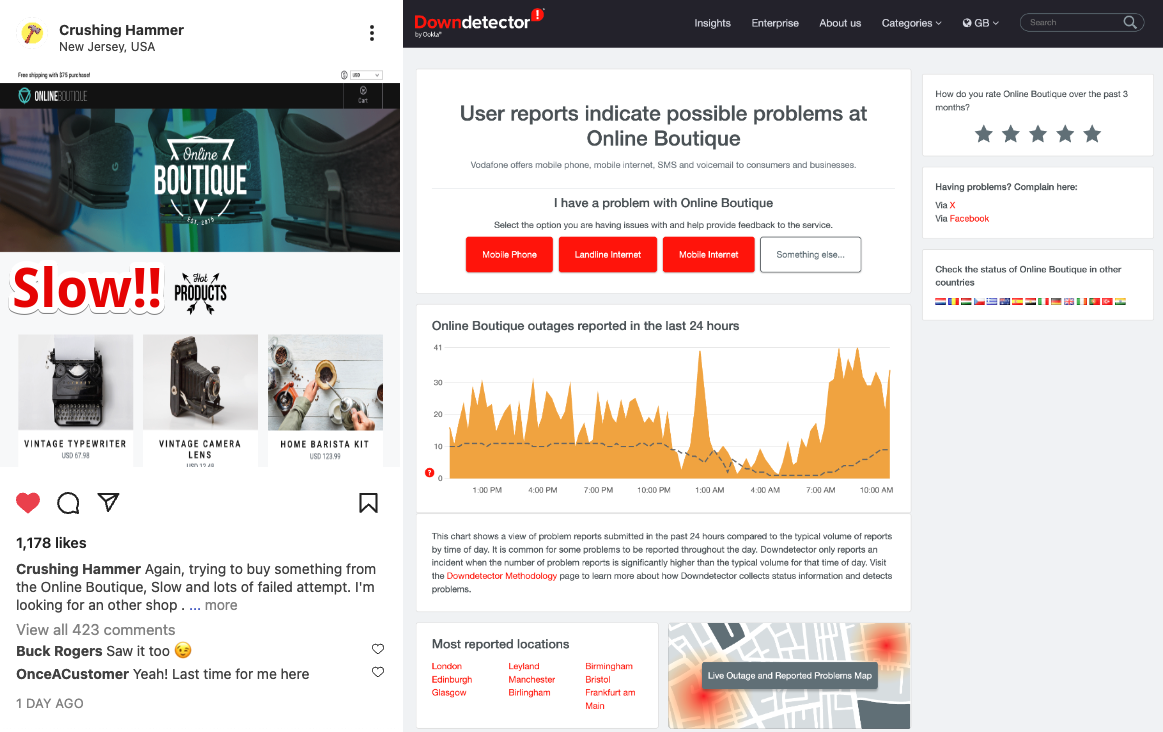
You are a hip urban professional, longing to buy your next novelty items in the famous Online Boutique shop. You have heard that the Online Boutique is the place to go for all your hipster needs.
The purpose of this exercise is for you to interact with the Online Boutique web application. This is a sample application that is used to demonstrate the capabilities of Splunk Observability Cloud. The application is a simple e-commerce site that allows you to browse items, add them to your cart, and then checkout.
The application will already be deployed for you and your instructor will provide you with a link to the Online Boutique website.
Exercise - Let’s go shopping
Once you have the link to the Online Boutique, have a browse through a few items, add them to your cart and then, finally, do a checkout.
Repeat this exercise a few times and if possible use different browsers, mobile devices or tablets as this will generate more data for you to explore.
Tip
While you are waiting for pages to load, please move your mouse cursor around the page. This will generate more data for us to explore at a later date in this workshop.
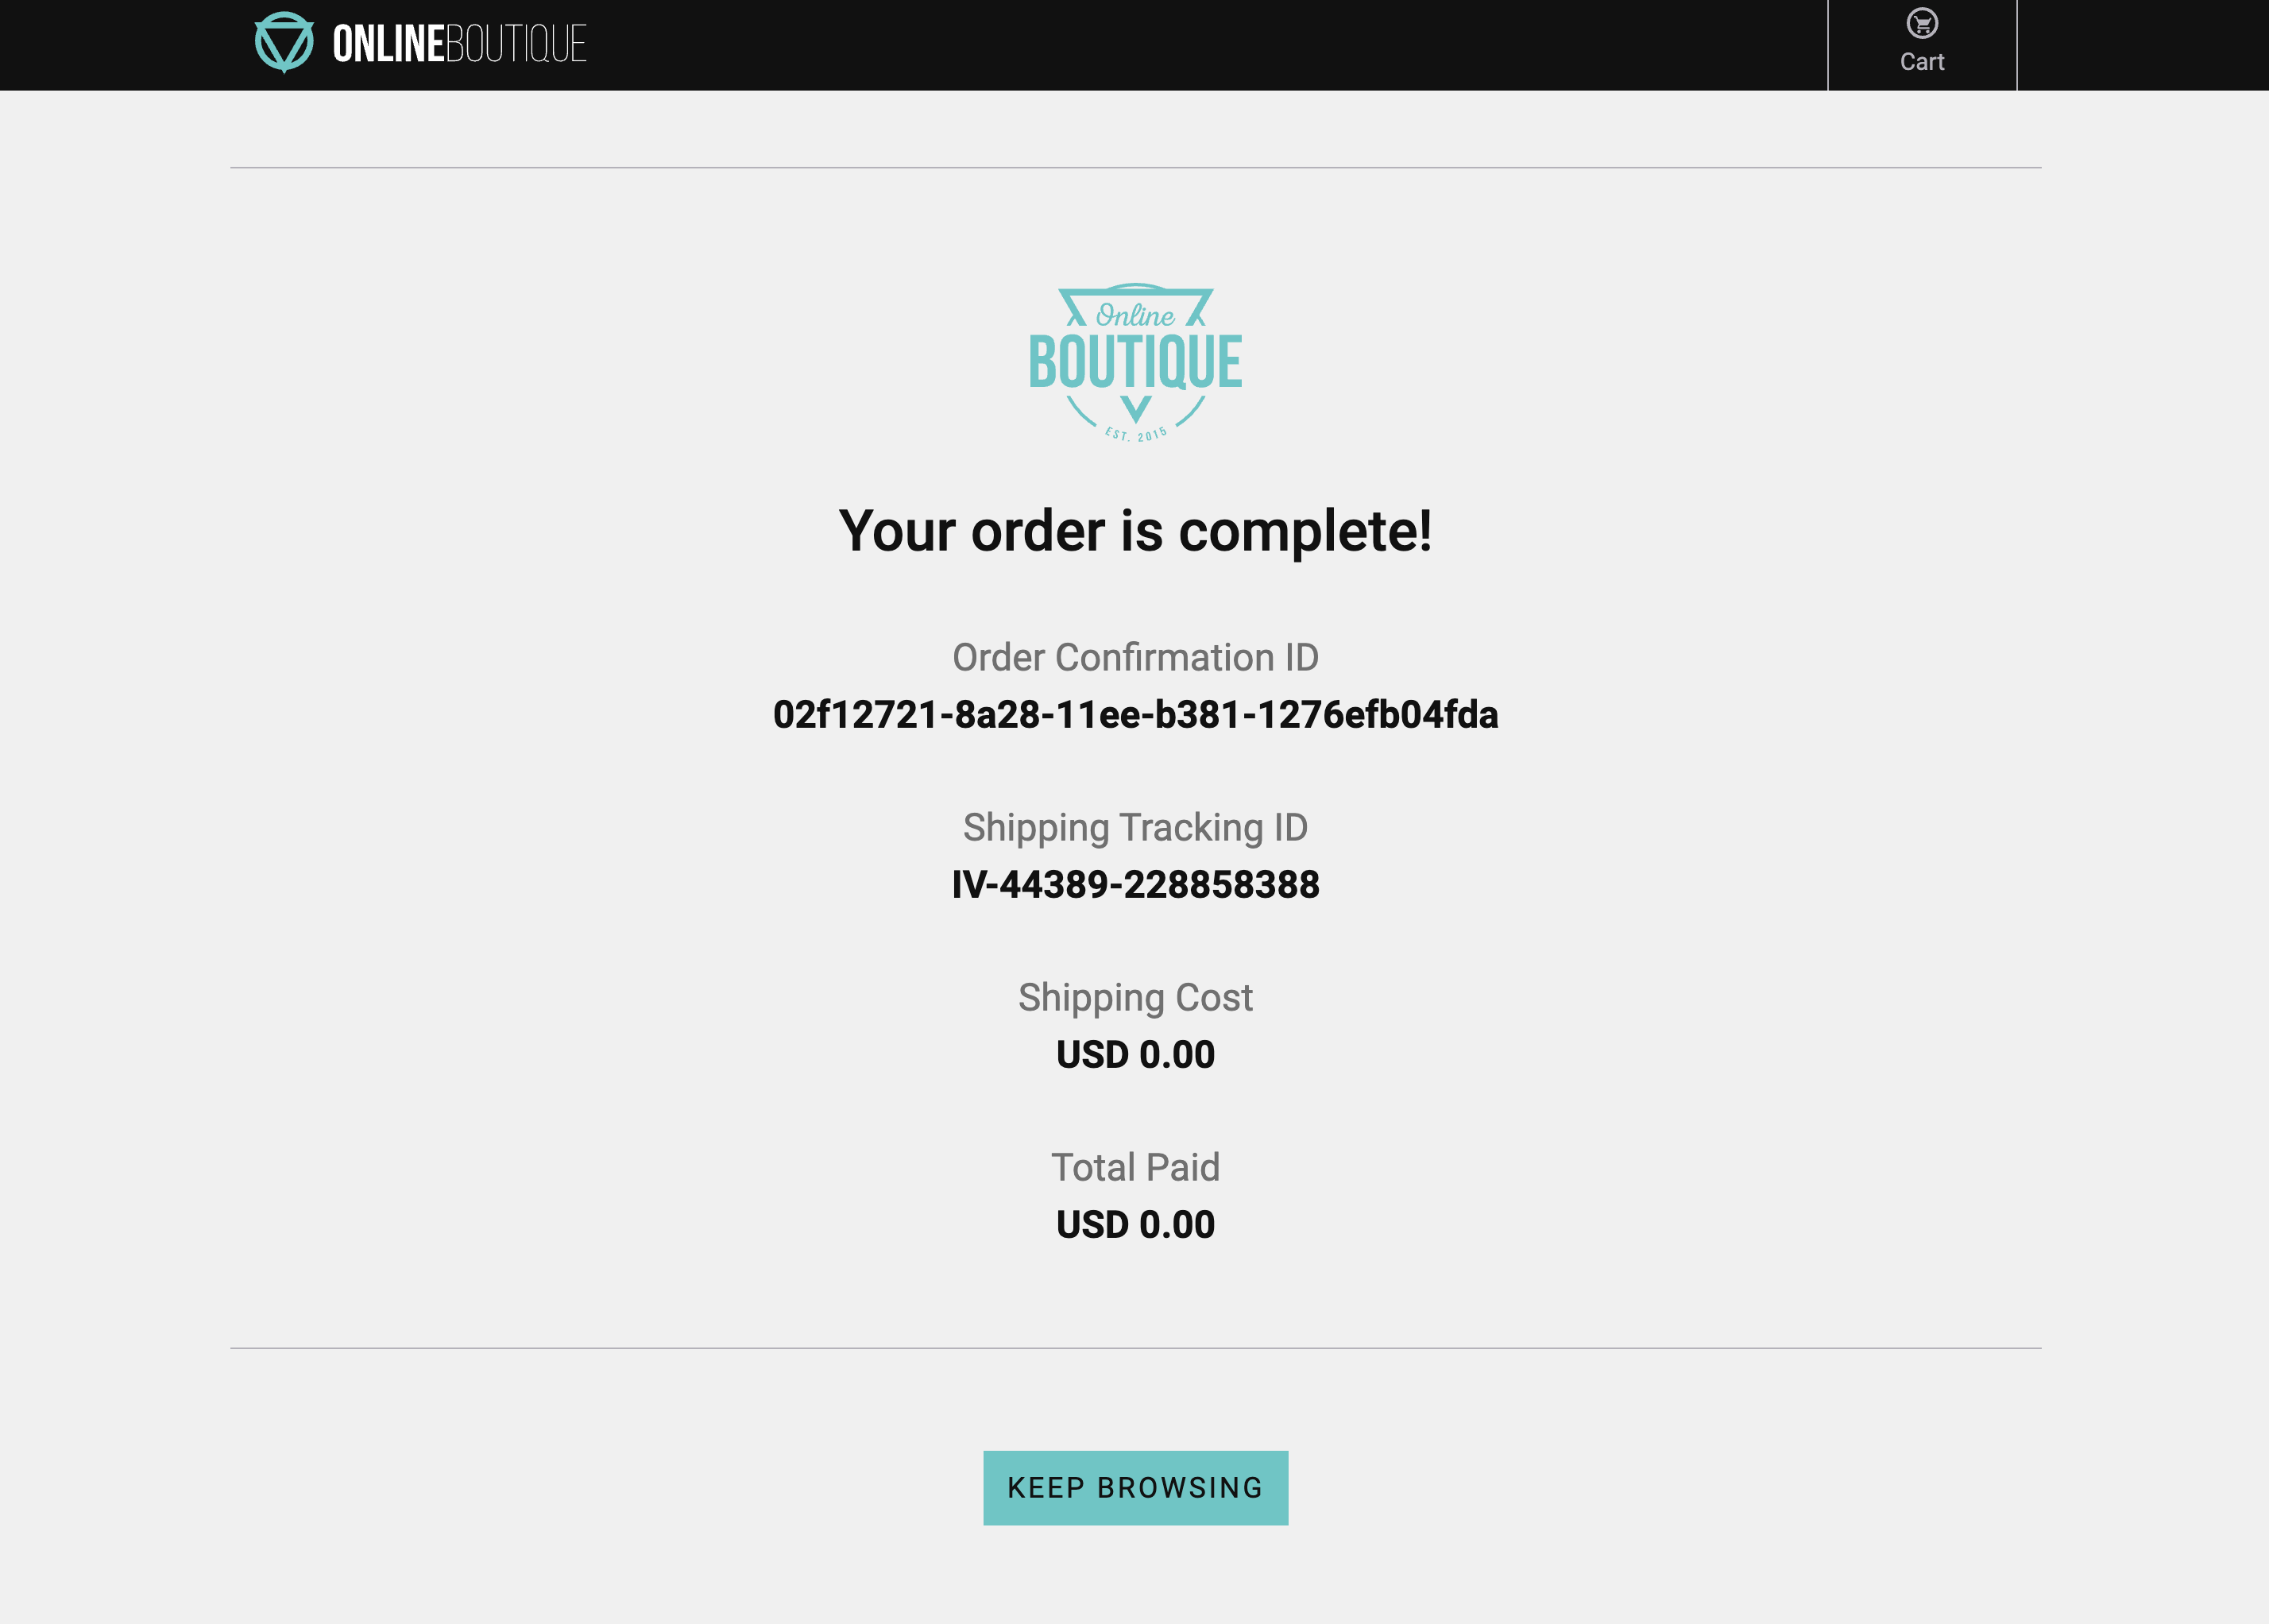
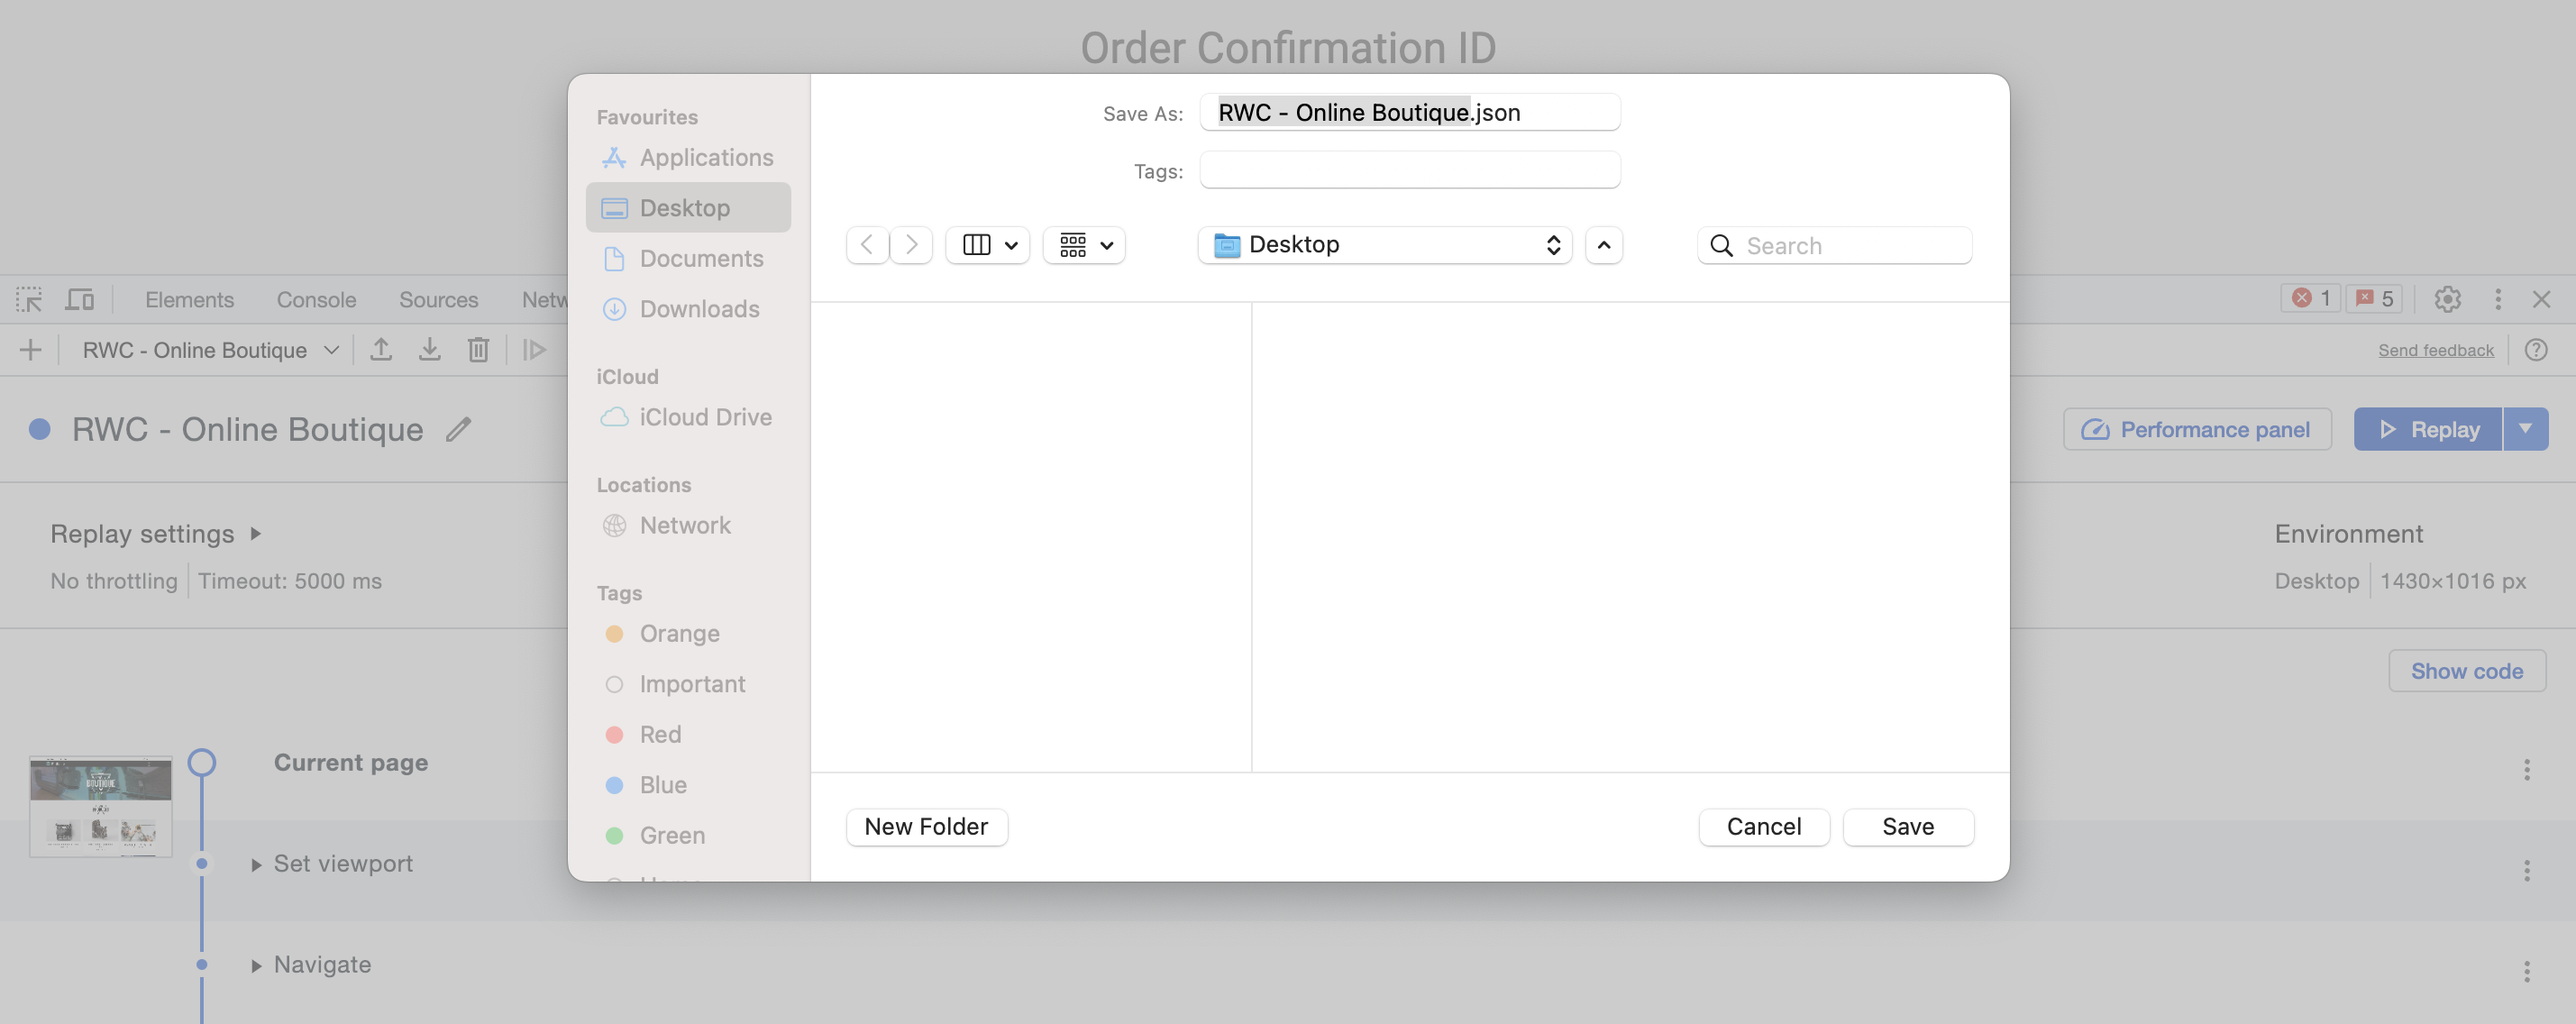
Exercise (cont.)
Did you notice anything about the checkout process? Did it seem to take a while to complete, but it did ultimately complete? When this happens please copy the Order Confirmation ID and save it locally somewhere as we will need it later.
Close the browser sessions you used to shop.
This is what a poor user experience can feel like and since this is a potential customer satisfaction issue we had better jump on this and troubleshoot.
Let’s go take a look at what the data looks like in Splunk RUM.
Splunk RUM
15 minutes
Persona
You are a frontend engineer, or an SRE tasked to do the first triage of a performance issue. You have been asked to investigate a potential customer satisfaction issue with the Online Boutique application.
We are going to examine the real user data that has been provided by the telemetry received from all participants’ browser sessions. The goal is to find a browser, mobile or tablet session that performed poorly and begin the troubleshooting process.
Subsections of Splunk RUM
1. RUM Dashboard
In Splunk Observability Cloud from the main menu, click on RUM. you arrive at the RUM Home page, this view has already been covered in the short introduction earlier.
Exercise
Make sure you select your workshop by ensuring the drop-downs are set/selected as follows:
The Time frame is set to -15m.
The Environment selected is [NAME OF WORKSHOP]-workshop.
The App selected is [NAME OF WORKSHOP]-store.
The Source is set to All.
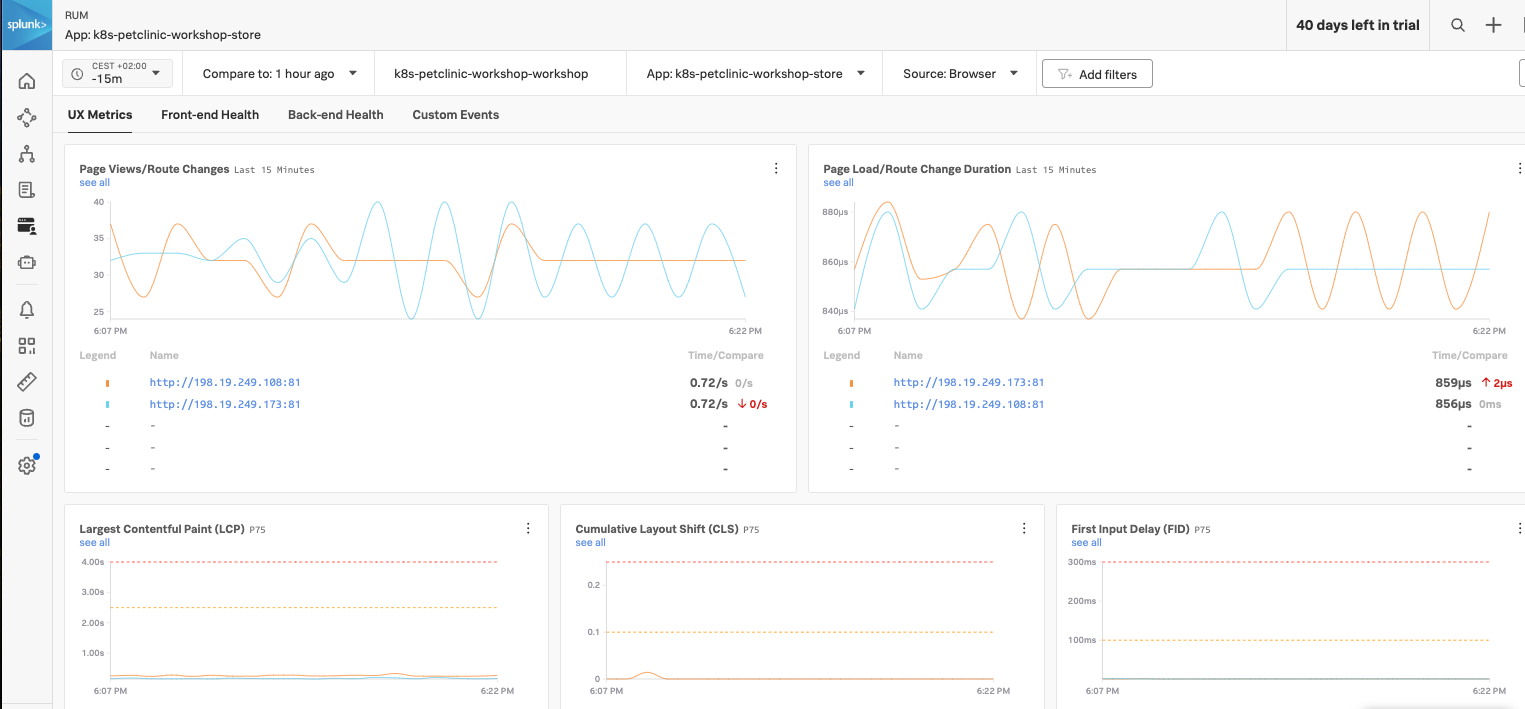
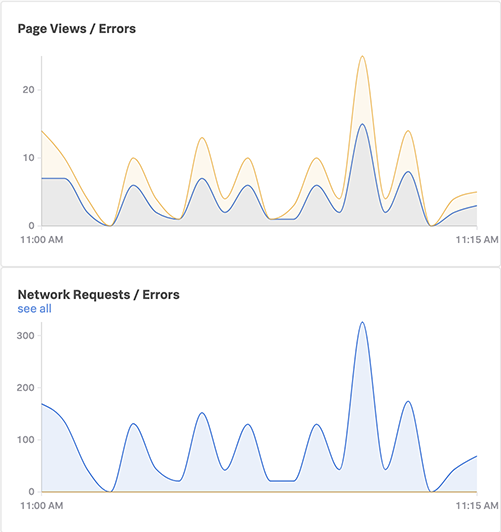
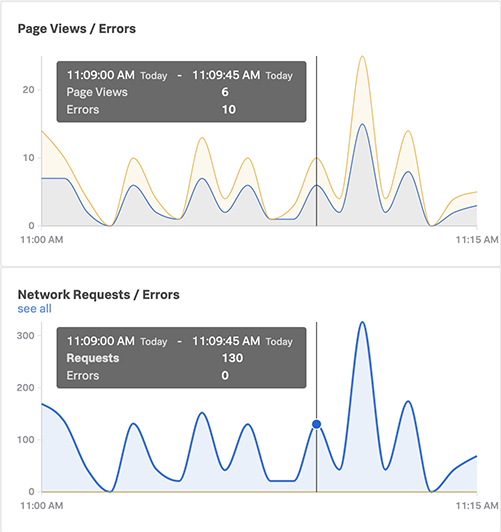
Next, click on the [NAME OF WORKSHOP]-store above the Page Views / JavaScript Errors chart.
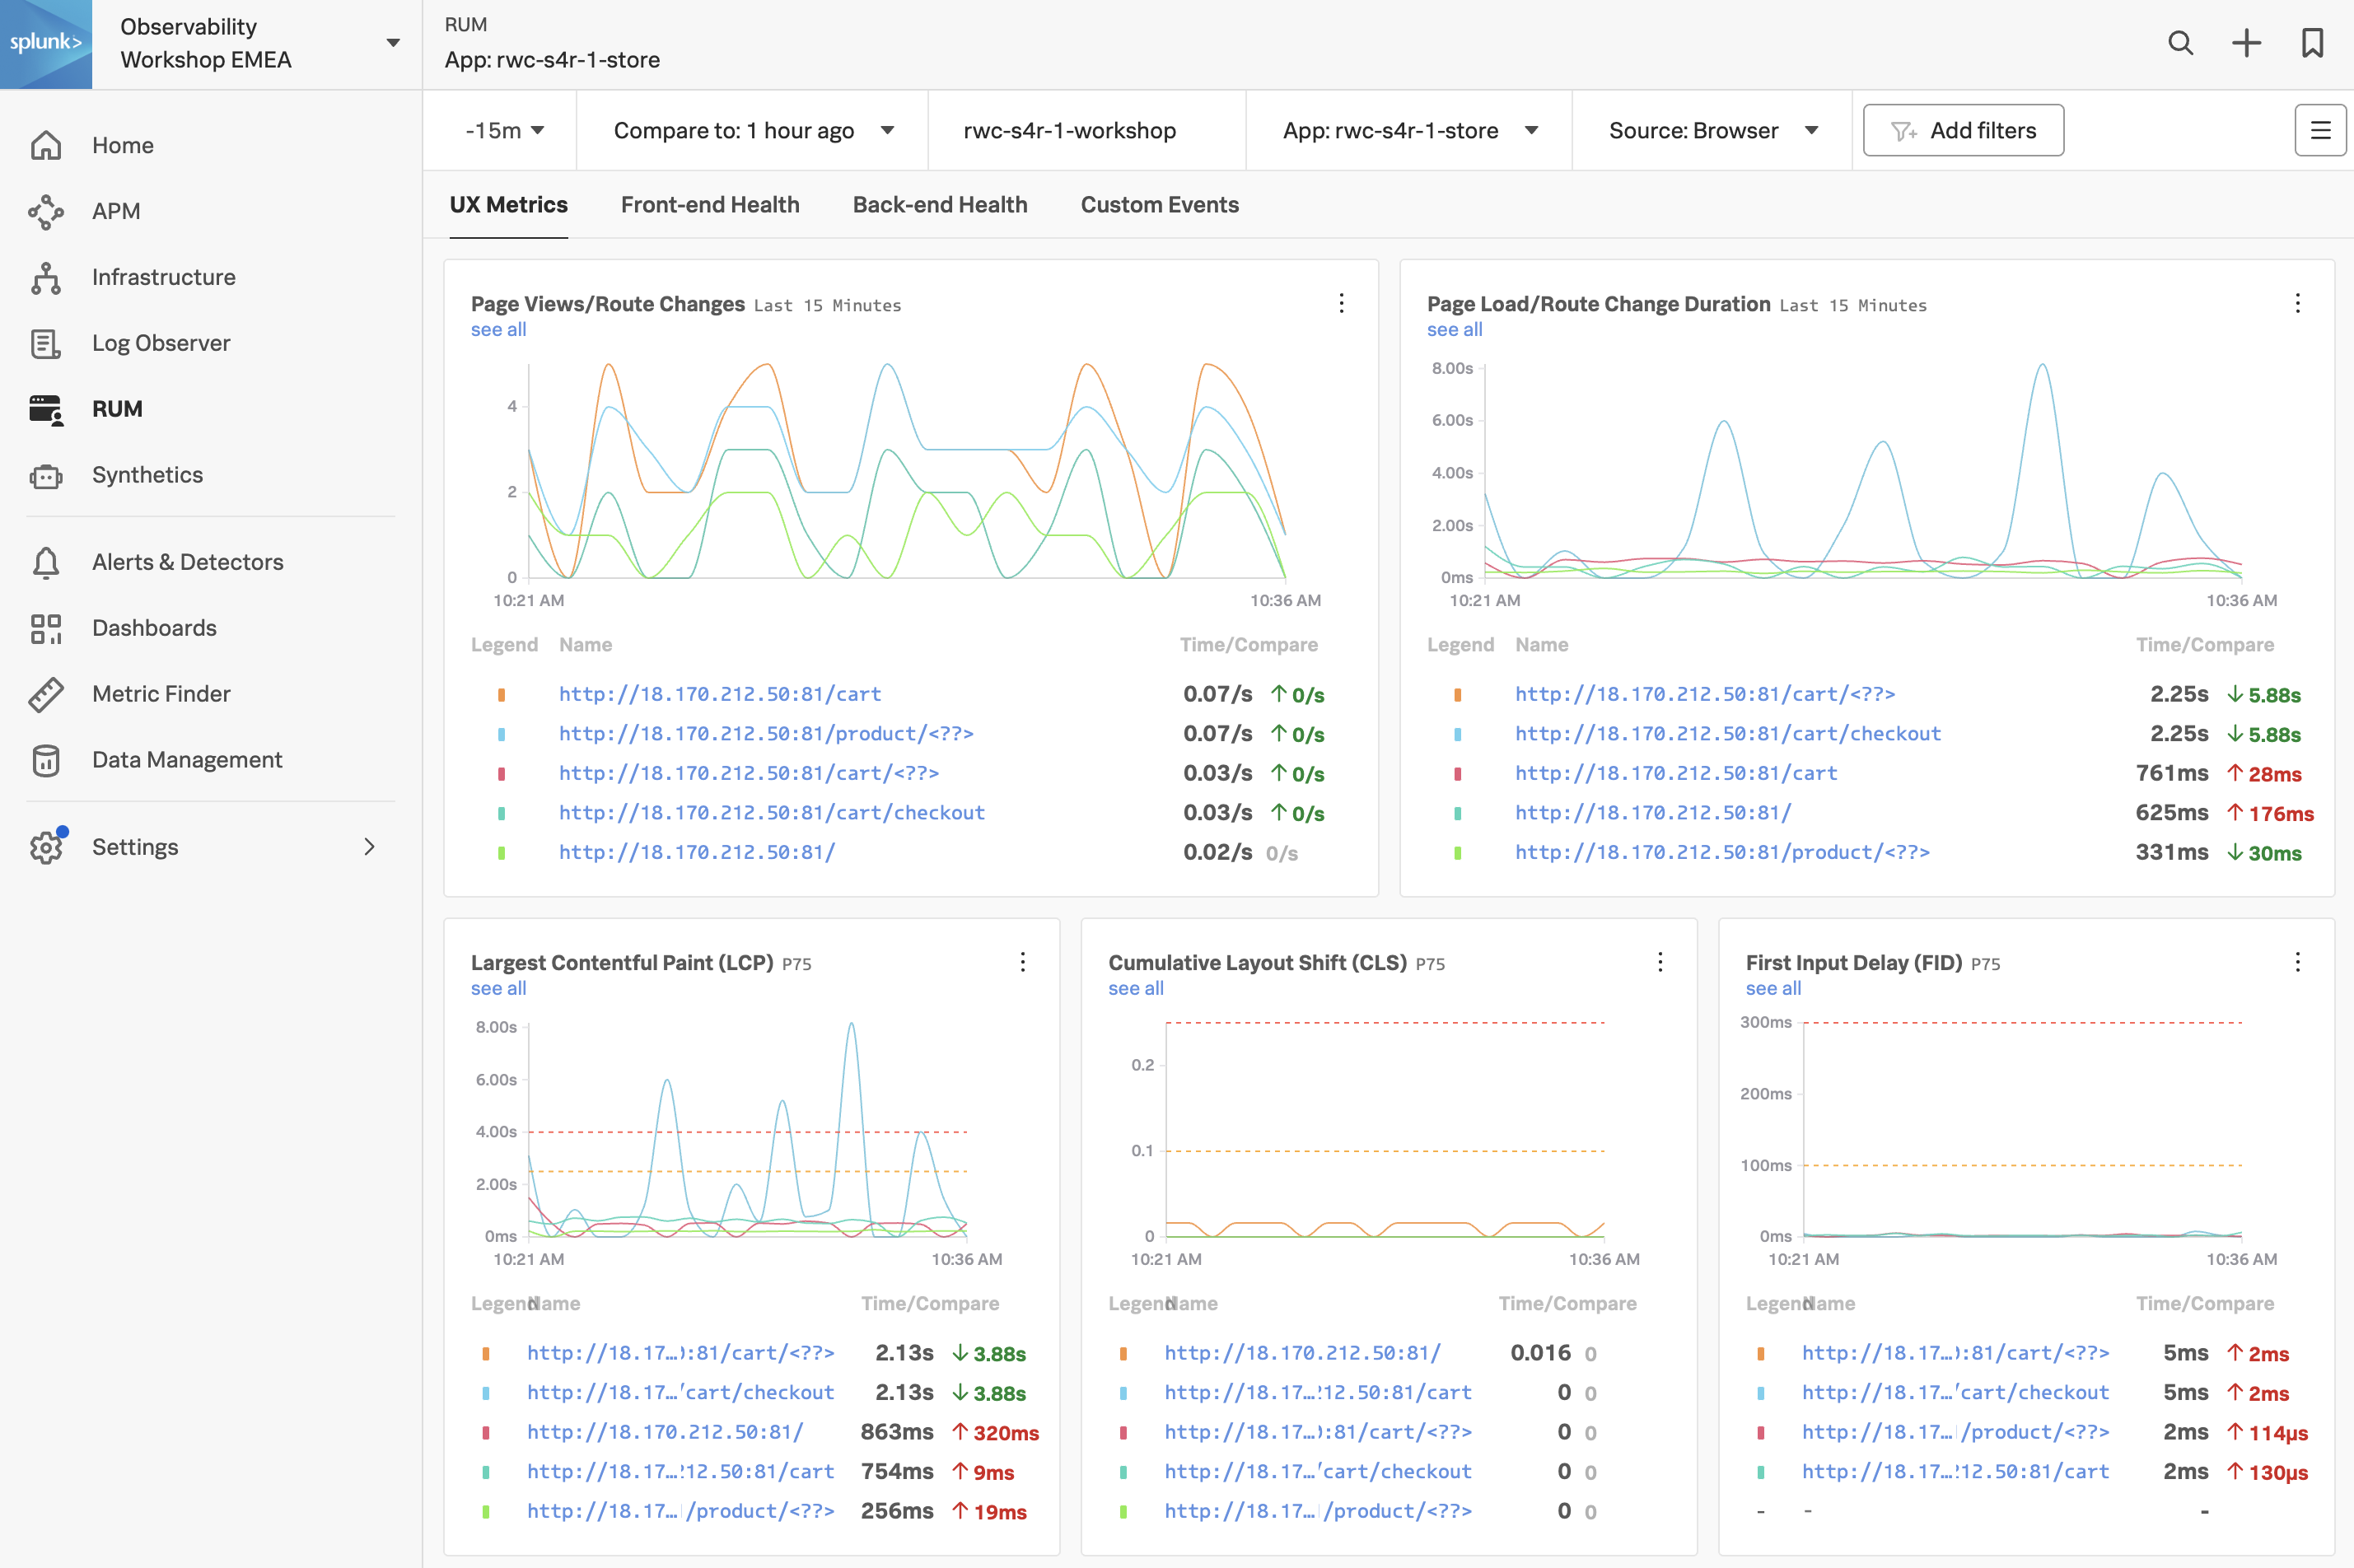
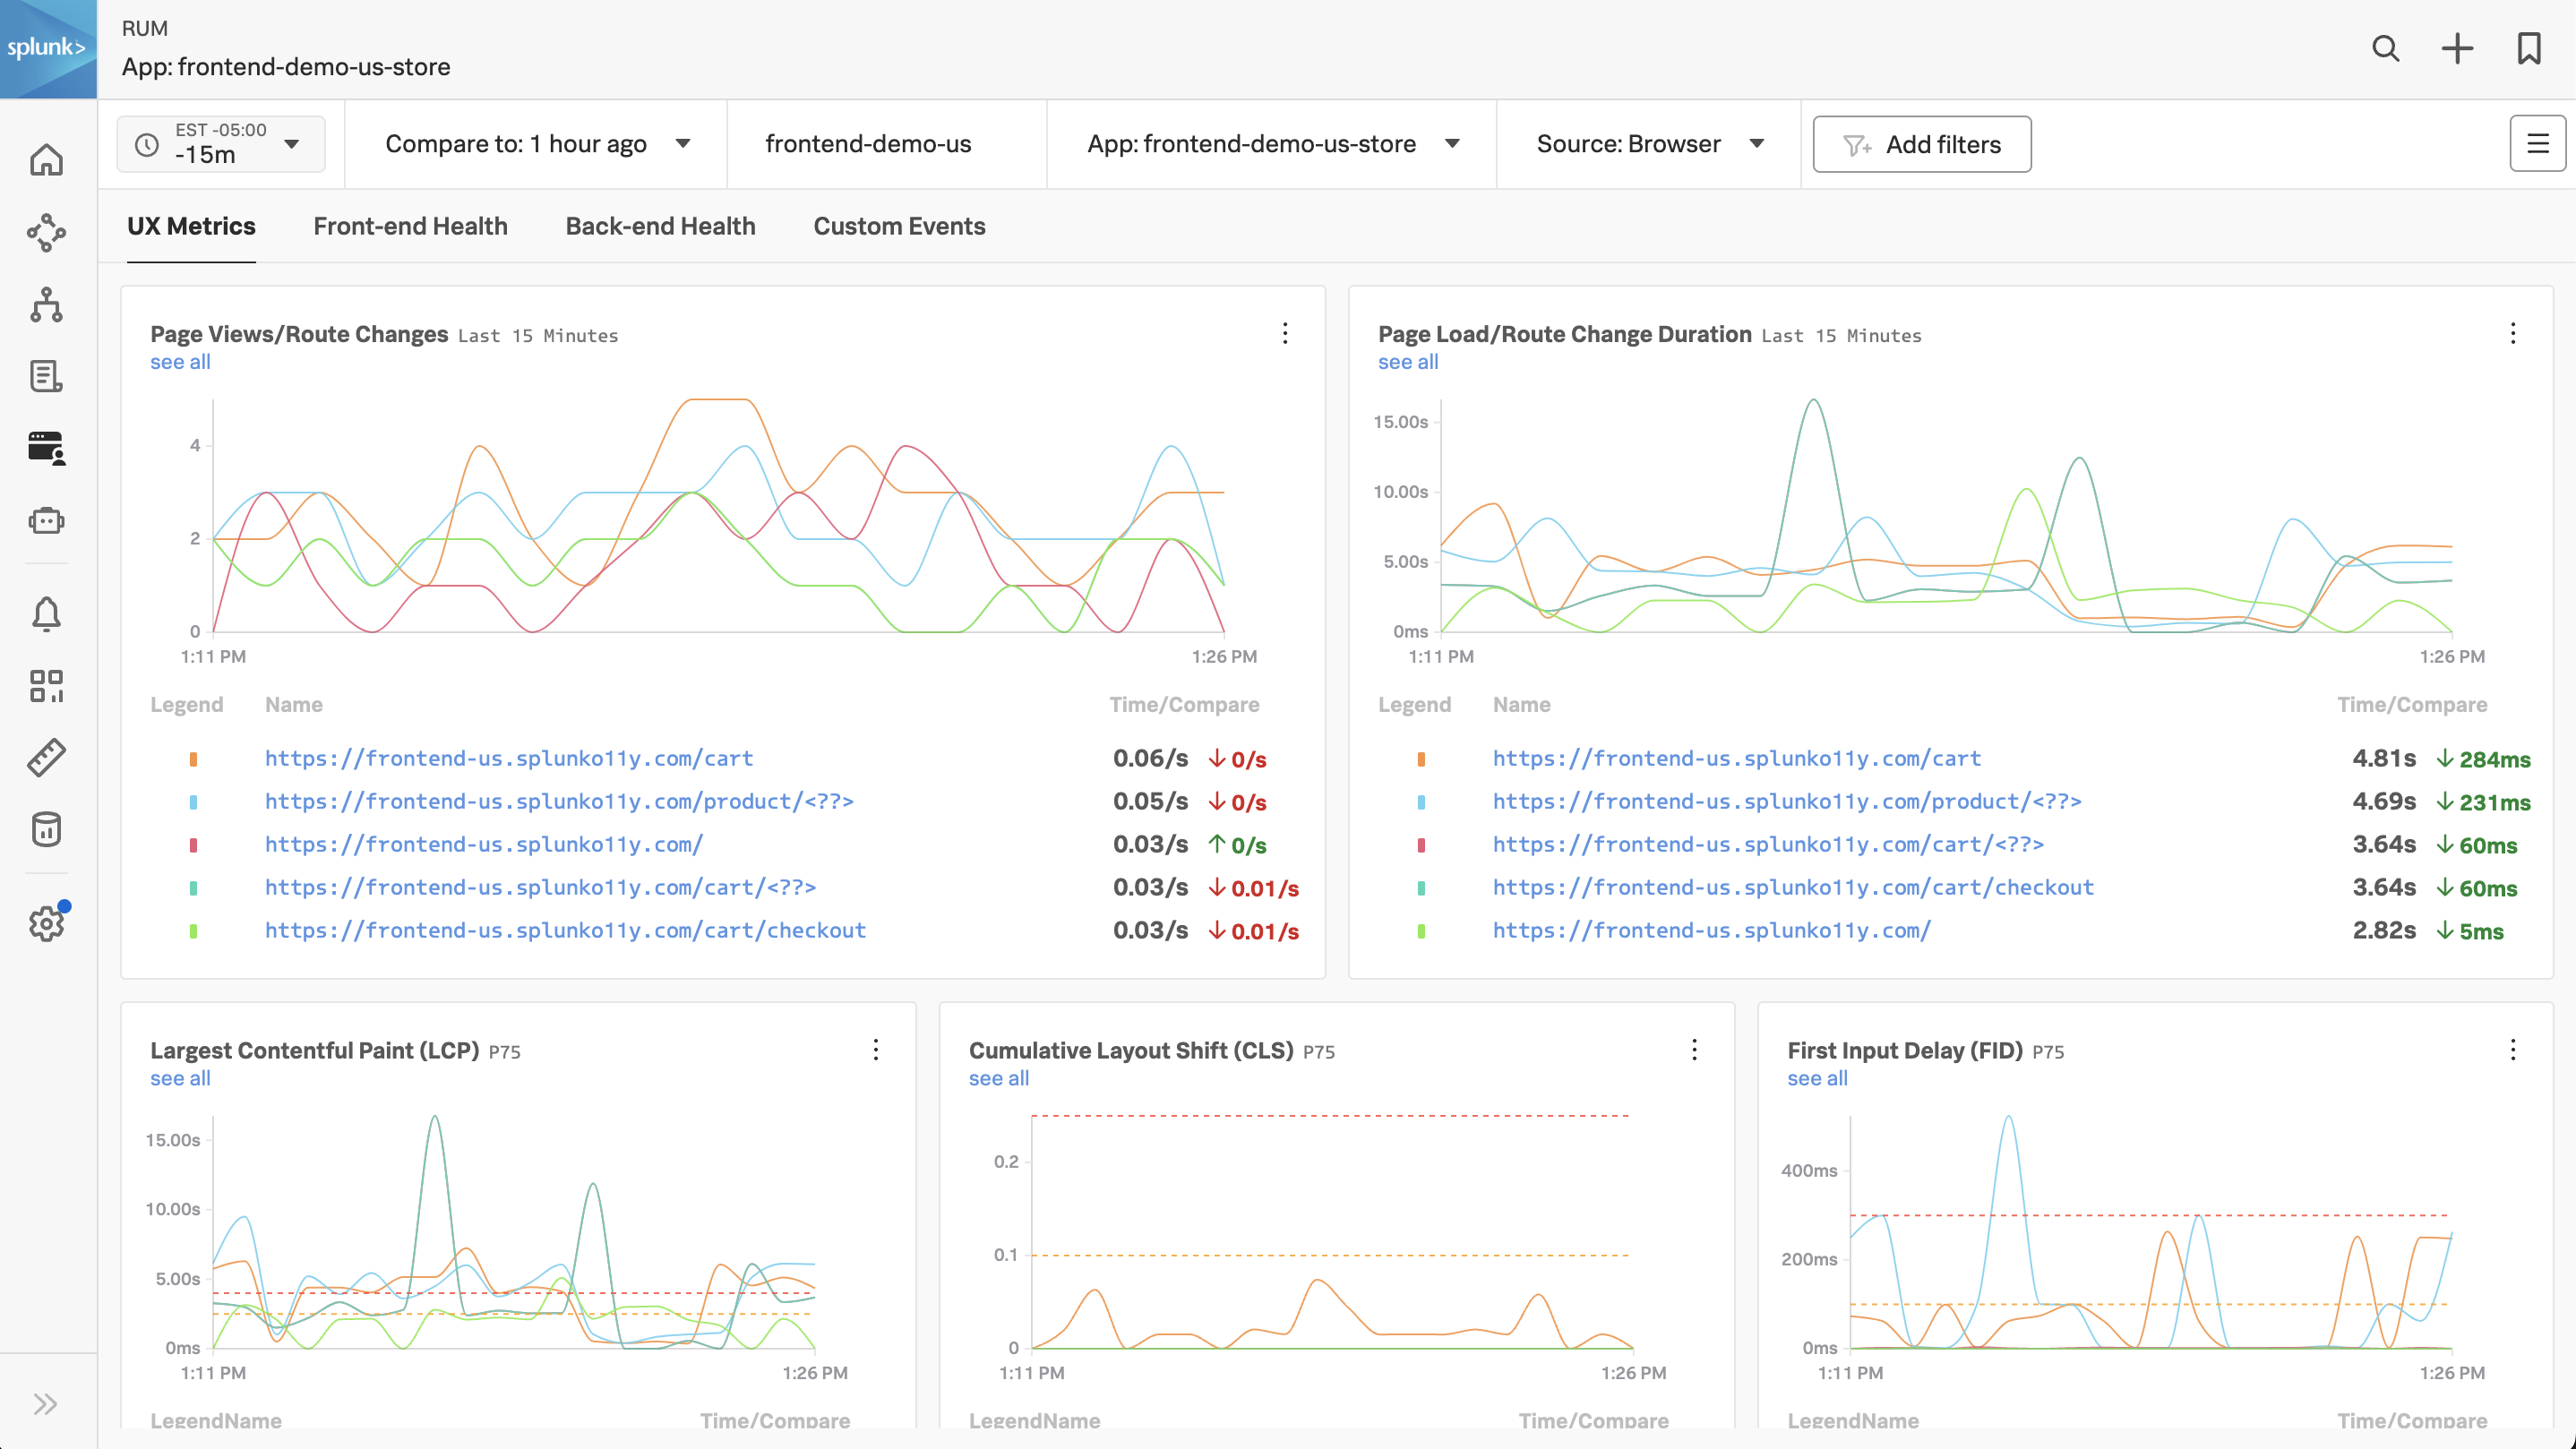
This will bring up a new dashboard view breaking down the metrics by UX Metrics, Front-end Health, Back-end Health and Custom Events and comparing them to historic metrics (1 hour by default).
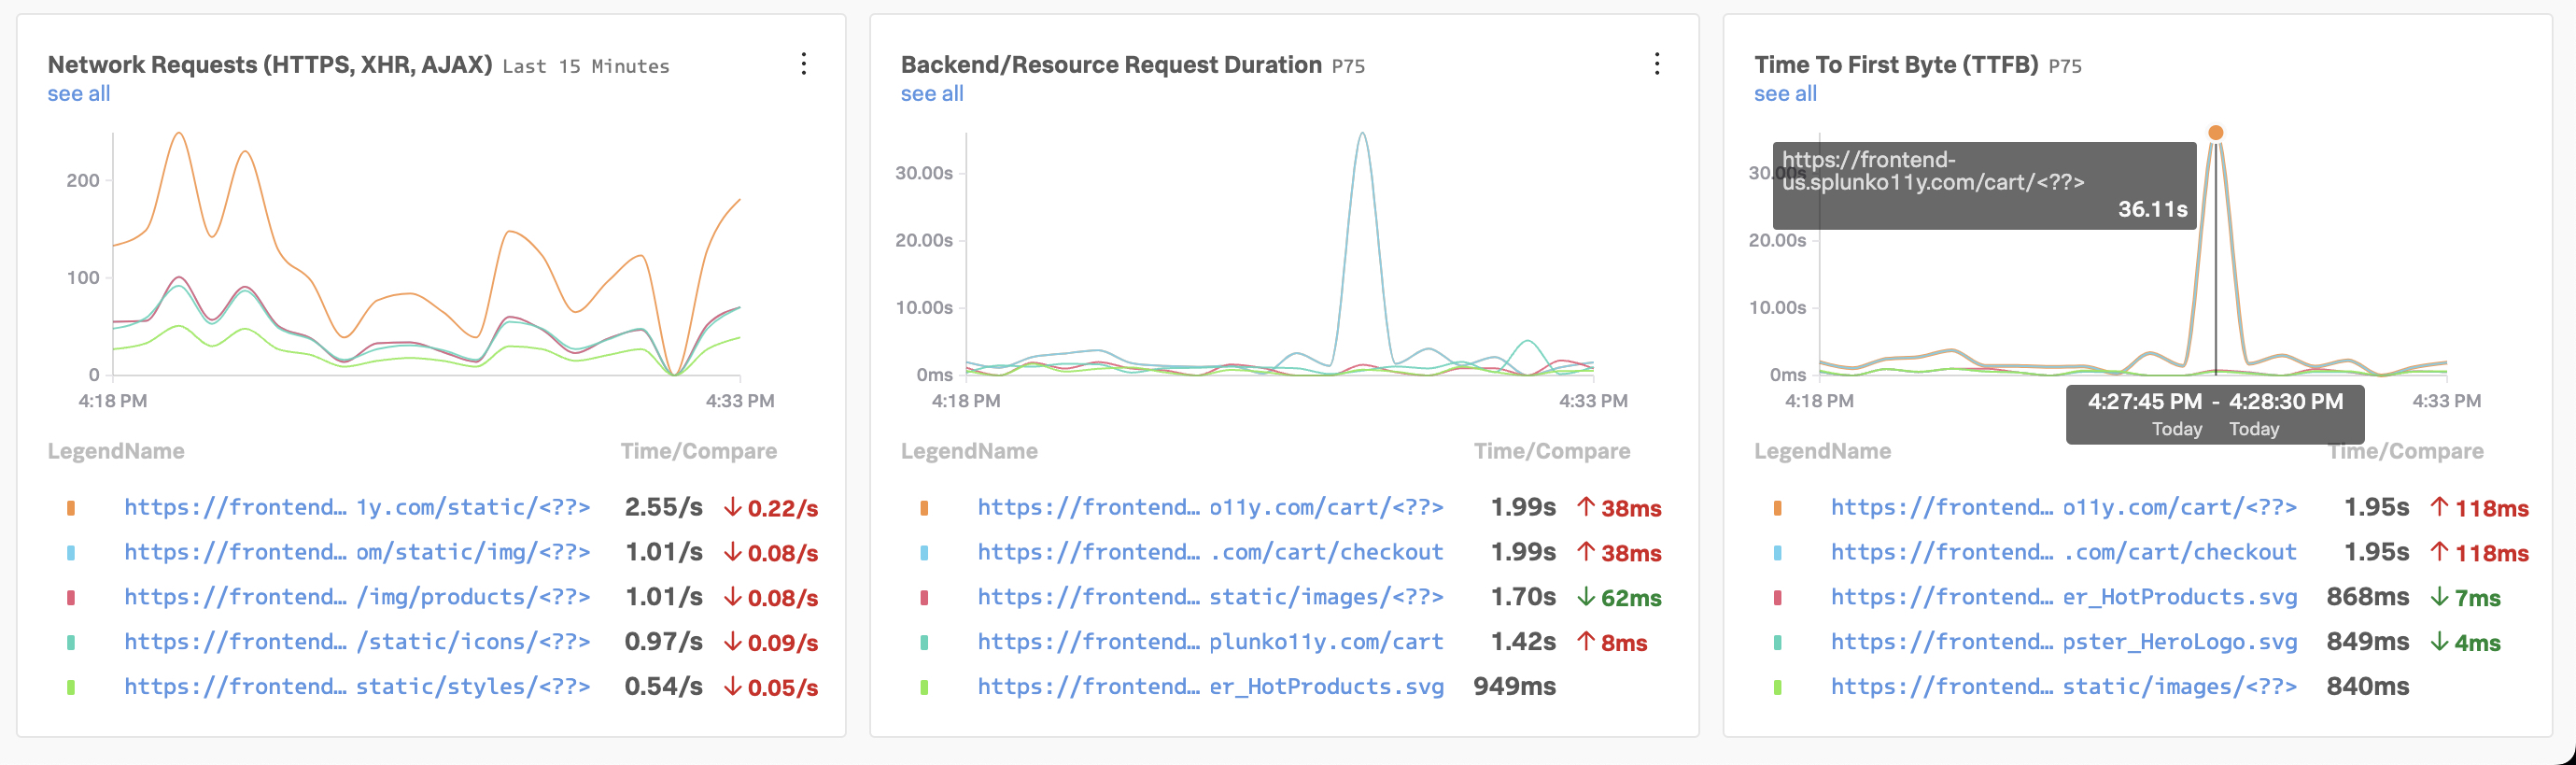
UX Metrics: Page Views, Page Load and Web Vitals metrics.
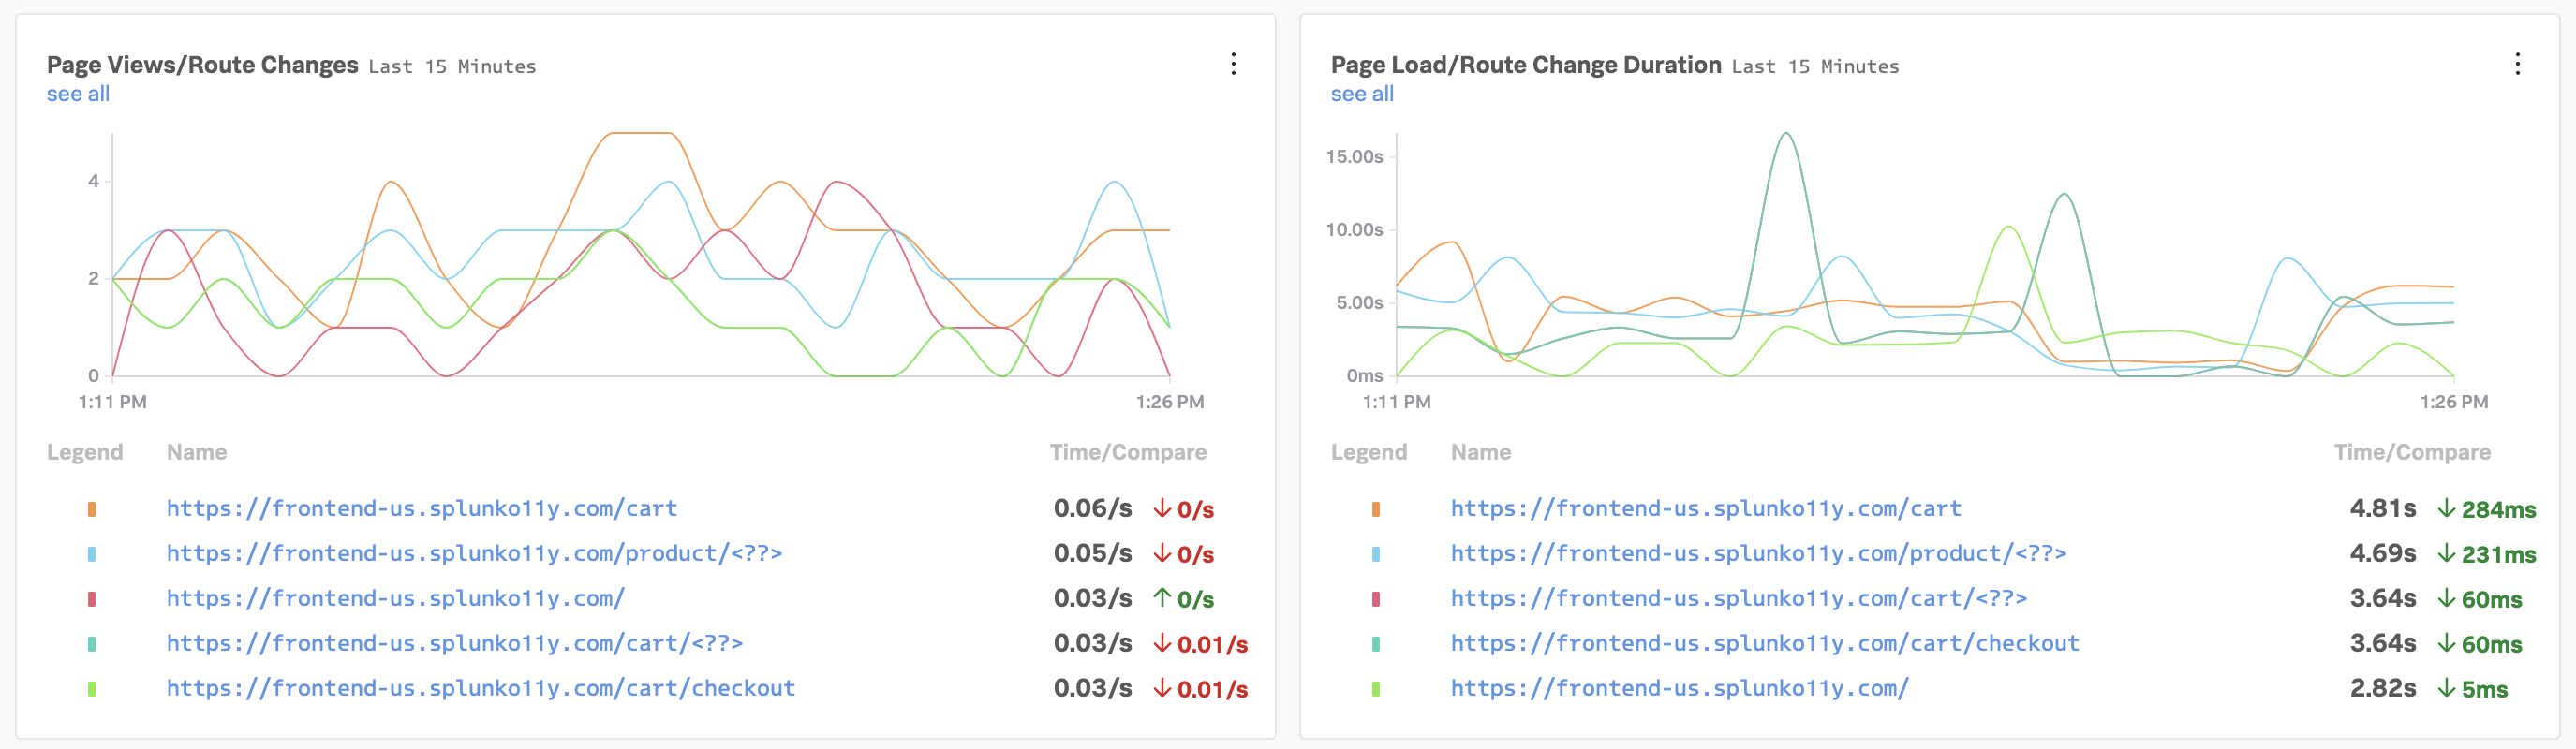
Front-end Health: Breakdown of Javascript Errors and Long Task duration and count.
Back-end Health: Network Errors and Requests and Time to First Byte.
Custom Events: RED metrics (Rate, Error & Duration) for custom events.
Exercise
Click through each of the tabs (UX Metrics, Front-end Health, Back-end Health and Custom Events) and examine the data.
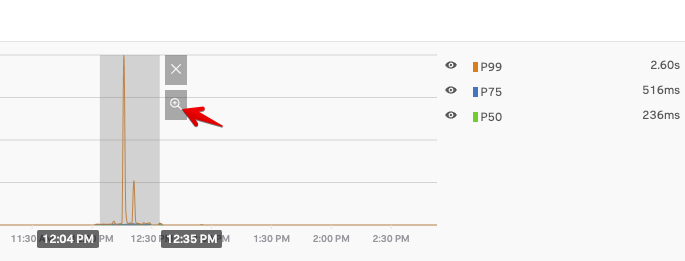
If you examine the charts in the Custom Events Tab, what chart shows clearly the latency Spikes?
It is the Custom Event Latency chart
2. Tag Spotlight
Exercise
Make sure you are on the Custom Events tab by selecting it.
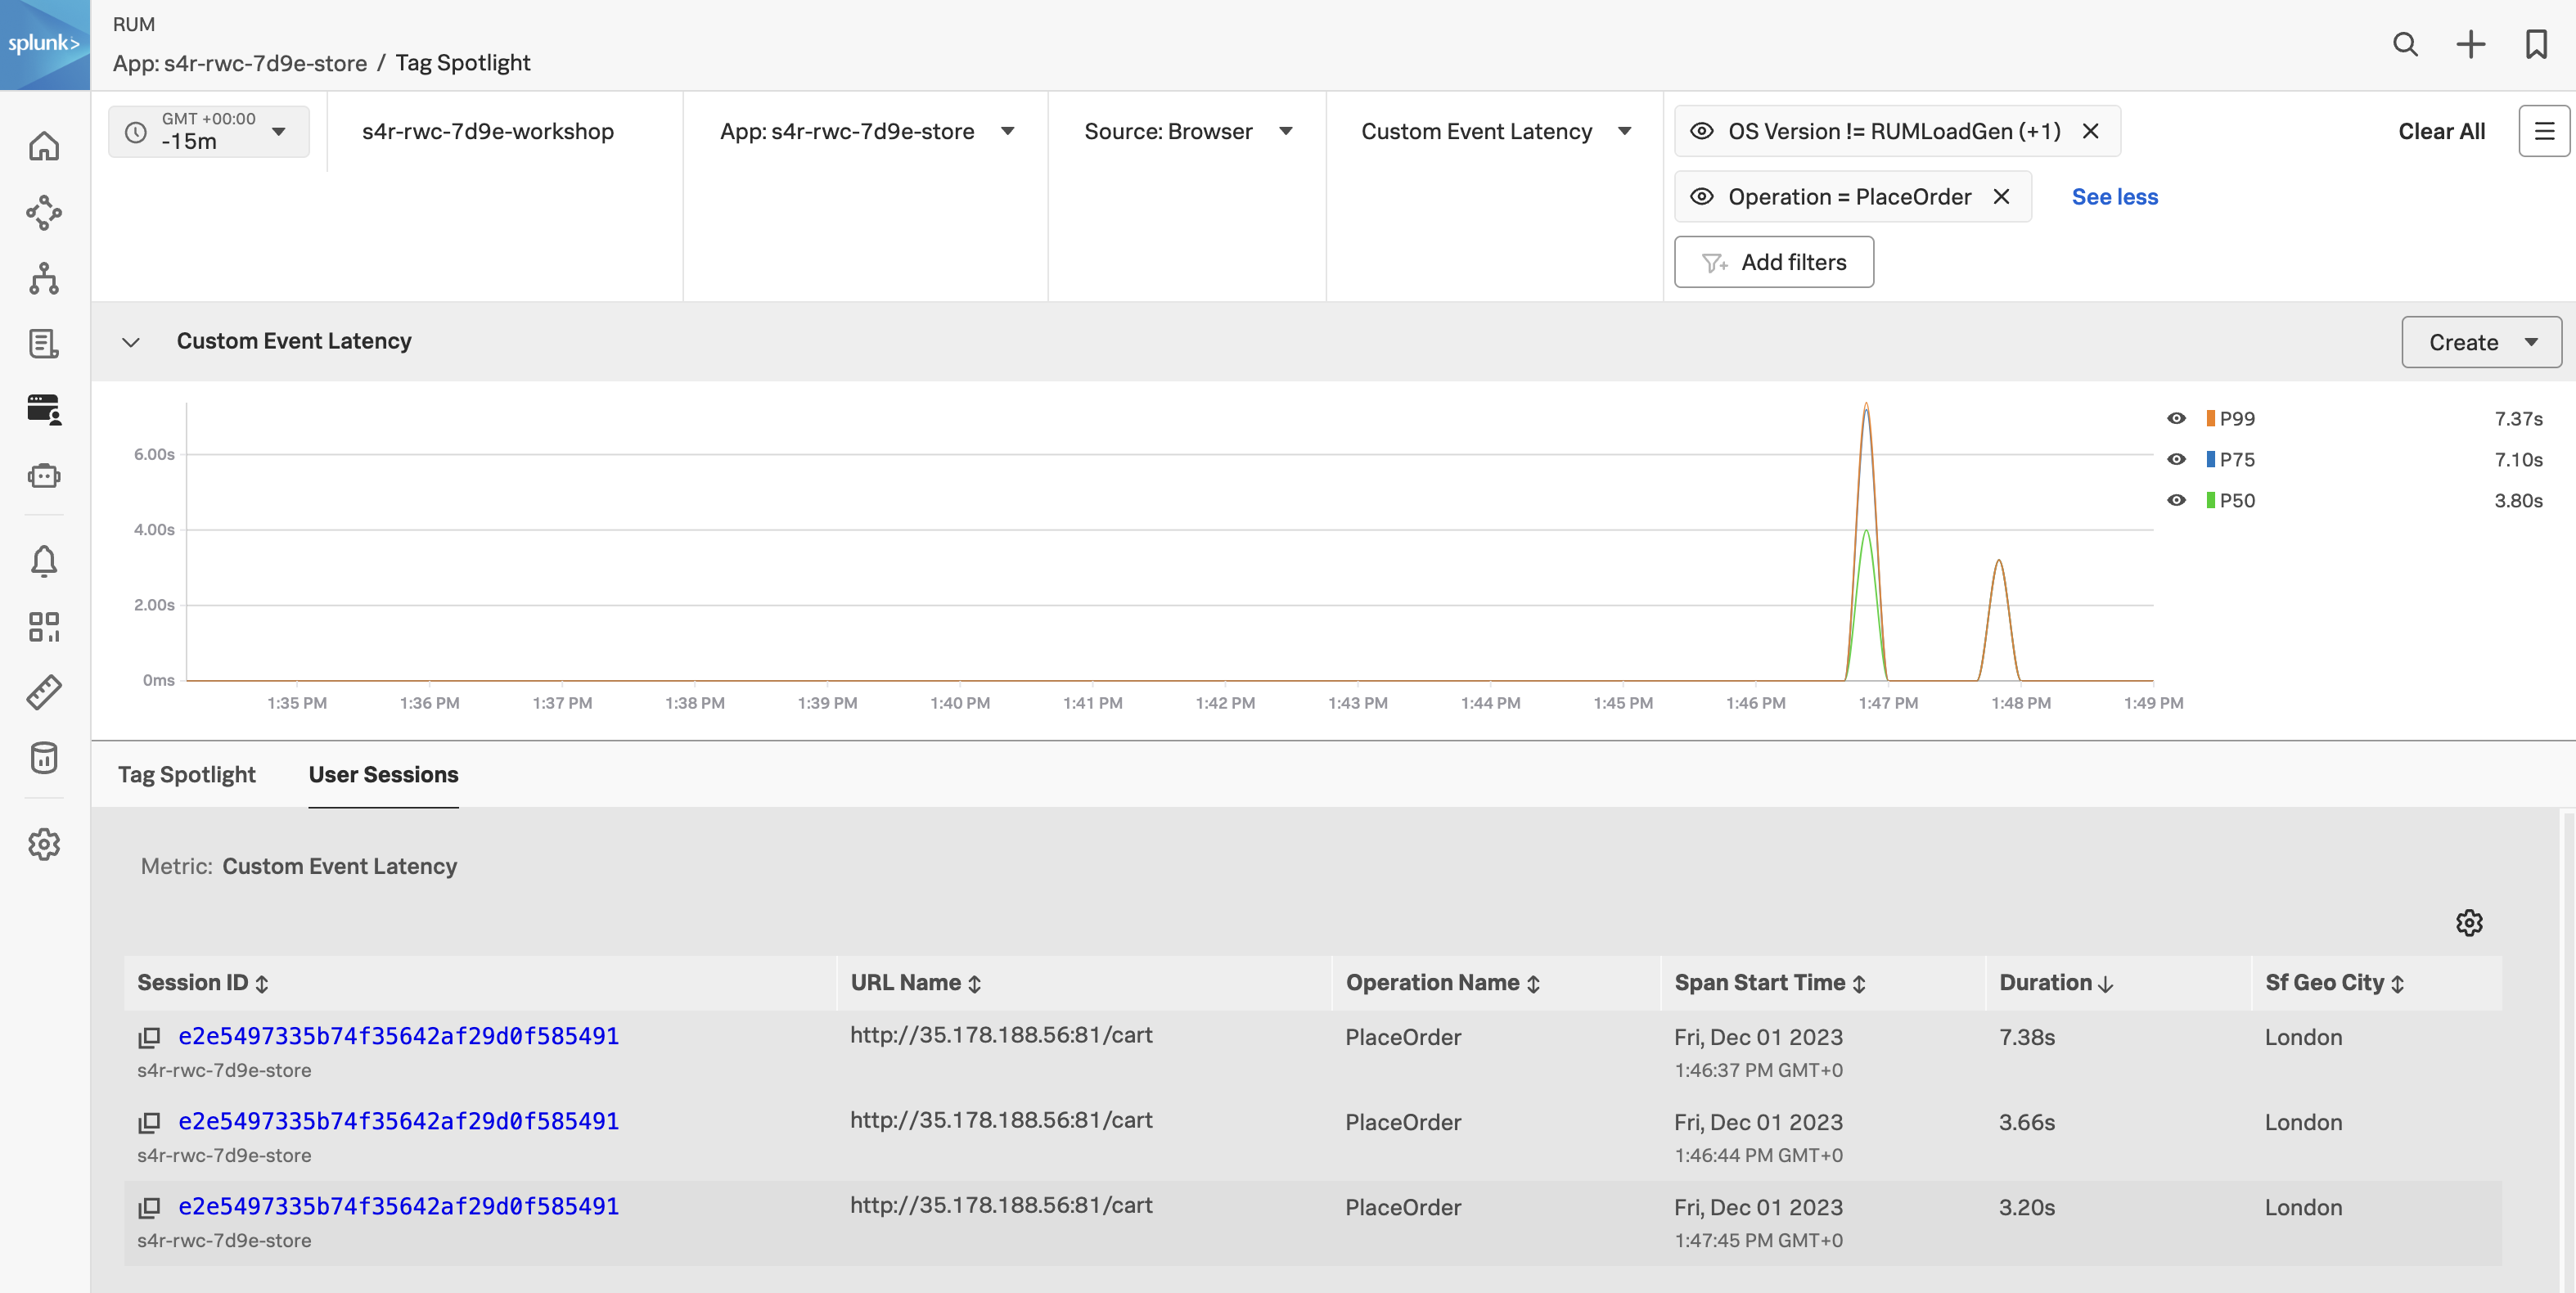
Have a look at the Custom Event Latency chart. The metrics shown here show the application latency. The comparison metrics to the side show the latency compared to 1 hour ago (which is selected in the top filter bar).
Click on the see all link under the chart title.
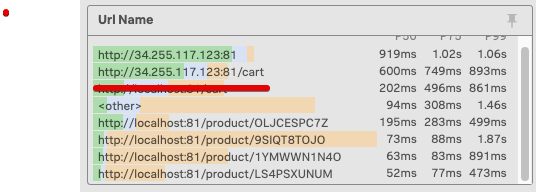
In this dashboard view, you are presented with all the tags associated with the RUM data. Tags are key-value pairs that are used to identify the data. In this case, the tags are automatically generated by the OpenTelemetry instrumentation. The tags are used to filter the data and to create the charts and tables. The Tag Spotlight view allows you to drill down into a user session.
Exercise
Change the timeframe to Last 1 hour.
Click Add Filters, select OS Version, click != and select Synthetics and RUMLoadGen then click the Apply Filter button.
Find the Custom Event Name chart, locate PlaceOrder in the list, click on it and select Add to filter.
Notice the large spikes in the graph across the top.
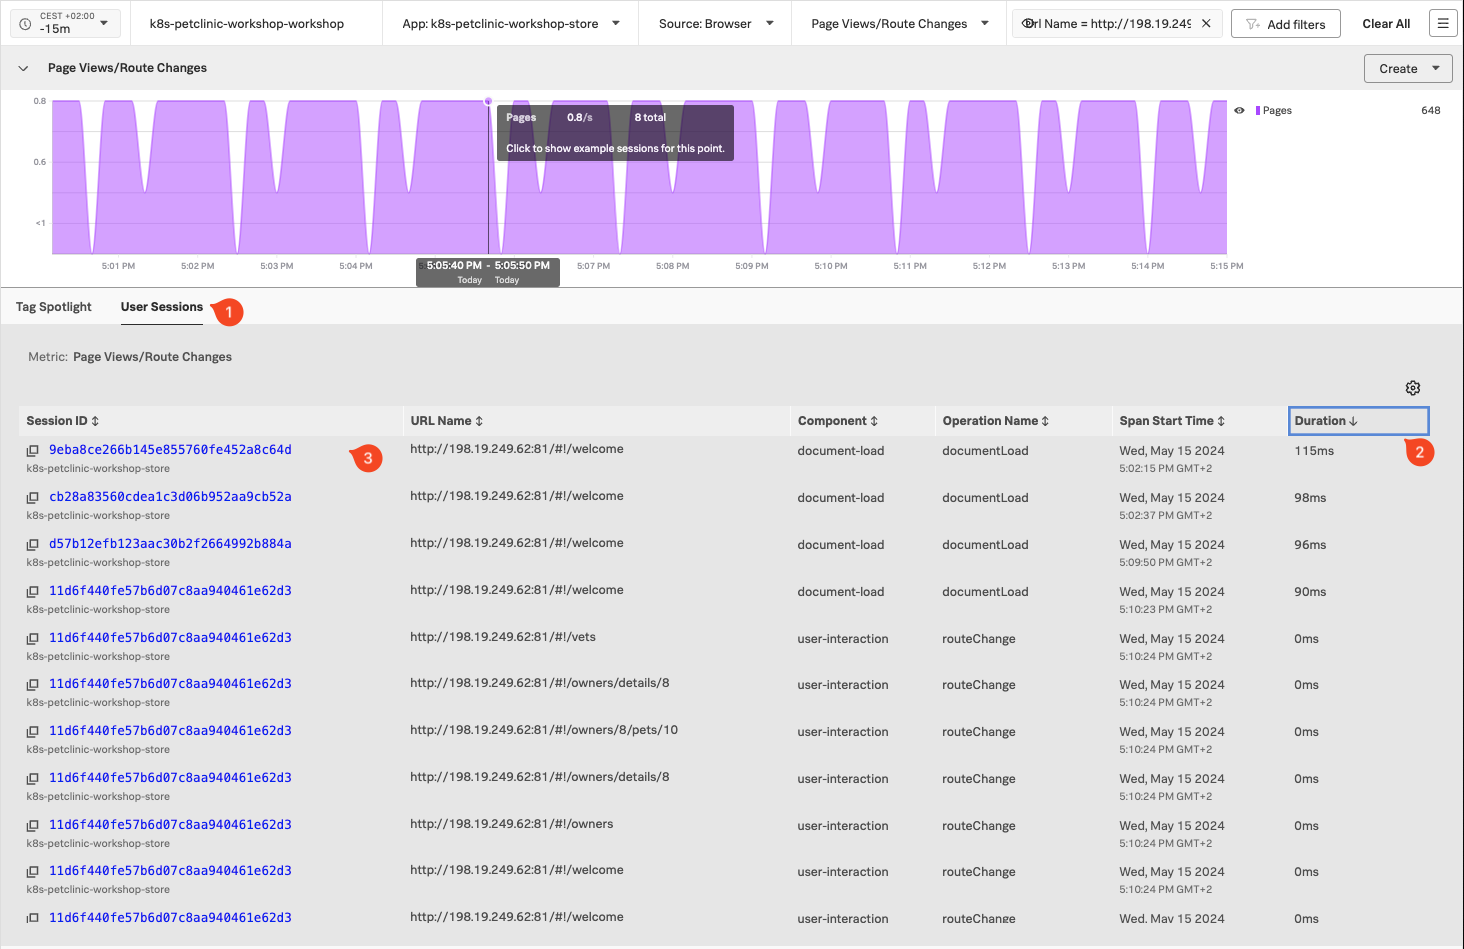
Click on the User Sessions tab.
Click on the Duration heading twice to sort the sessions by duration (longest at the top).
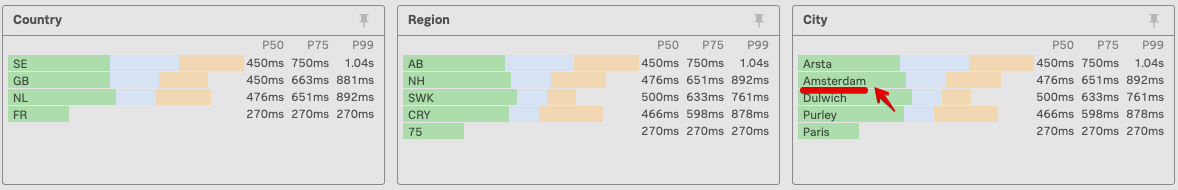
Click on the above the table and select Sf Geo City from the list of additional columns and click Save
We now have a User Session table that is sorted by longest duration descending and includes the cities of all the users that have been shopping on the site. We could apply more filters to further narrow down the data e.g. OS version, browser version, etc.
3. Session Replay
Sessions
A session is a collection of traces that correspond to the actions a single user takes when interacting with an application. By default, a session lasts until 15 minutes have passed from the last event captured in the session. The maximum session duration is 4 hours.
Exercise
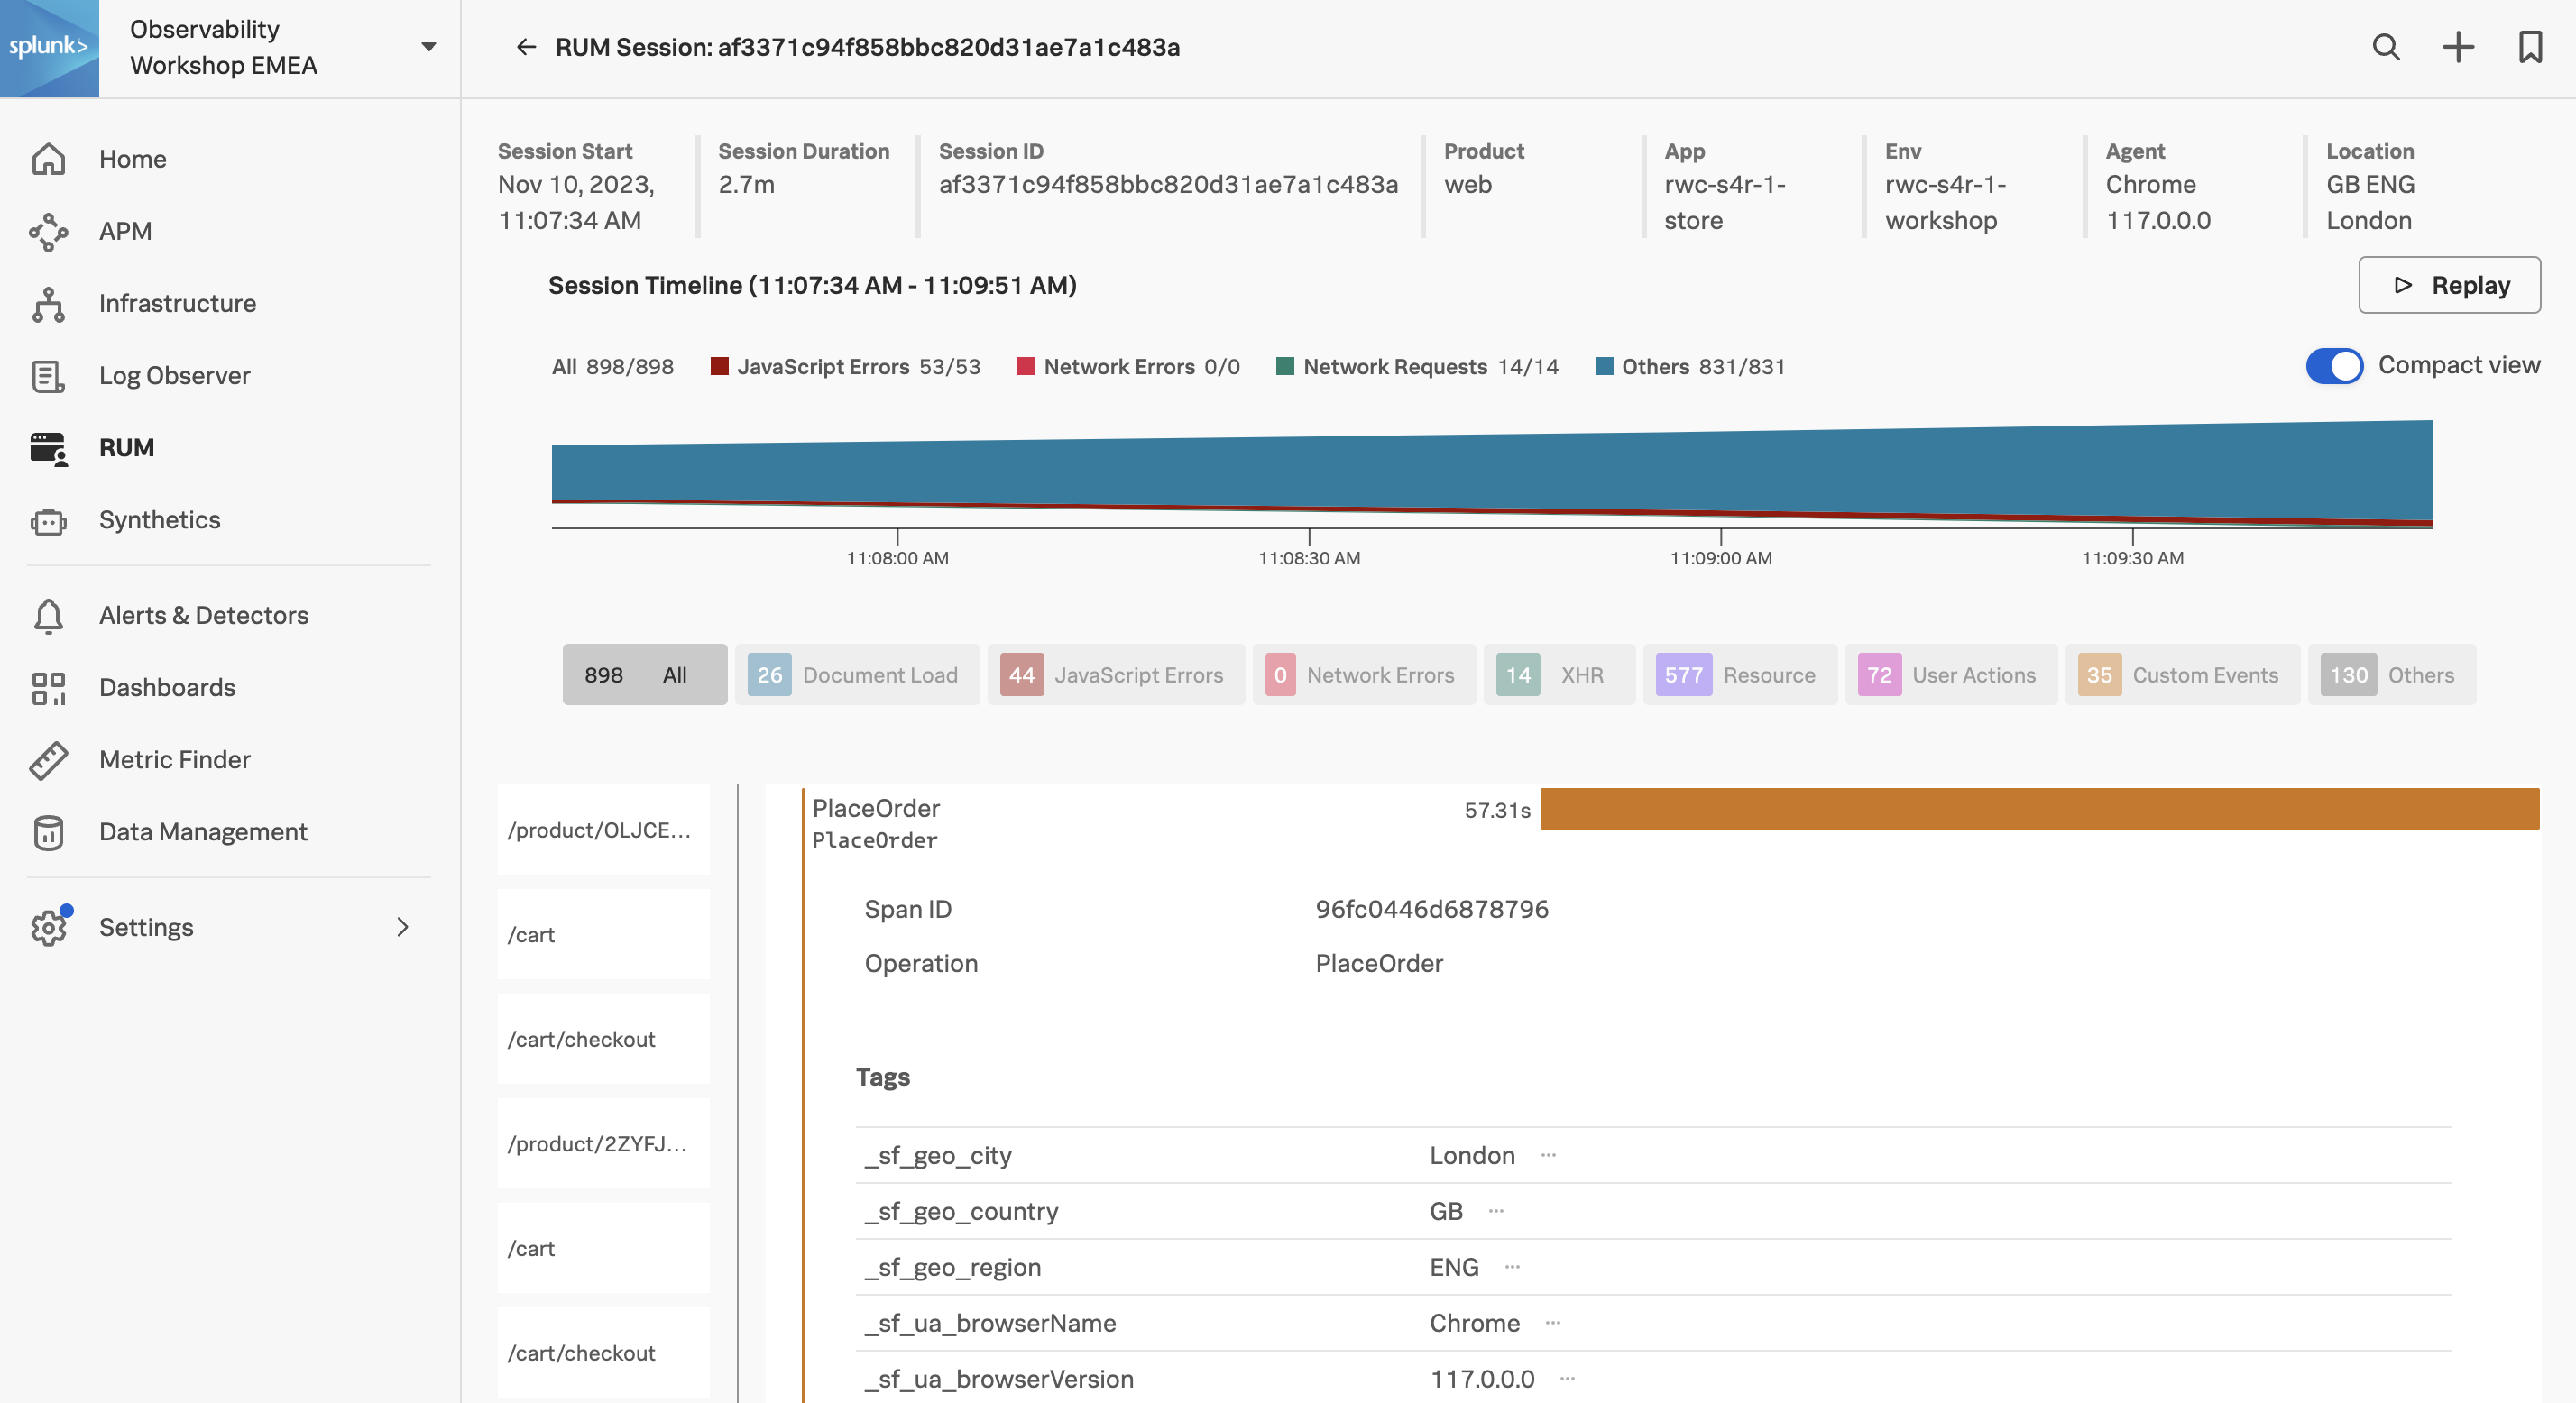
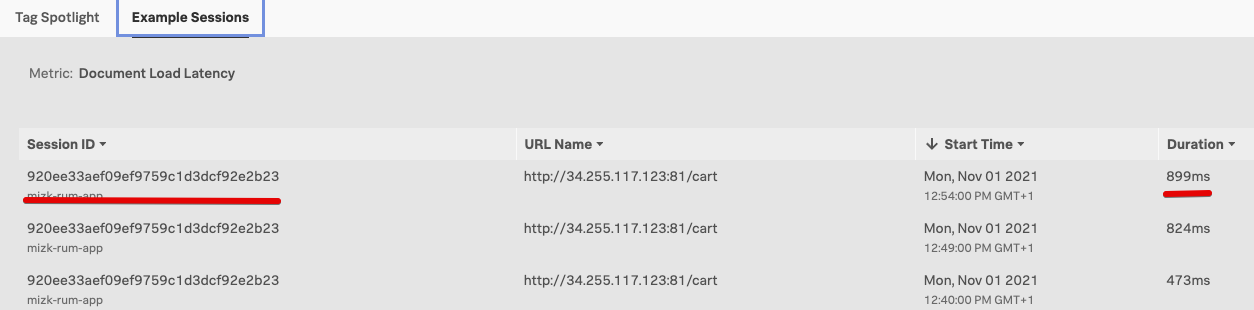
In the User Sessions table, click on the top Session ID with the longest Duration (over 20 seconds or longer), this will take you to the RUM Session view.
Exercise
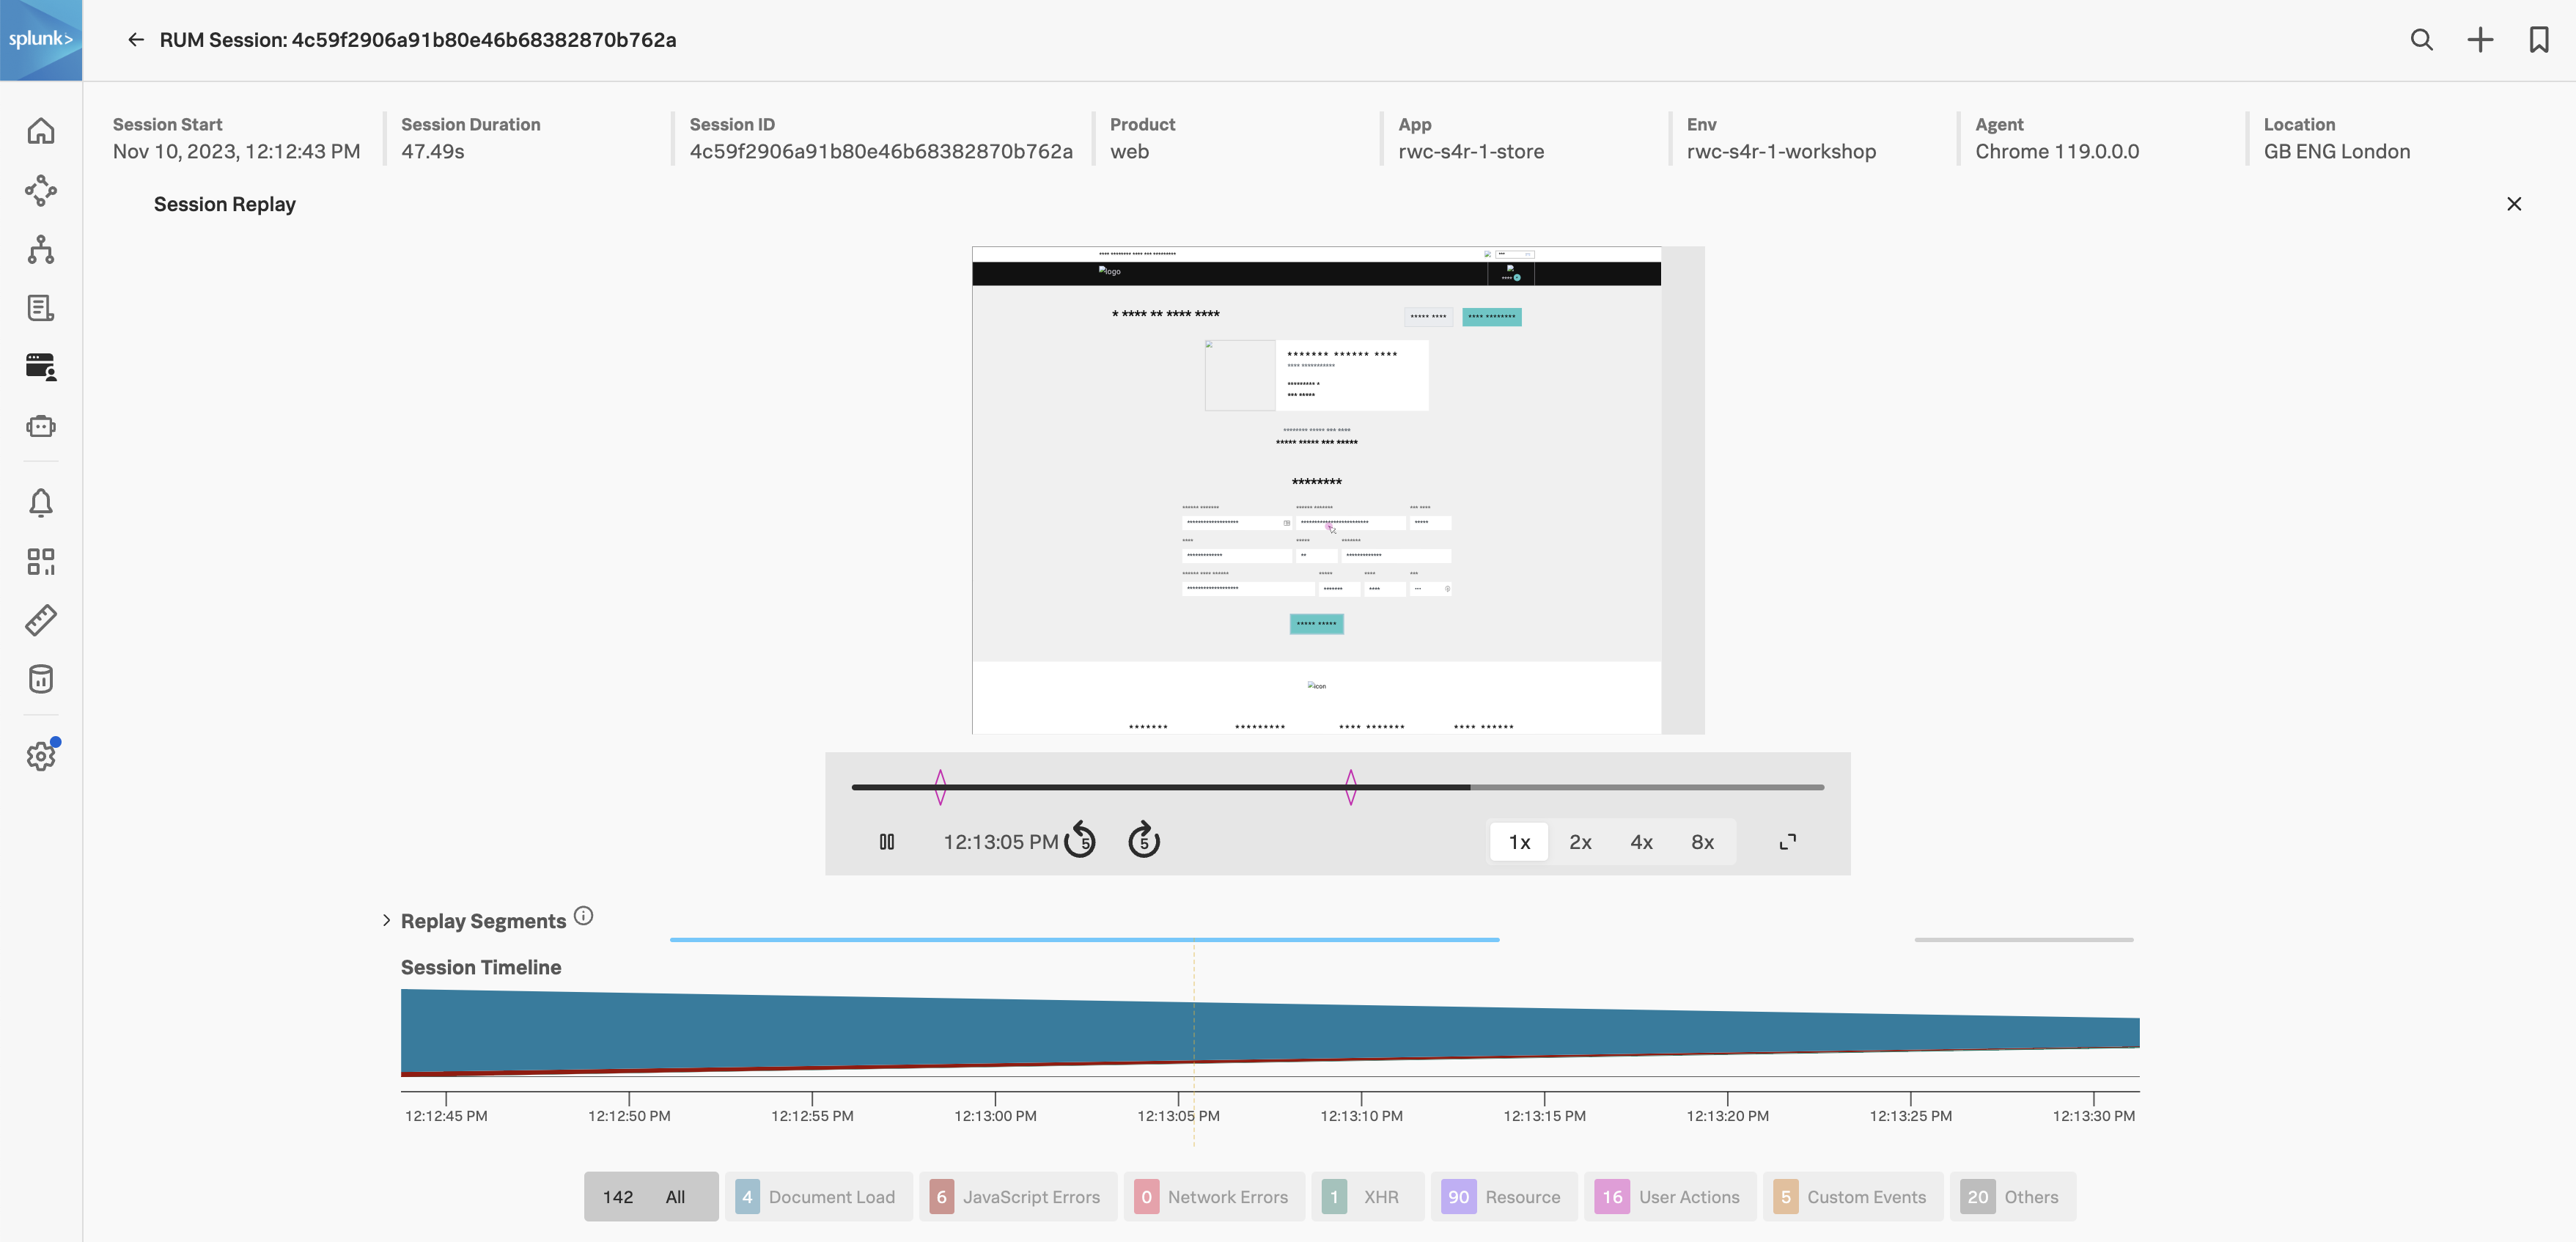
Click the RUM Session Replay Replay button. RUM Session Replay allows you to replay and see the user session. This is a great way to see exactly what the user experienced.
Click the button to start the replay.
RUM Session Replay can redact information, by default text is redacted. You can also redact images (which has been done for this workshop example). This is useful if you are replaying a session that contains sensitive information. You can also change the playback speed and pause the replay.
Tip
When playing back the session, notice how the mouse movements are captured. This is useful to see where the user is focusing their attention.
4. User Sessions
Exercise
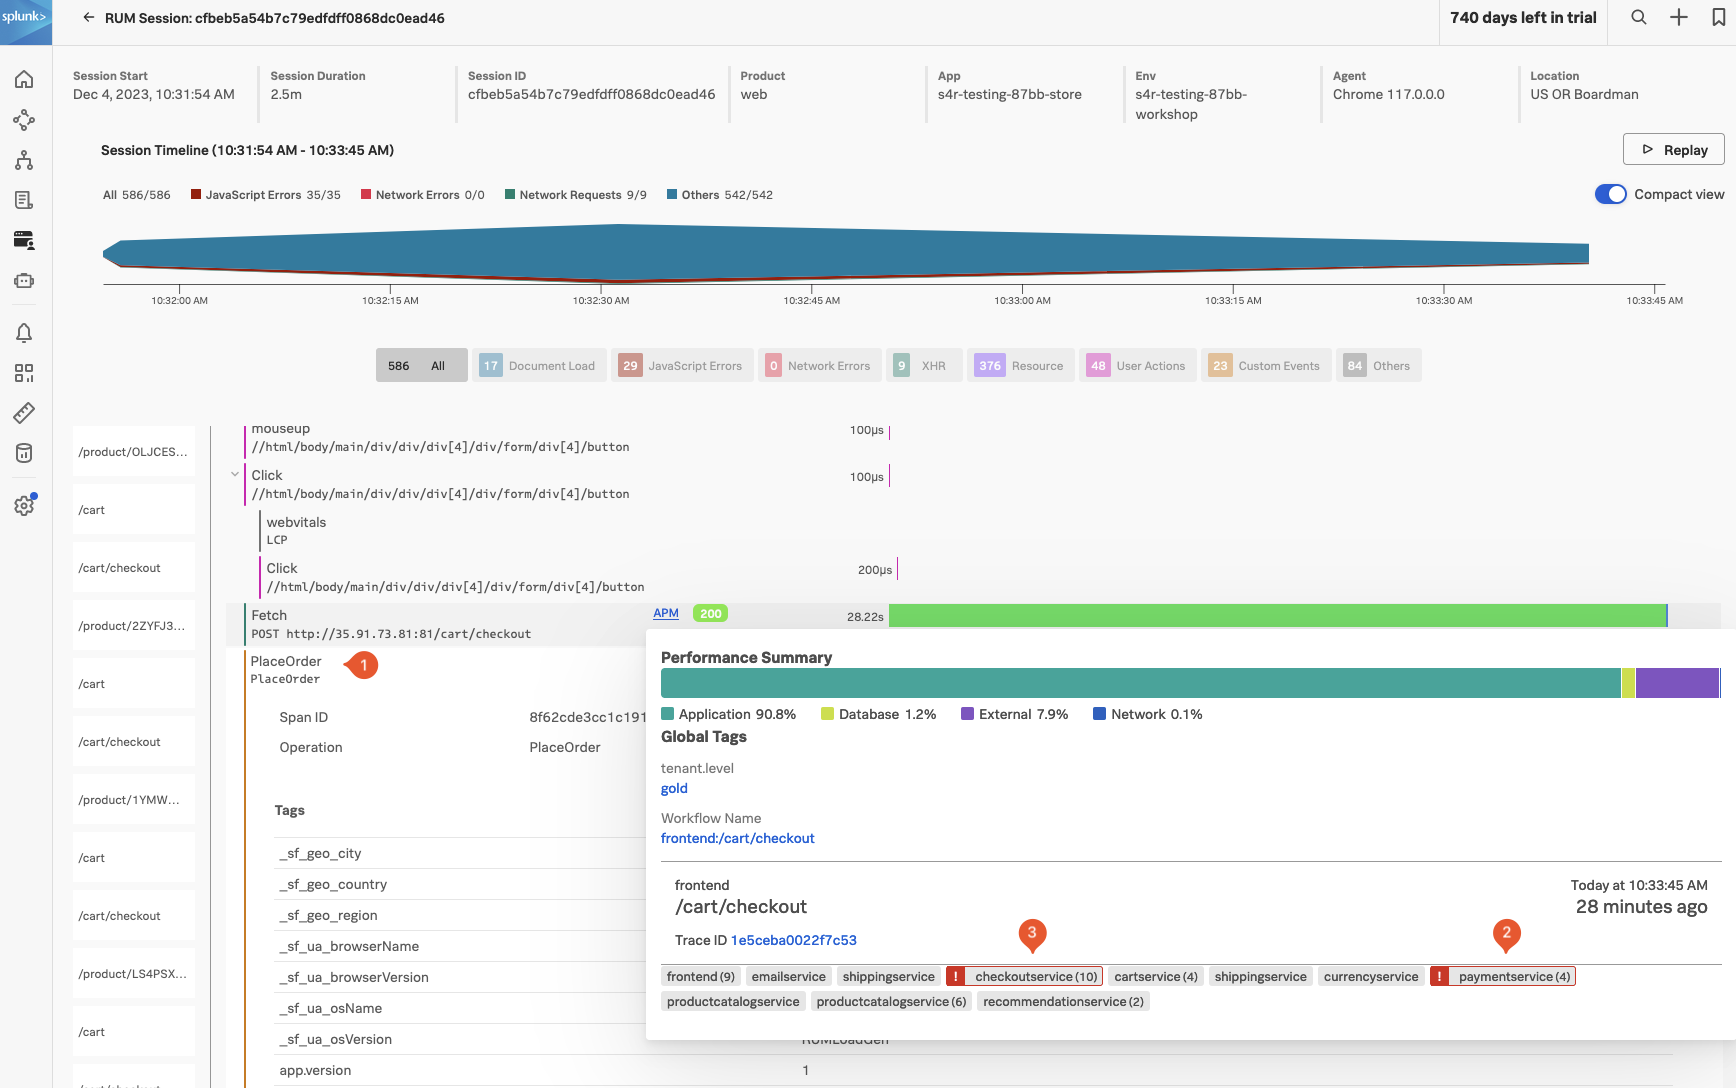
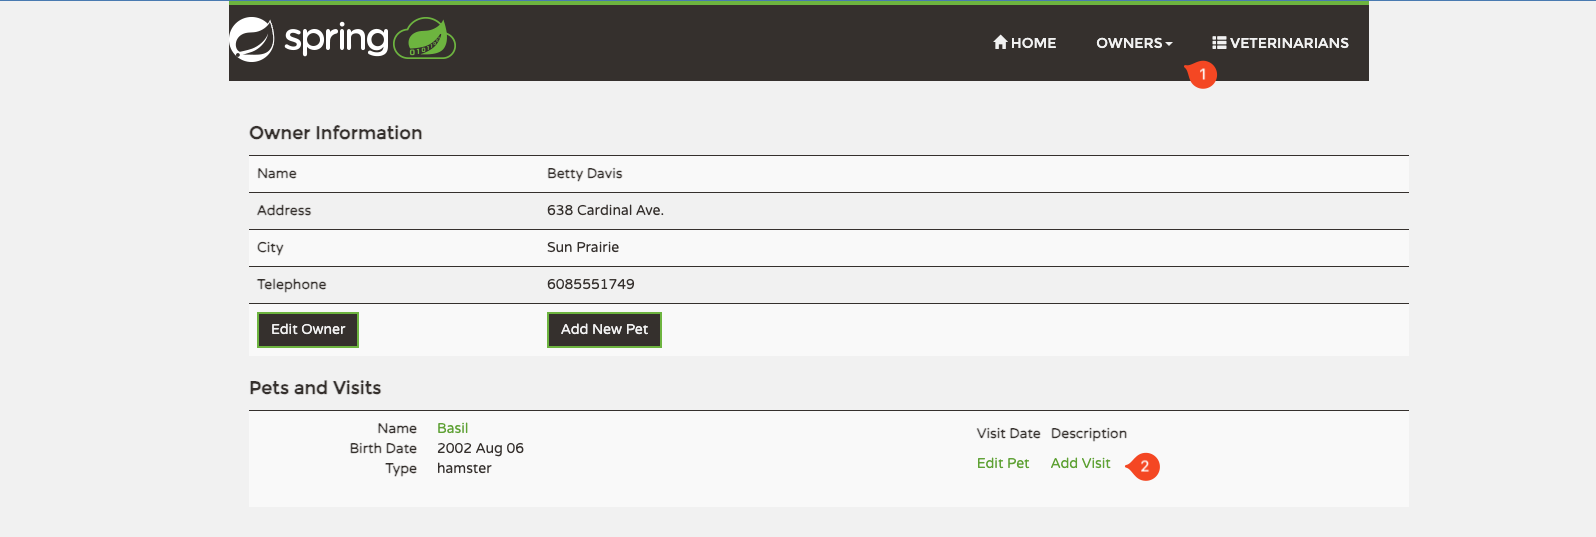
Close the RUM Session Replay by clicking on the X in the top right corner. We had set a filter on PlaceOrder in the previous exercise. It should be selected here as well, as shown in the screenshot below (1).
Note the length of the span, this is the time it took to complete the order, not good!
Scroll down the page and you will see the Tags metadata (which is used in Tag Spotlight). After the tags, we come to the waterfall which shows the page objects that have been loaded (HTML, CSS, images, JavaScript etc.)
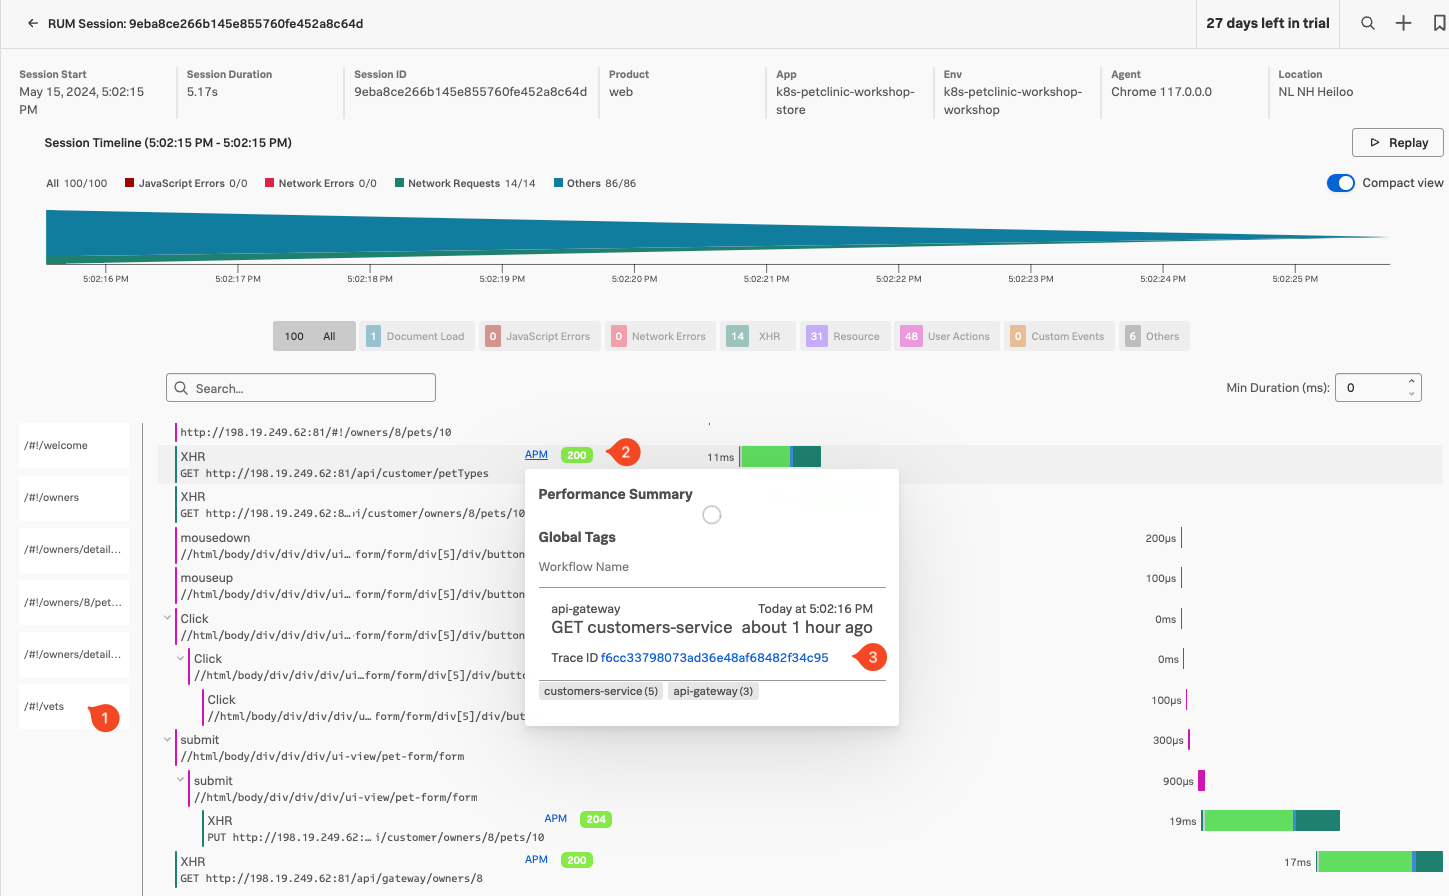
Keep scrolling down the page until you come to a blue APM link (the one with /cart/checkout at the end of the URL) and hover over it.
This brings up the APM Performance Summary. Having this end-to-end (RUM to APM) view is very useful when troubleshooting issues.
Exercise
You will see paymentservice (2) and checkoutservice (3) are in an error state as per the screenshot above.
Under Workflow Name click on front-end:/cart/checkout, this will bring up the APM Service Map.
Splunk APM
20 minutes
Persona
You are a back-end developer and you have been called in to help investigate an issue found by the SRE. The SRE has identified a poor user experience and has asked you to investigate the issue.
Discover the power of full end-to-end visibility by jumping from a RUM trace (front-end) to an APM trace (back-end). All the services are sending telemetry (traces and spans) that Splunk Observability Cloud can visualize, analyze and use to detect anomalies and errors.
RUM and APM are two sides of the same coin. RUM is the client-side view of the application and APM is the server-side view. In this section, we will use APM to drill down and identify where the problem is.
Subsections of Splunk APM
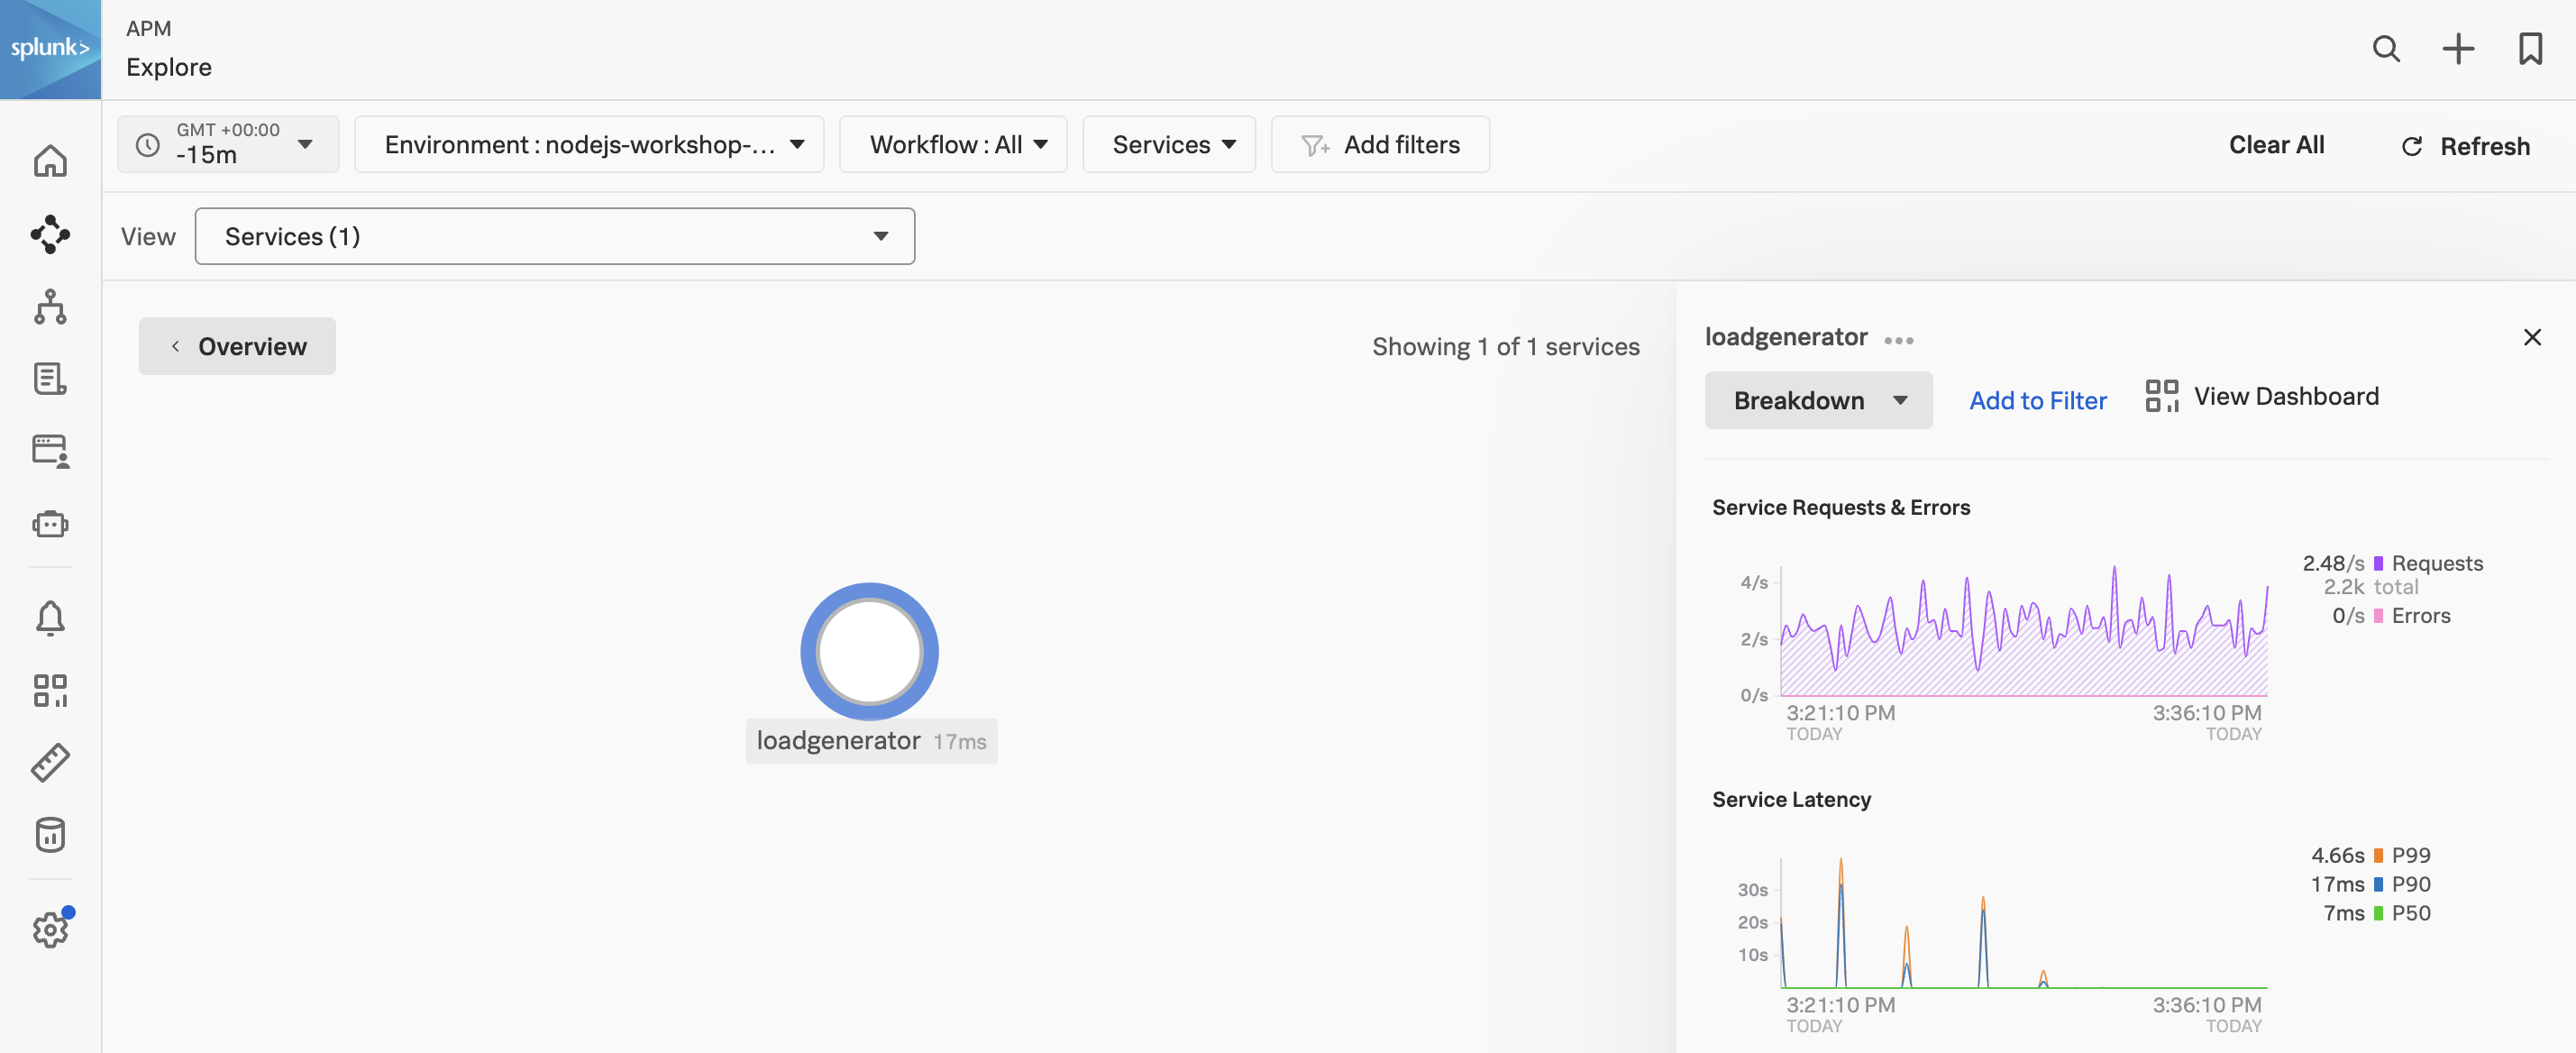
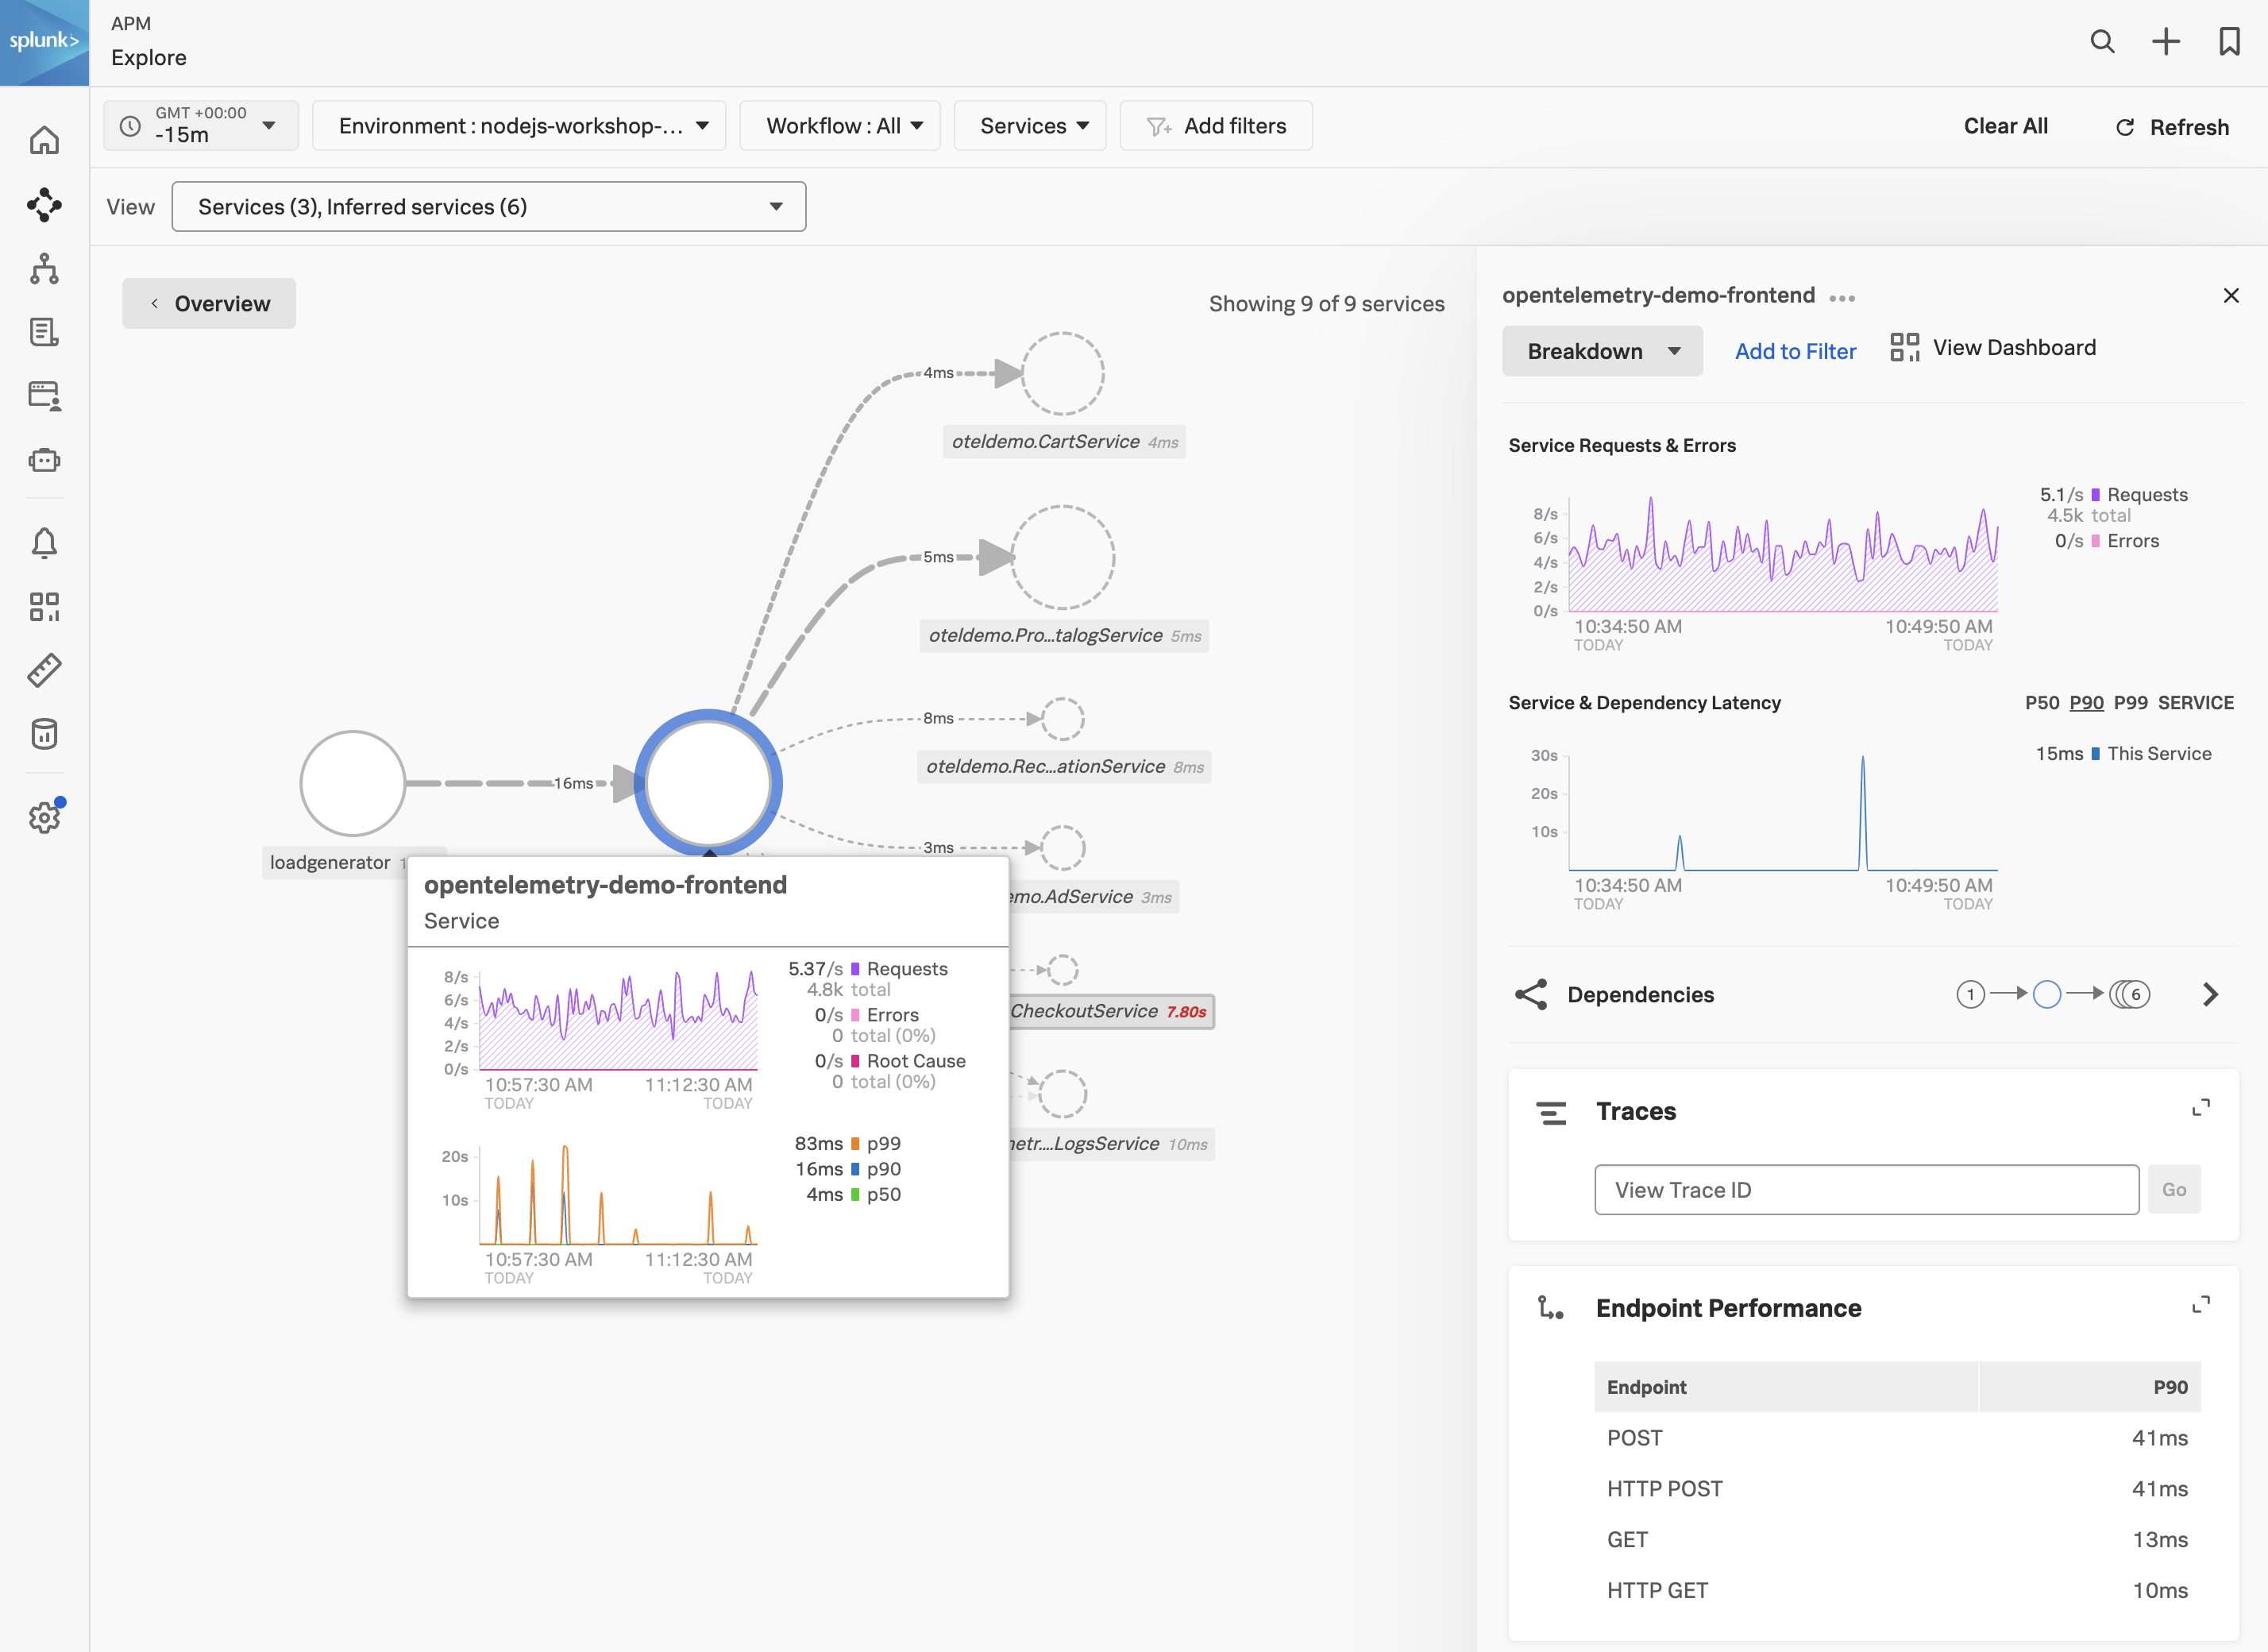
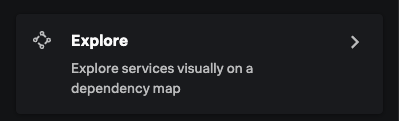
1. APM Explore
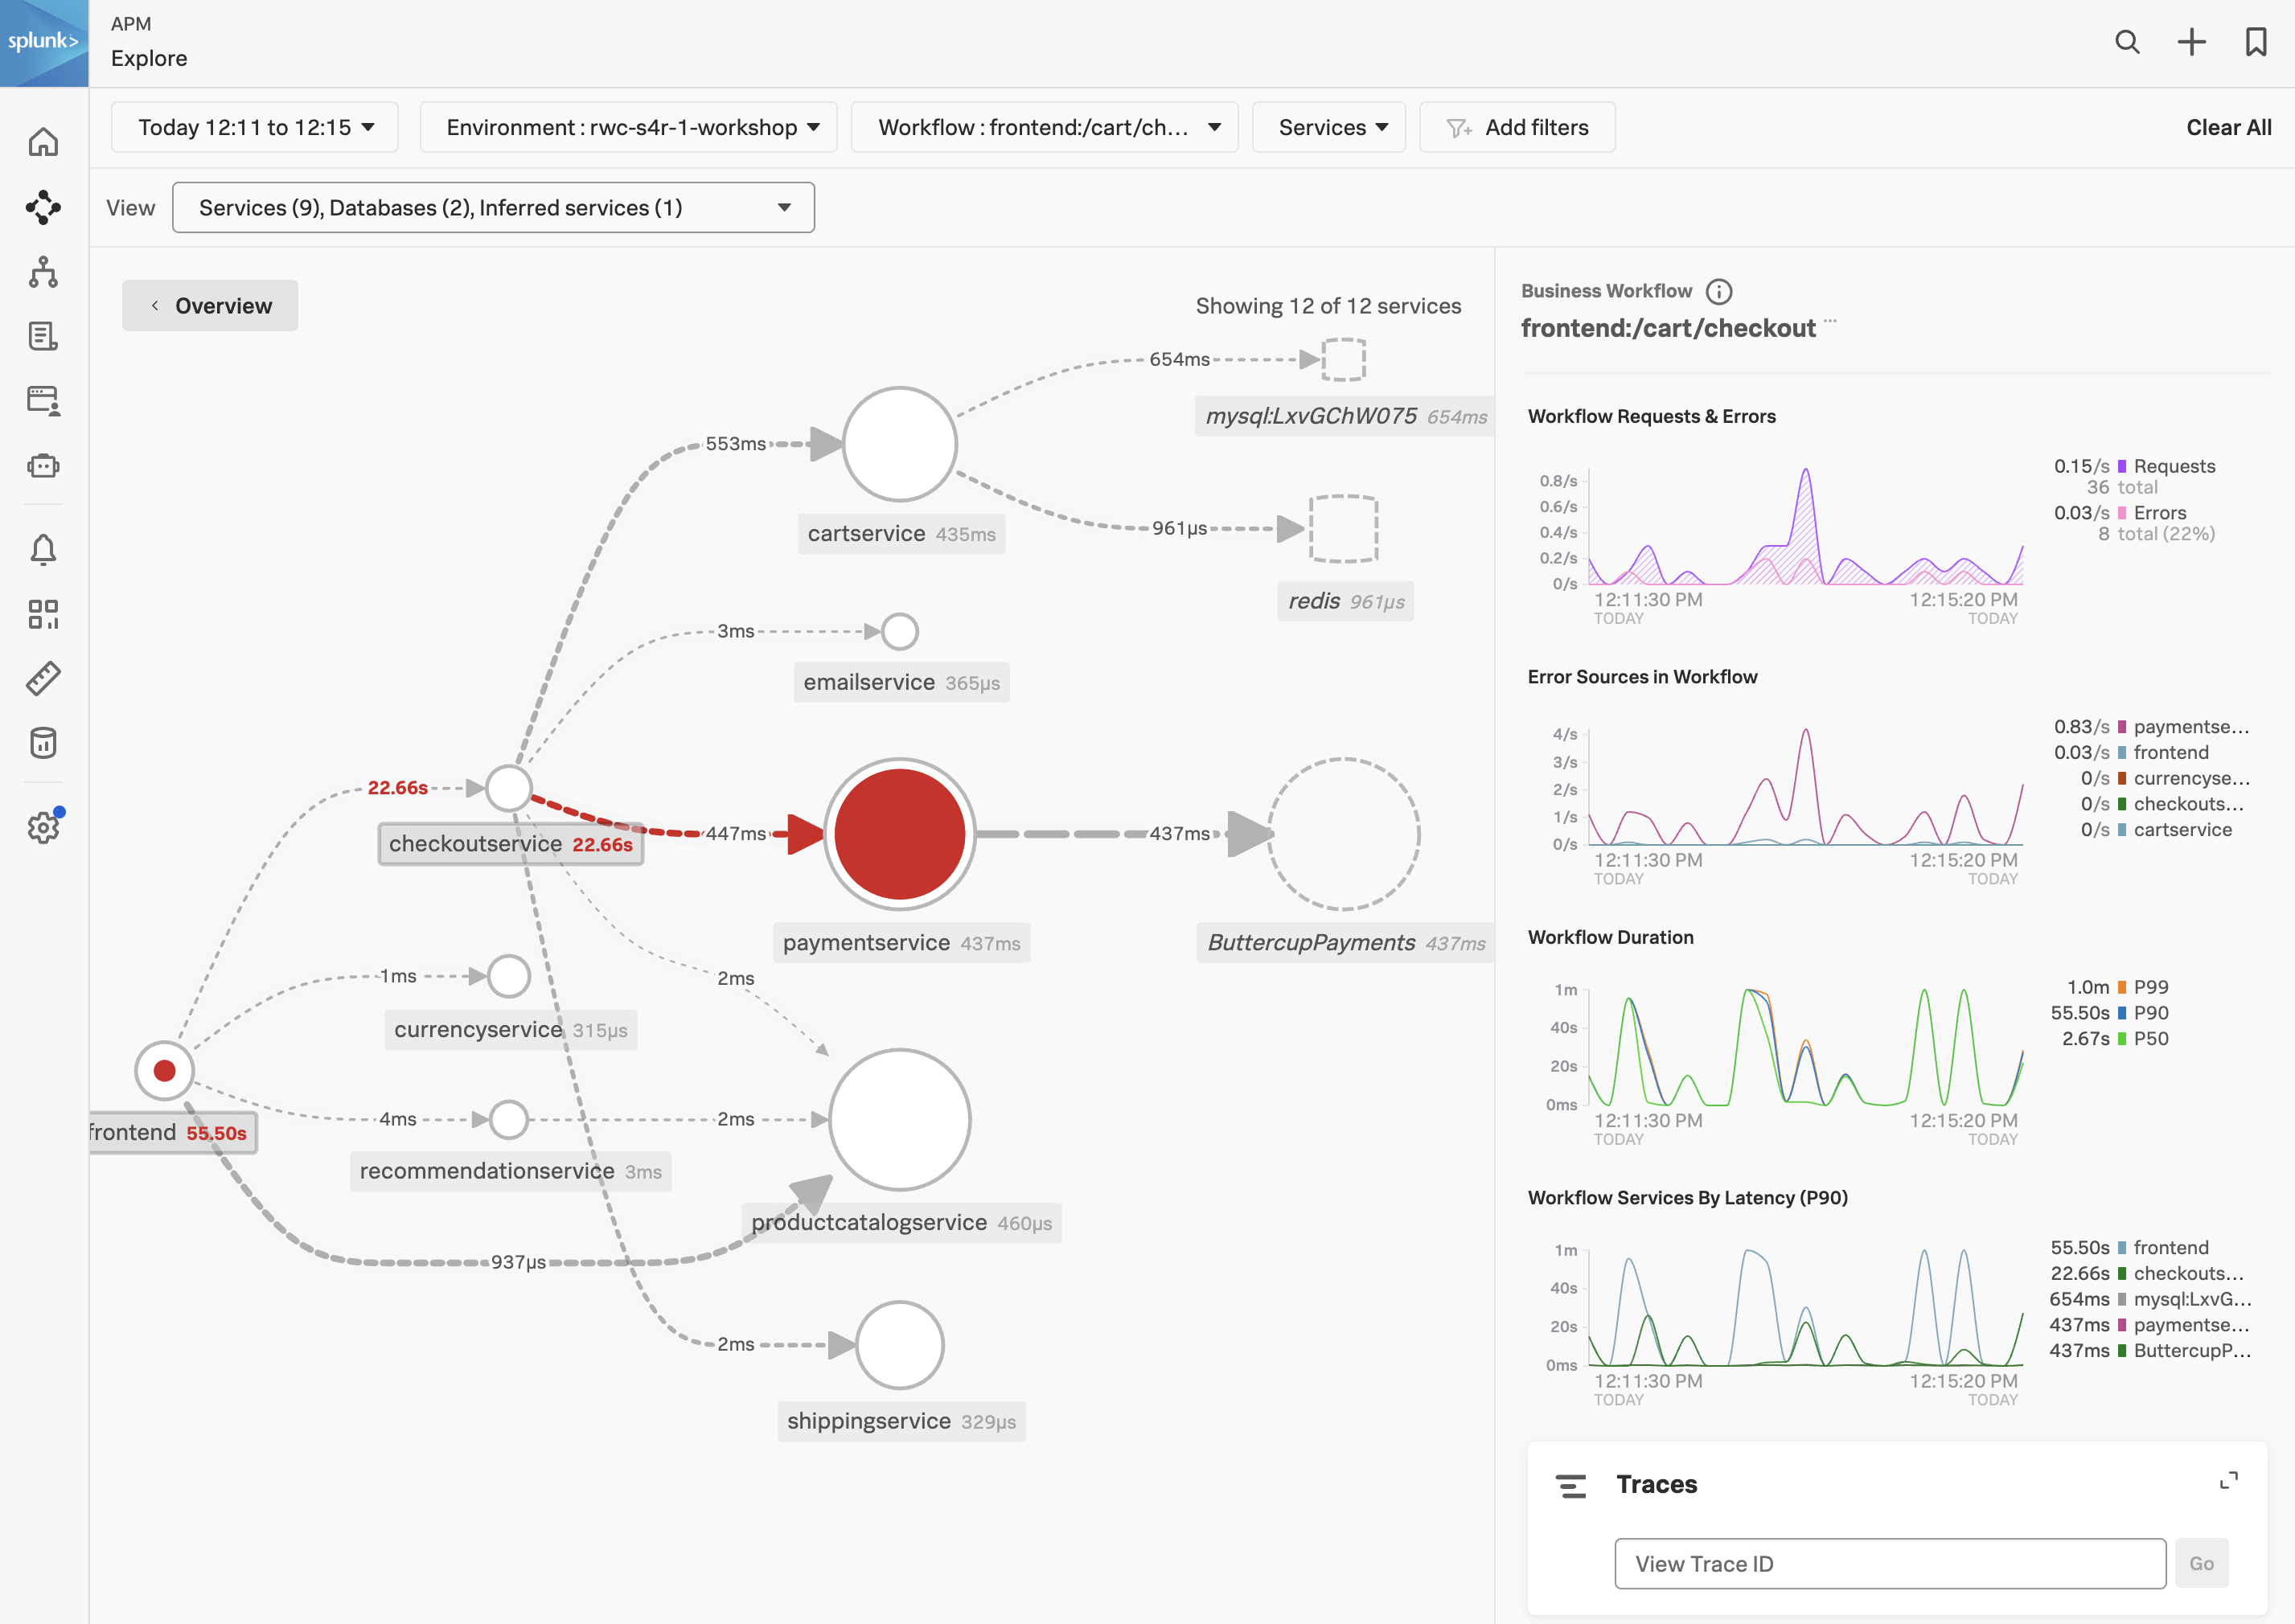
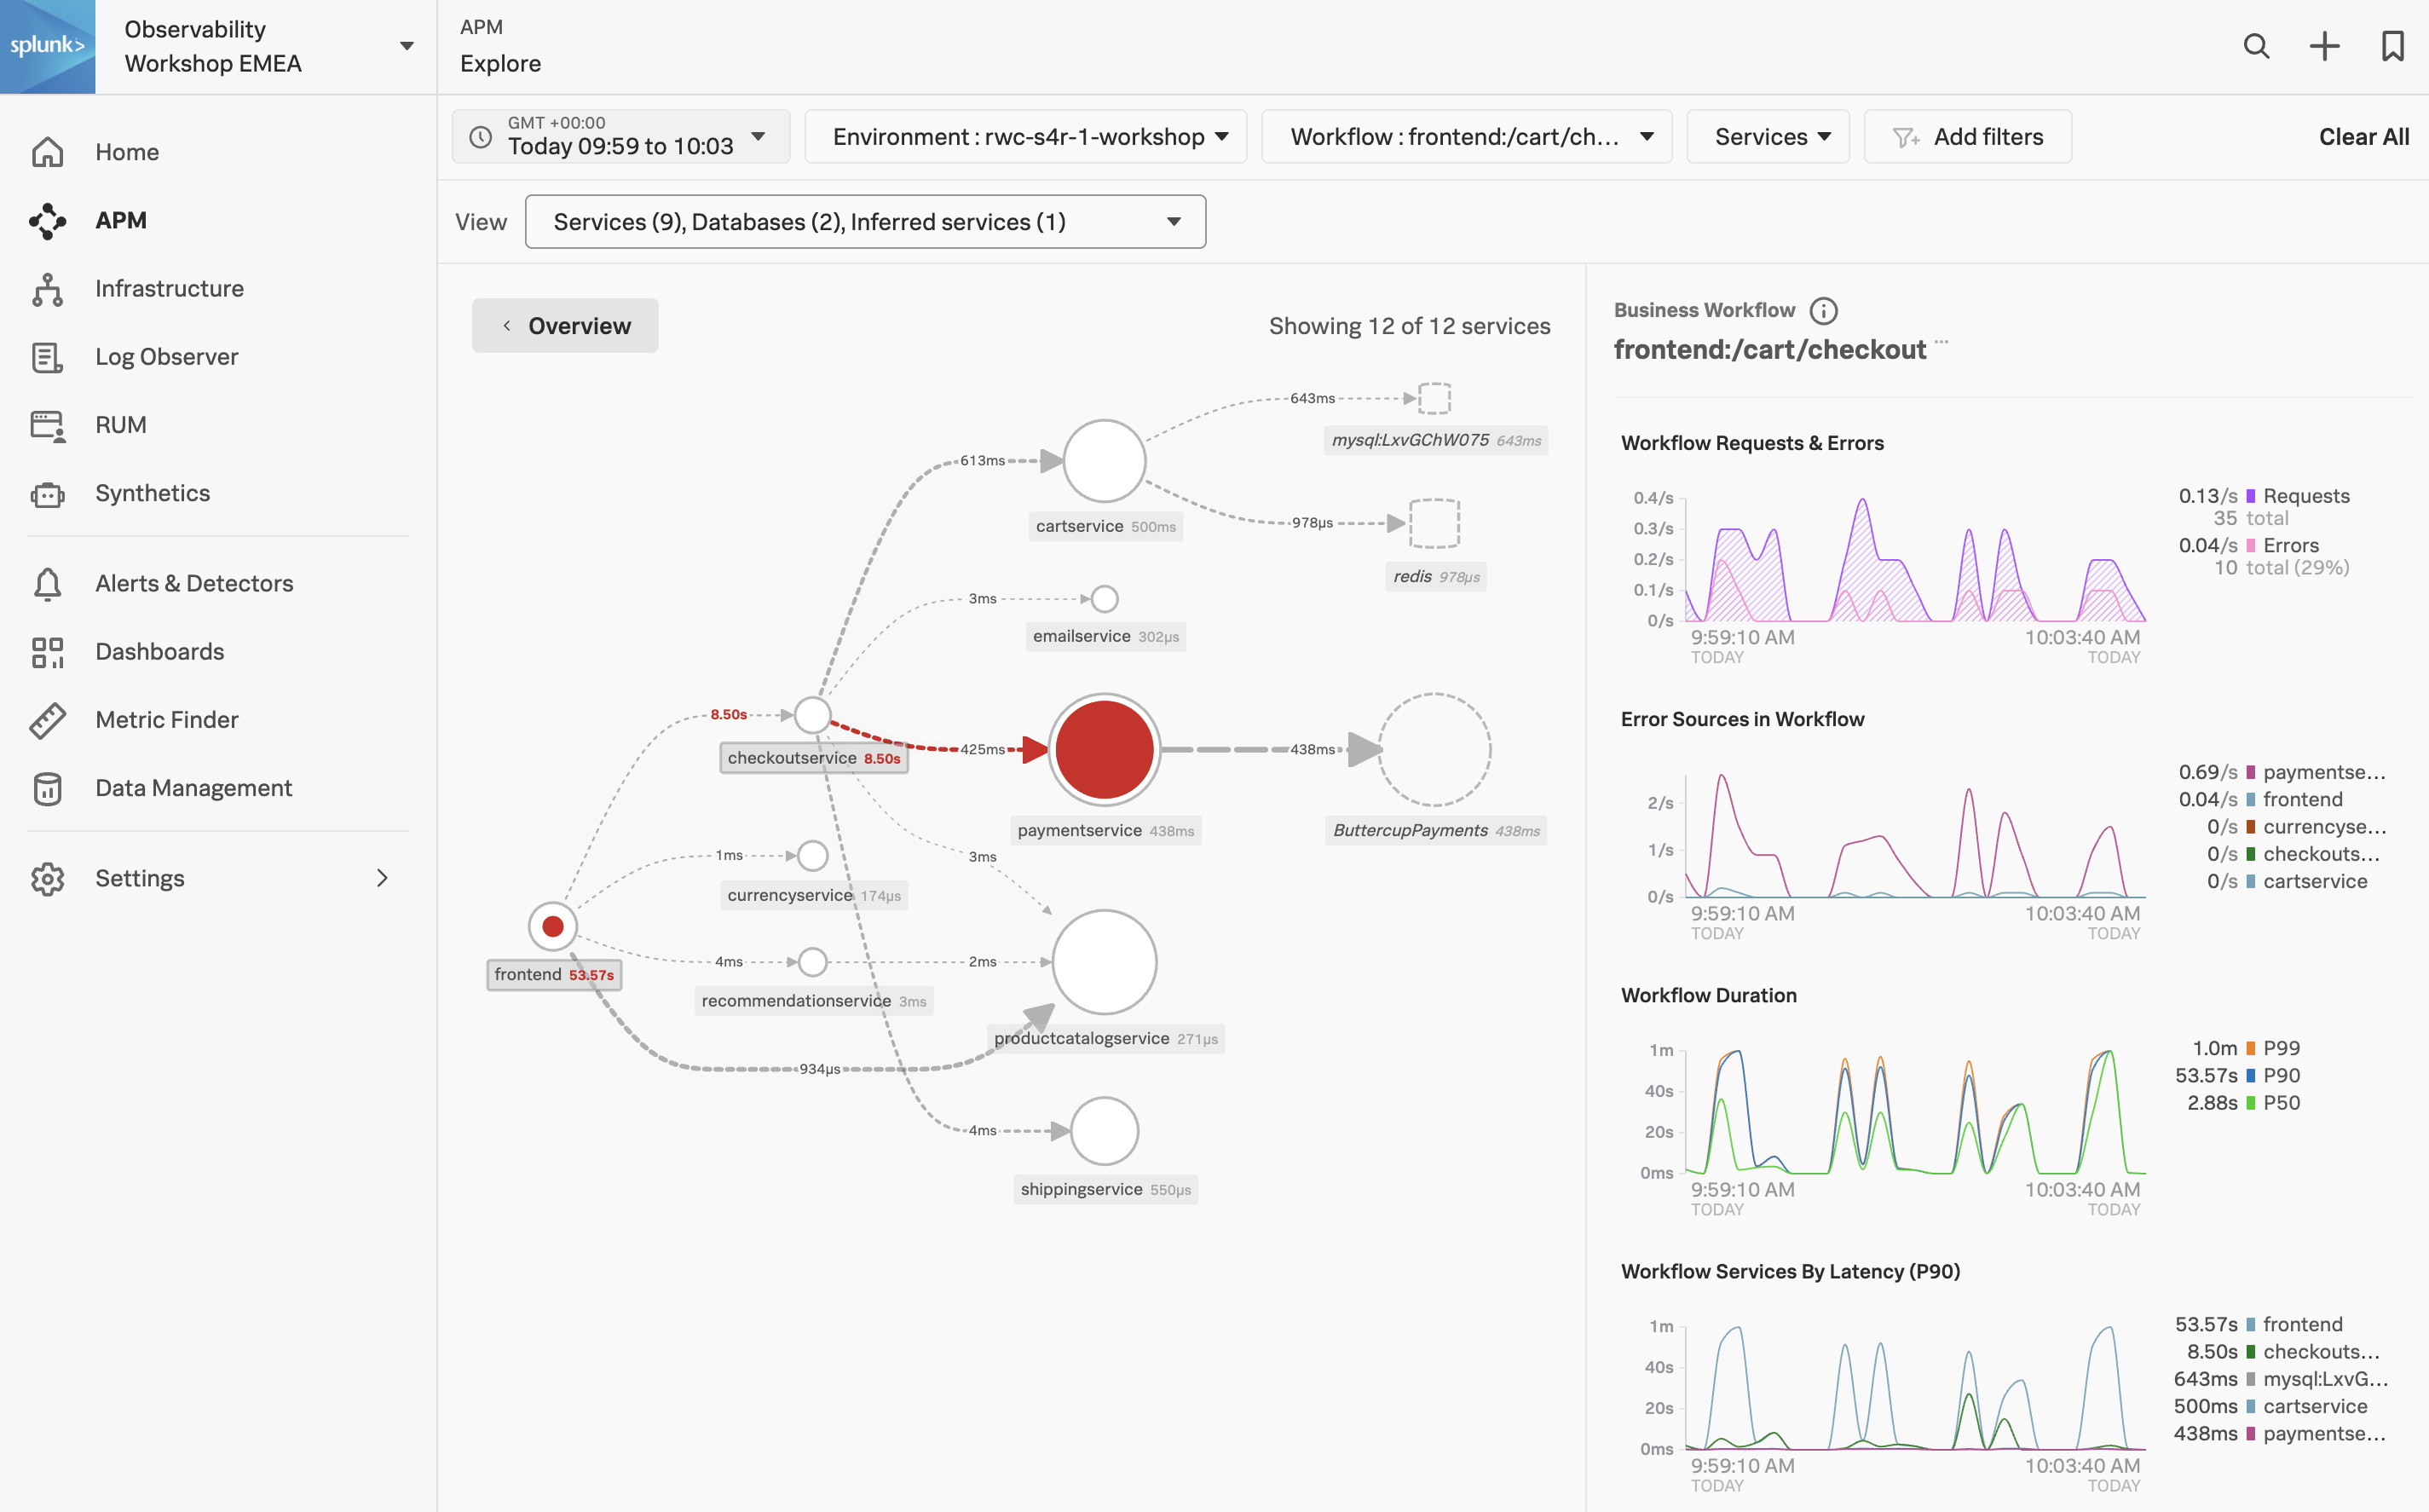
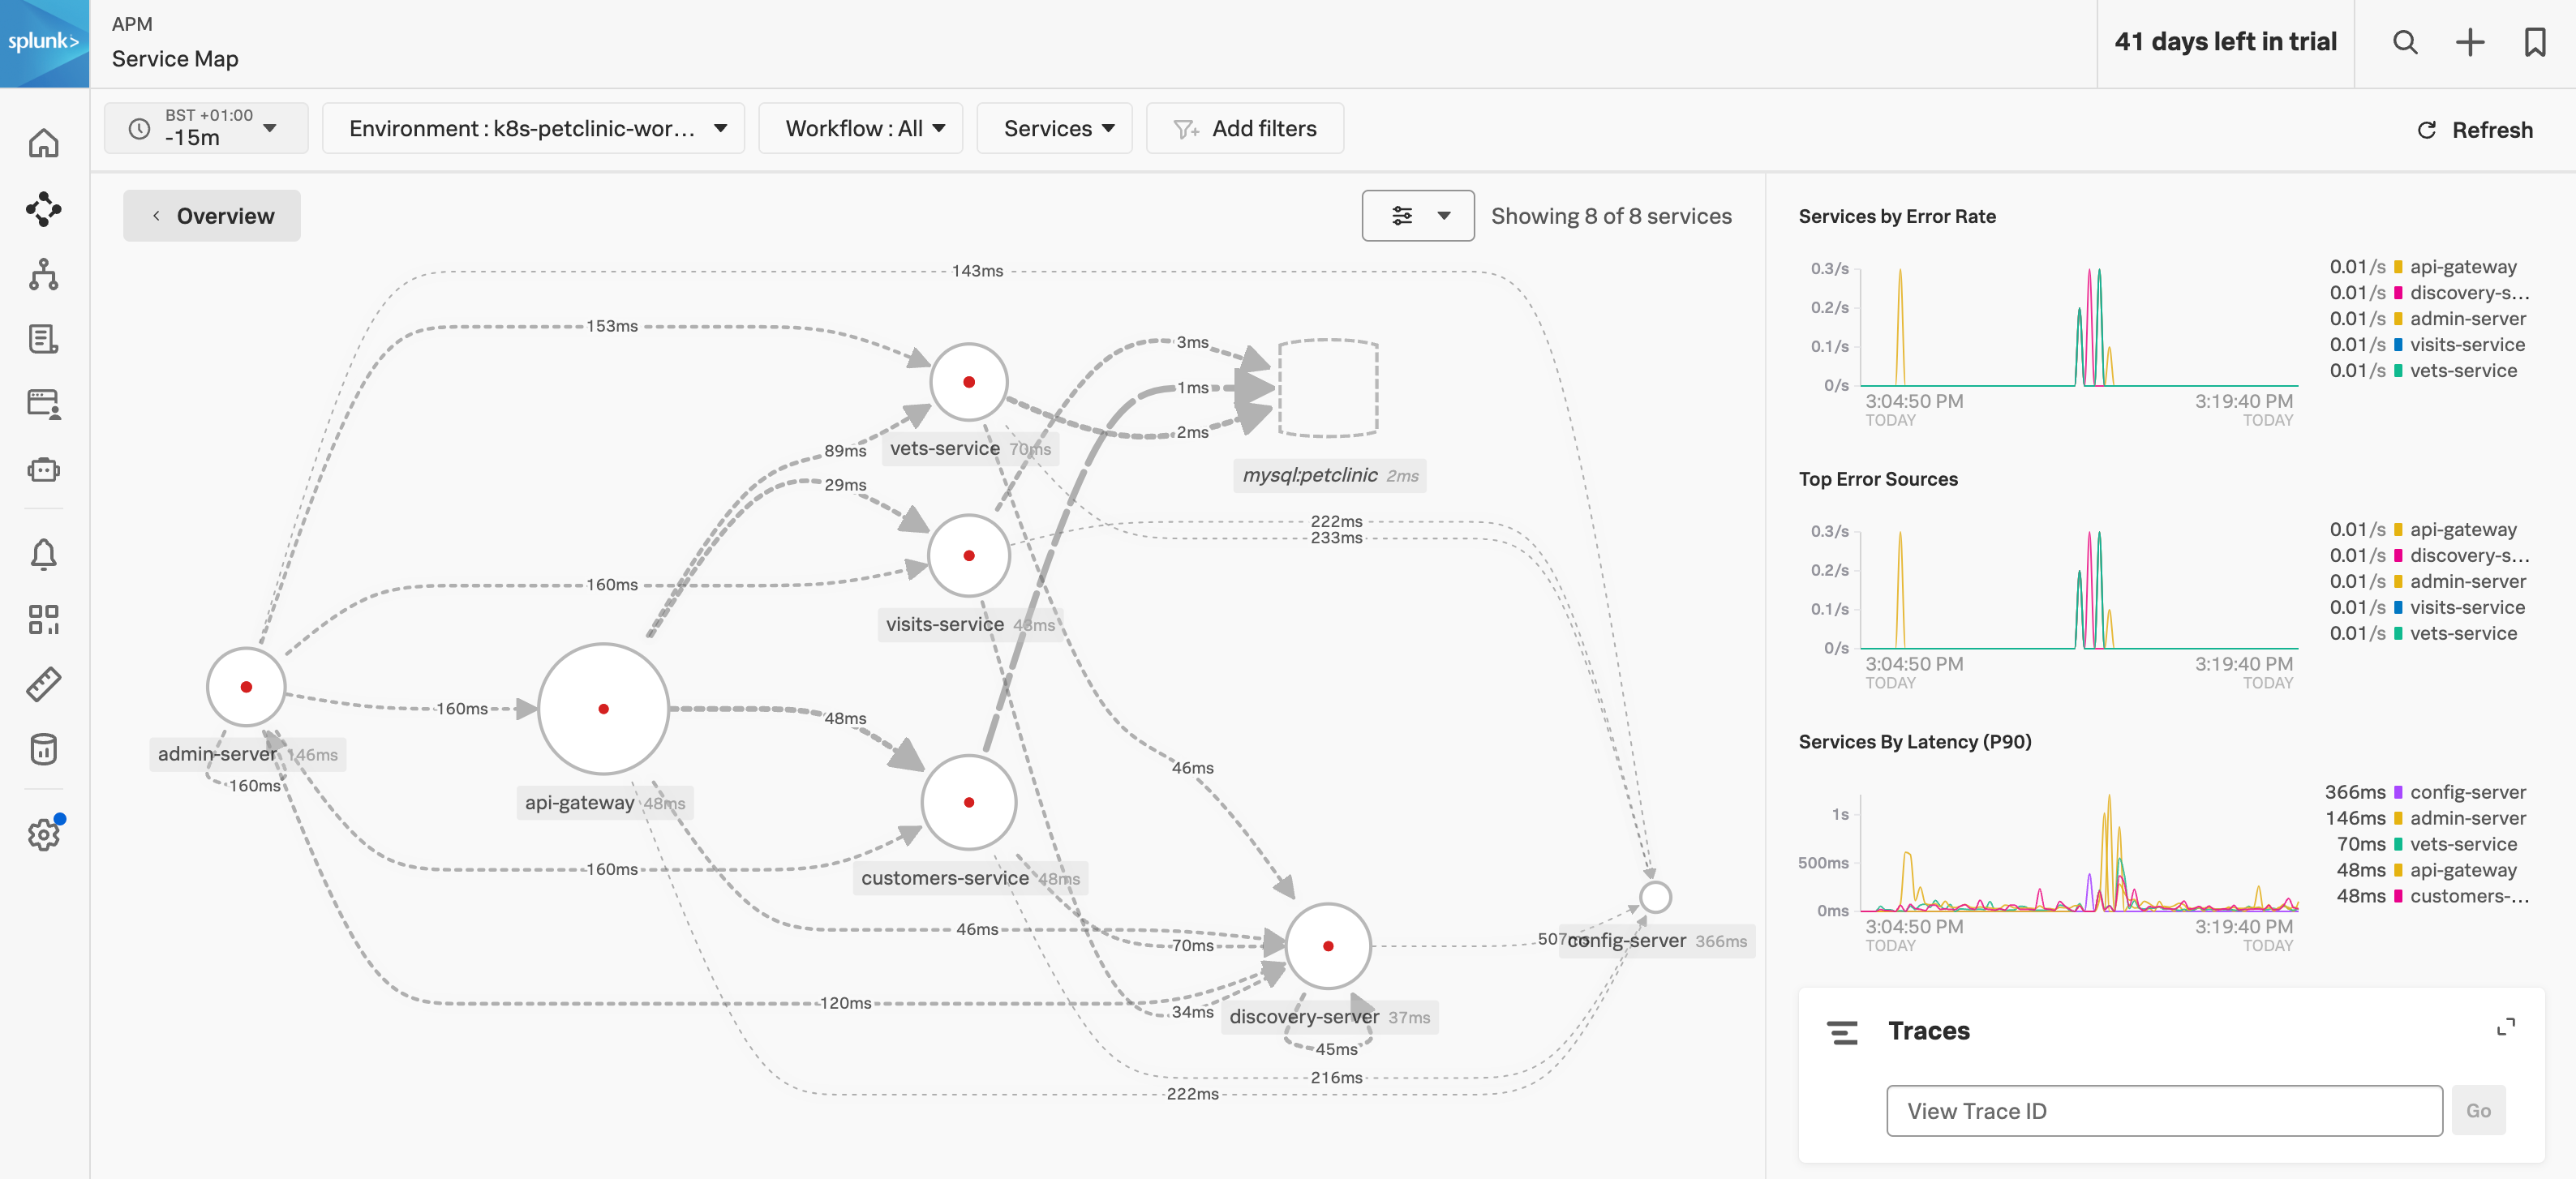
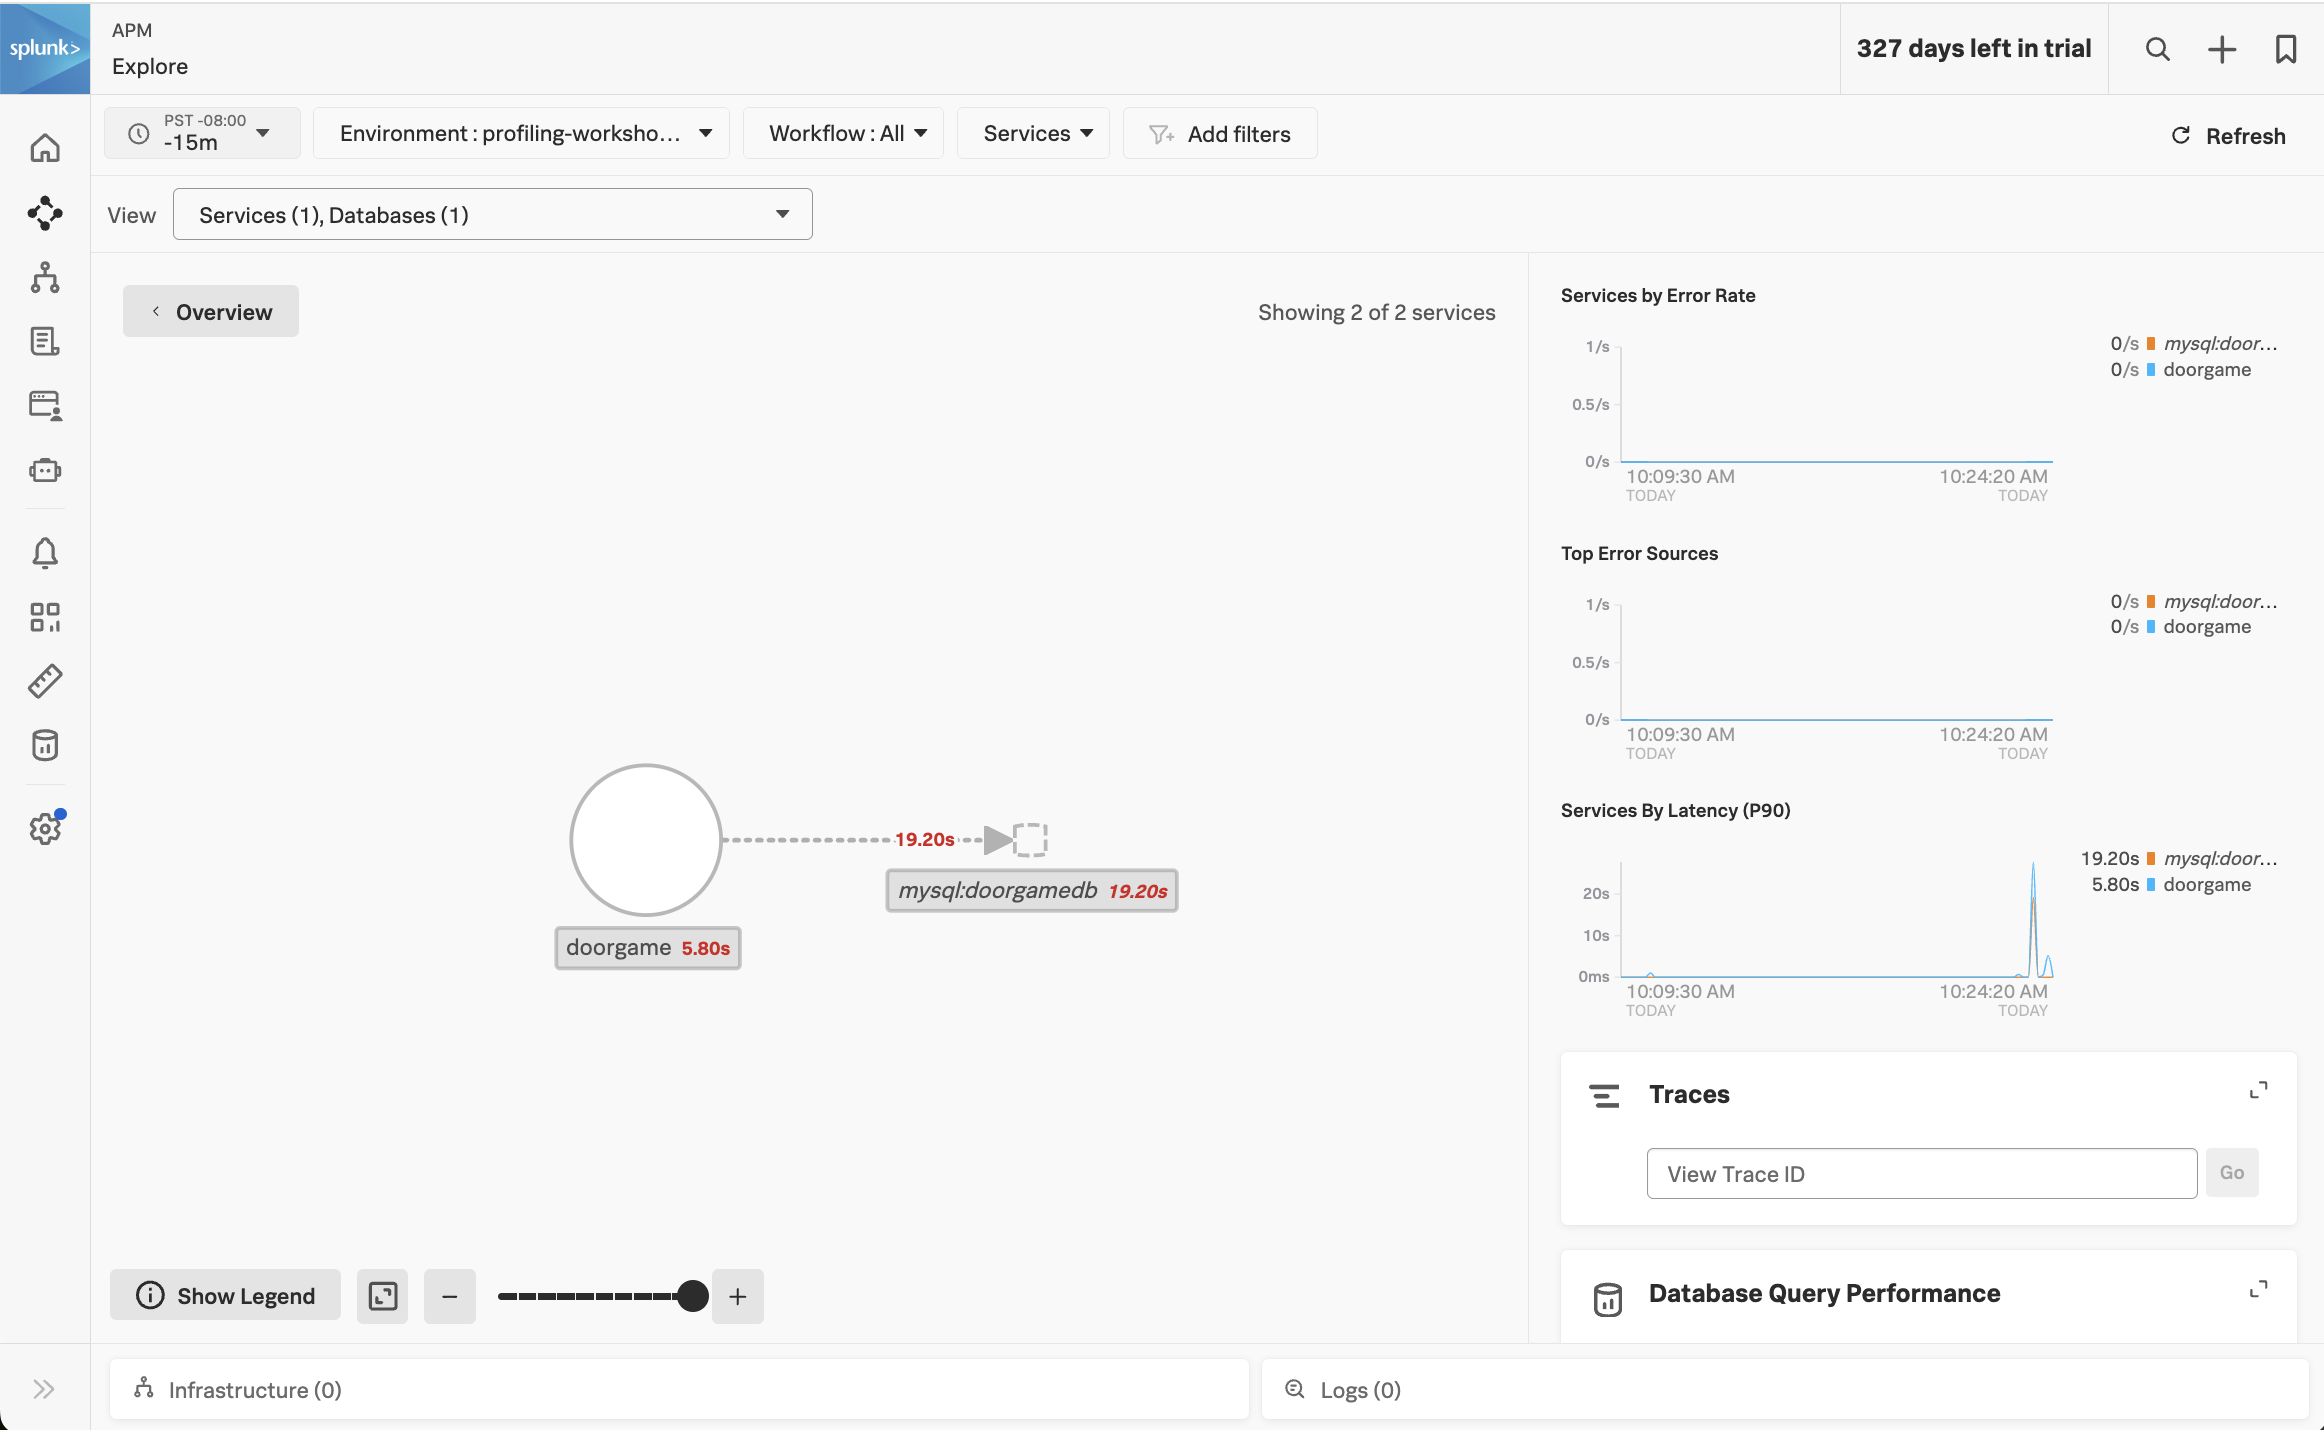
The APM Service Map displays the dependencies and connections among your instrumented and inferred services in APM. The map is dynamically generated based on your selections in the time range, environment, workflow, service, and tag filters.
When we clicked on the APM link in the RUM waterfall, filters were automatically added to the service map view to show the services that were involved in that WorkFlow Name (frontend:/cart/checkout).
You can see the services involved in the workflow in the Service Map. In the side pane, under Business Workflow, charts for the selected workflow are displayed. The Service Map and Business Workflow charts are synchronized. When you select a service in the Service Map, the charts in the Business Workflow pane are updated to show metrics for the selected service.
Exercise
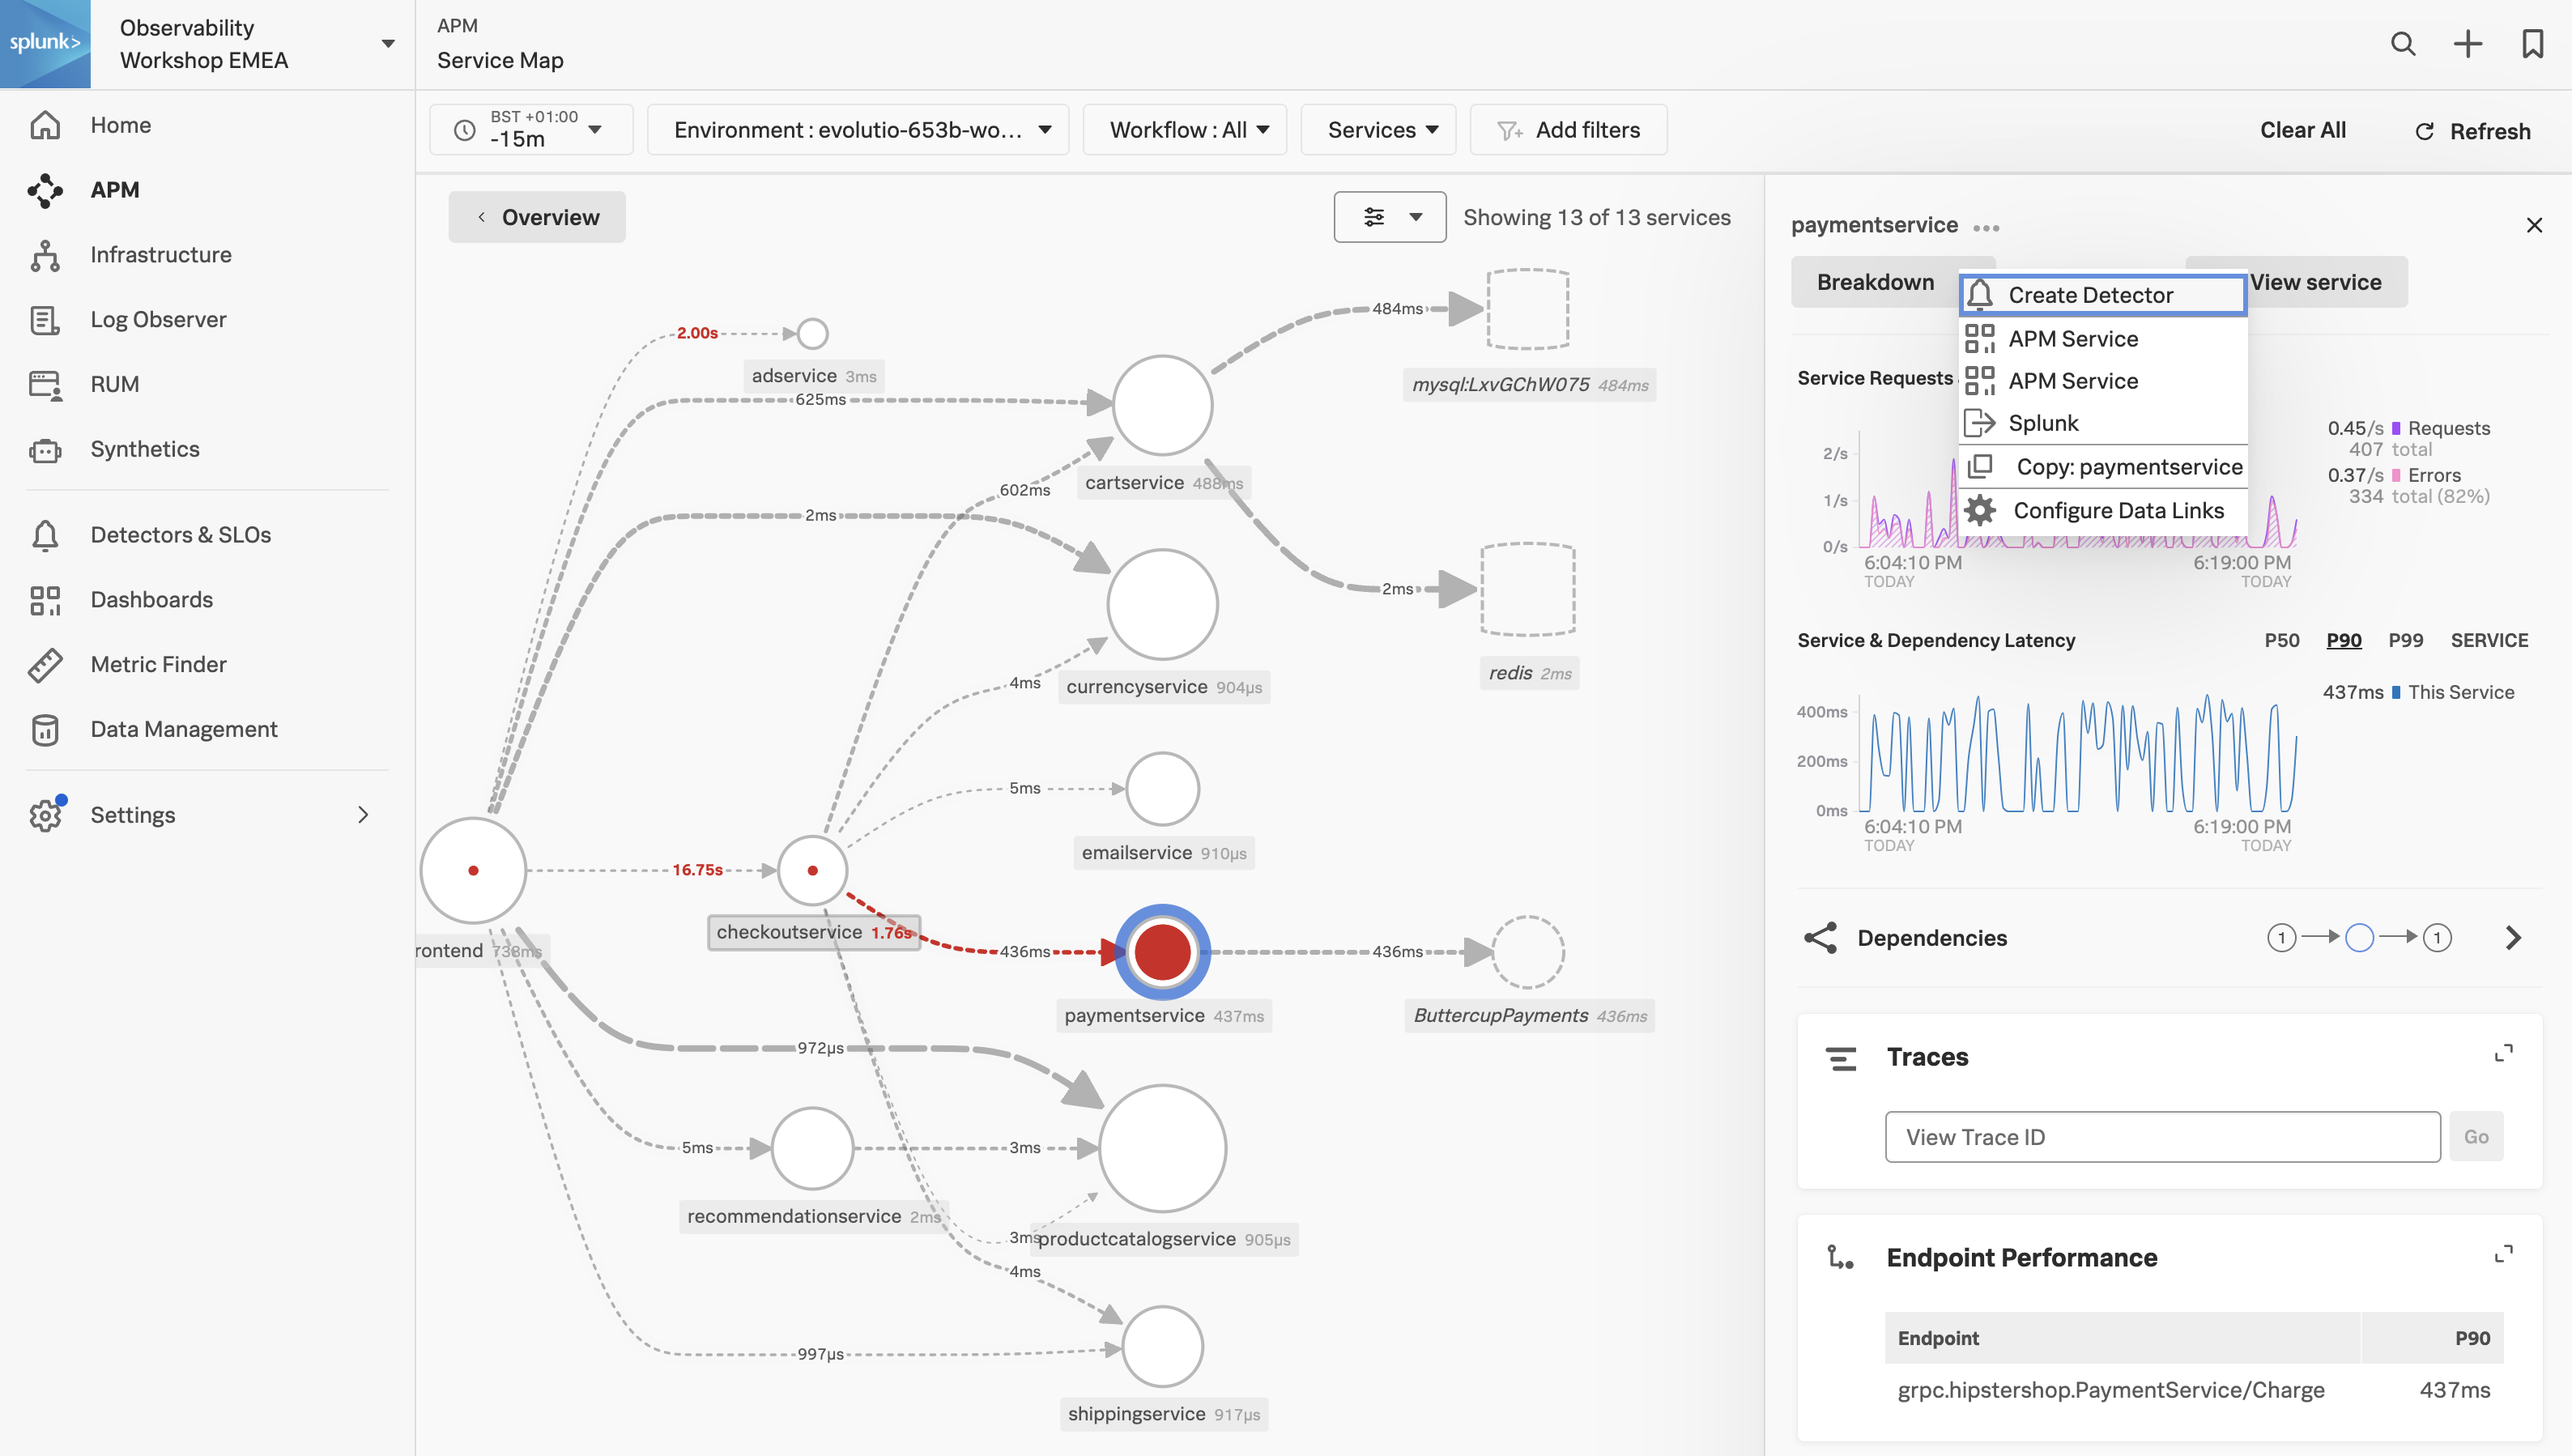
Click on the paymentservice in the Service Map.
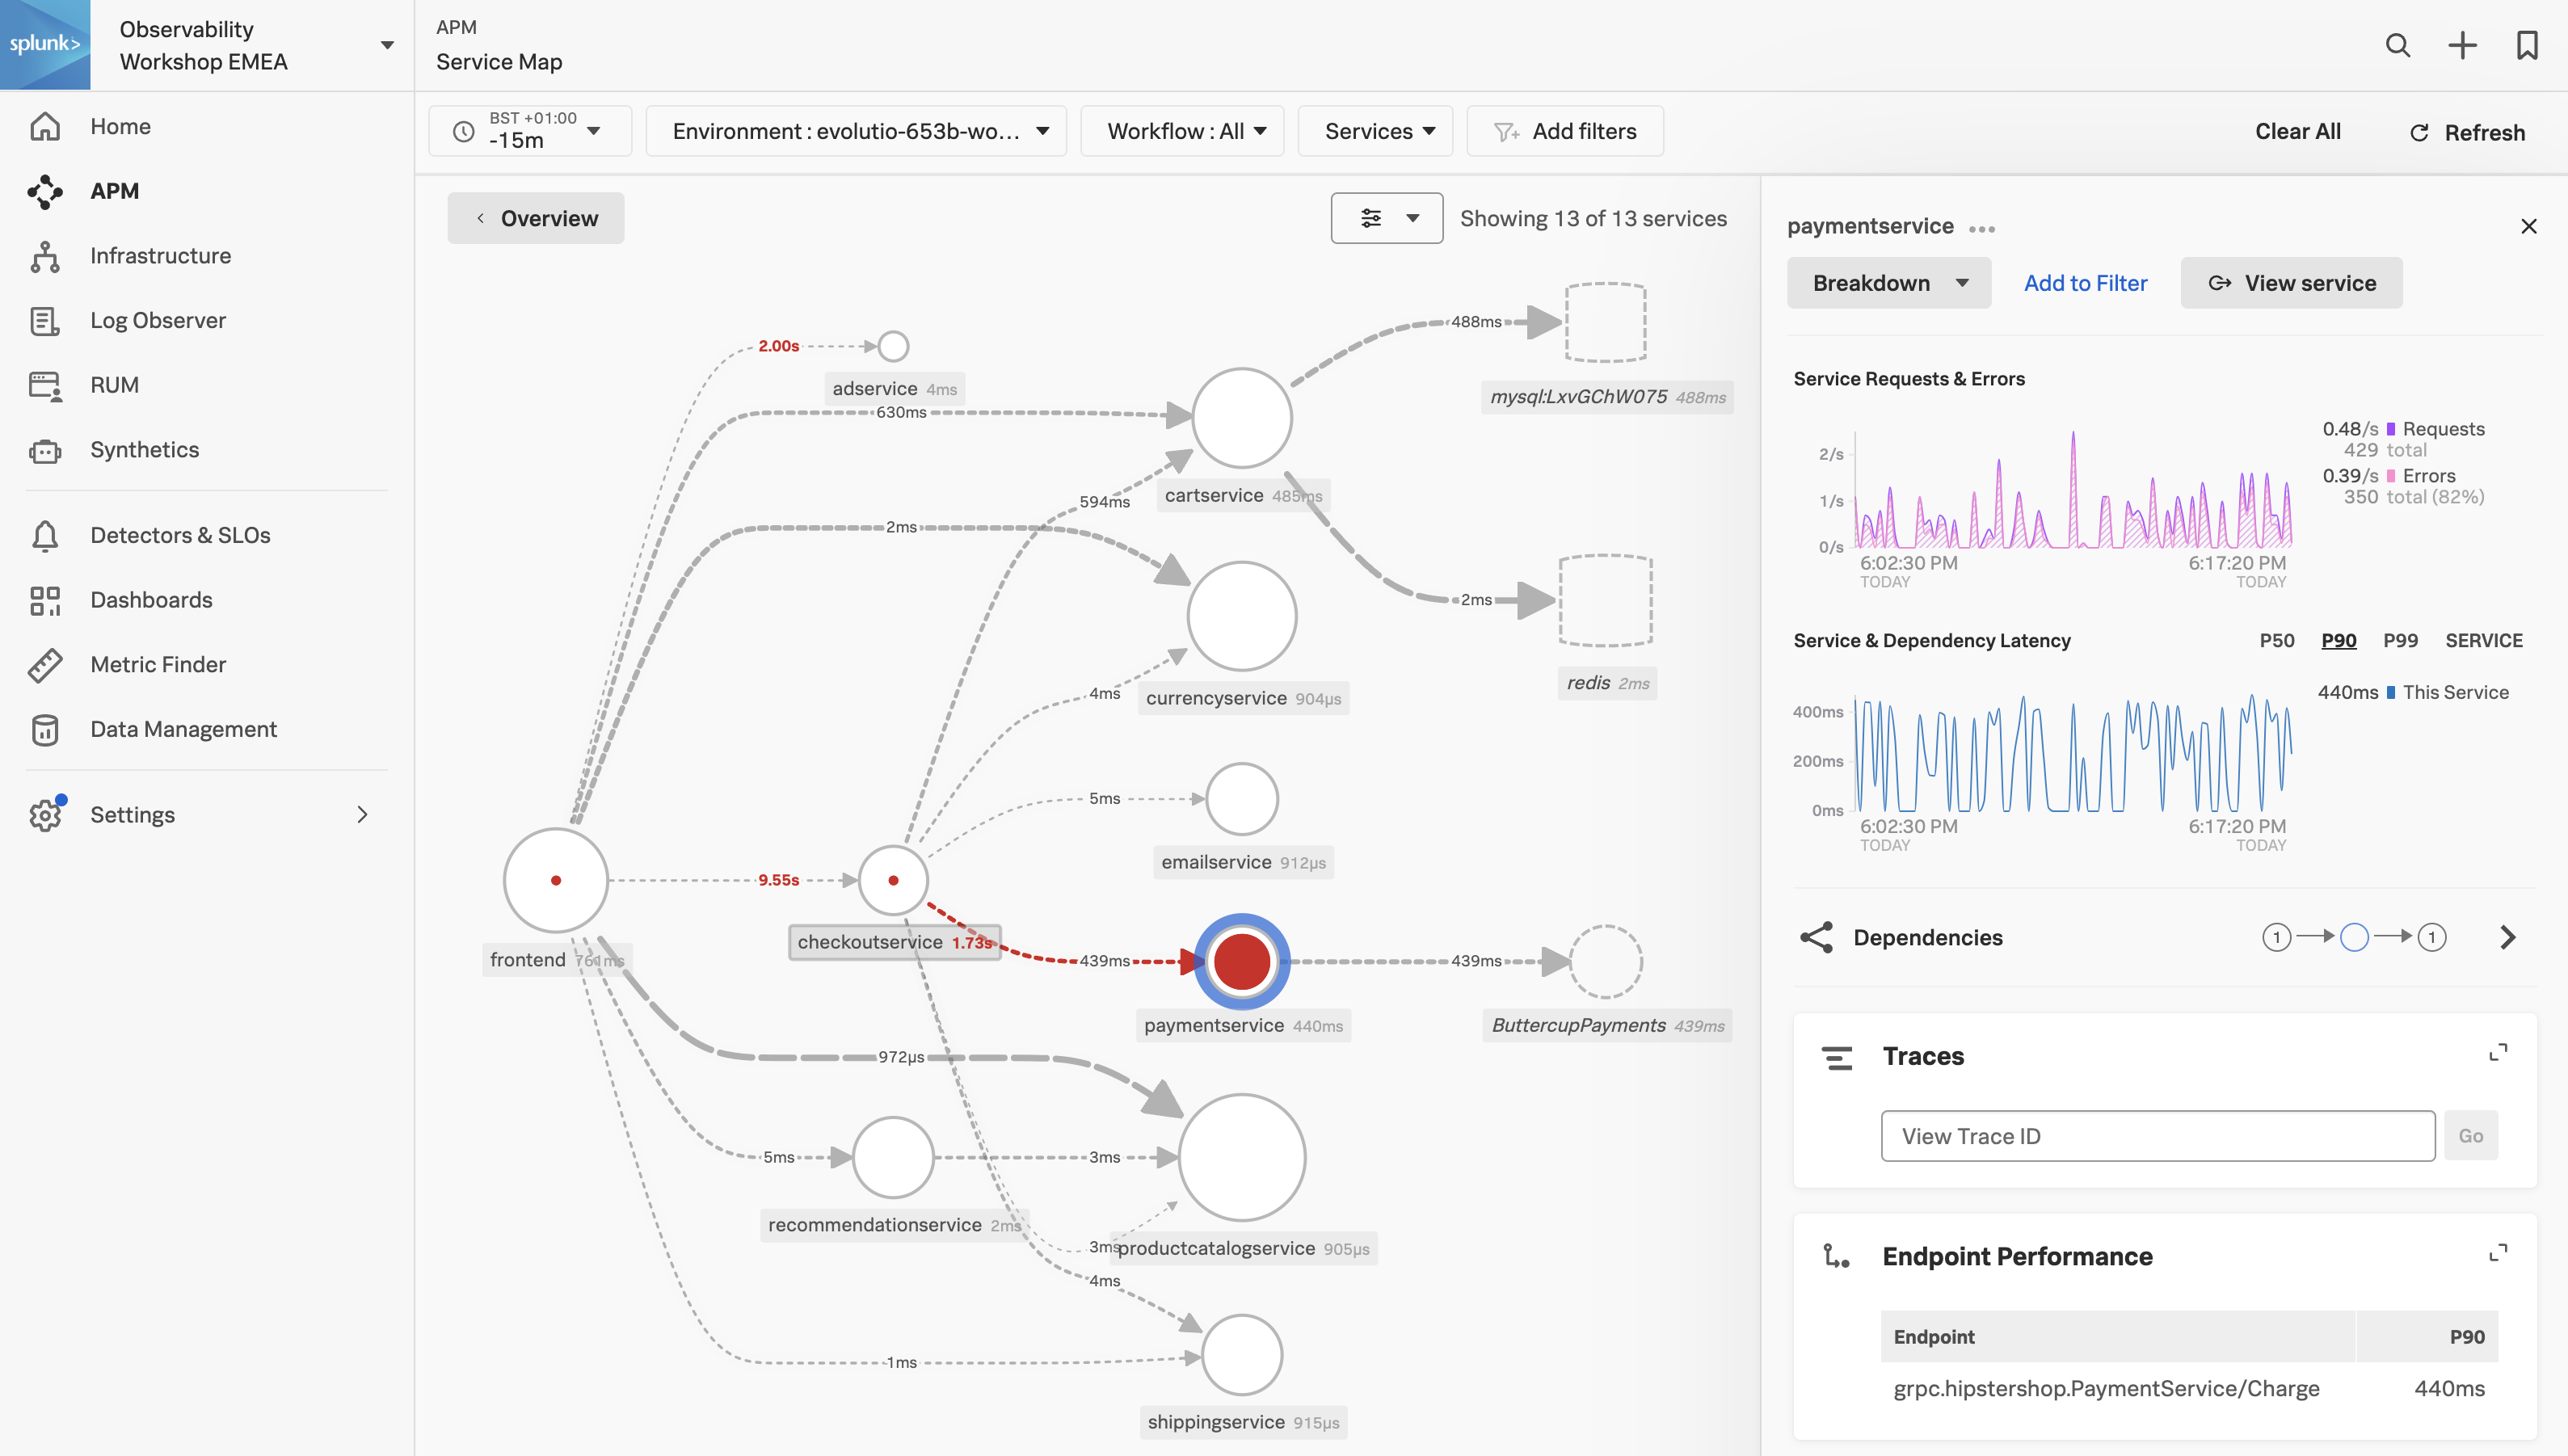
Splunk APM also provides a set of built-in dashboards that present charts and visualized metrics to help you see problems occurring in real time and quickly determine whether the problem is associated with a service, a specific endpoint, or the underlying infrastructure. Let’s have a closer look.
Exercise
Click on the three dots next to paymentservice and select APM Service
2. APM Service Dashboard
Service Dashboard
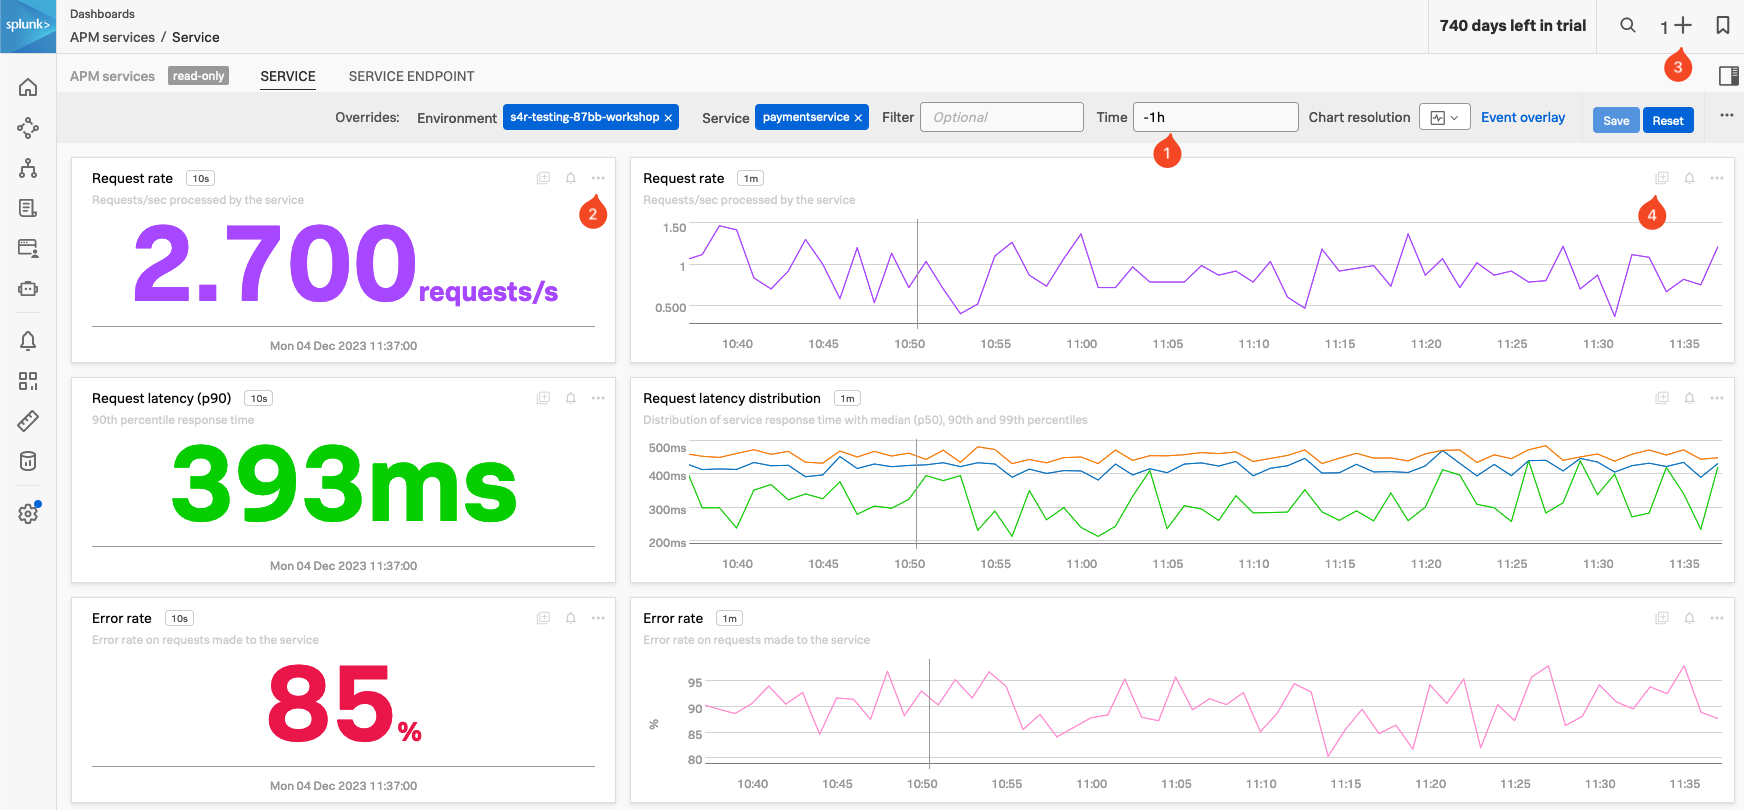
APM Service Dashboards provide request, error, and duration (RED) metrics based on Monitoring MetricSets created from endpoint spans for your services, endpoints, and Business Workflows. If you scroll down the dashboard you will also see the host and Kubernetes-related metrics which help you determine whether there are problems with the underlying infrastructure.
Exercise
Check the Time box (1), you can see that the dashboards only show data relevant to the time it took for the APM trace we selected to complete (note that the charts are static).
In the time box change enter -1h and hit enter.
The Single Value charts, Request rate, Request latency (p90) and Error rate will start updating every 10 seconds showing that we still have a large number of errors occurring.
These charts are very useful to quickly identify performance issues. You can use this dashboard to keep an eye on the health of your service or use it as a base for a custom one.
We want to use some of these charts in a later exercise:
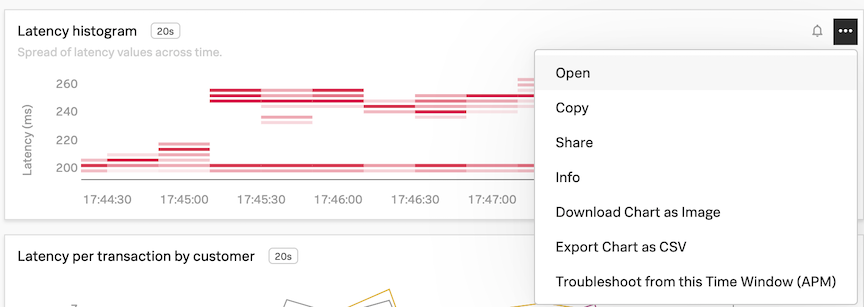
In the Request rate Single Value chart (2), click the … and select Copy. Note that you now have a 1 before the + at the top right of the page (3), indicating you have a copied chart to the clipboard.
In the Request rate line chart (4), either click on the Add to clipboard indicator that appeared (just at the (4) in the screenshot) to add it to the clipboard or use the … and select Add to clipboard.
Note that you now have 2 before the + on the top right of the page. (3)
Now let’s go back to the explore view, you can hit the back button in your Browser
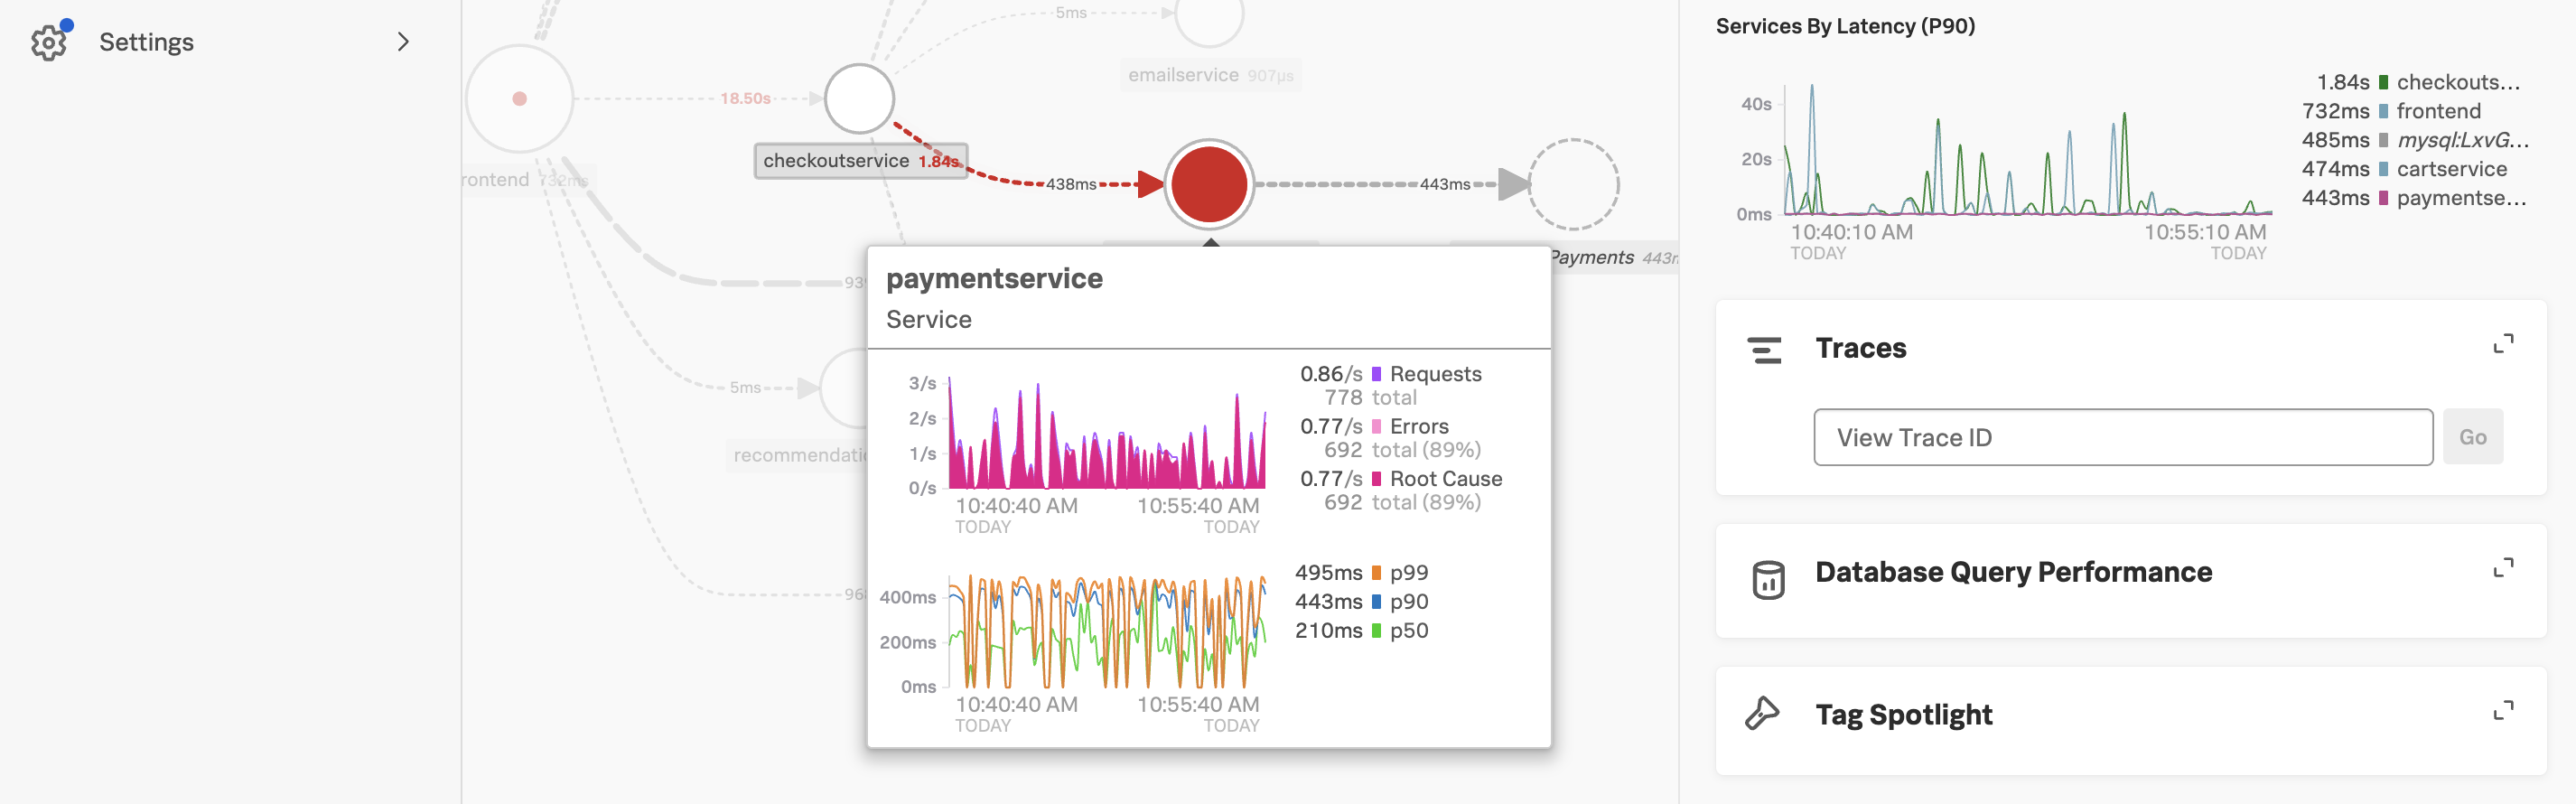
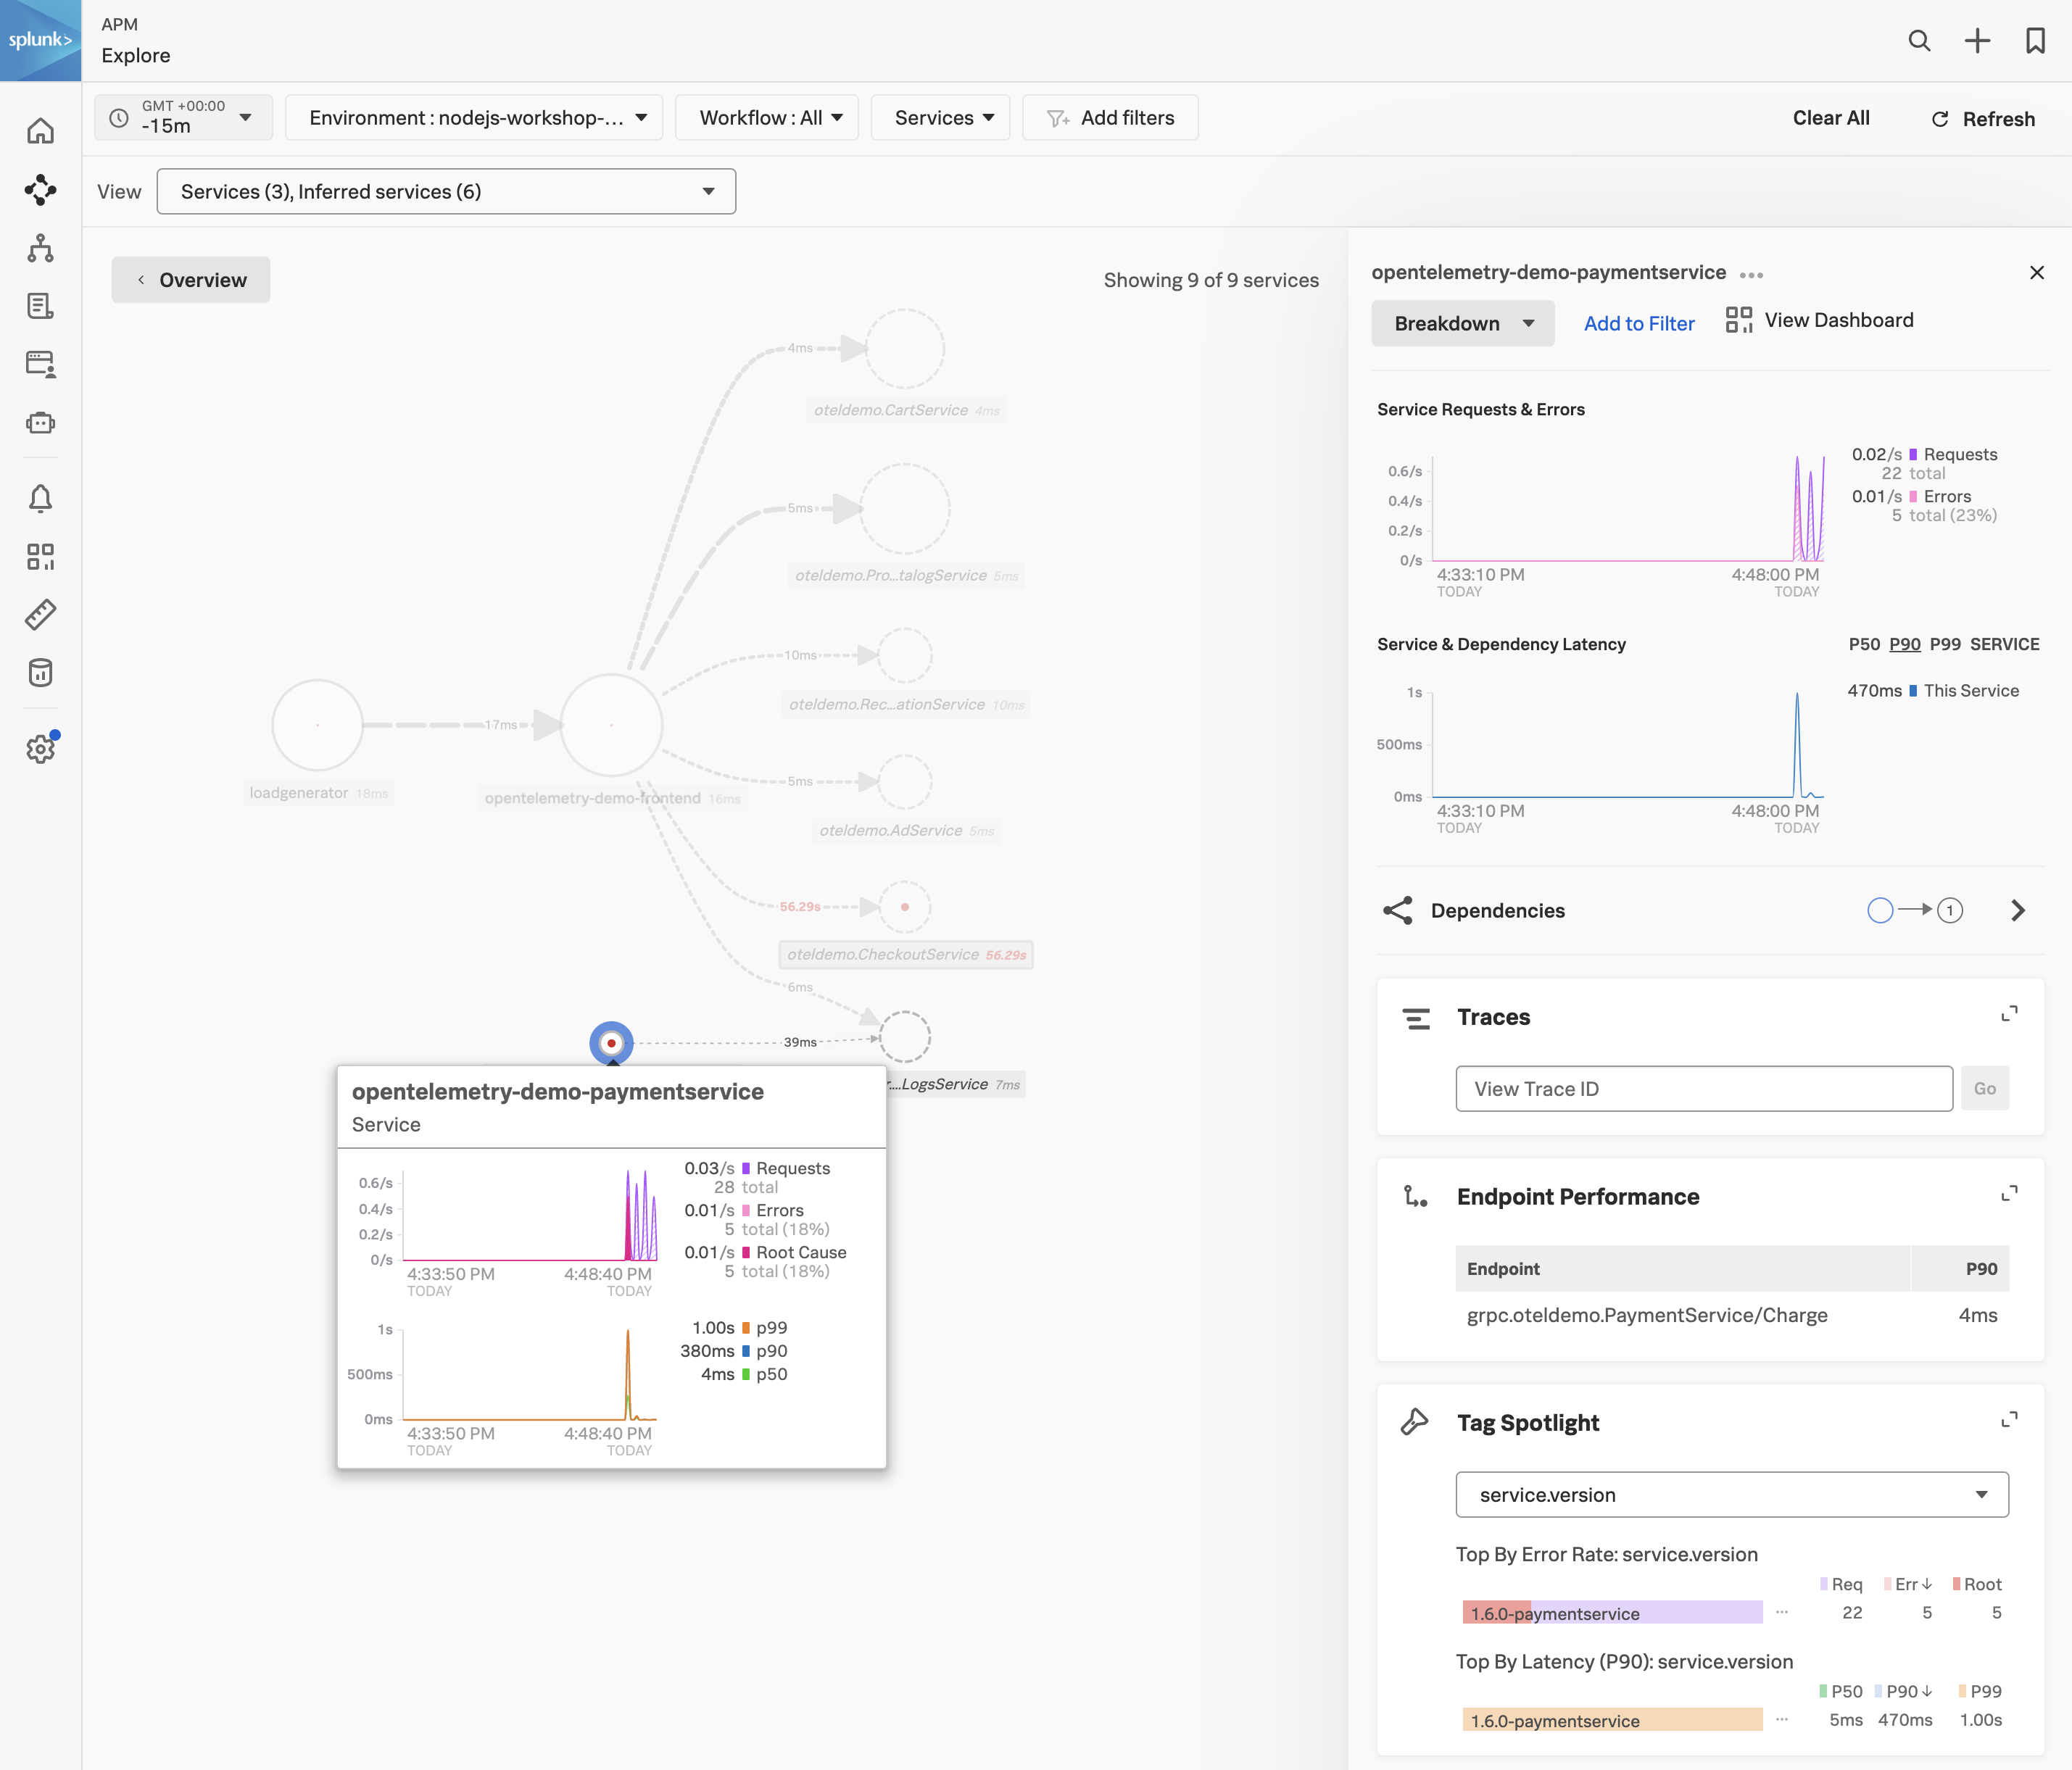
Exercise
In the Service Map hover over the paymentservice. What can you conclude from the popup service chart?
The error percentage is very high.
We need to understand if there is a pattern to this error rate. We have a handy tool for that, Tag Spotlight.
3. APM Tag Spotlight
Exercise
To view the tags for the paymentservice click on the paymentservice and then click on Tag Spotlight in the right-hand side functions pane (you may need to scroll down depending upon your screen resolution).
Once in Tag Spotlight ensure the toggle Show tags with no values is off.
There are two views available in Tag Spotlight. The default is Request/Errors and the other is Latency.
Request/Error charts display the total number of requests, errors, and root cause errors. The Latency charts display p50, p90, and p99 latency. These values are based on Troubleshooting MetricSets (TMS), which Splunk APM generates for every indexed span tag. These are known as RED metrics (request, error, and duration).
Exercise
Which chart exposes the tag that identifies what the problem is?
The version chart. The number of requests against v350.10 matches the number of errors.
Now that we have identified the version of the paymentservice that is causing the issue, let’s see if we can find out more information about the error. Click on ← Tag Spotlight at the top of the page to get back to the Service Map.
4. APM Service Breakdown
Exercise
In the right-hand pane click on the Breakdown.
Select tenant.level in the list. This is a tag that exposes the customers’ status and can be useful to see trends related to customer status.
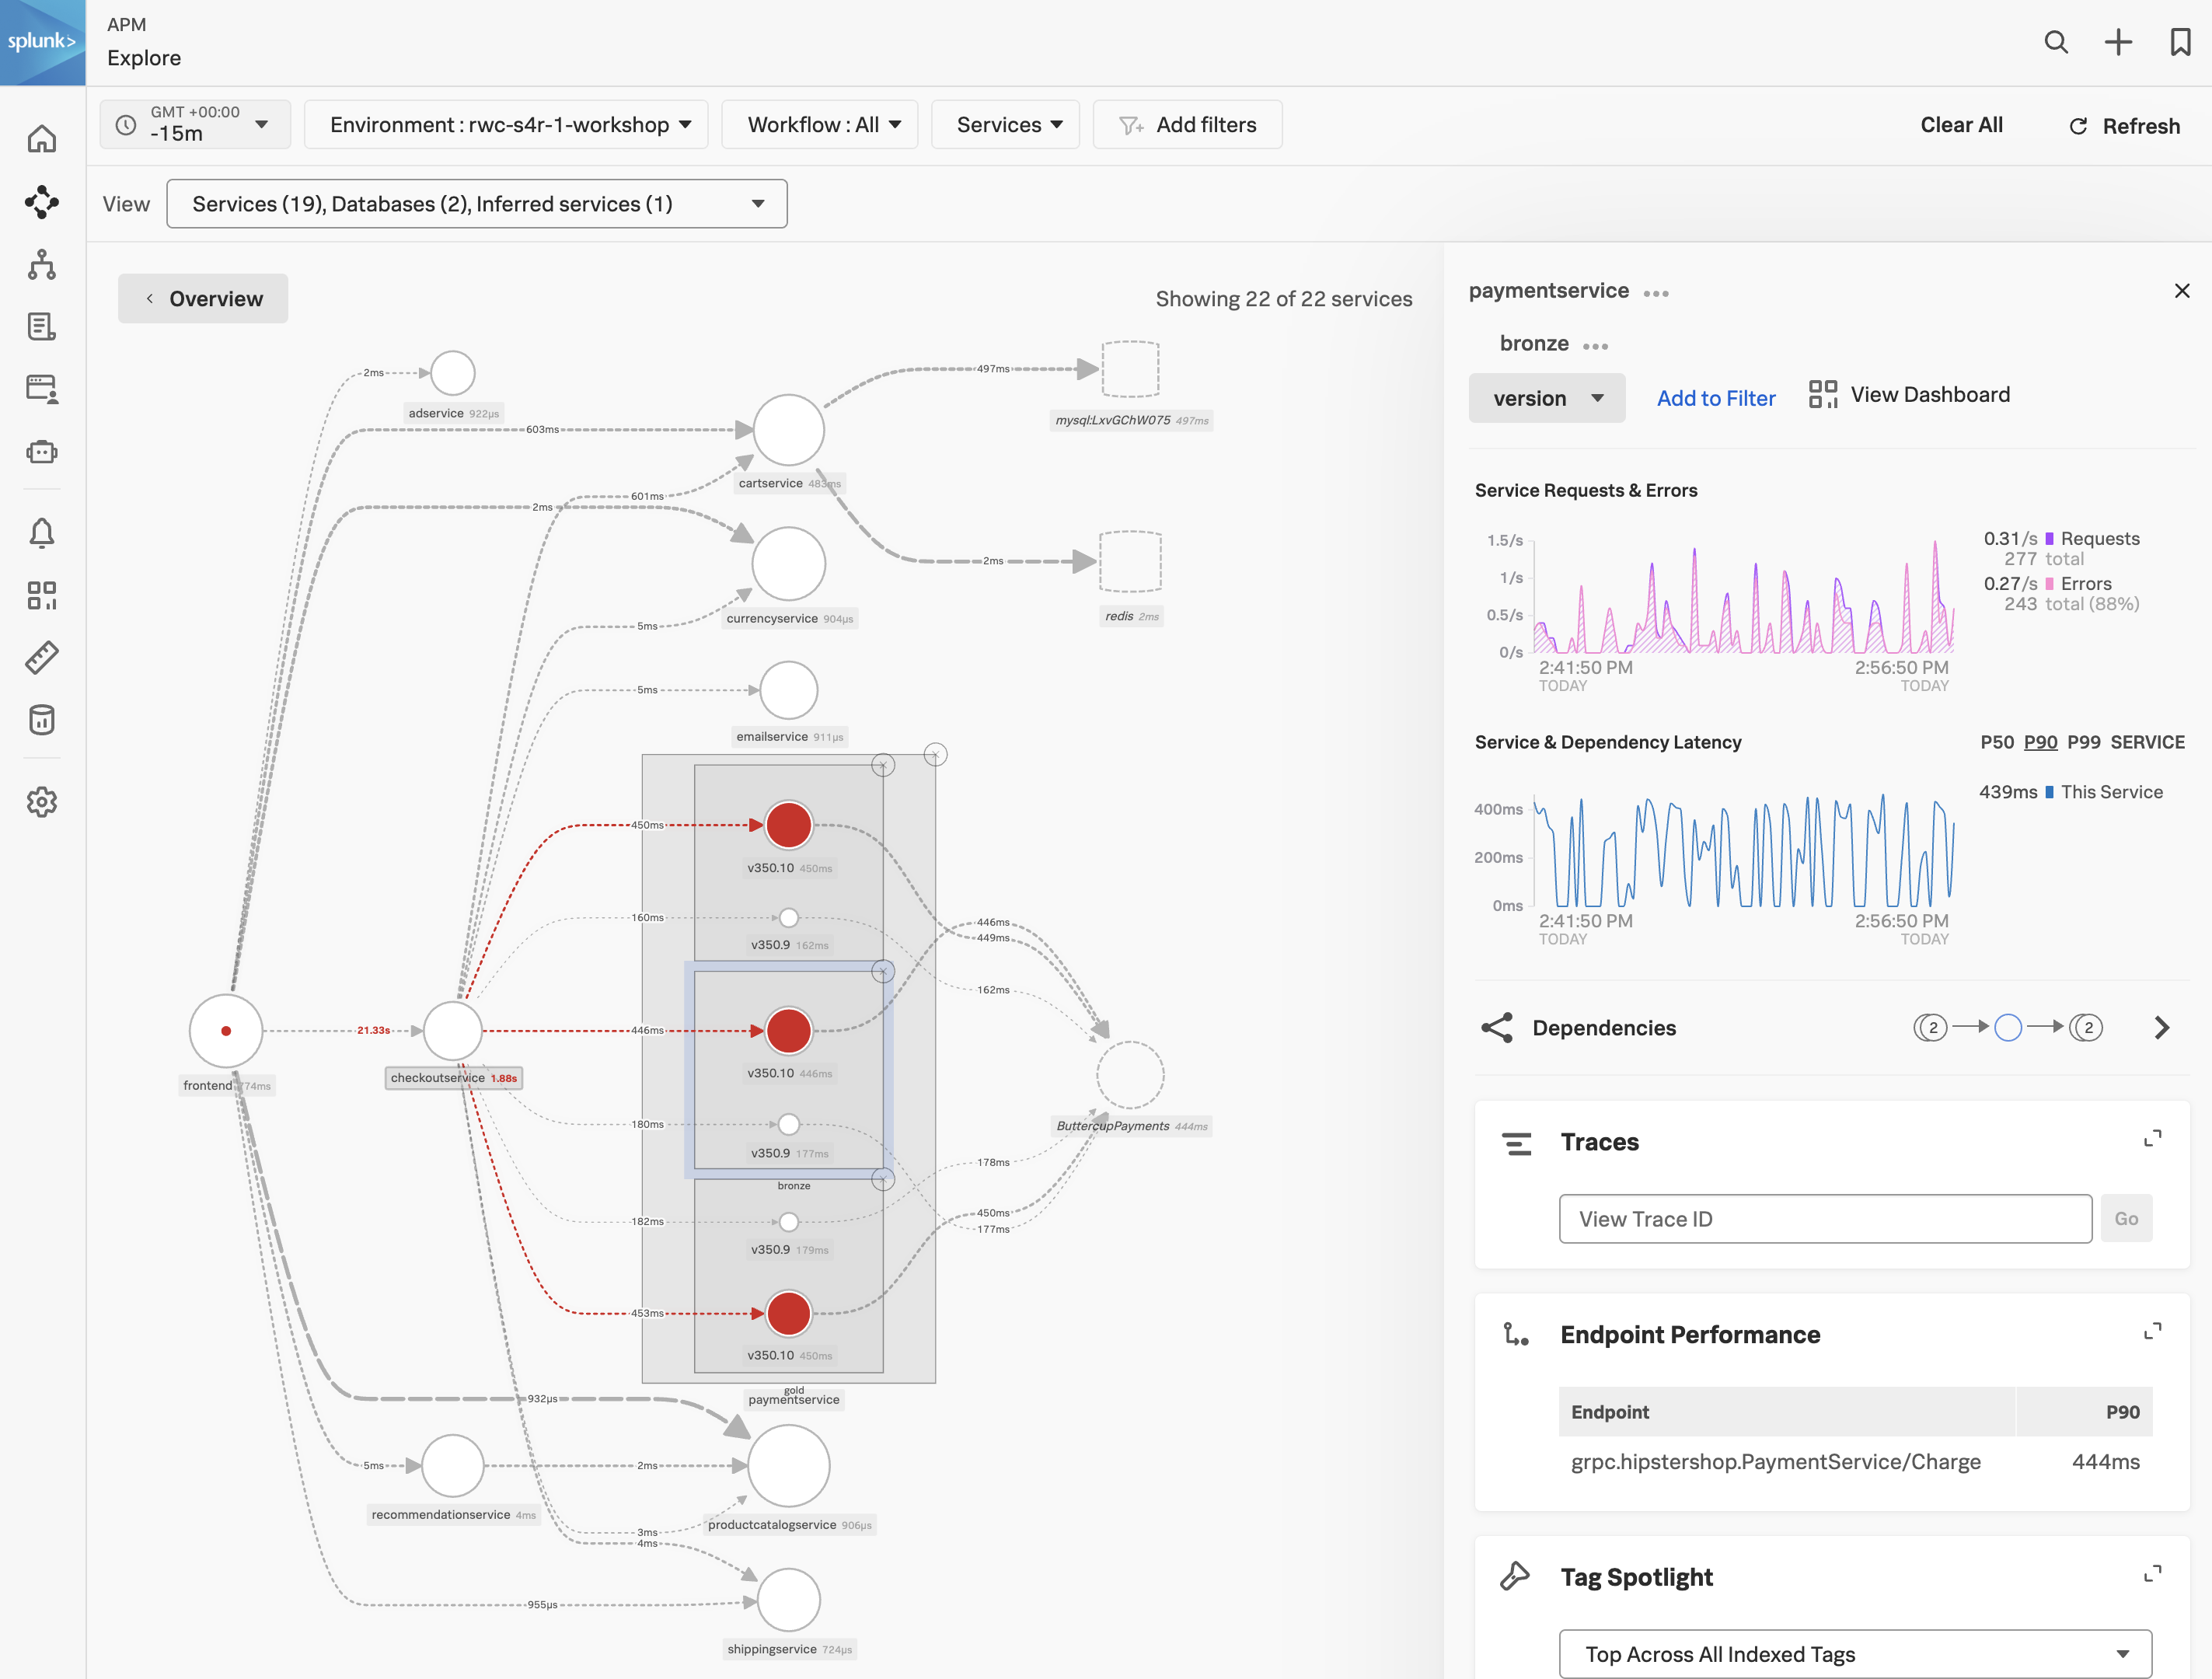
Back in the Service Map Click on gold to select it.
Click on Breakdown and select version, this is the tag that exposes the service version.
Repeat this for silver and bronze.
What can you conclude from what you are seeing?
Every tenant is being impacted by v350.10
You will now see the paymentservice broken down into three services, gold, silver and bronze. Each tenant is broken down into two services, one for each version (v350.10 and v350.9).
Exercise
Click on the outer main box that surrounds the 3 red circles, the box will become highlighted.
Span Tags
Using span tags to break down services is a very powerful feature. It allows you to see how your services are performing for different customers, different versions, different regions, etc. In this exercise, we have determined that v350.10 of the paymentservice is causing problems for all our customers.
Next, we need to drill down into a trace to see what is going on.
5. APM Trace Analyzer
As Splunk APM provides a NoSample™ end-to-end visibility of every service Splunk APM captures every trace. For this workshop, the Order Confirmation ID is available as a tag. This means that we can use this to search for the exact trace of the poor user experience you encountered earlier in the workshop.
Trace Analyzer
Splunk Observability Cloud provides several tools for exploring application monitoring data. Trace Analyzer is suited to scenarios where you have high-cardinality, high-granularity searches and explorations to research unknown or new issues.
Exercise
With the outer box of the paymentservice selected, in the right-hand pane, click on Traces.
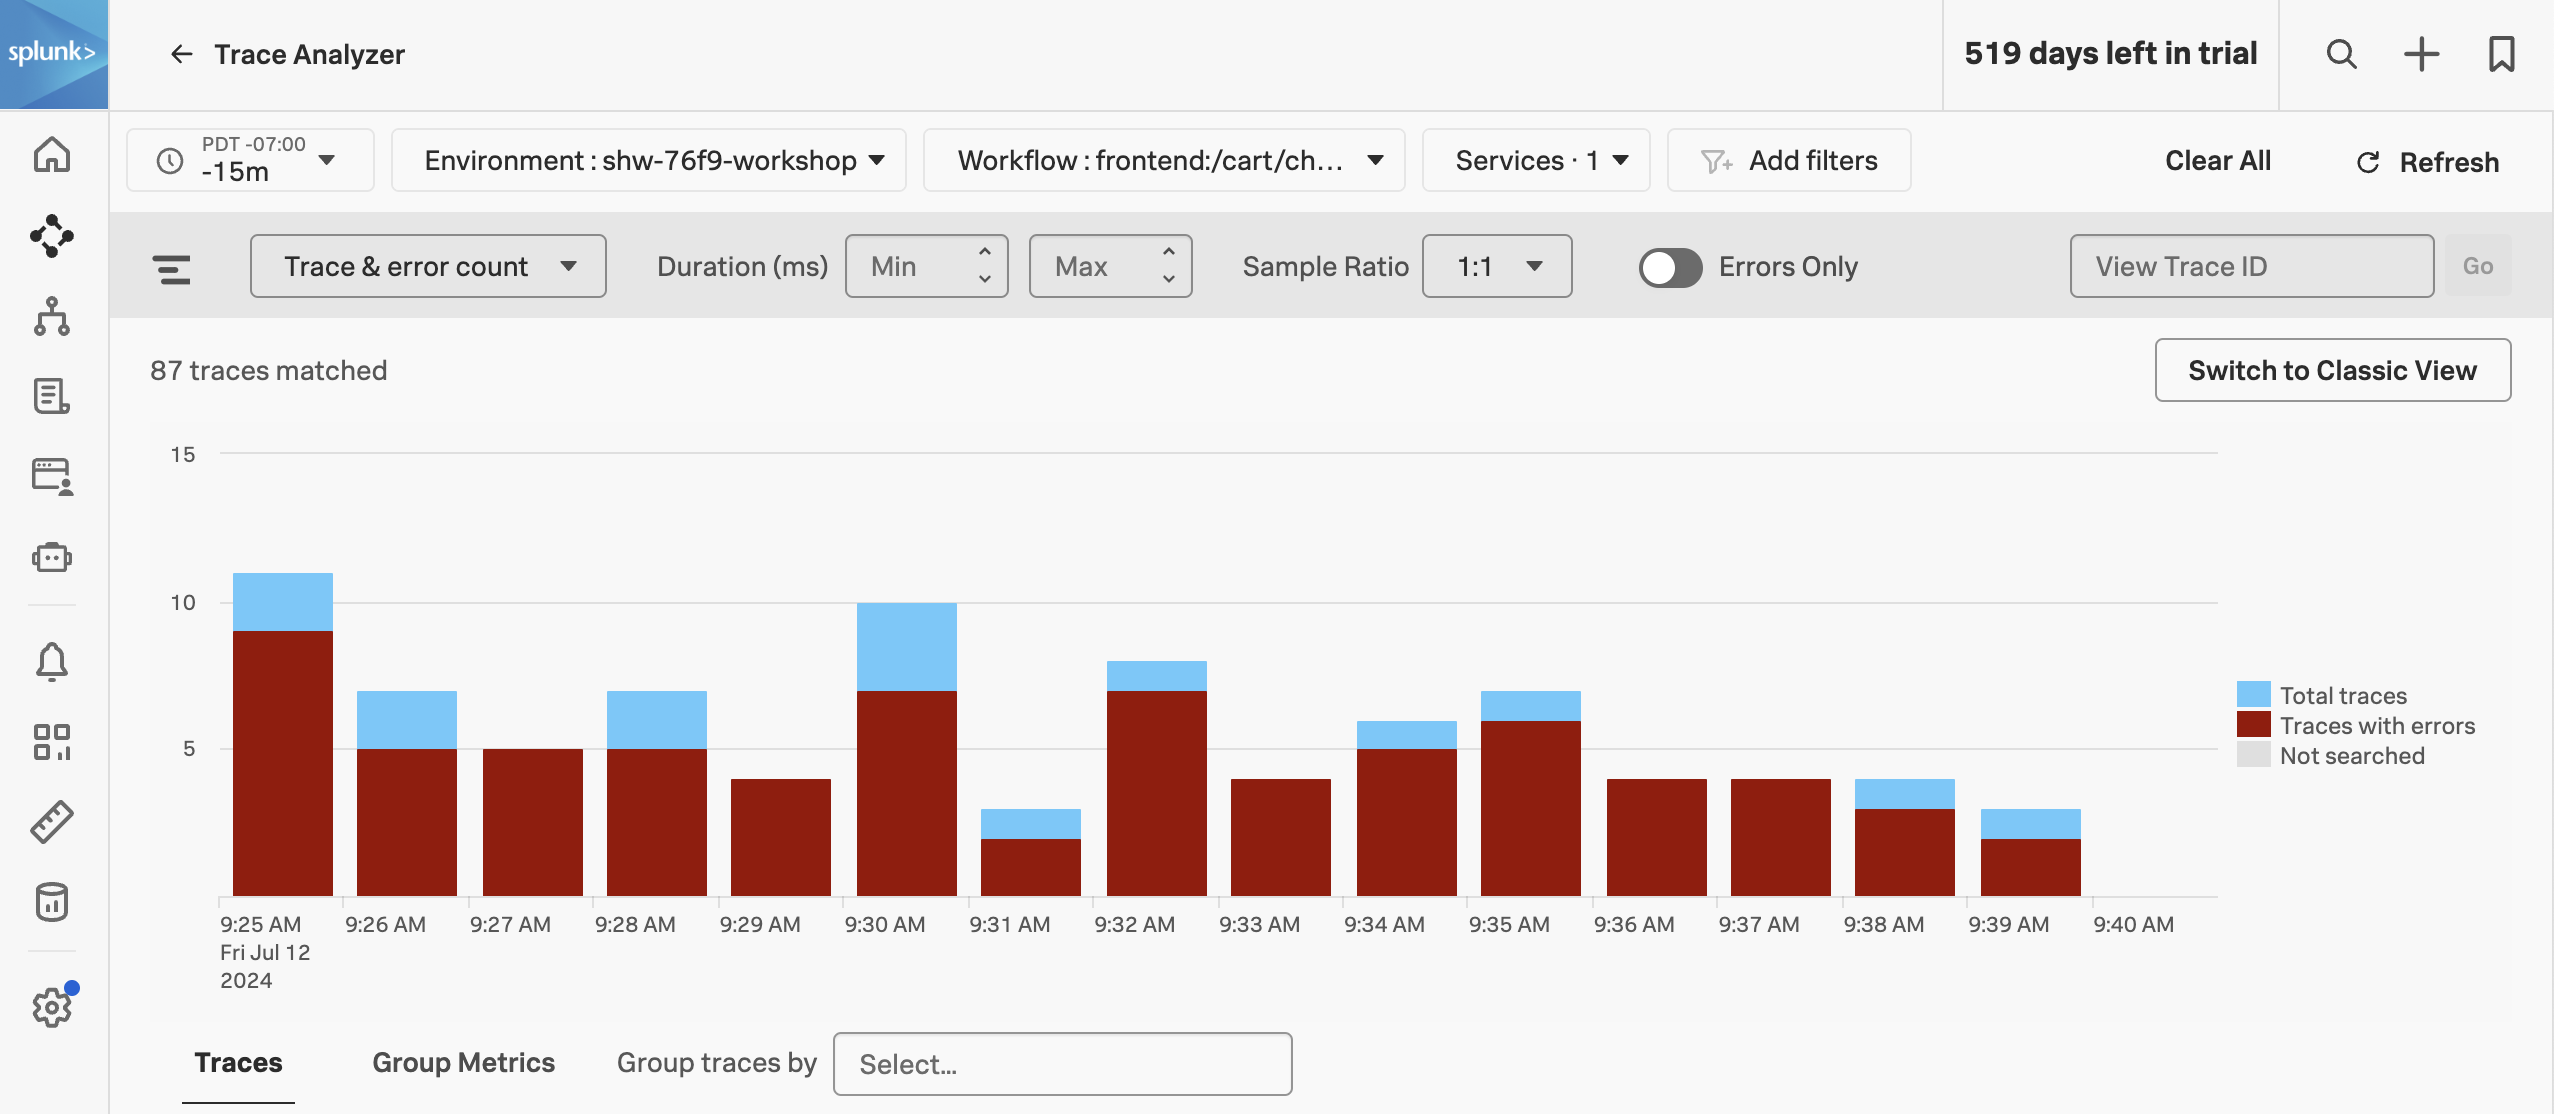
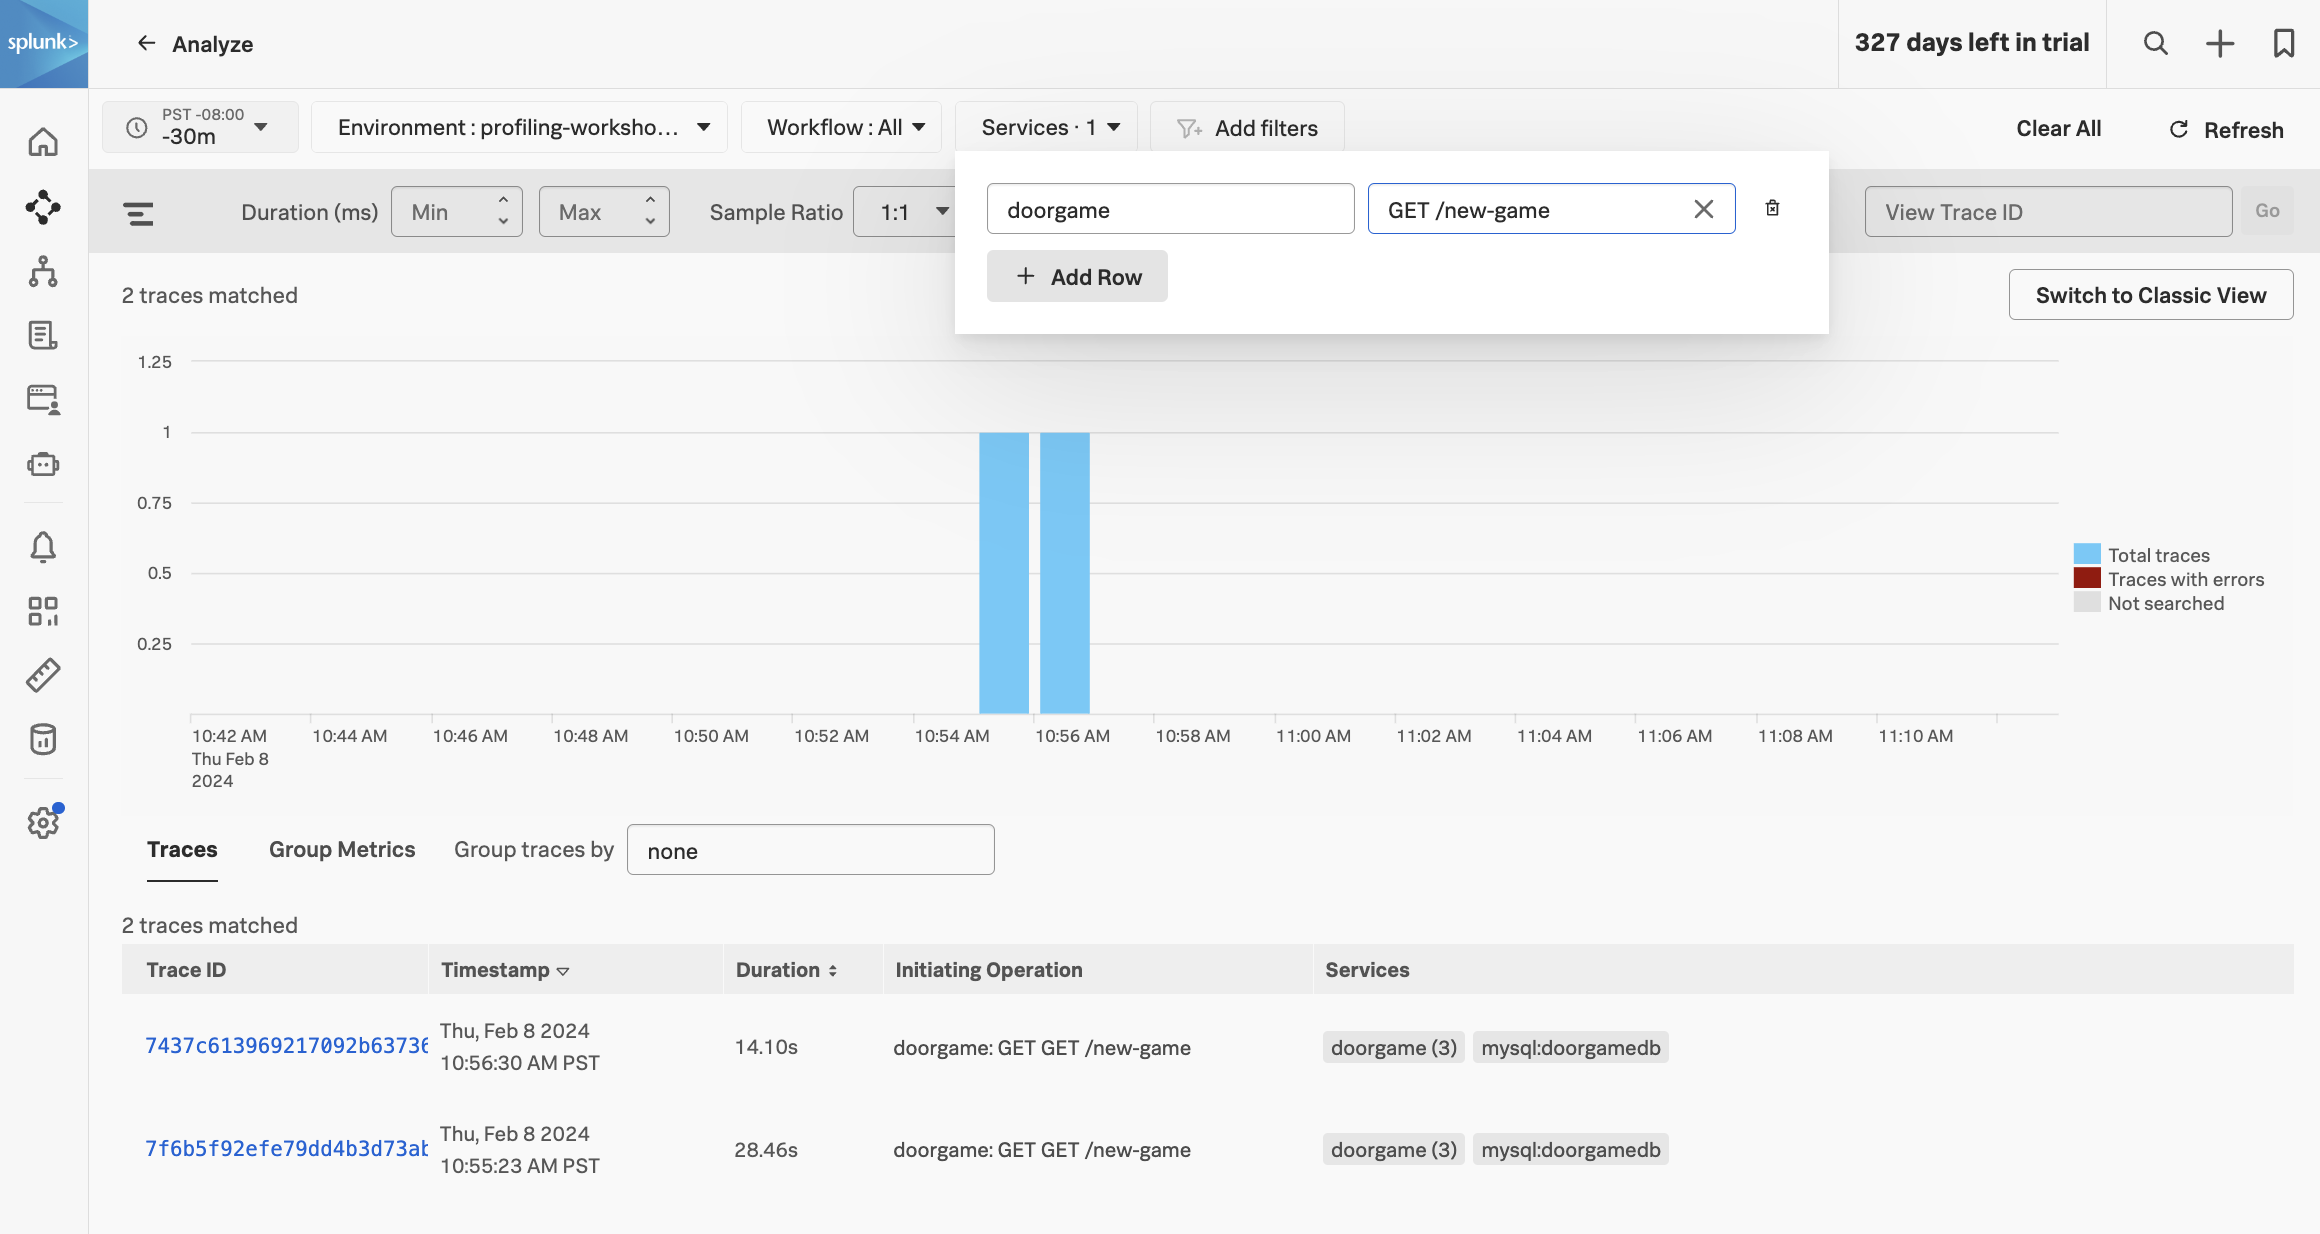
To ensure we are using Trace Analyzer make sure the button Switch to Classic View is showing. If it is not, click on Switch to Trace Analyzer.
The Trace & error count view shows the total traces and traces with errors in a stacked bar chart. You can use your mouse to select a specific period within the available time frame.
Exercise
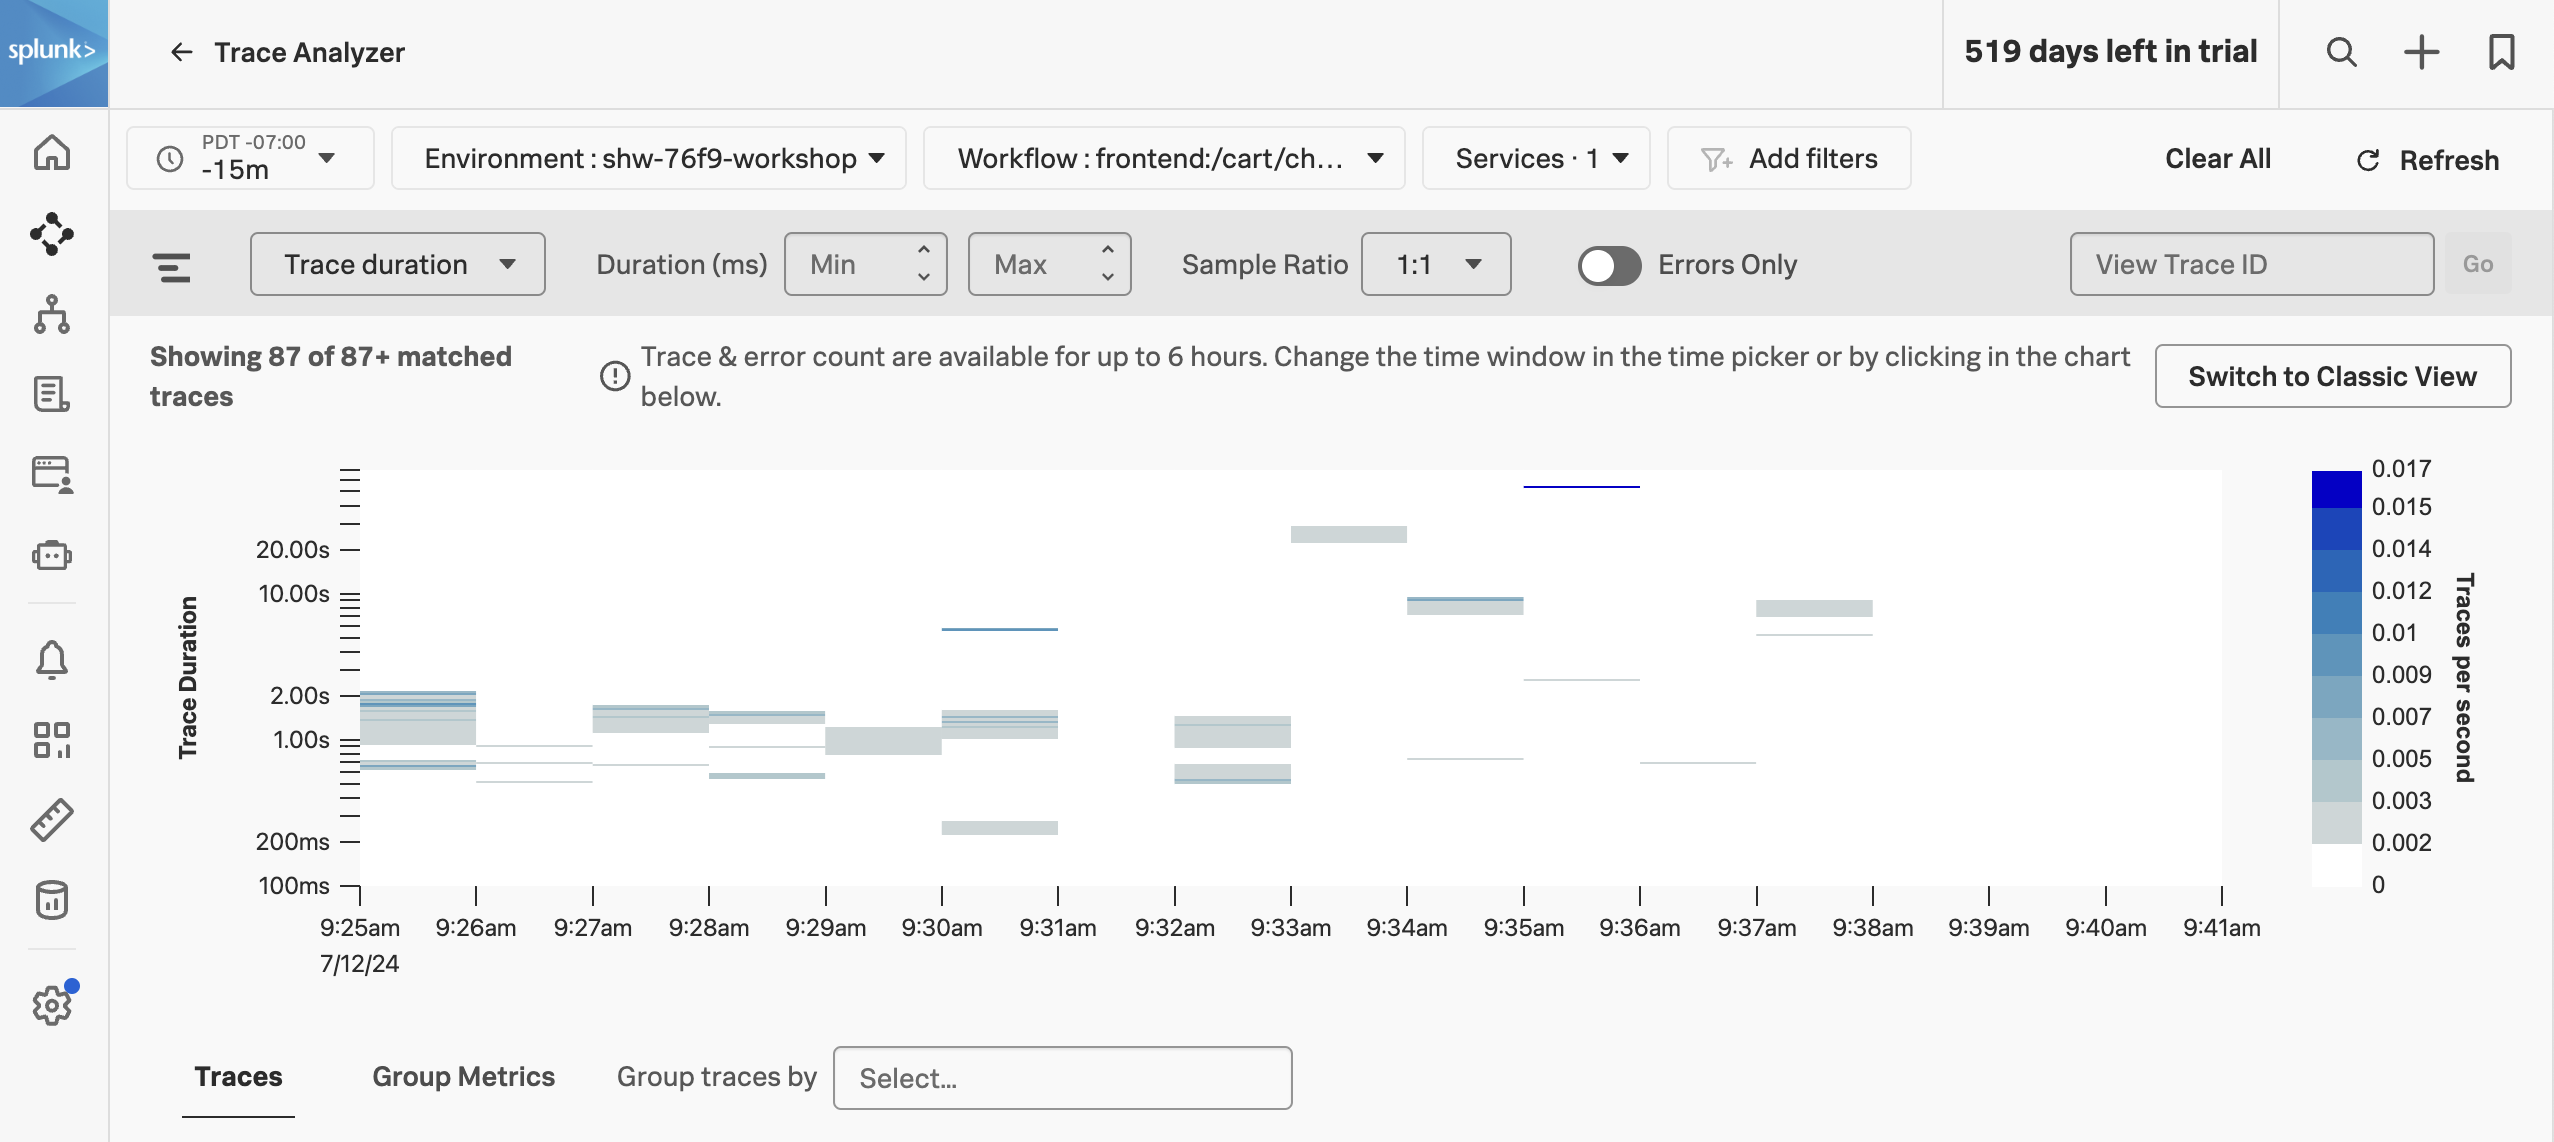
Click on the dropdown menu that says Trace & error count, and change it to Trace duration
The Trace Duration view shows a heatmap of traces by duration. The heatmap represents 3 dimensions of data:
Time on the x-axis
Trace duration on the y-axis
The traces (or requests) per second are represented by the heatmap shades
You can use your mouse to select an area on the heatmap, to focus on a specific time period and trace duration range.
Exercise
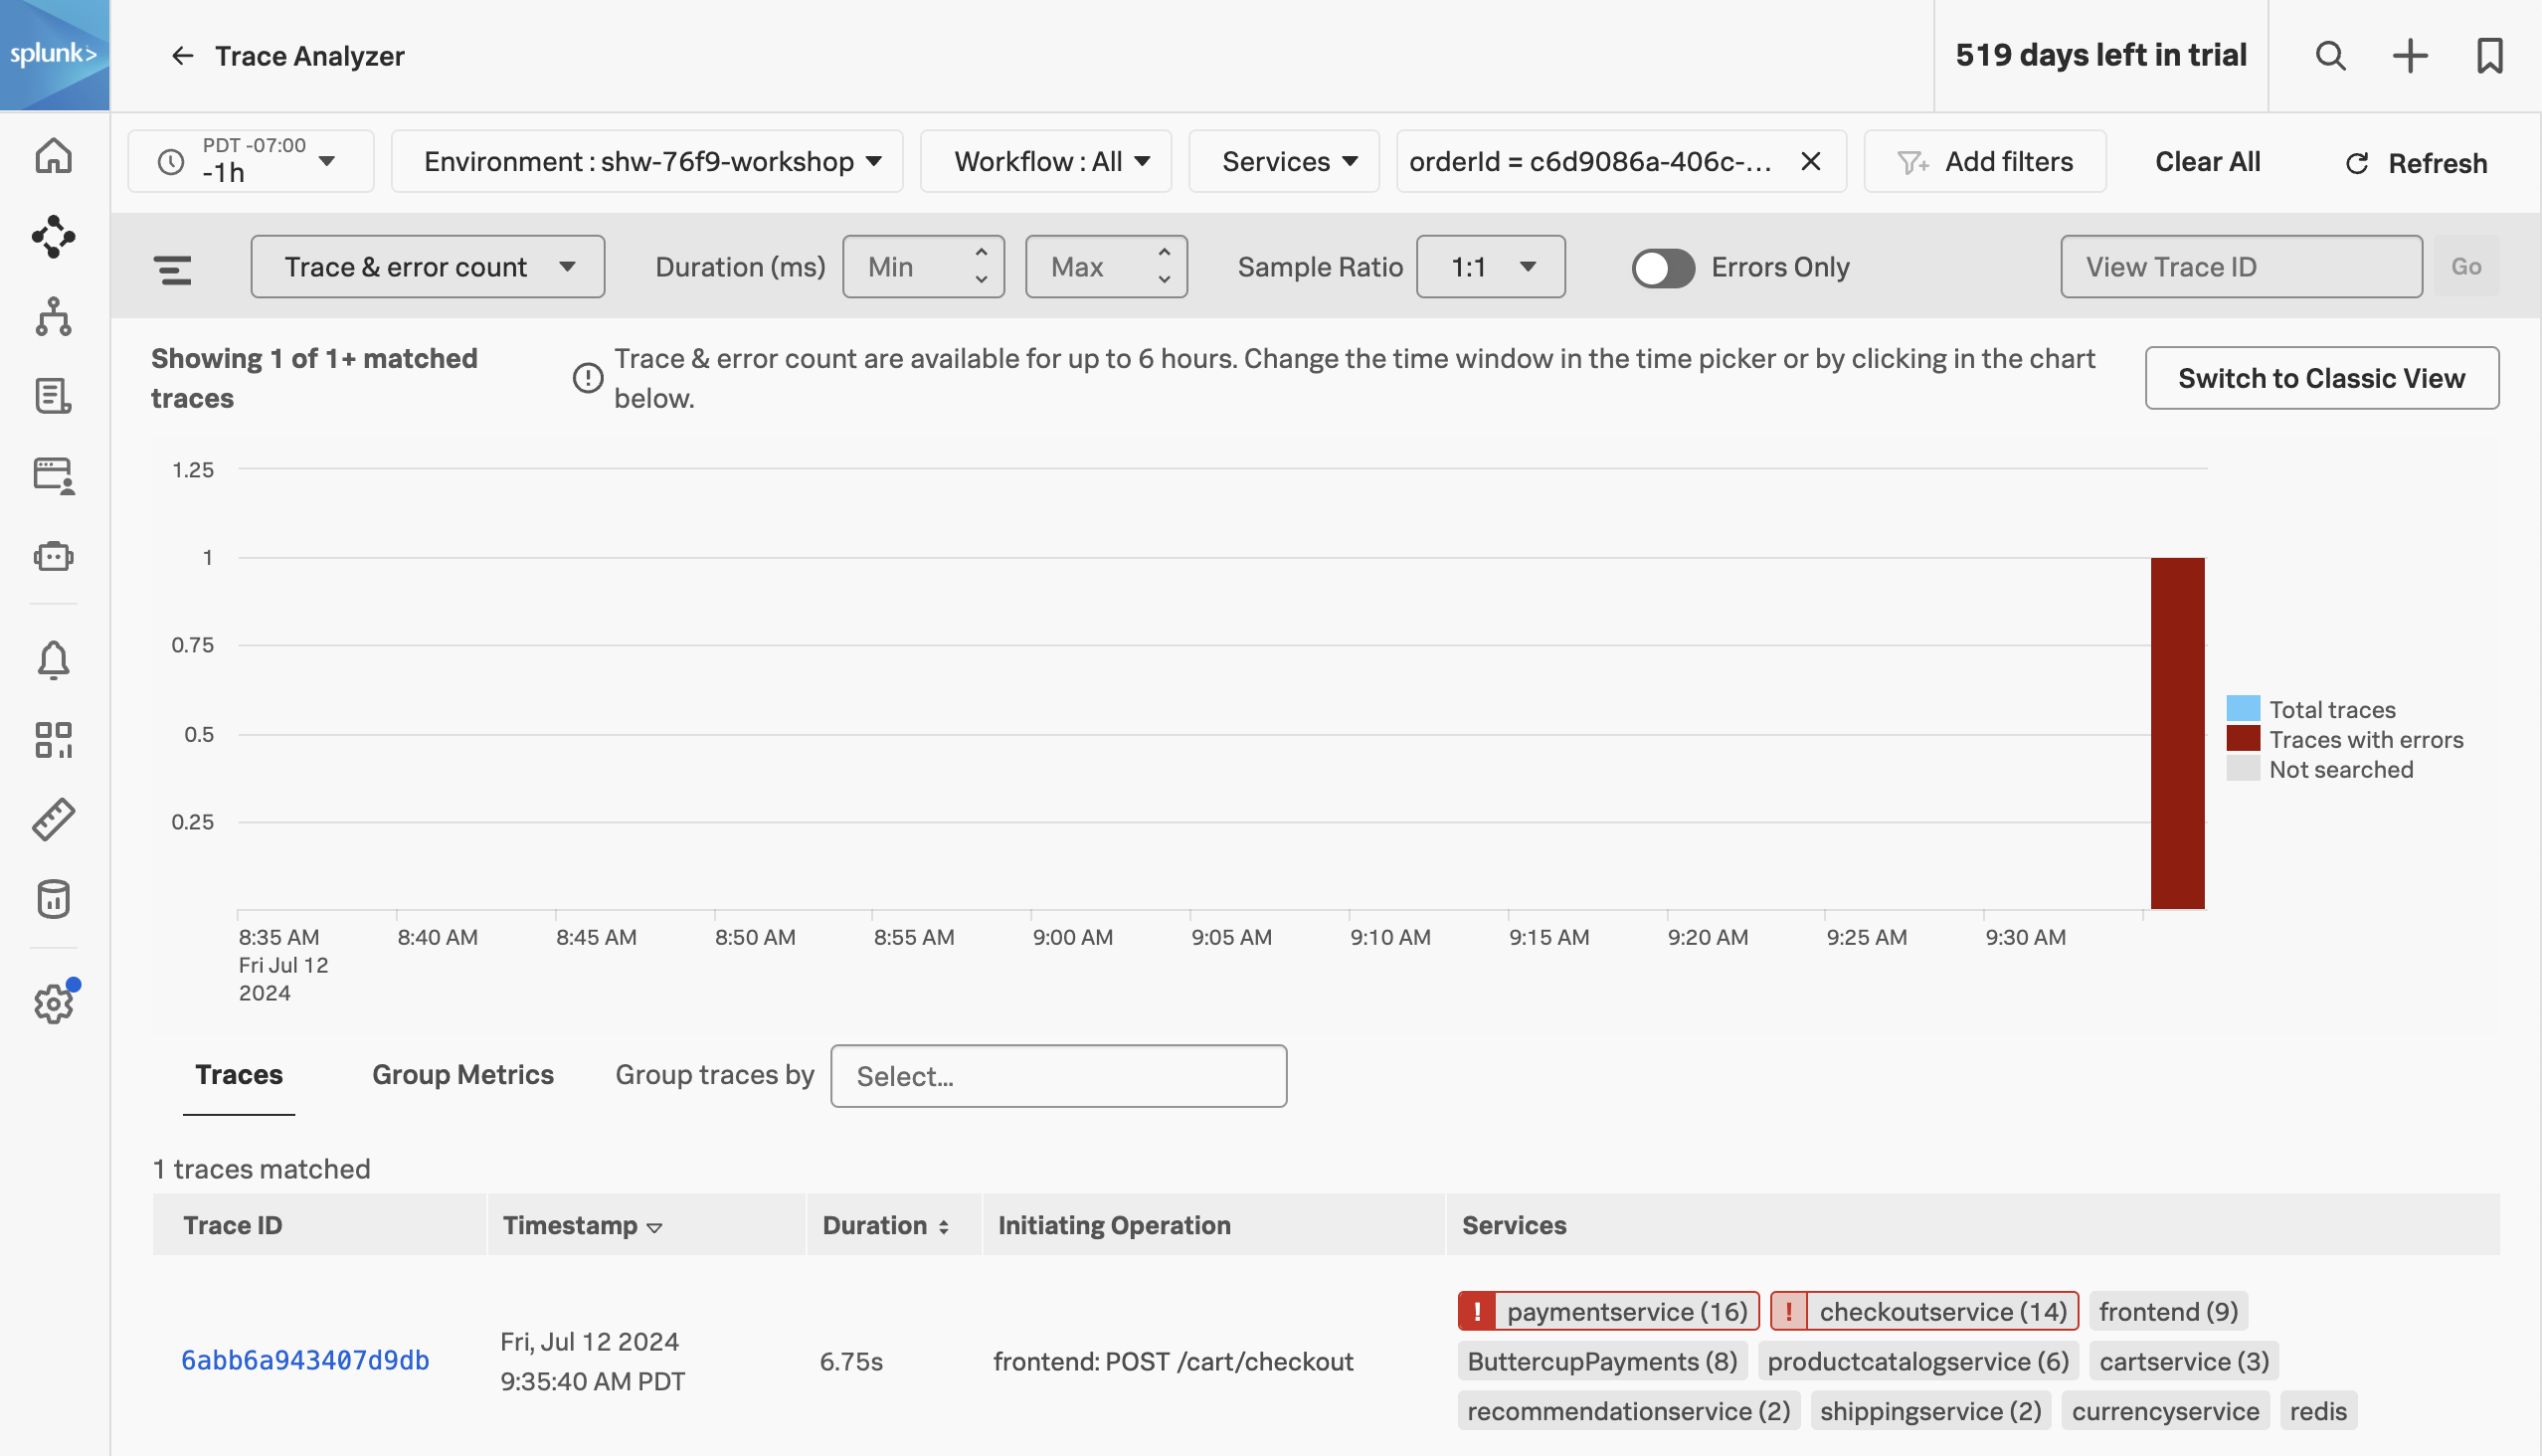
Switch from Trace duration back to Trace & Error count.
In the time picker select Last 1 hour.
Note, that most of our traces have errors (red) and there are only a limited amount of traces that are error-free (blue).
Make sure the Sample Ratio is set to 1:1 and not1:10.
Click on Add filters, type in orderId and select orderId from the list.
Paste in your Order Confirmation ID from when you went shopping earlier in the workshop and hit enter. If you didn’t capture one, please ask your instructor for one.
We have now filtered down to the exact trace where you encountered a poor user experience with a very long checkout wait. A secondary benefit to viewing this trace is that the trace will be accessible for up to 13 months. This will allow developers to come back to this issue at a later stage and still view this trace for example.
Exercise
Click on the trace in the list.
Next, we will walk through the trace waterfall.
6. APM Waterfall
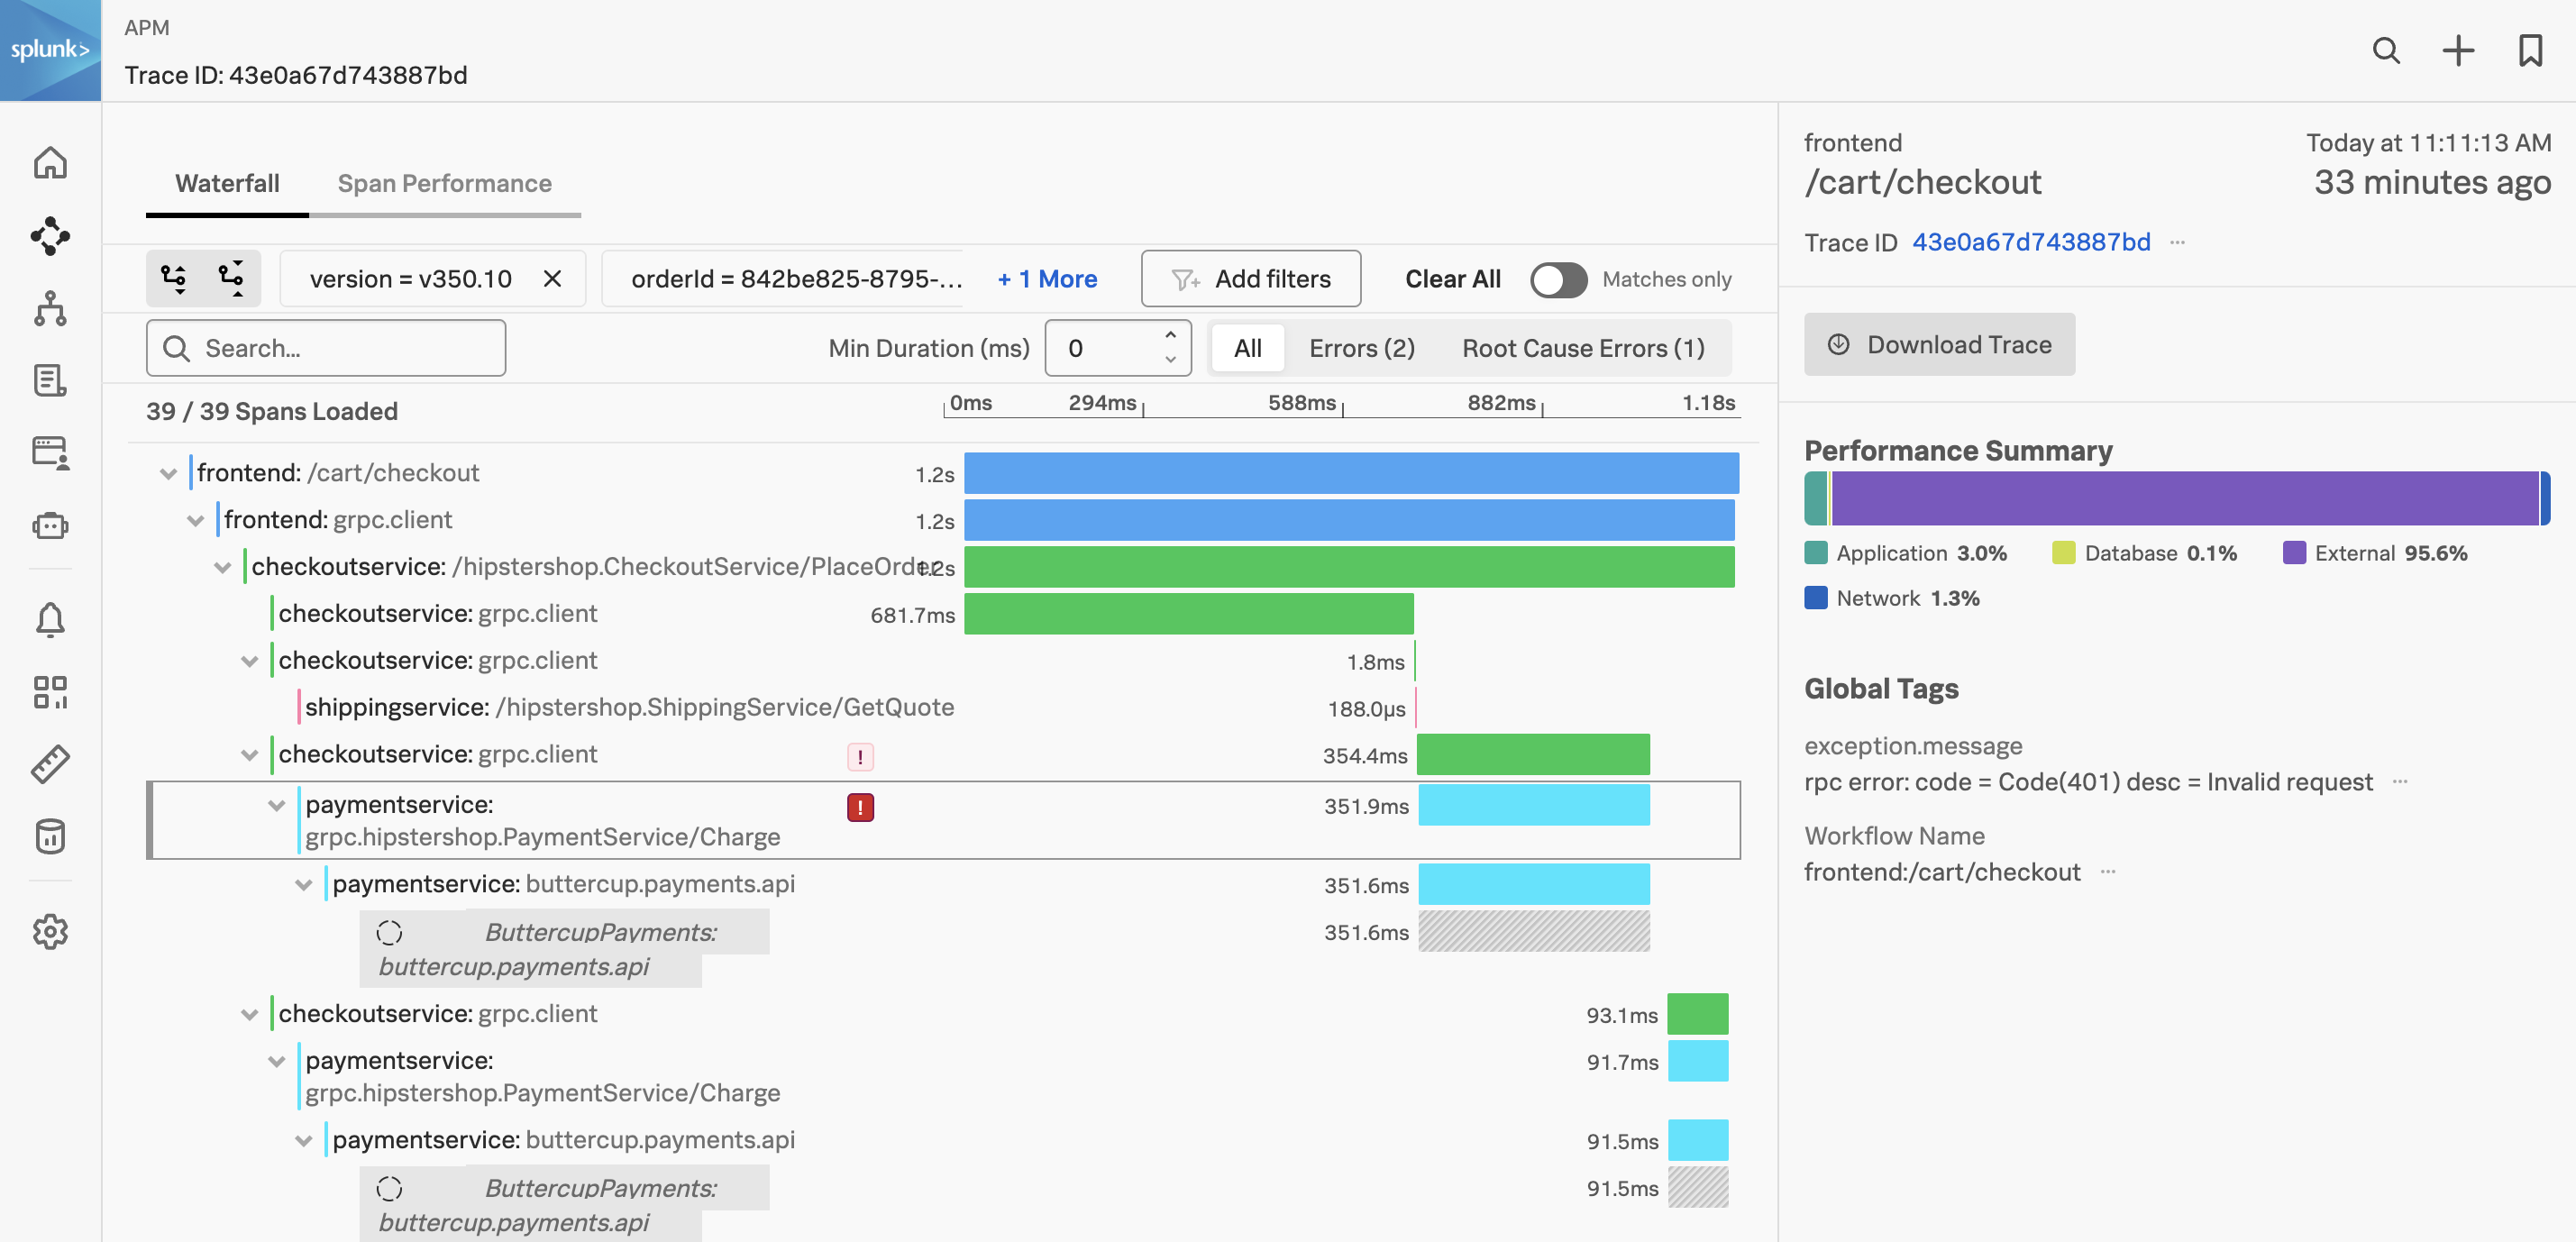
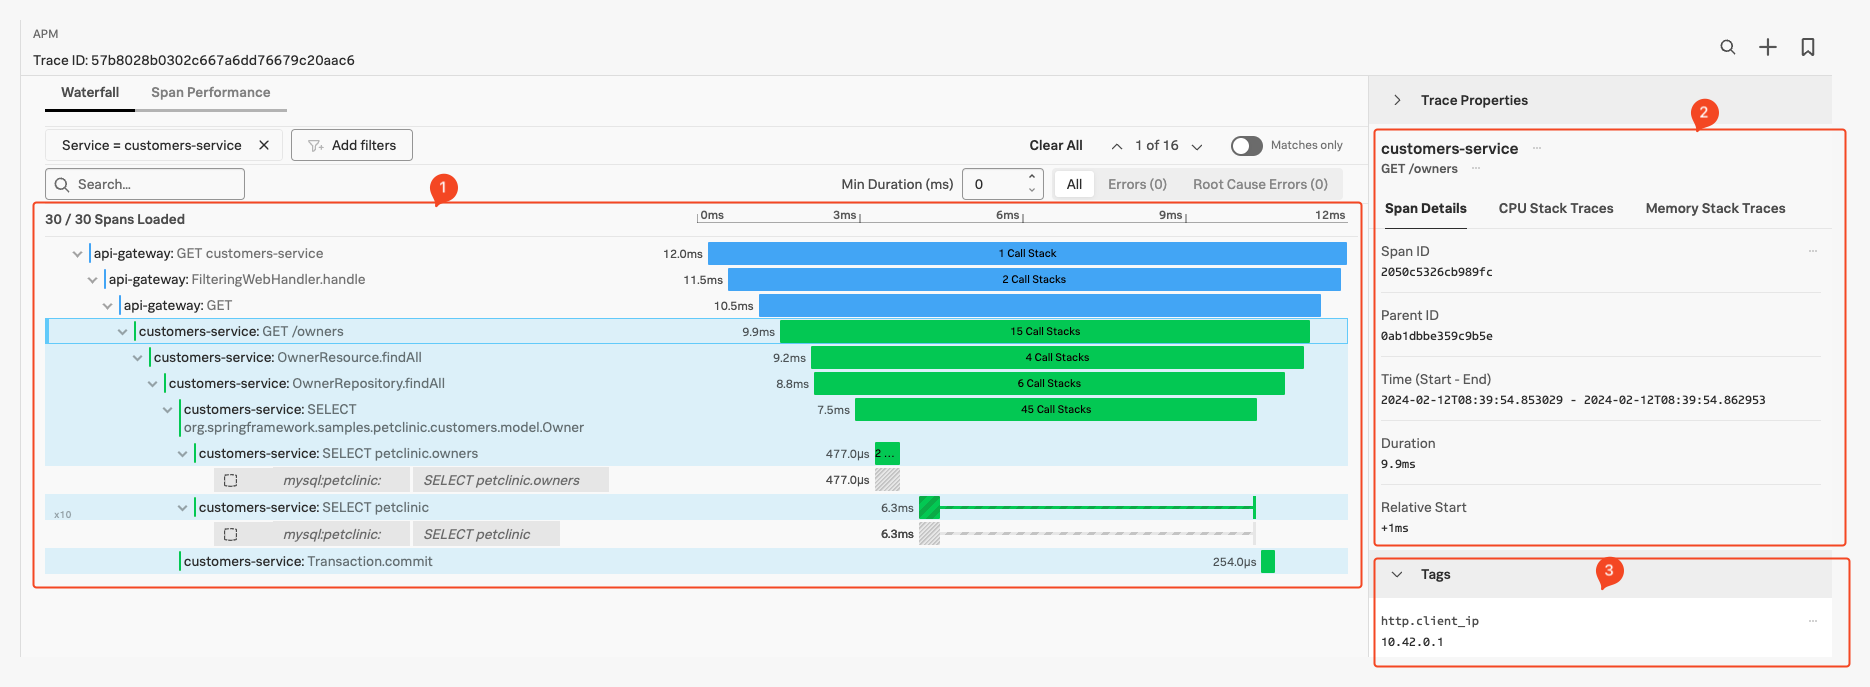
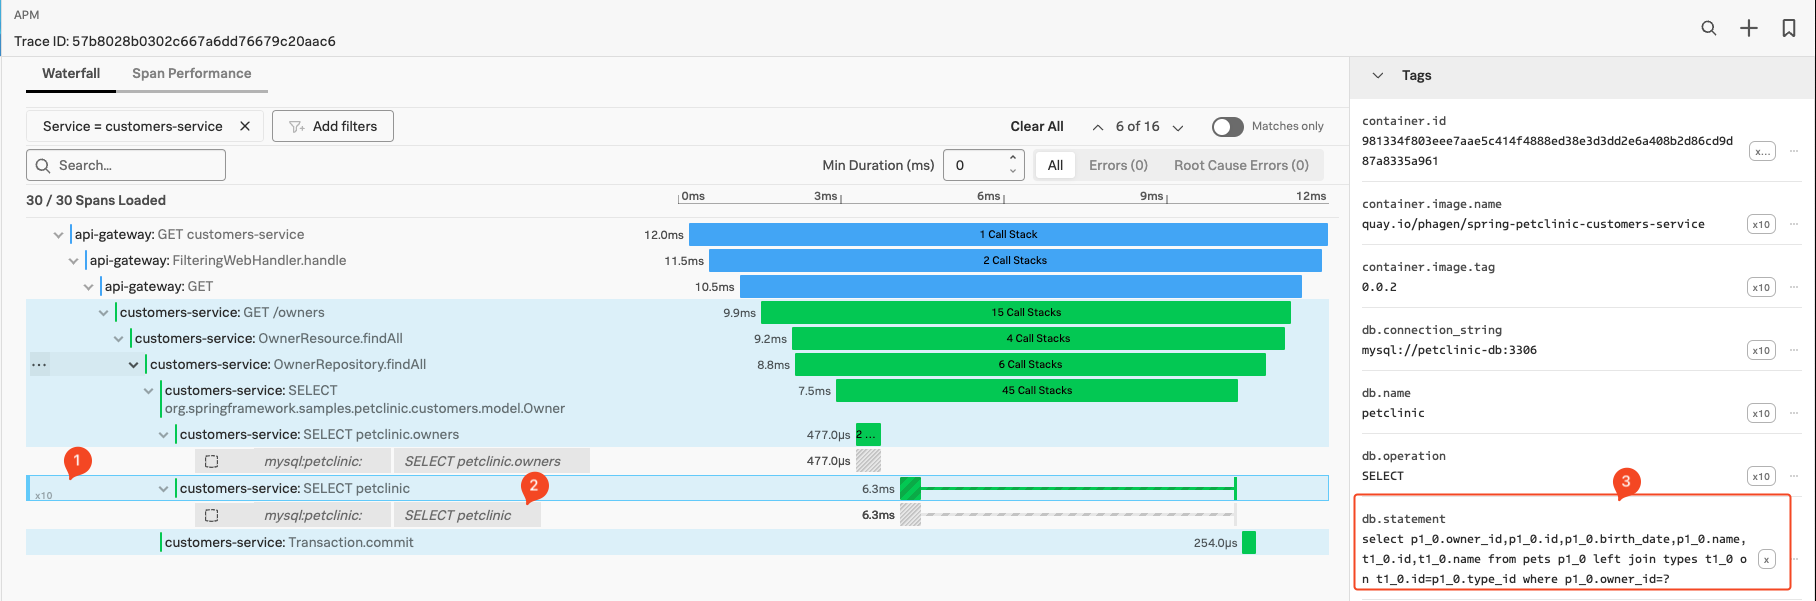
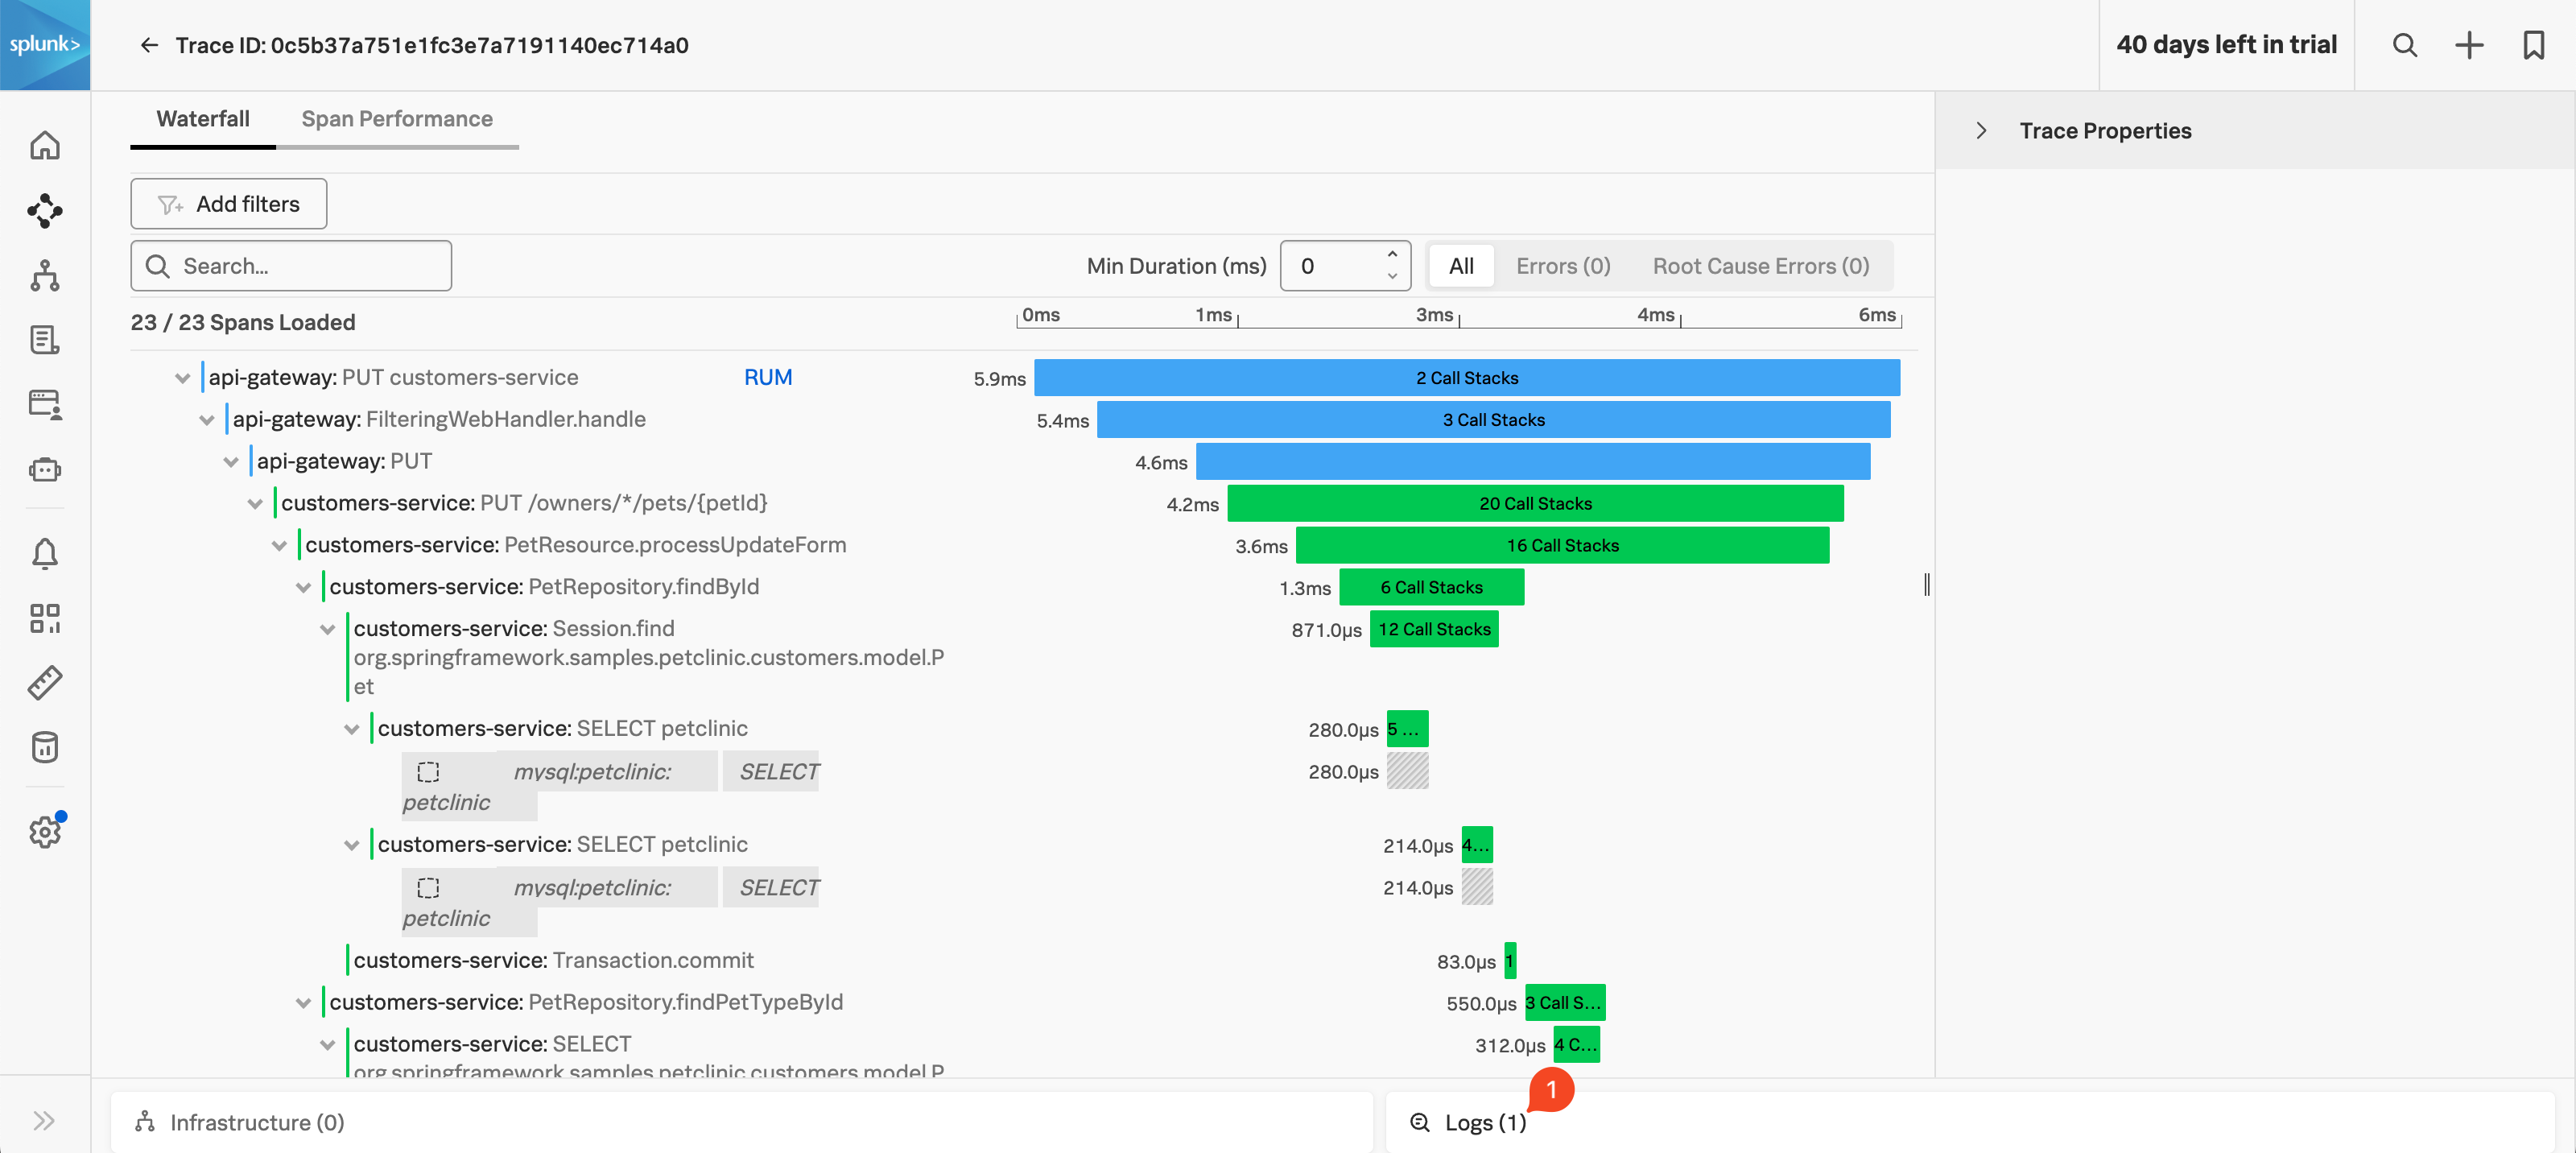
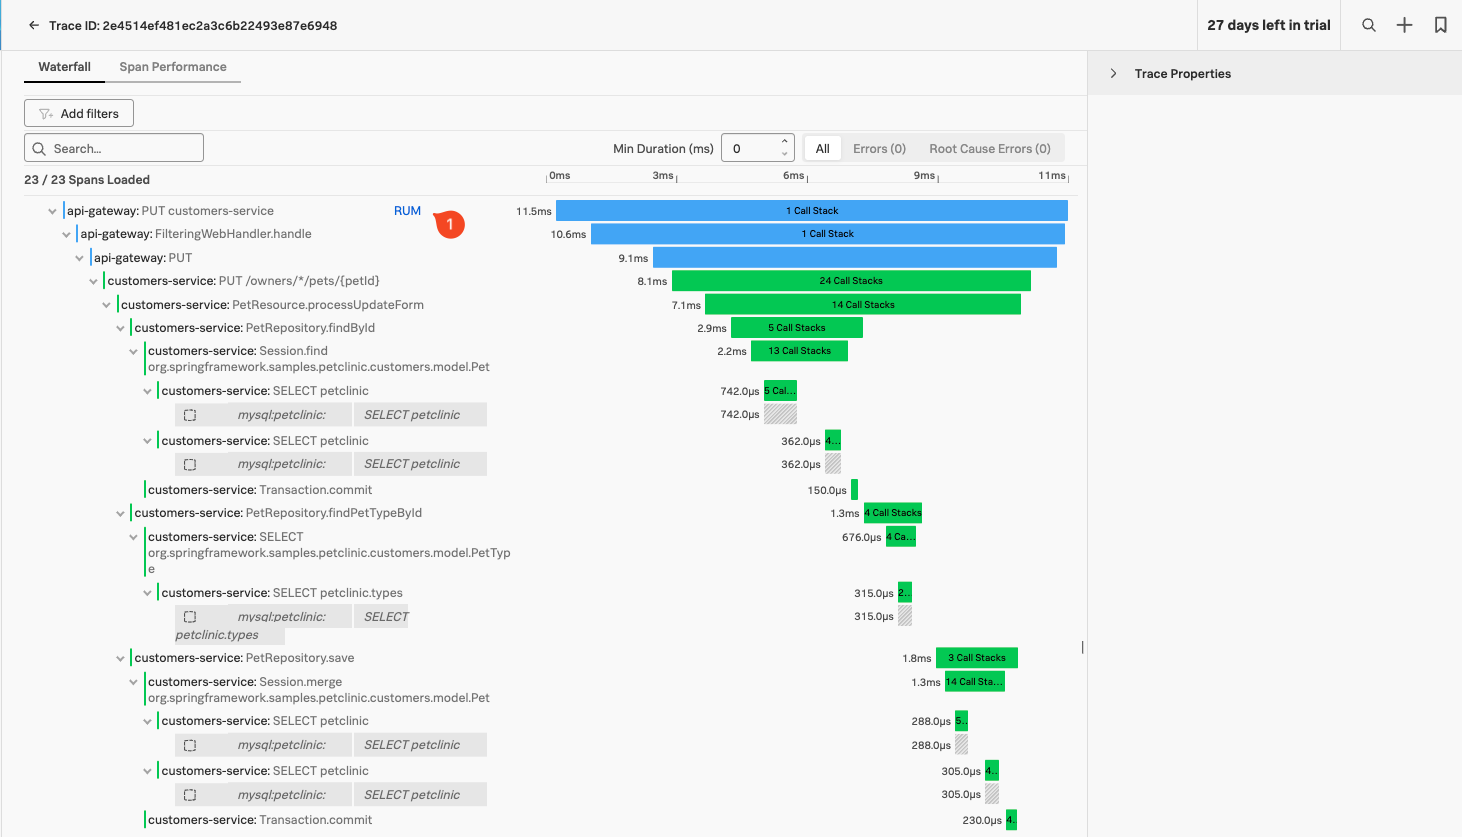
We have arrived at the Trace Waterfall from the Trace Analyzer. A trace is a collection of spans that share the same trace ID, representing a unique transaction handled by your application and its constituent services.
Each span in Splunk APM captures a single operation. Splunk APM considers a span to be an error span if the operation that the span captures results in an error.
Exercise
Click on the ! next to any of the paymentservice:grpc.hipstershop.PaymentService/Charge spans in the waterfall.
What is the error message and version being reported in the span metadata?
Invalid request and v350.10.
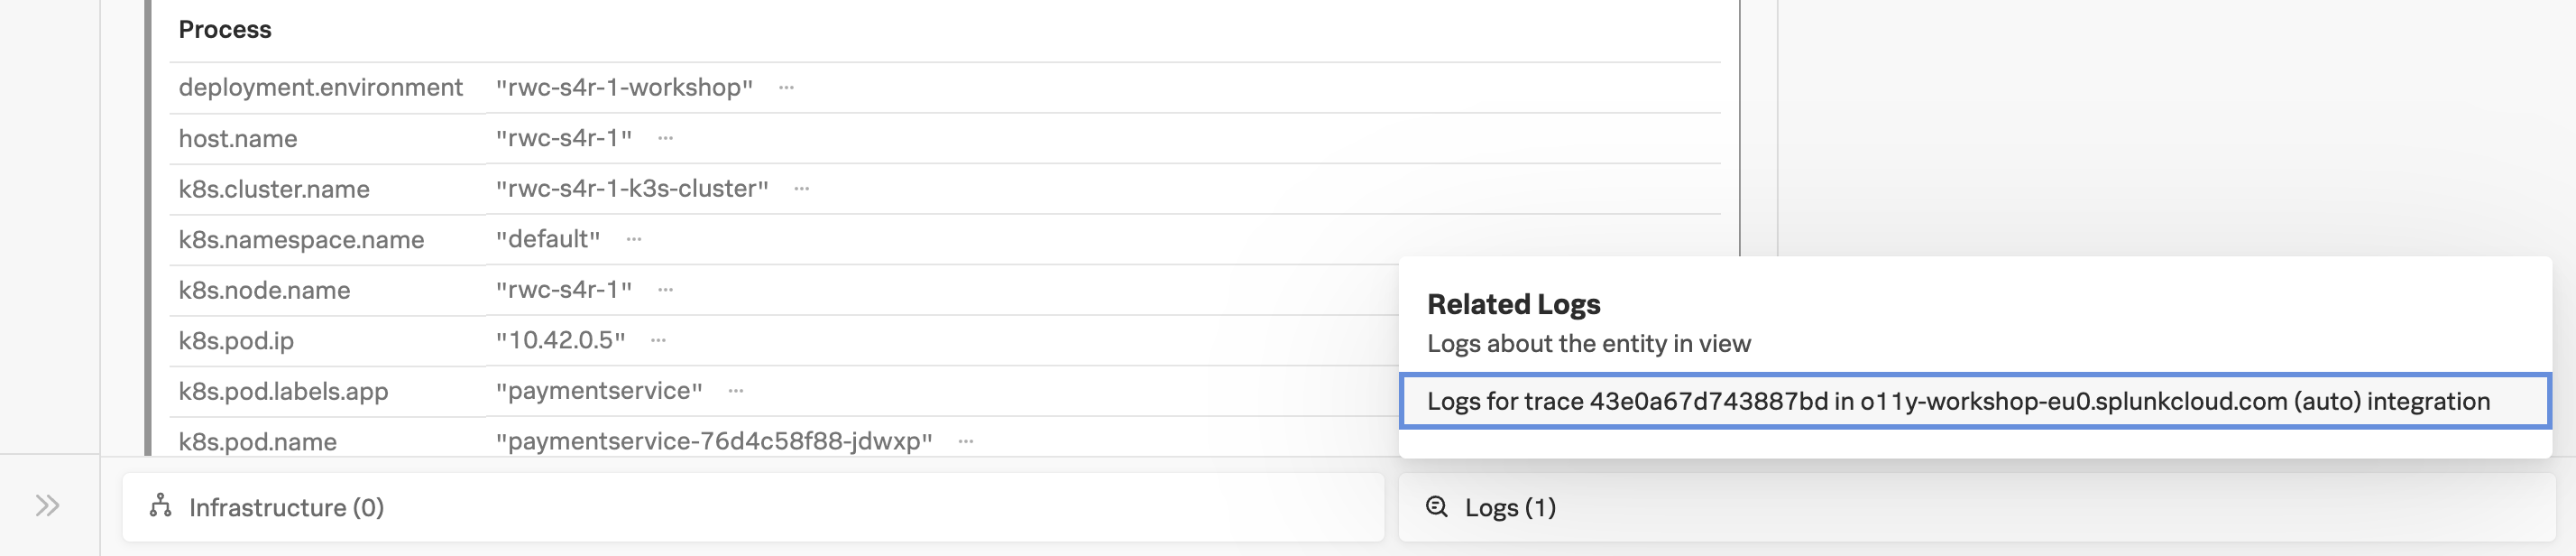
Now that we have identified the version of the paymentservice that is causing the issue, let’s see if we can find out more information about the error. This is where Related Logs come in.
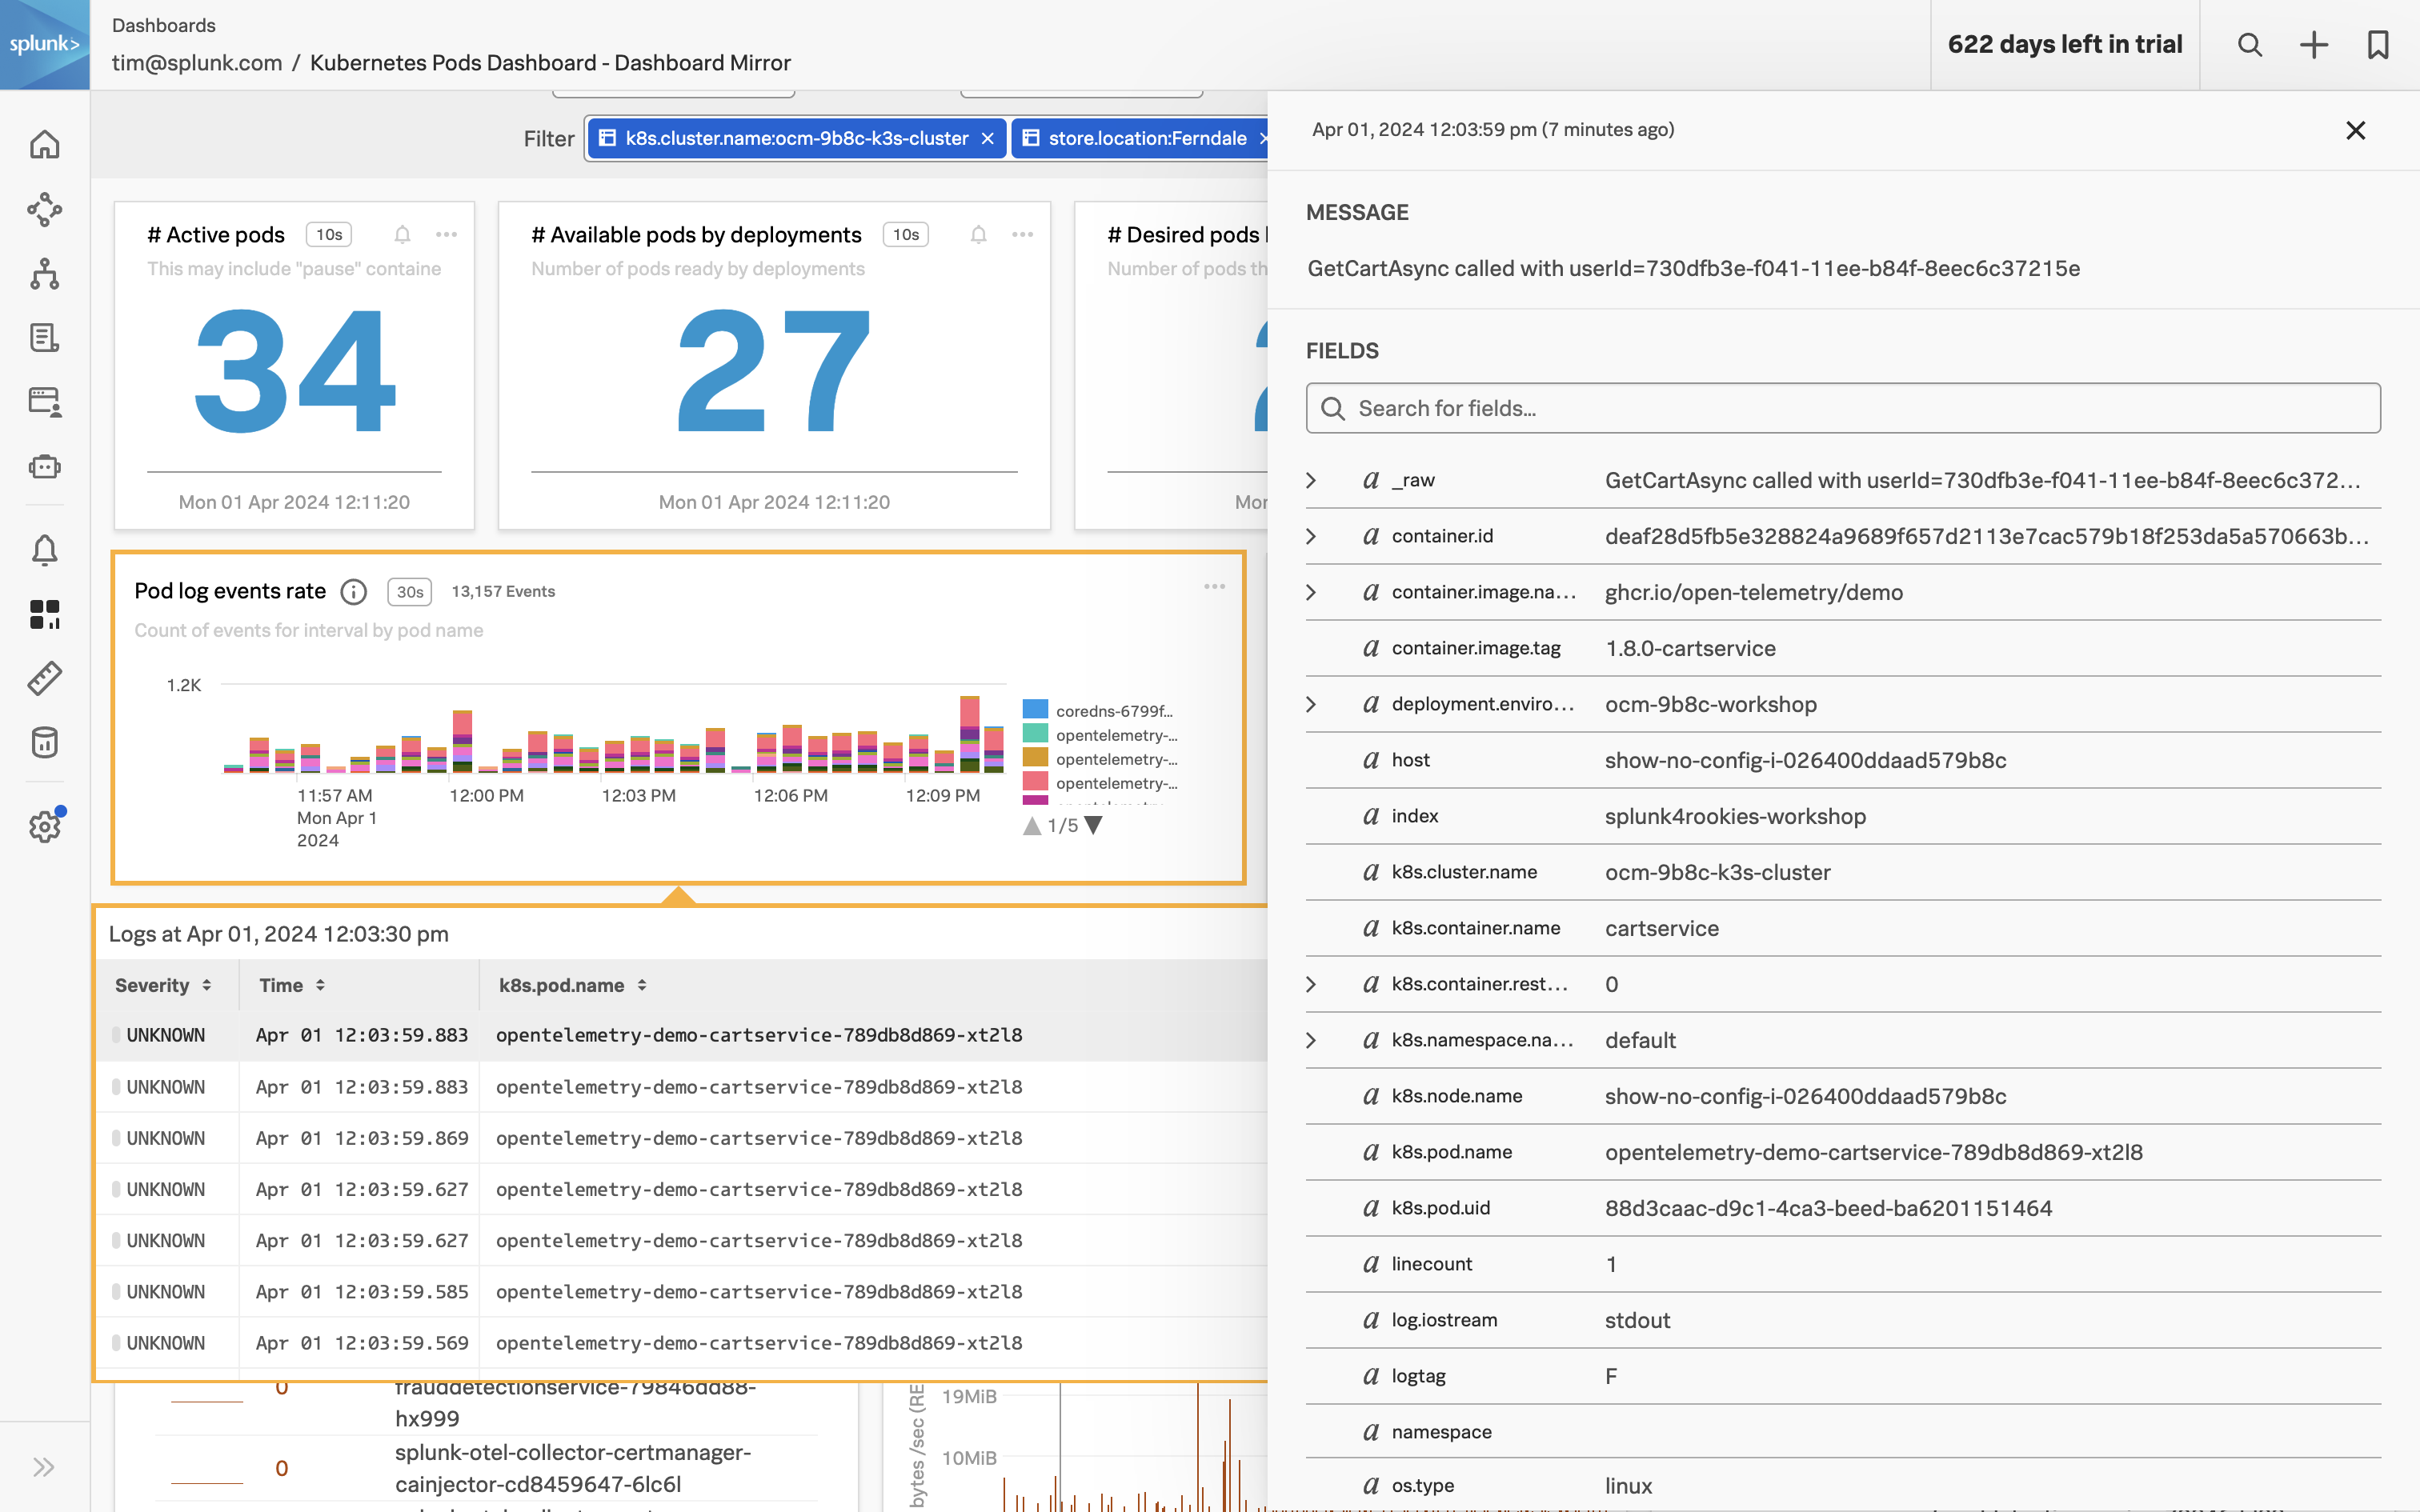
Related Content relies on specific metadata that allow APM, Infrastructure Monitoring, and Log Observer to pass filters around Observability Cloud. For related logs to work, you need to have the following metadata in your logs:
service.name
deployment.environment
host.name
trace_id
span_id
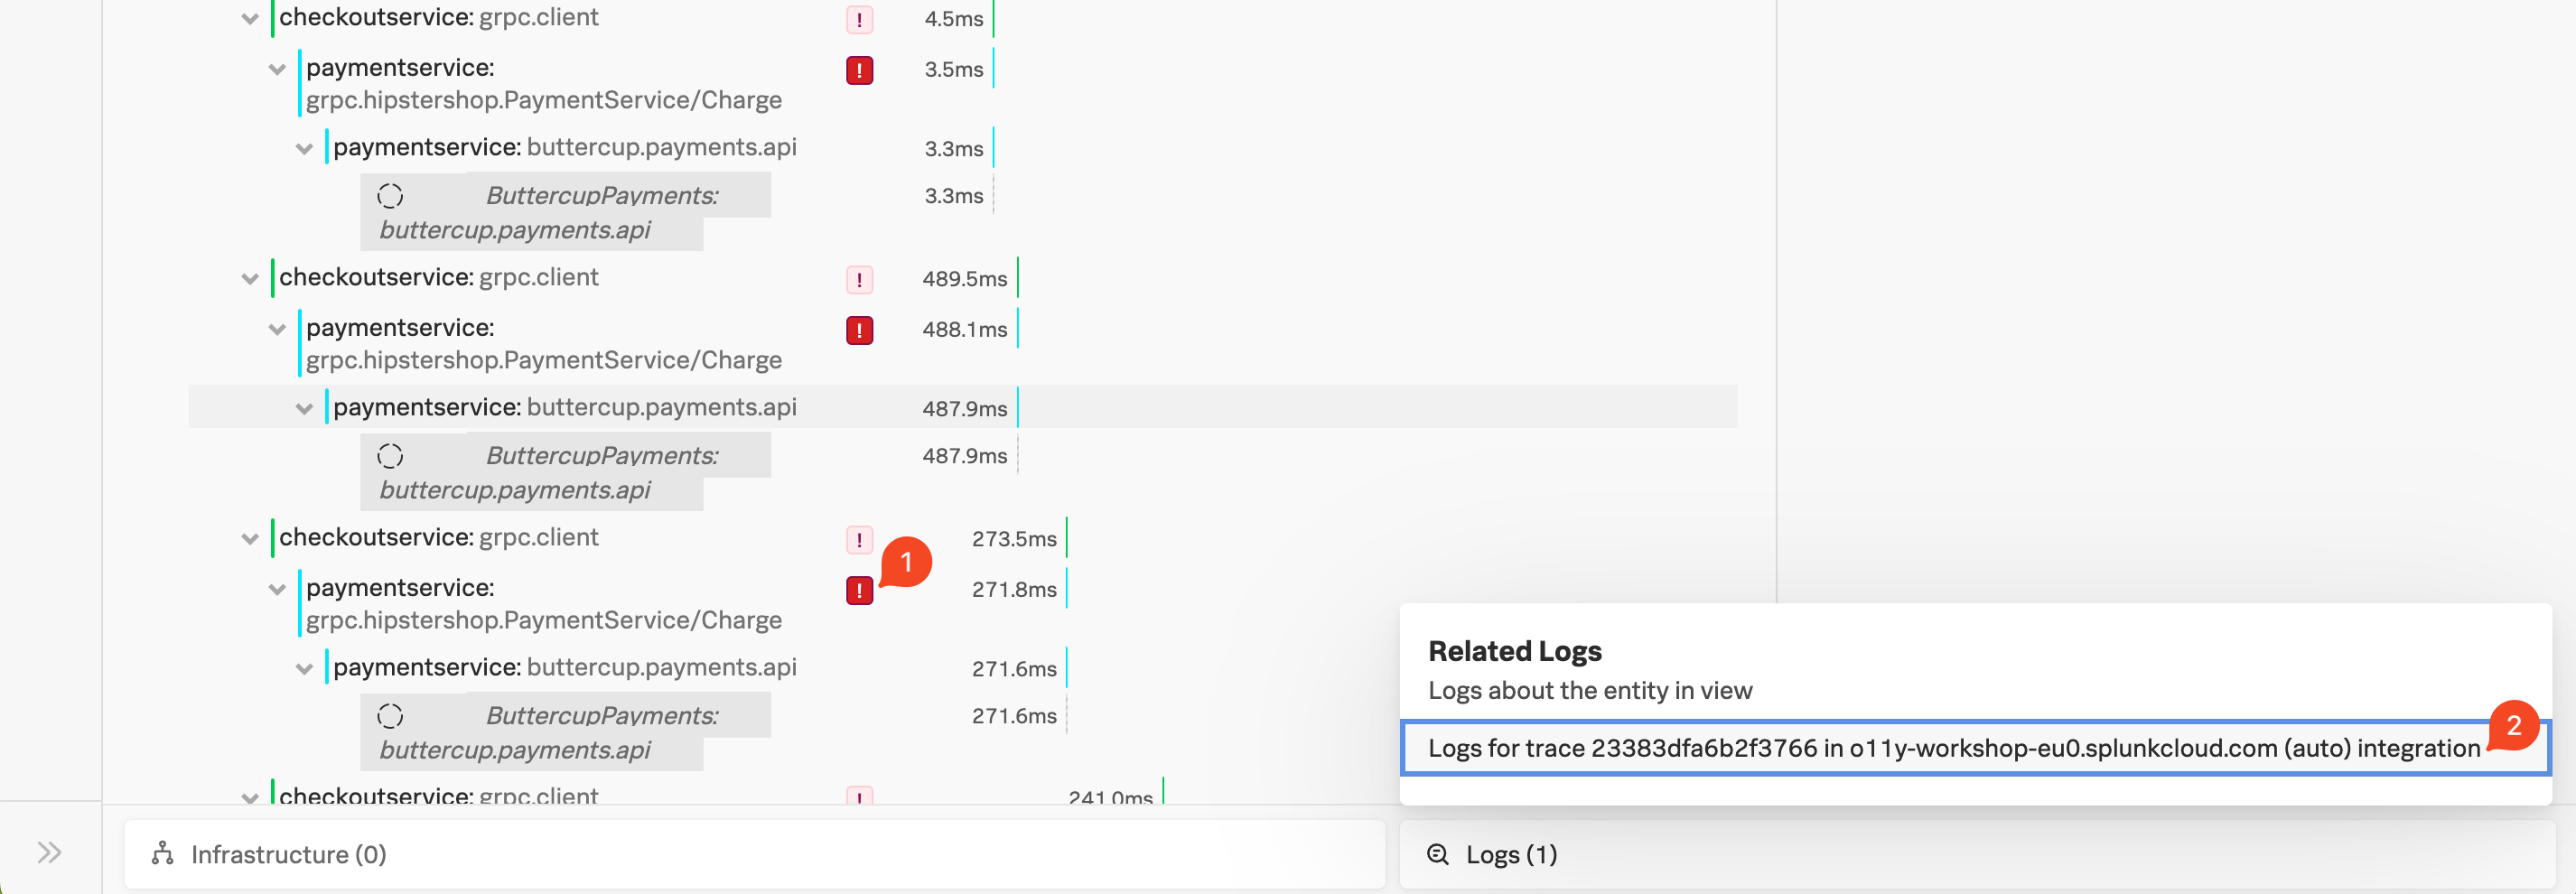
Exercise
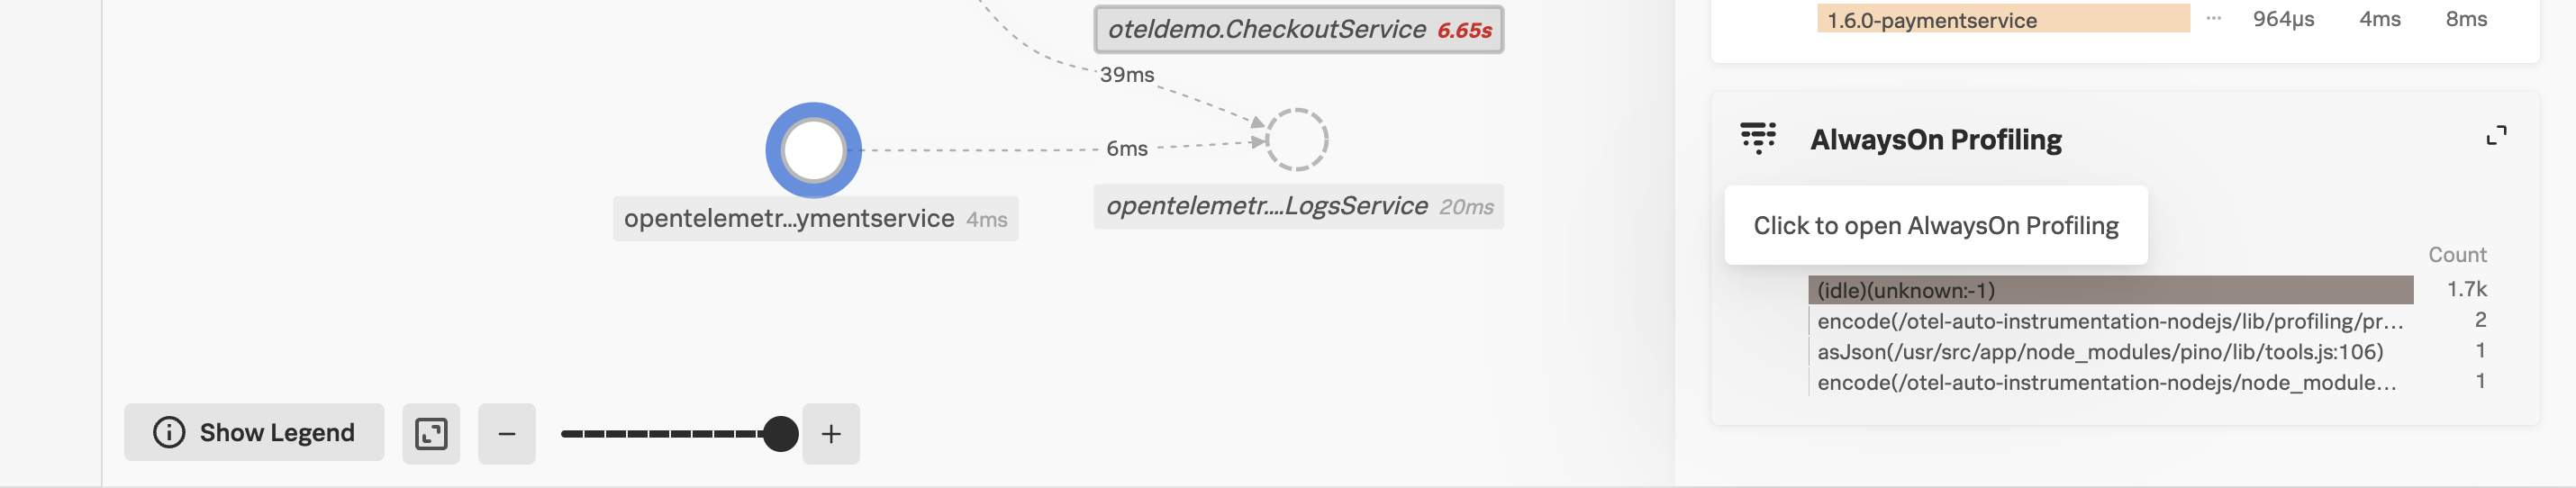
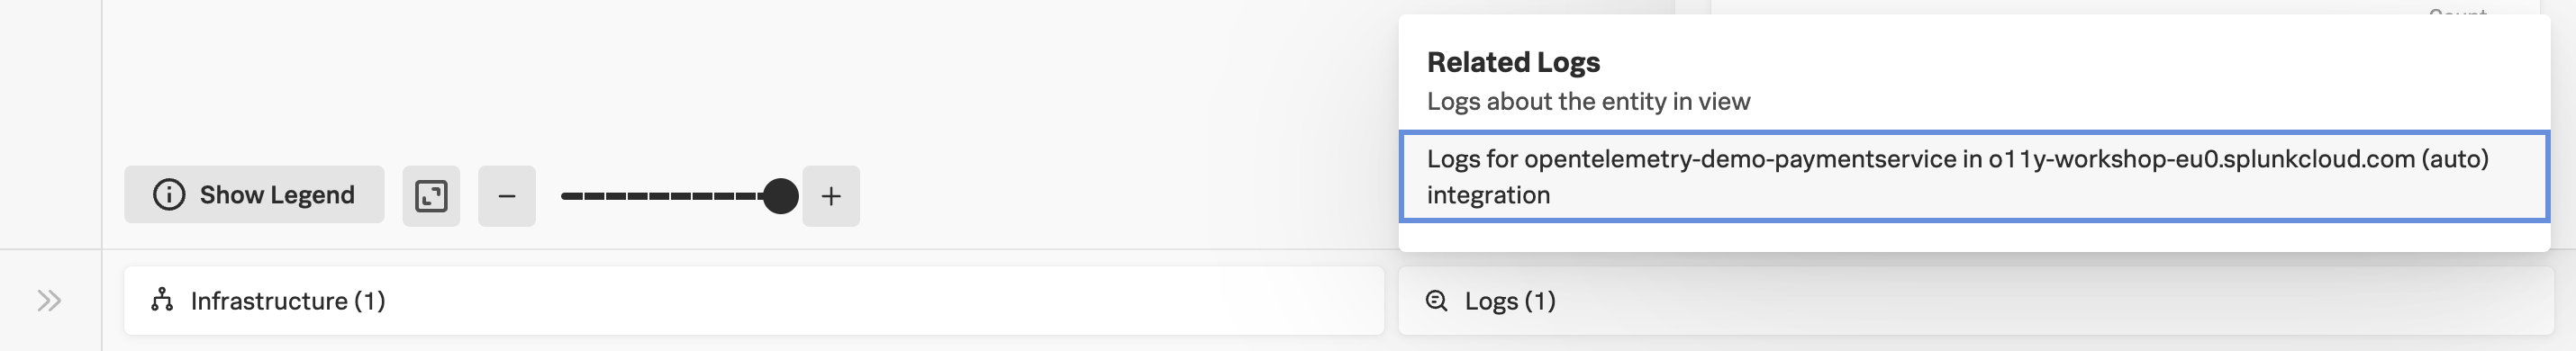
At the very bottom of the Trace Waterfall click on the word Logs (1). This highlights that there are Related Logs for this trace.
Click on the Logs for trace XXX entry in the pop-up, this will open the logs for the complete trace in Log Observer.
Splunk Log Observer
20 minutes
Persona
Remaining in your back-end developer role, you need to inspect the logs from your application to determine the root cause of the issue.
Using the content related to the APM trace (logs) we will now use Splunk Log Observer to drill down further to understand exactly what the problem is.
Related Content is a powerful feature that allows you to jump from one component to another and is available for metrics, traces and logs.
Subsections of Splunk Log Observer
1. Log Filtering
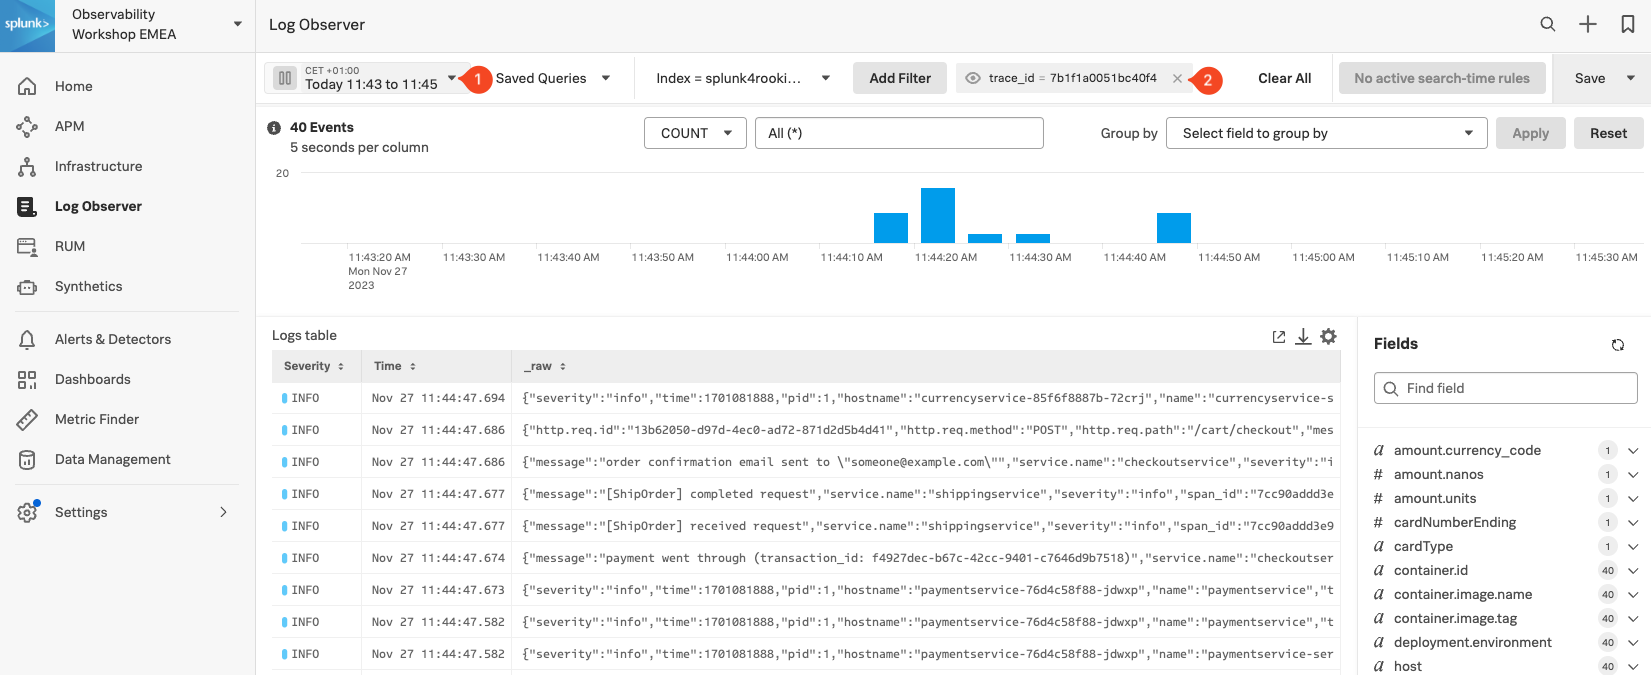
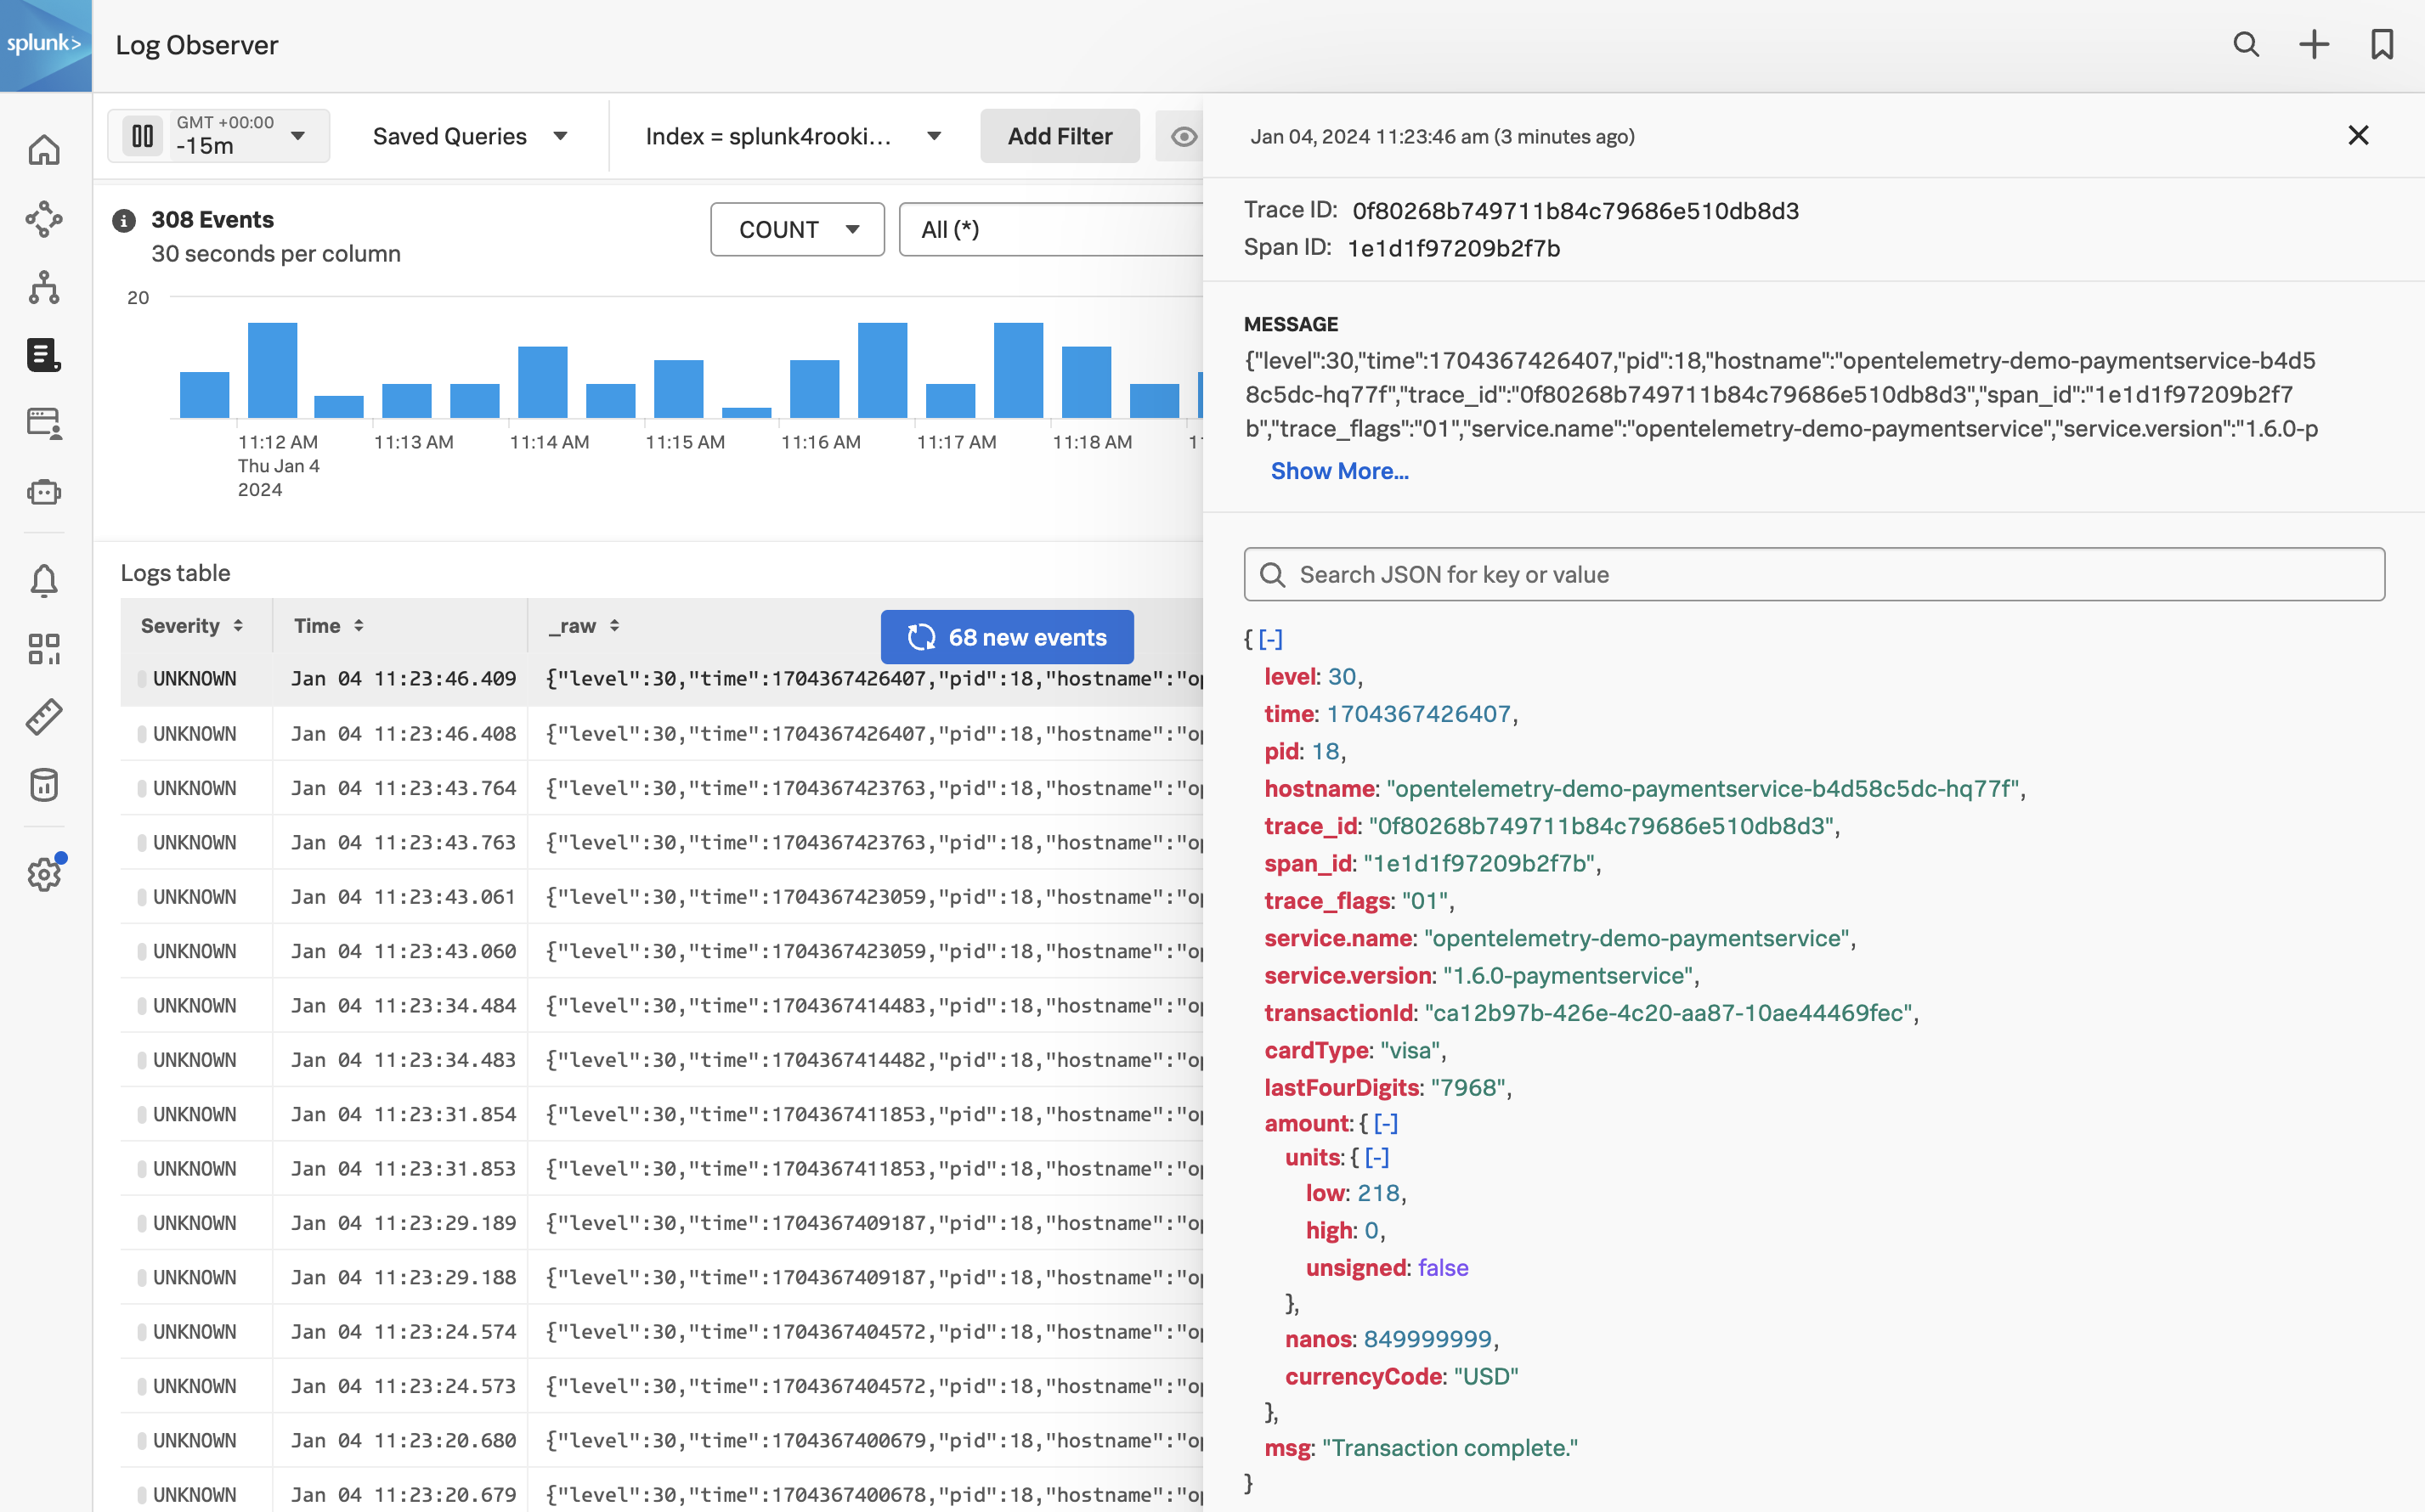
Log Observer (LO), can be used in multiple ways. In the quick tour, you used the LO no-code interface to search for specific entries in the logs. This section, however, assumes you have arrived in LO from a trace in APM using the Related Content link.
The advantage of this is, as it was with the link between RUM & APM, that you are looking at your logs within the context of your previous actions. In this case, the context is the time frame (1), which matches that of the trace and the filter (2) which is set to the trace_id.
This view will include all the log lines from all applications or services that participated in the back-end transaction started by the end-user interaction with the Online Boutique.
Even in a small application such as our Online Boutique, the sheer amount of logs found can make it hard to see the specific log lines that matter to the actual incident we are investigating.
Exercise
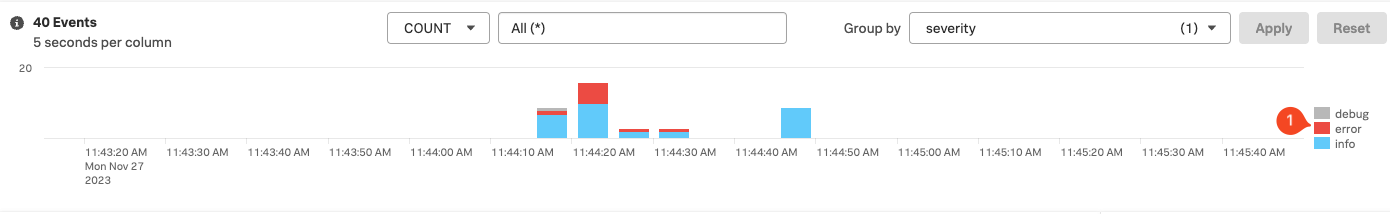
We need to focus on just the Error messages in the logs:
Click on the Group By drop-down box and use the filter to find Severity.
Once selected click the Apply button (notice that the chart legend changes to show debug, error and info).
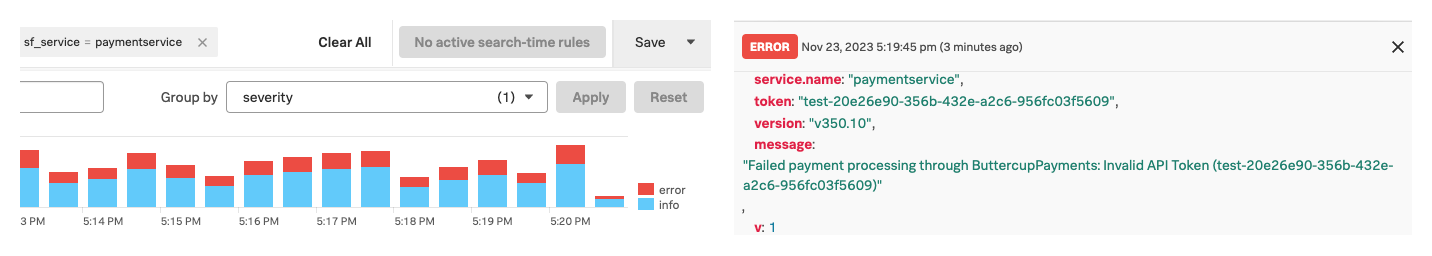
Selecting just the error logs can be done by either clicking on the word error (1) in the legend, followed by selecting Add to filter.
You could also add the service name, sf_service=paymentservice, to the filter if there are error lines for multiple services, but in our case, this is not necessary.
Next, we will look at log entries in detail.
2. Viewing Log Entries
Before we look at a specific log line, let’s quickly recap what we have done so far and why we are here based on the 3 pillars of Observability:
Metrics
Traces
Logs
Do I have a problem?
Where is the problem?
What is the problem?
Using metrics we identified we have a problem with our application. This was obvious from the error rate in the Service Dashboards as it was higher than it should be.
Using traces and span tags we found where the problem is. The paymentservice comprises of two versions, v350.9 and v350.10, and the error rate was 100% for v350.10.
We did see that this error from the paymentservicev350.10 caused multiple retries and a long delay in the response back from the Online Boutique checkout.
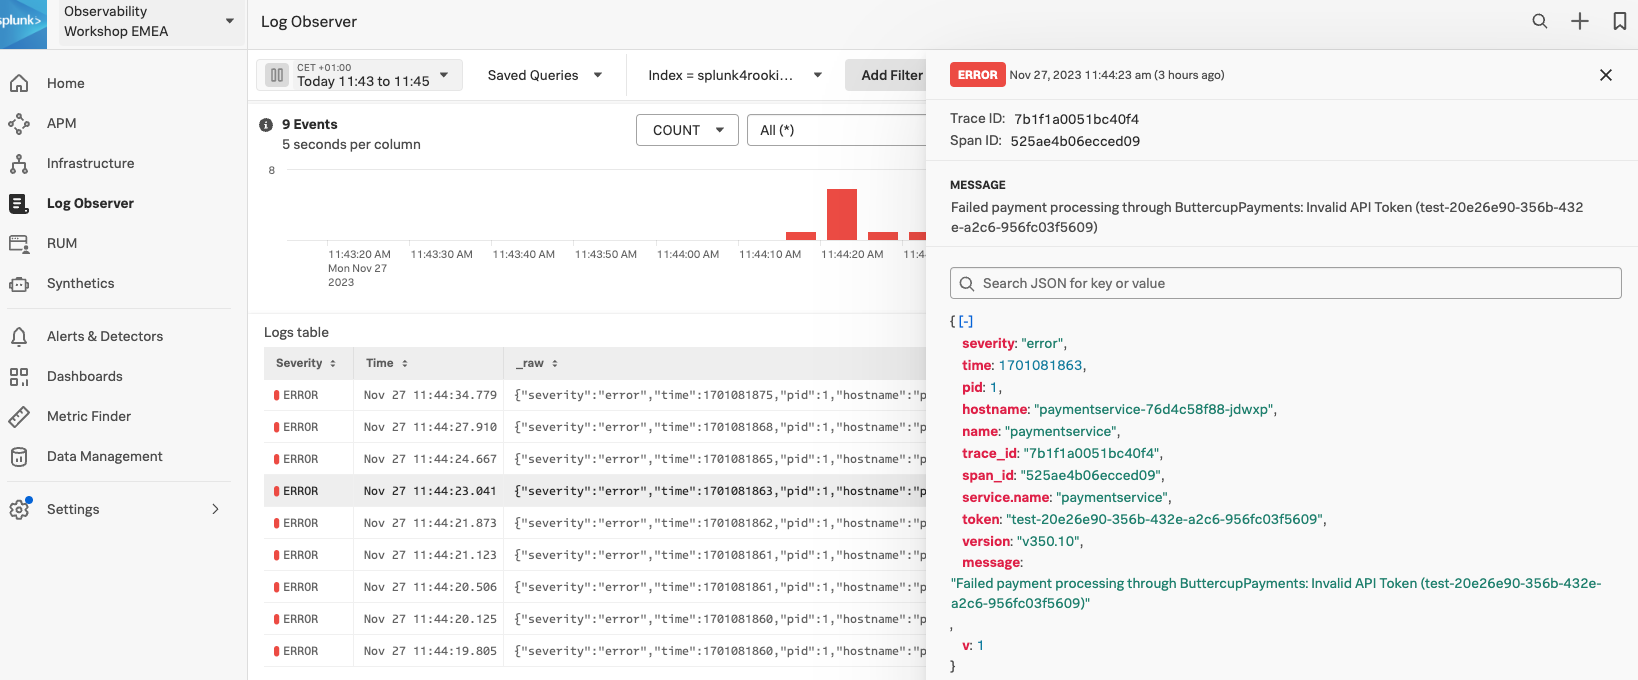
From the trace, using the power of Related Content, we arrived at the log entries for the failing paymentservice version. Now, we can determine what the problem is.
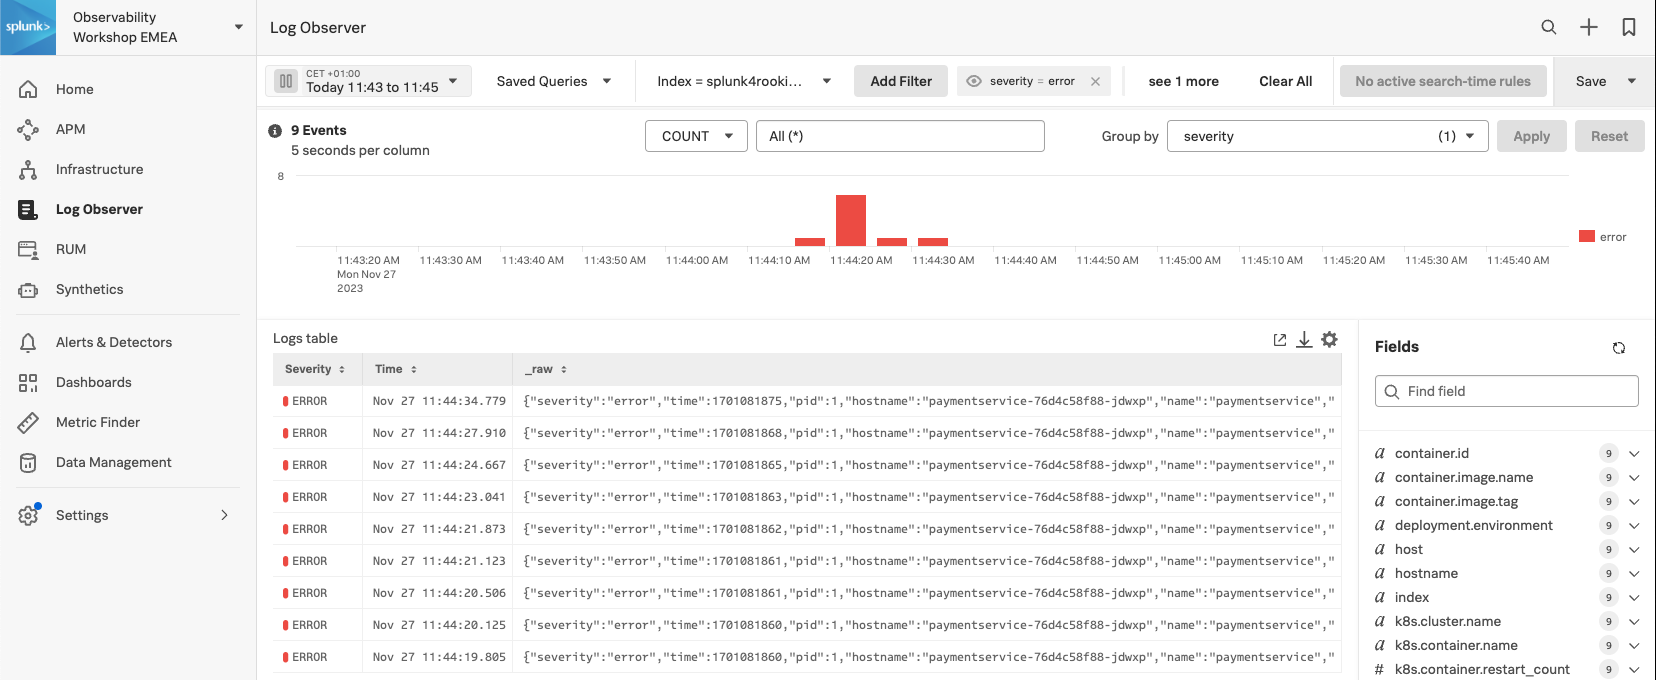
Exercise
Click on an error entry in the log table (make sure it says hostname: "paymentservice-xxxx" in case there is a rare error from a different service in the list too.
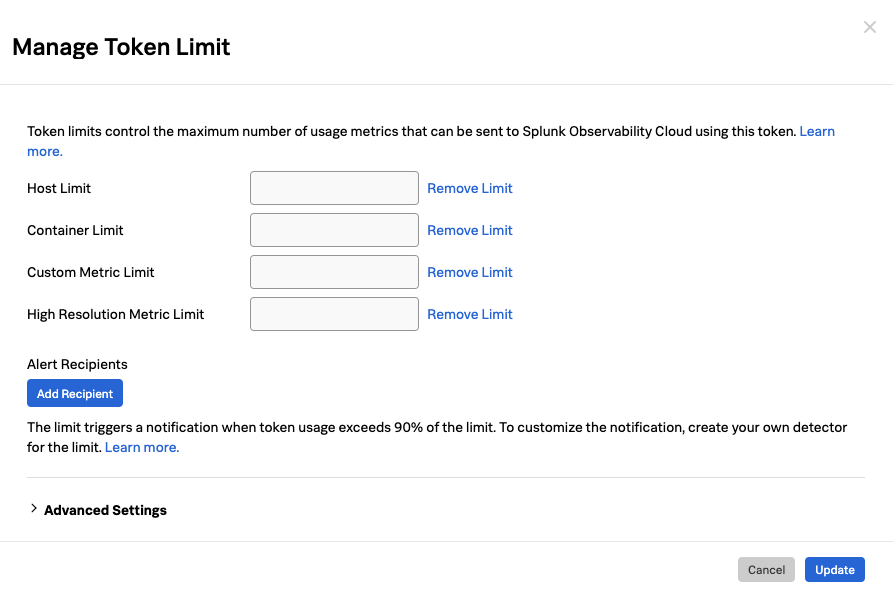
Based on the message, what would you tell the development team to do to resolve the issue?
The development team needs to rebuild and deploy the container with a valid API Token or rollback to v350.9.
Click on the X in the log message pane to close it.
Congratulations
You have successfully used Splunk Observability Cloud to understand why you experienced a poor user experience whilst shopping at the Online Boutique. You used RUM, APM and logs to understand what happened in your service landscape and subsequently, found the underlying cause, all based on the 3 pillars of Observability, metrics, traces and logs
You also learned how to use Splunk’s intelligent tagging and analysis with Tag Spotlight to detect patterns in your applications’ behavior and to use the full stack correlation power of Related Content to quickly move between the different components whilst keeping in context of the issue.
In the next part of the workshop, we will move from problem-finding mode into mitigation, prevention and process improvement mode.
Next up, creating log charts in a custom dashboard.
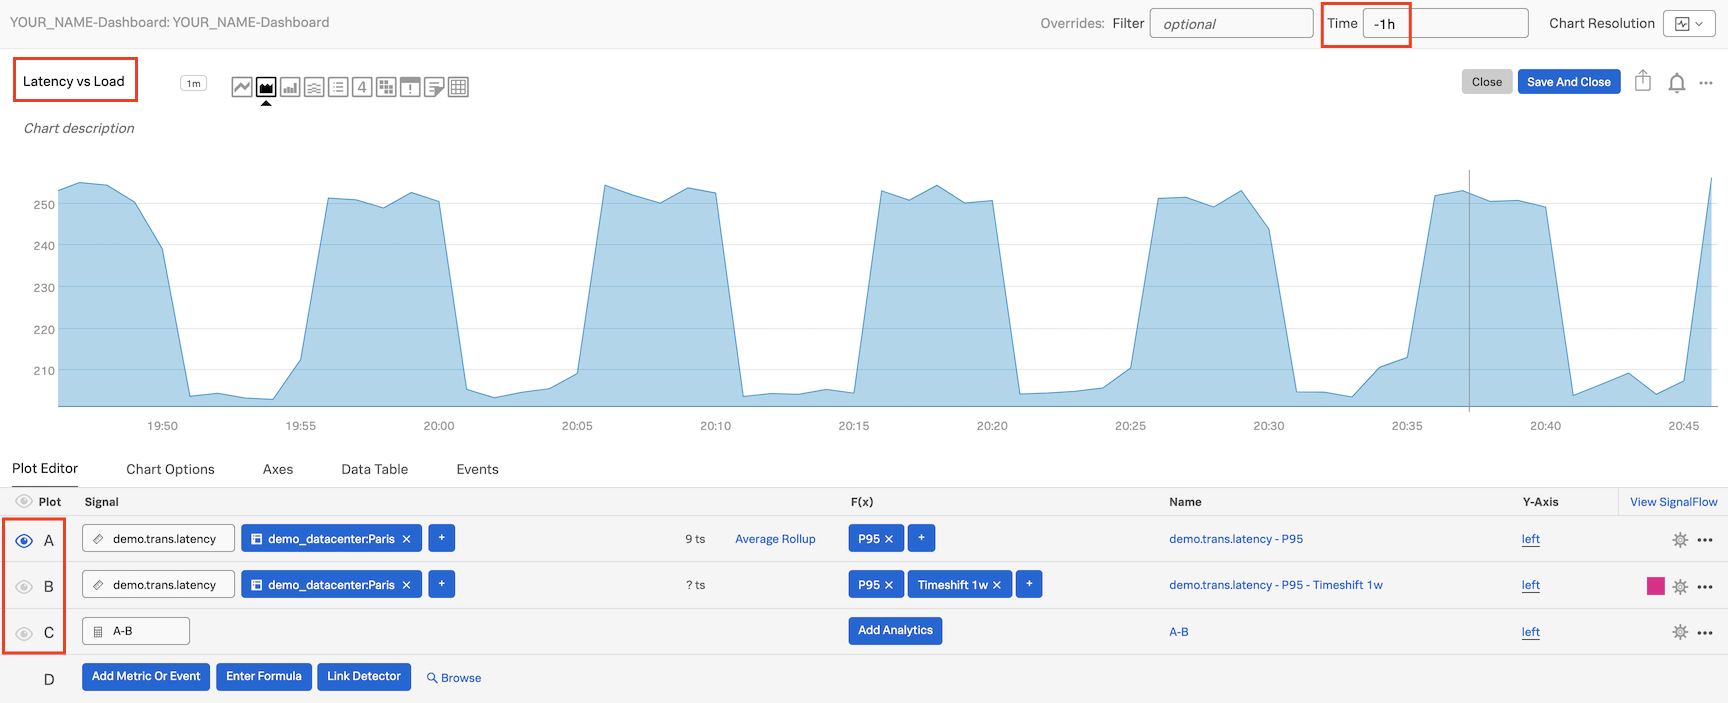
3. Log Timeline Chart
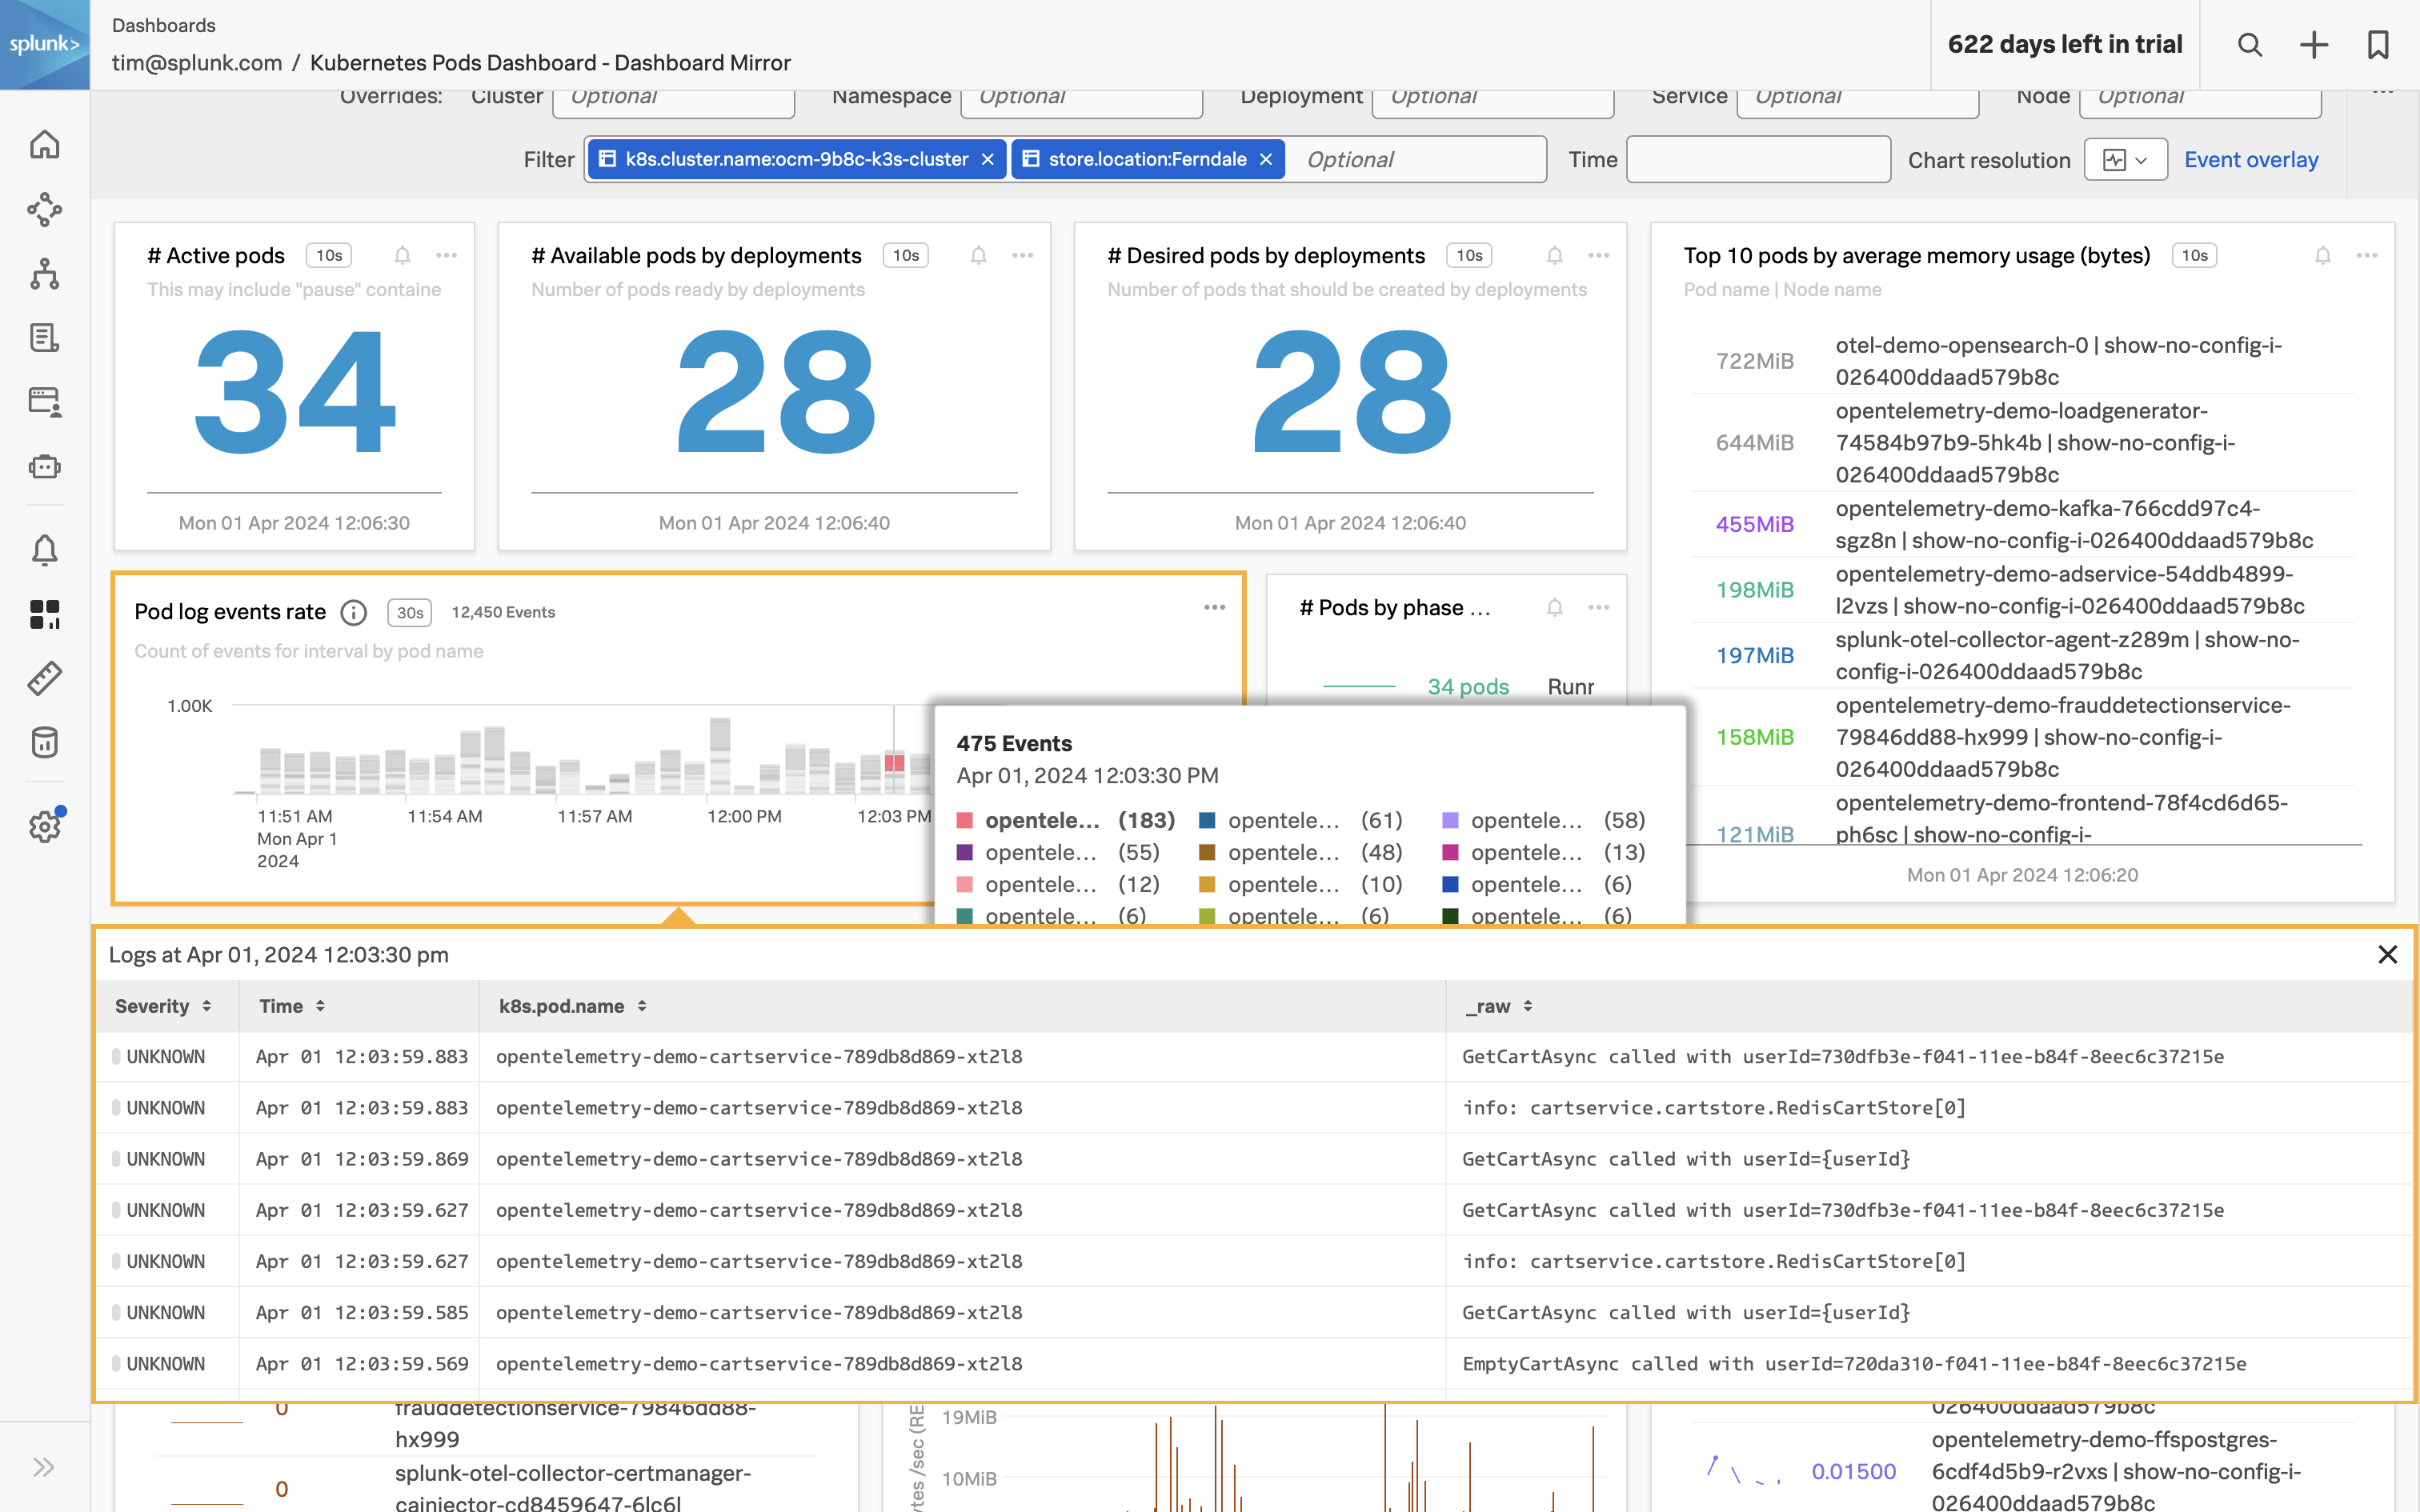
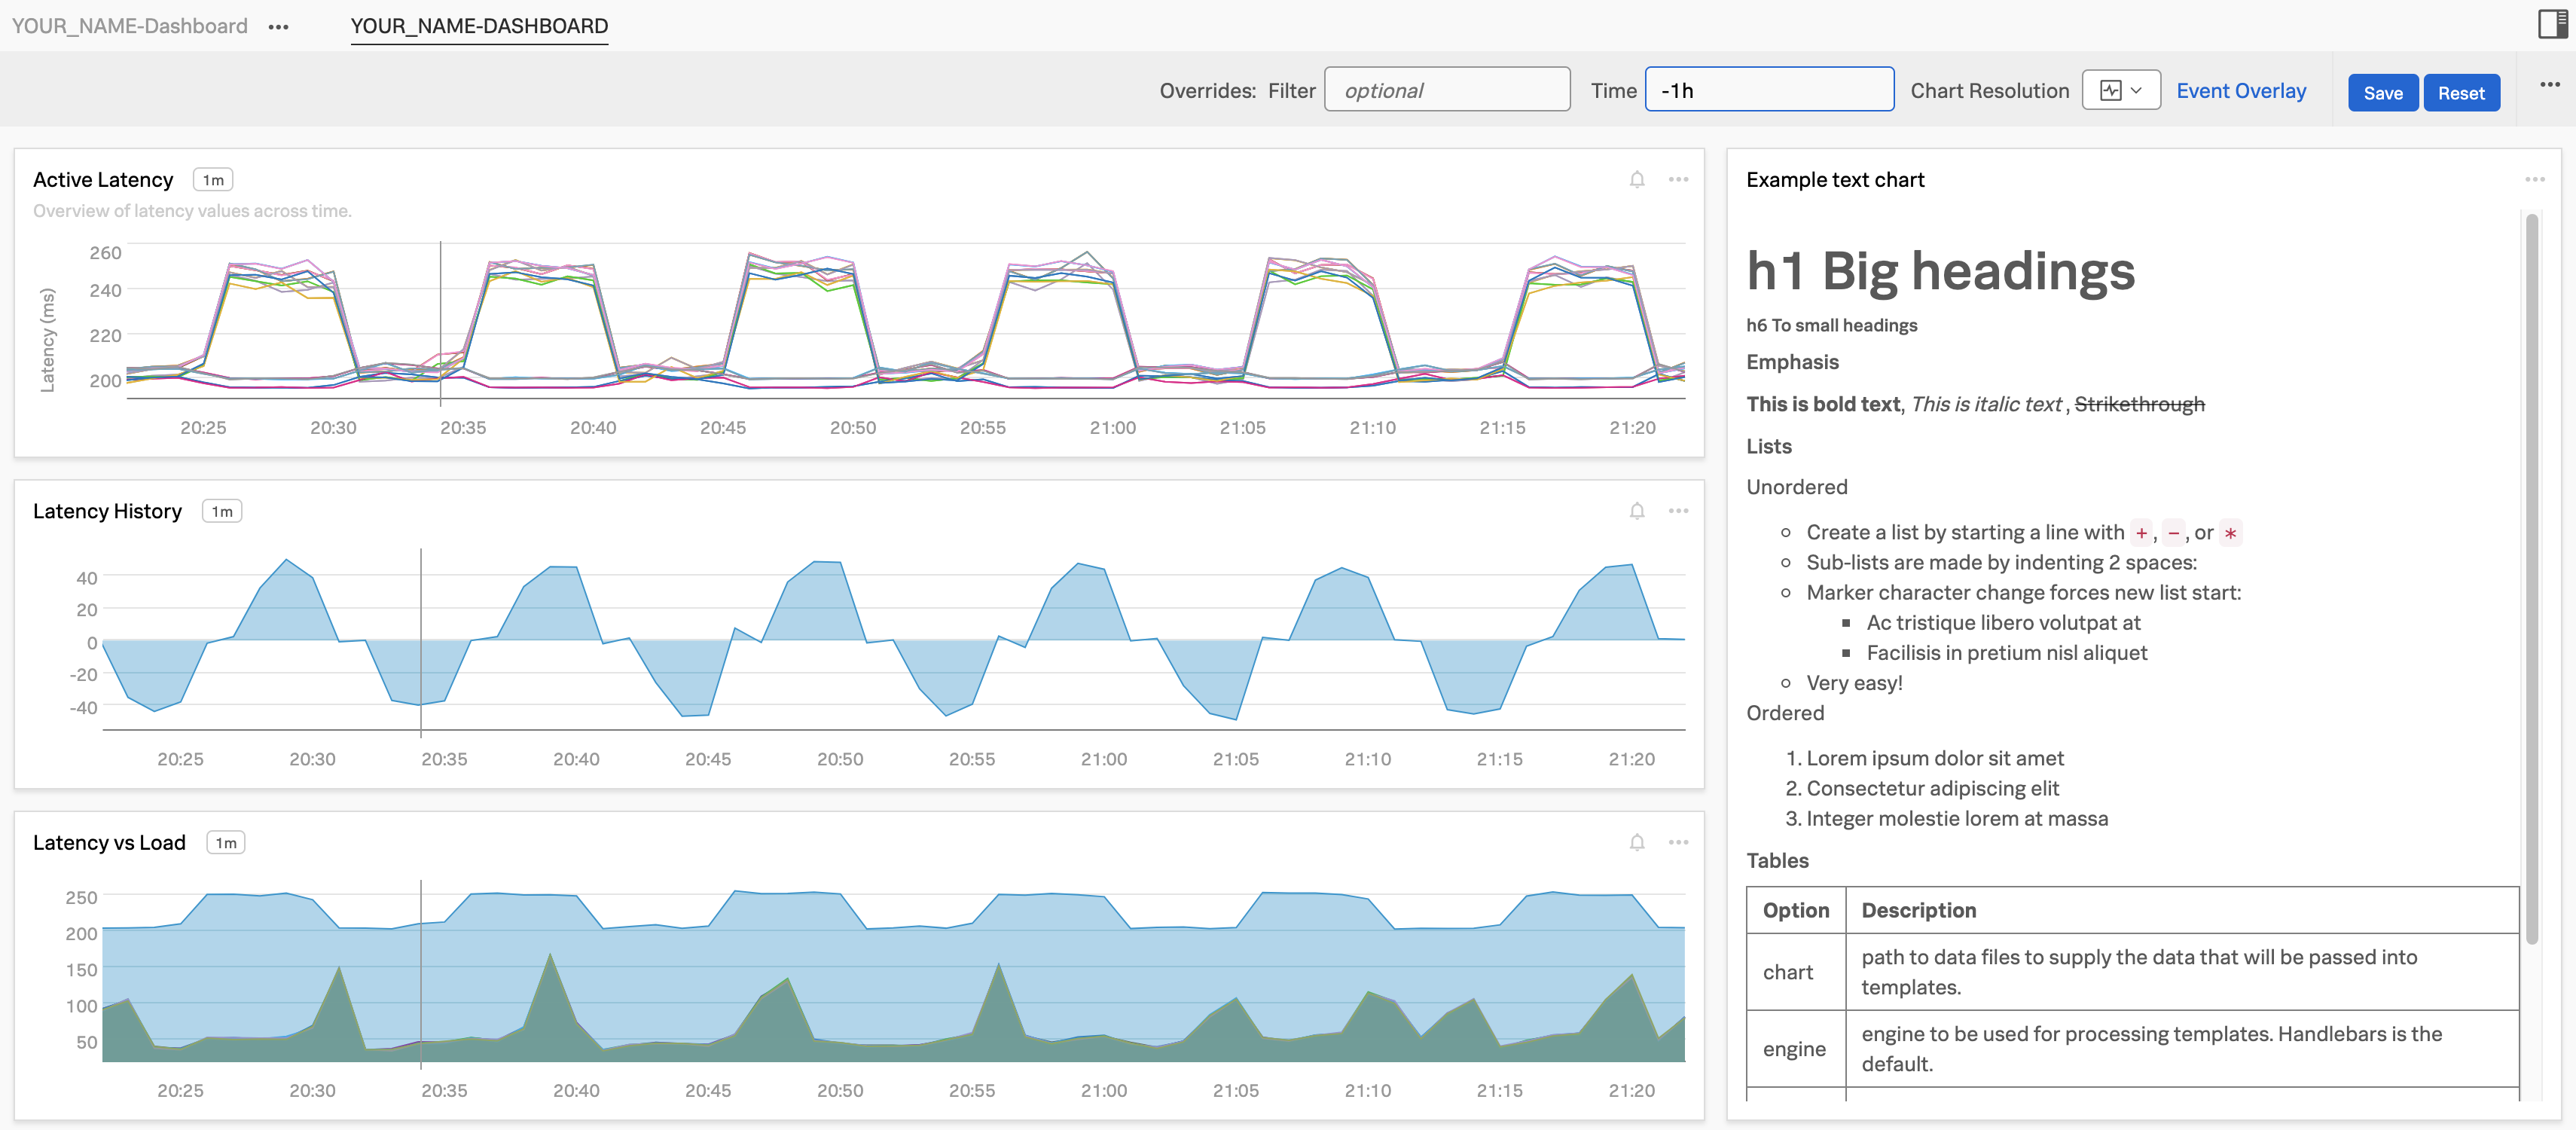
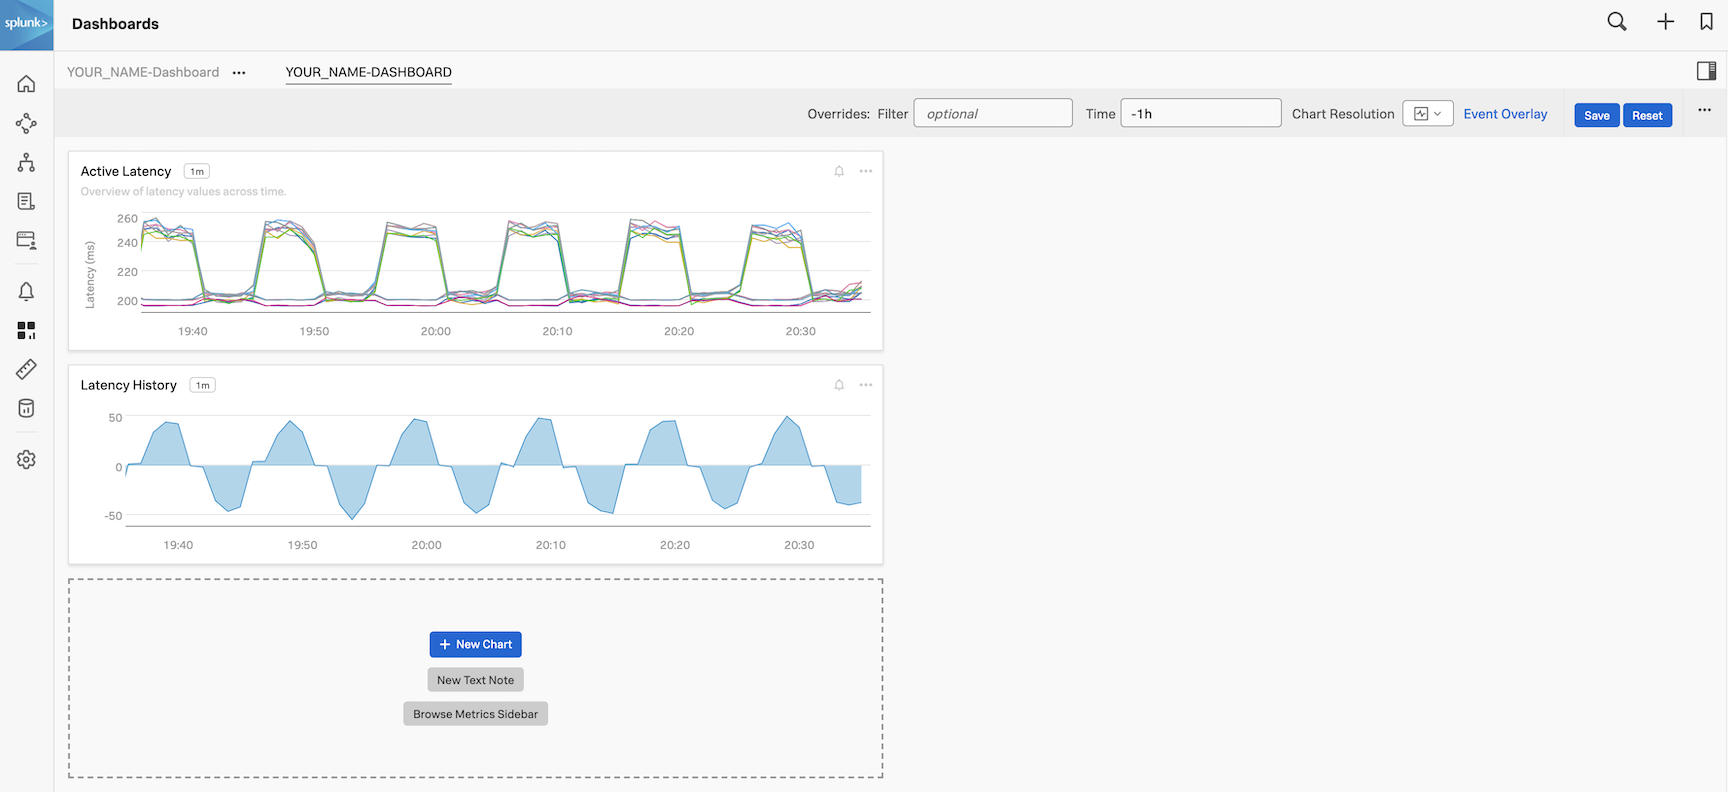
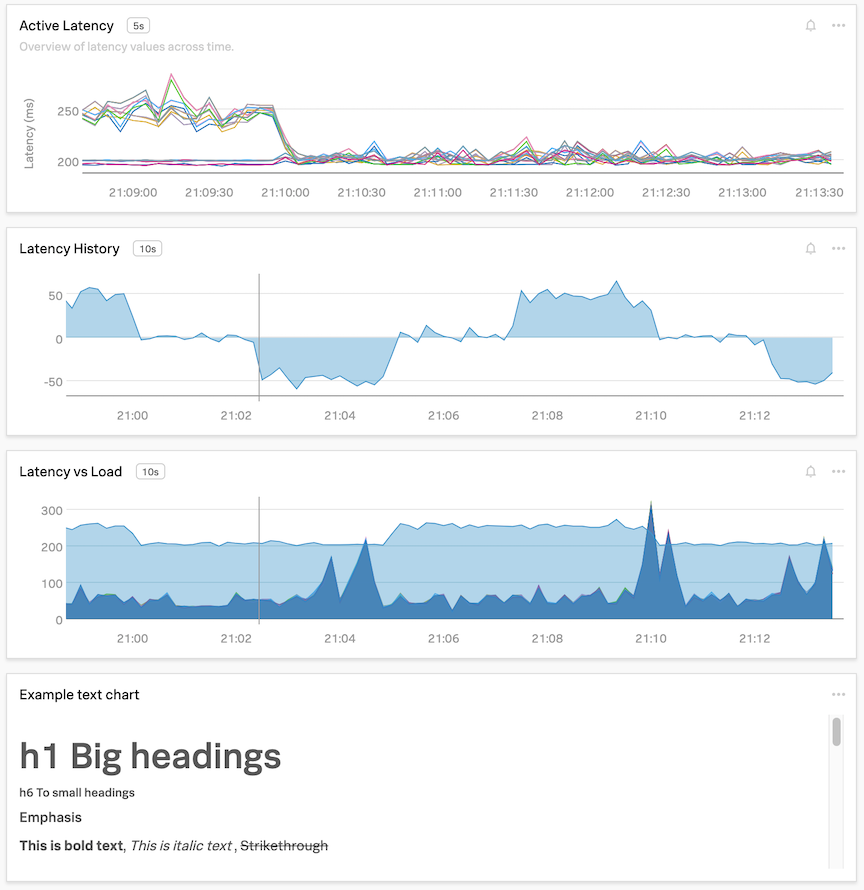
Once you have a specific view in Log Observer, it is very useful to be able to use that view in a dashboard, to help in the future with reducing the time to detect or resolve issues. As part of the workshop, we will create an example custom dashboard that will use these charts.
Let’s look at creating a Log Timeline chart. The Log Timeline chart is used for visualizing log messages over time. It is a great way to see the frequency of log messages and to identify patterns. It is also a great way to see the distribution of log messages across your environment. These charts can be saved to a custom dashboard.
Exercise
First, we will reduce the amount of information to only the columns we are interested in:
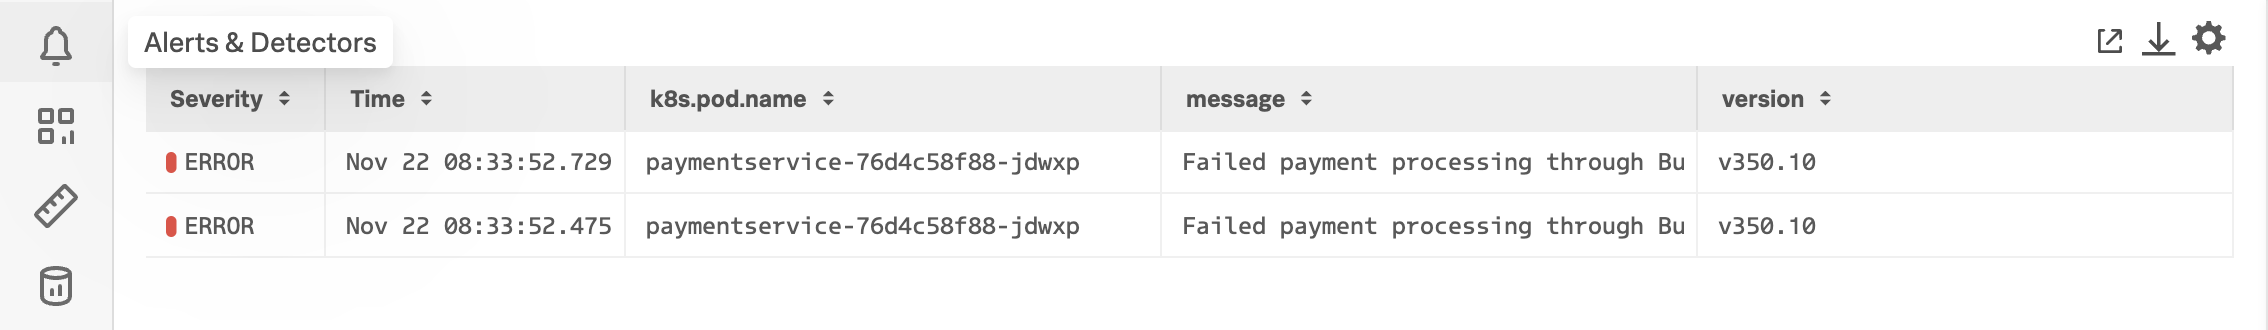
Click on the Configure Table icon above the Logs table to open the Table Settings, untick _raw and ensure the following fields are selected k8s.pod.name, message and version.
Remove the fixed time from the time picker, and set it to the Last 15 minutes.
To make this work for all traces, remove the trace_id from the filter and add the fields sf_service=paymentservice and sf_environment=[WORKSHOPNAME].
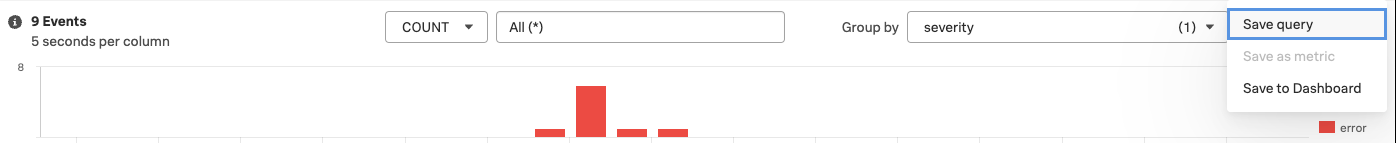
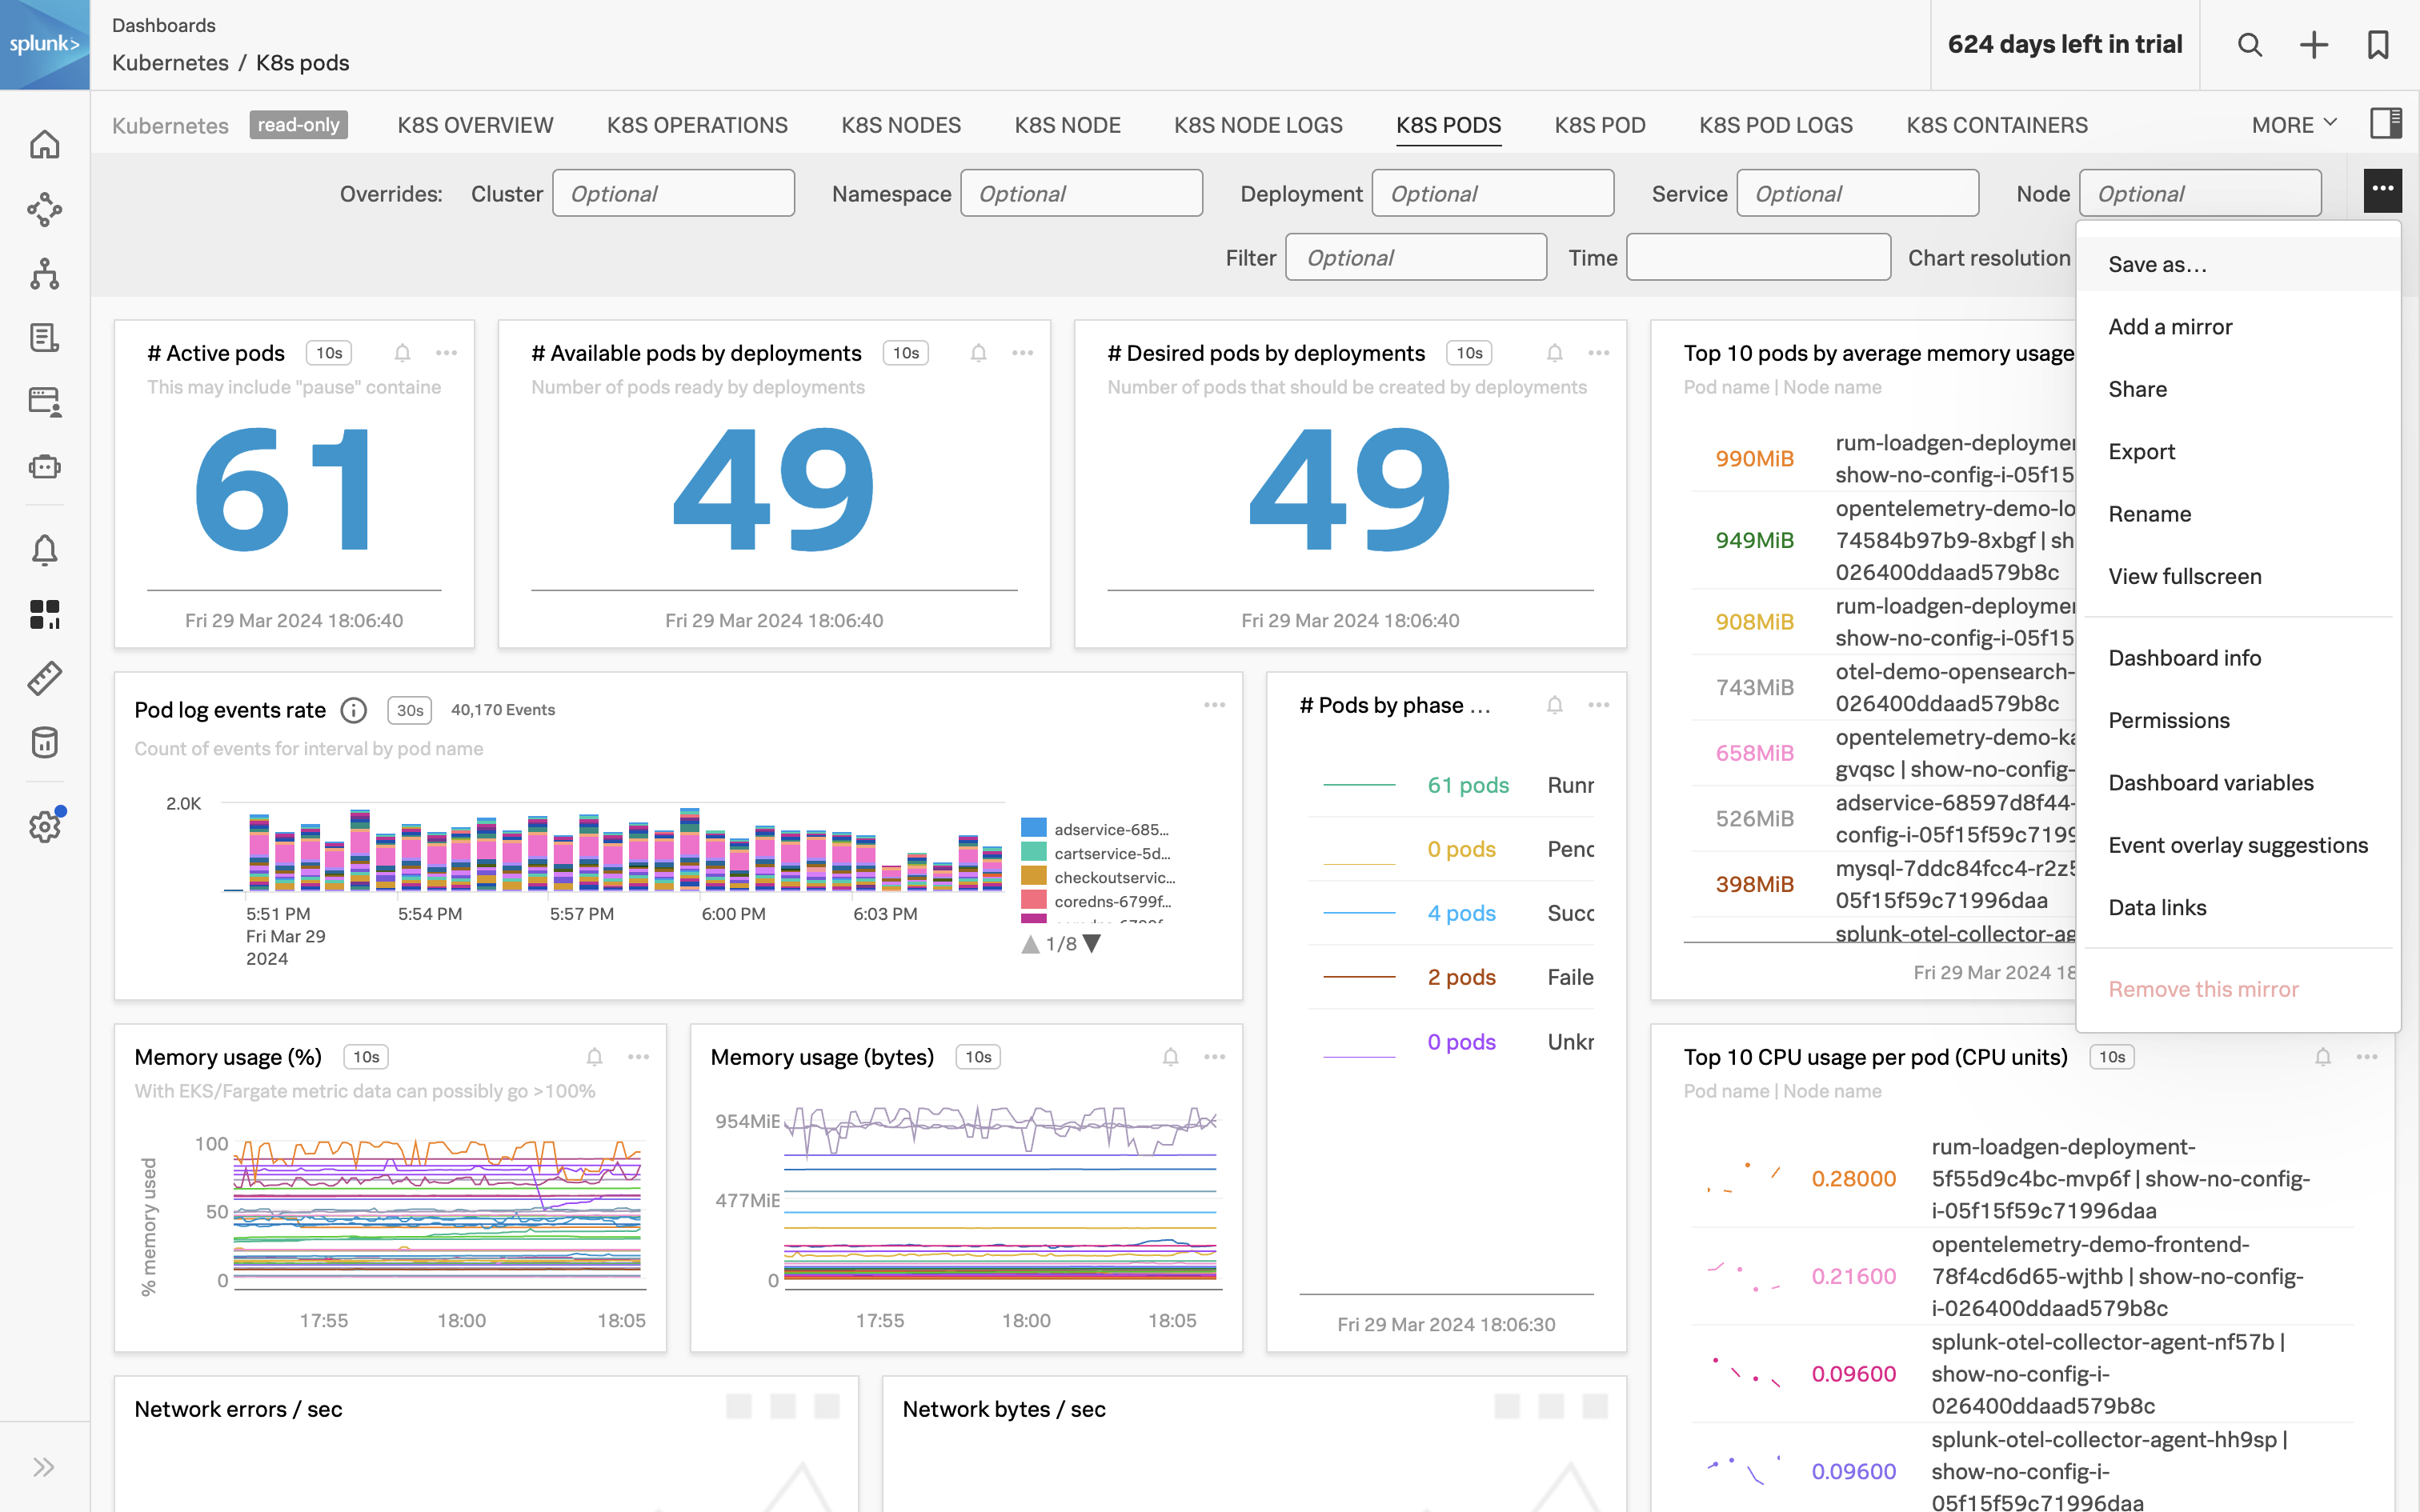
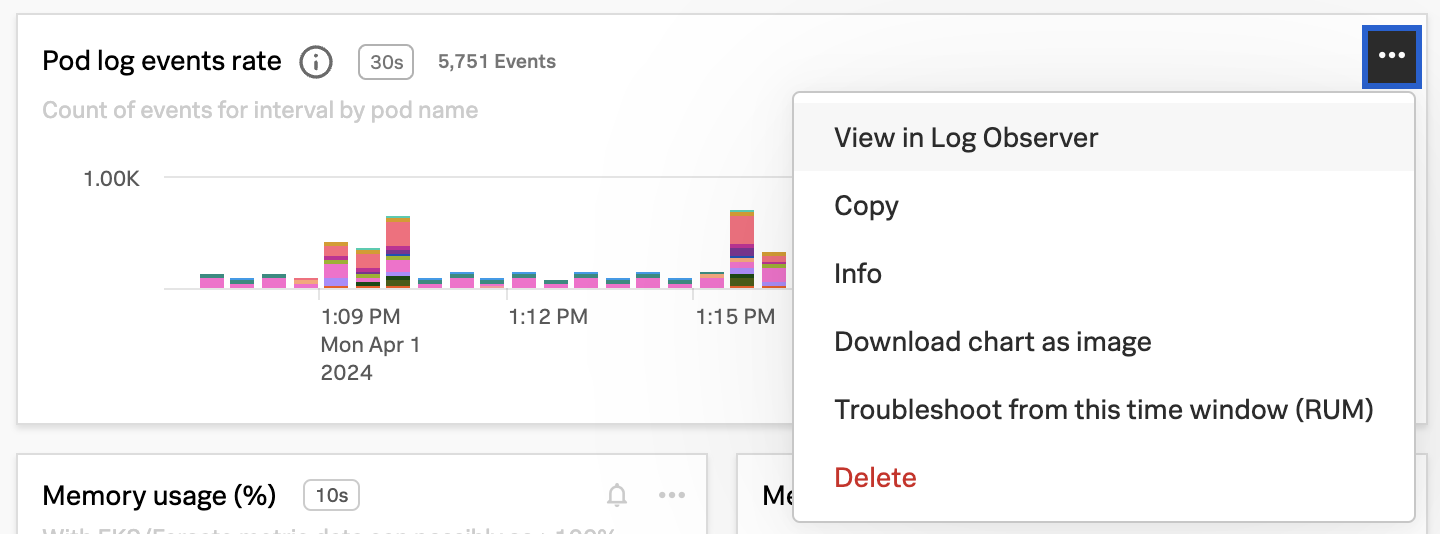
Click Save and select Save to Dashboard.
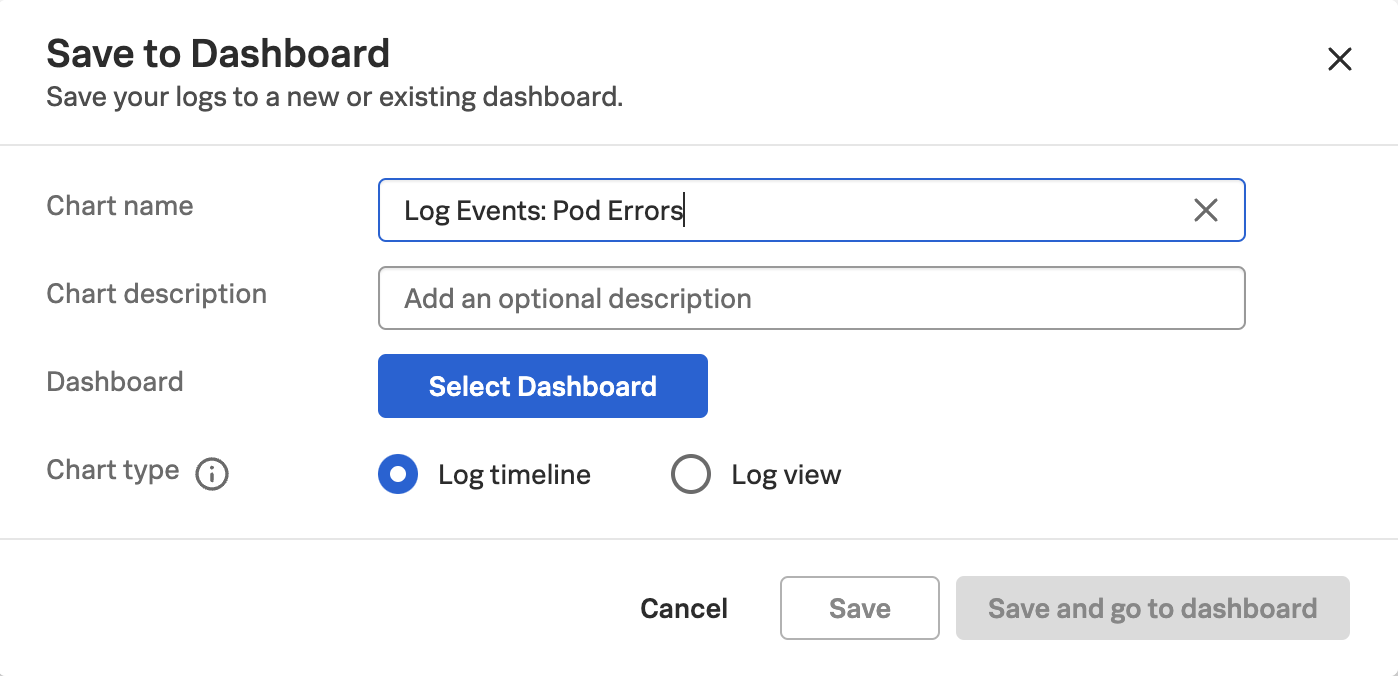
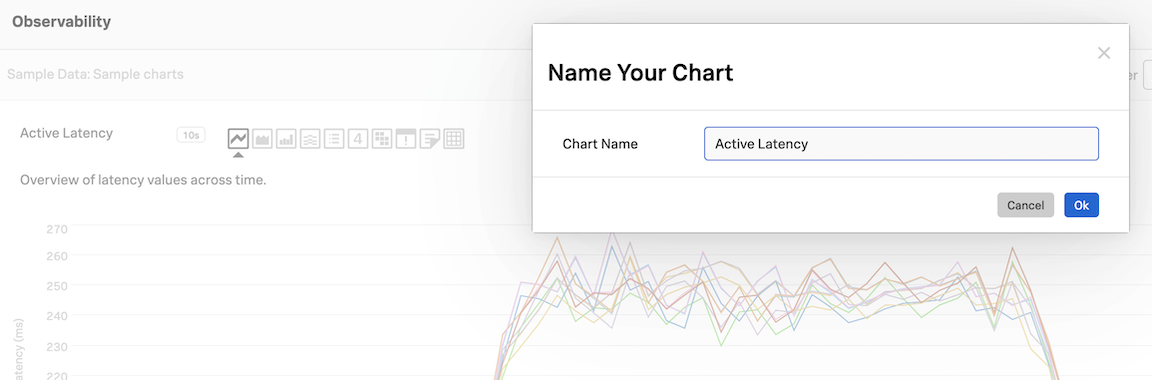
In the chart creation dialog box that appears, for the Chart name use Log Timeline.
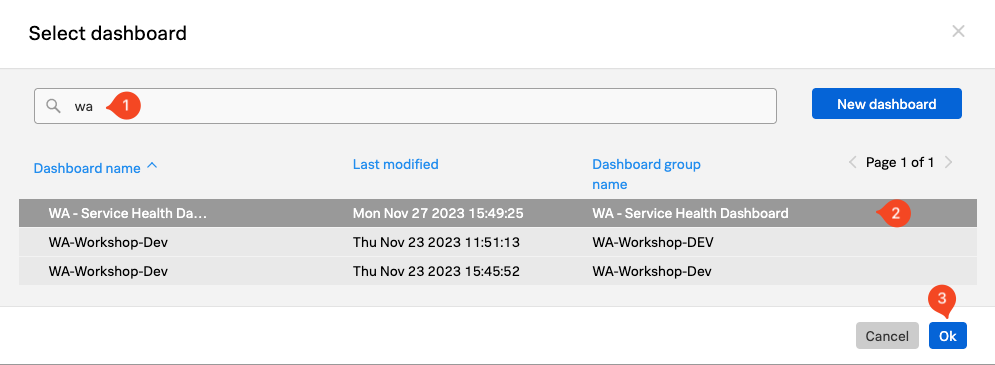
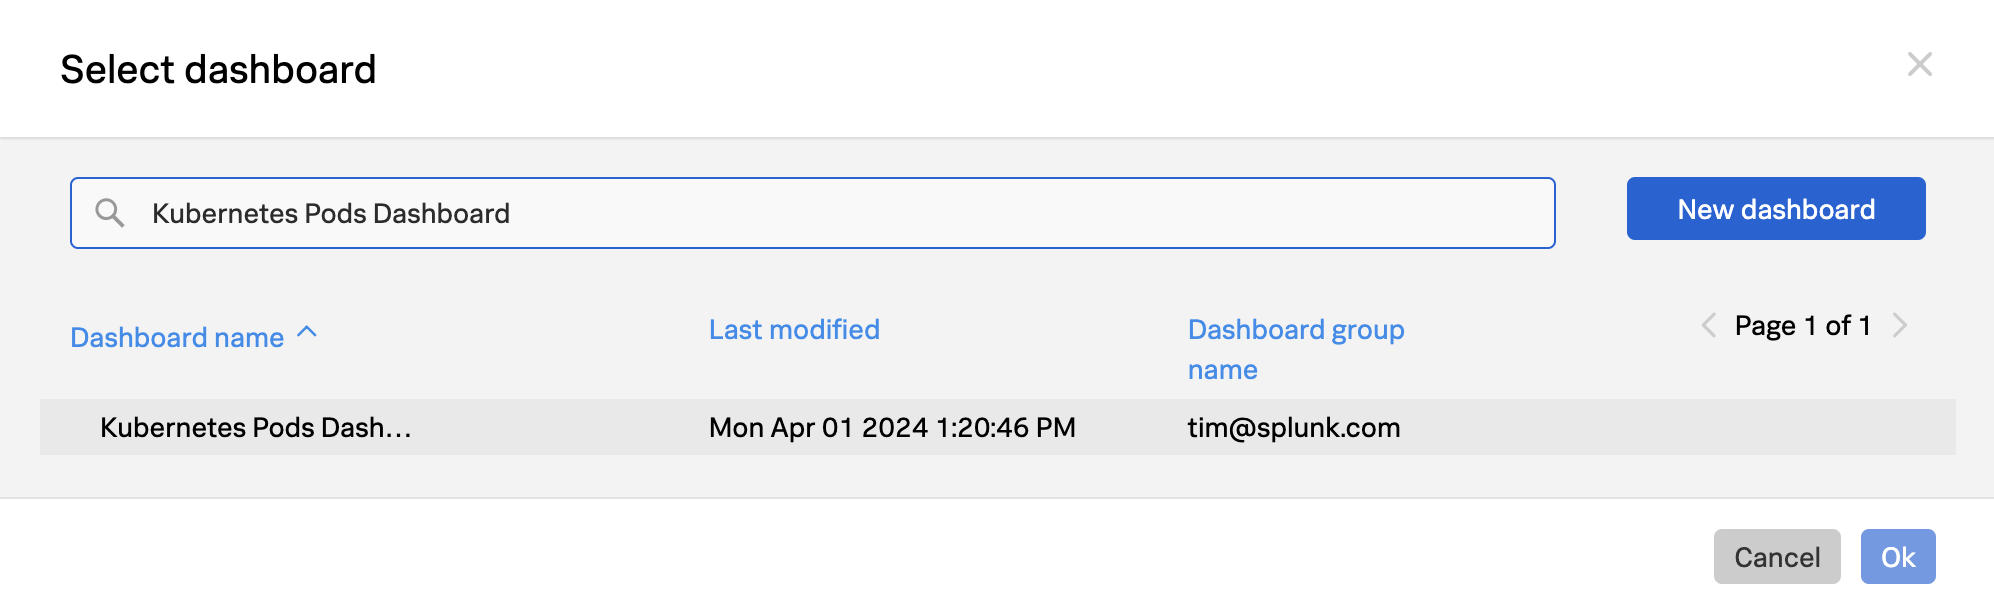
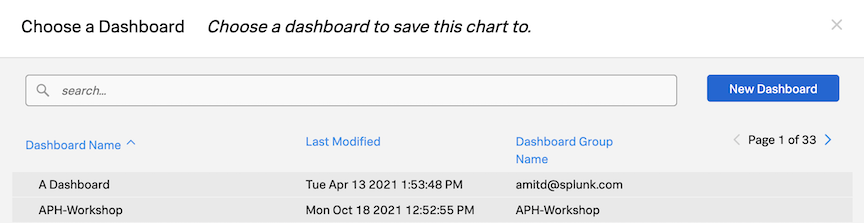
Click Select Dashboard and then click New dashboard in the Dashboard Selection dialog box.
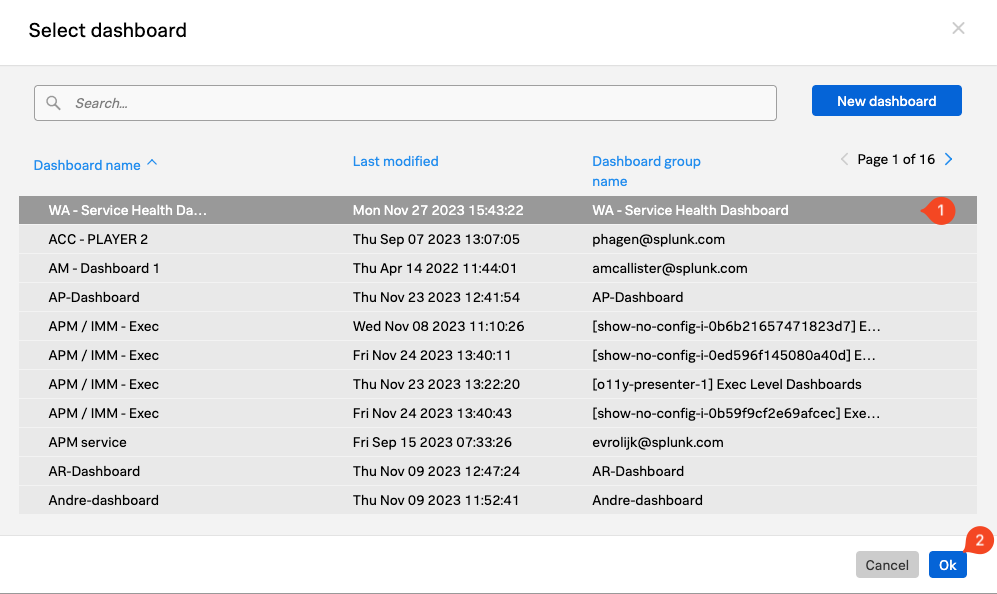
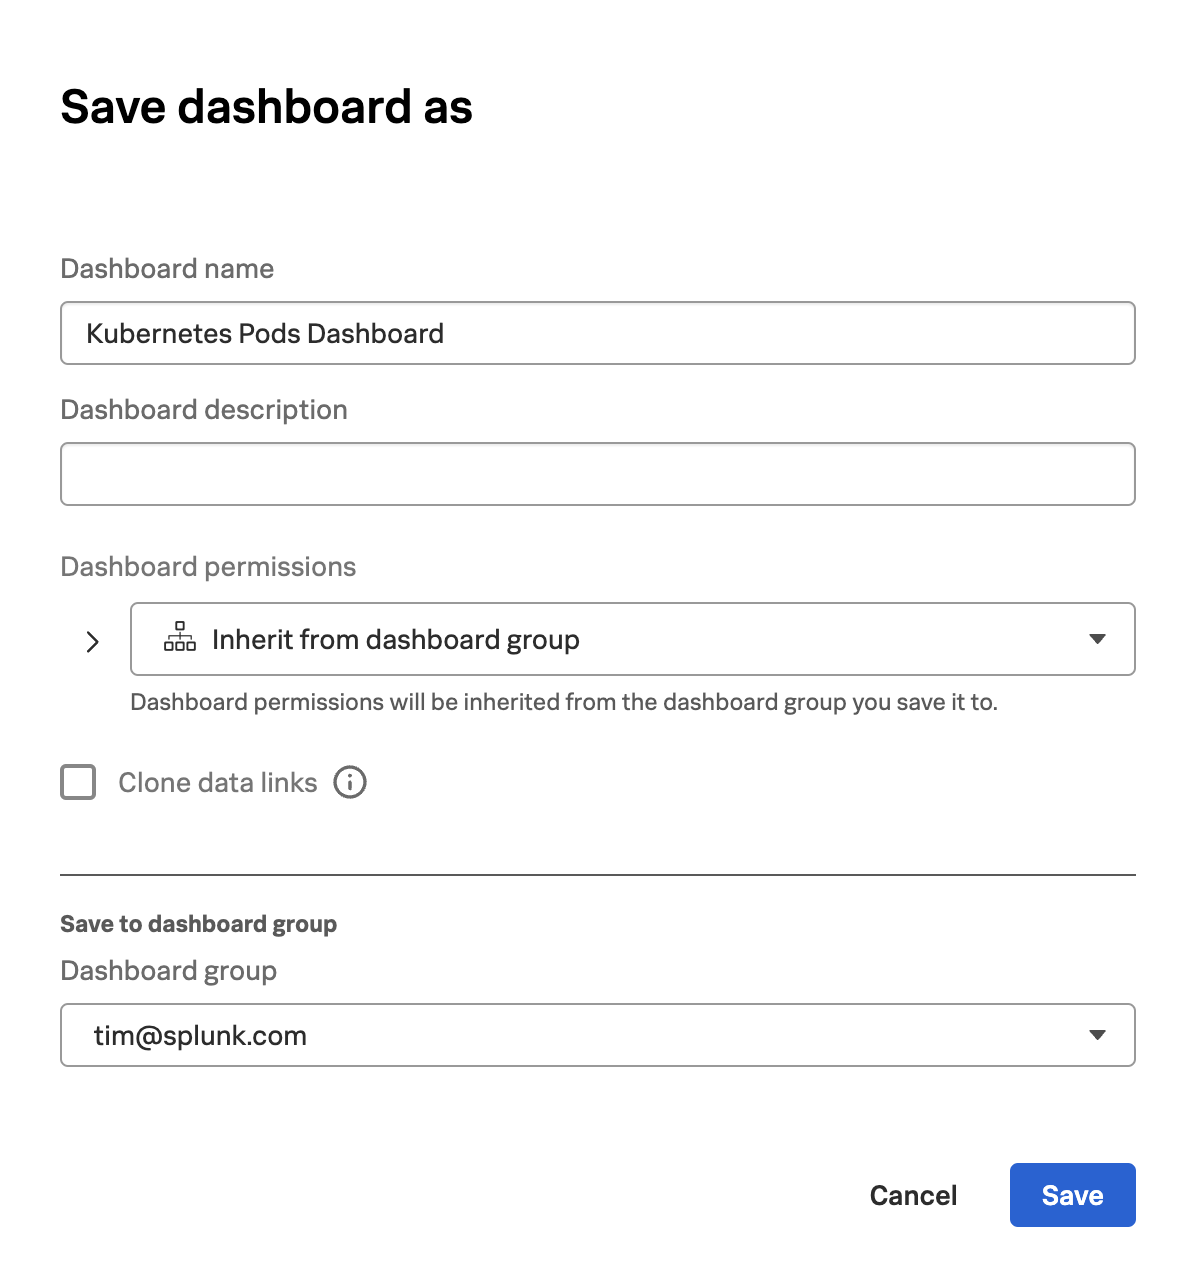
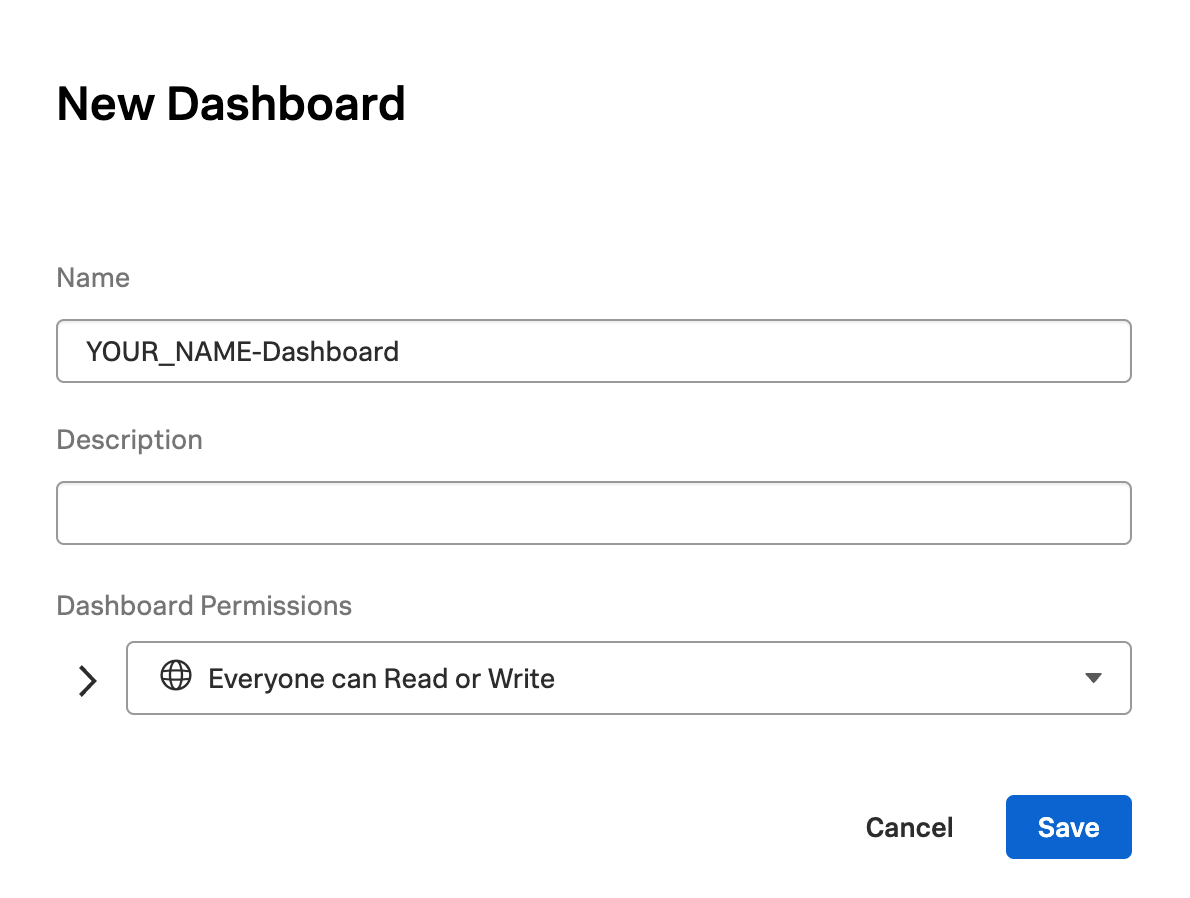
In the New dashboard dialog box, enter a name for the new dashboard (no need to enter a description). Use the following format: Initials - Service Health Dashboard and click Save
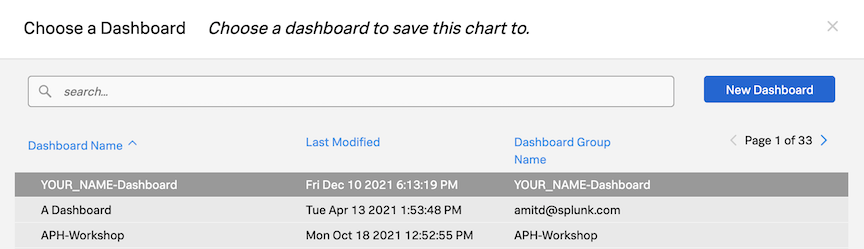
Ensure the new dashboard is highlighted in the list (1) and click OK (2).
Ensure that Log Timeline is selected as the Chart Type.
Click the Save button (do not click Save and goto dashboard at this time).
Next, we will create a Log View chart.
4. Log View Chart
The next chart type that can be used with logs is the Log View chart type. This chart will allow us to see log messages based on predefined filters.
As with the previous Log Timeline chart, we will add a version of this chart to our Customer Health Service Dashboard:
Exercise
After the previous exercise make sure you are still in Log Observer.
The filters should be the same as the previous exercise, with the time picker set to the Last 15 minutes and filtering on severity=error, sf_service=paymentservice and sf_environment=[WORKSHOPNAME].
Make sure we have the header with just the fields we wanted.
Click again on Save and then Save to Dashboard.
This will again provide you with the Chart creation dialog.
For the Chart name use Log View.
This time Click Select Dashboard and search for the Dashboard you created in the previous exercise. You can start by typing your initials in the search box (1).
Click on your dashboard name to highlight it (2) and click OK (3).
This will return you to the create chart dialog.
Ensure Log View is selected as the Chart Type.
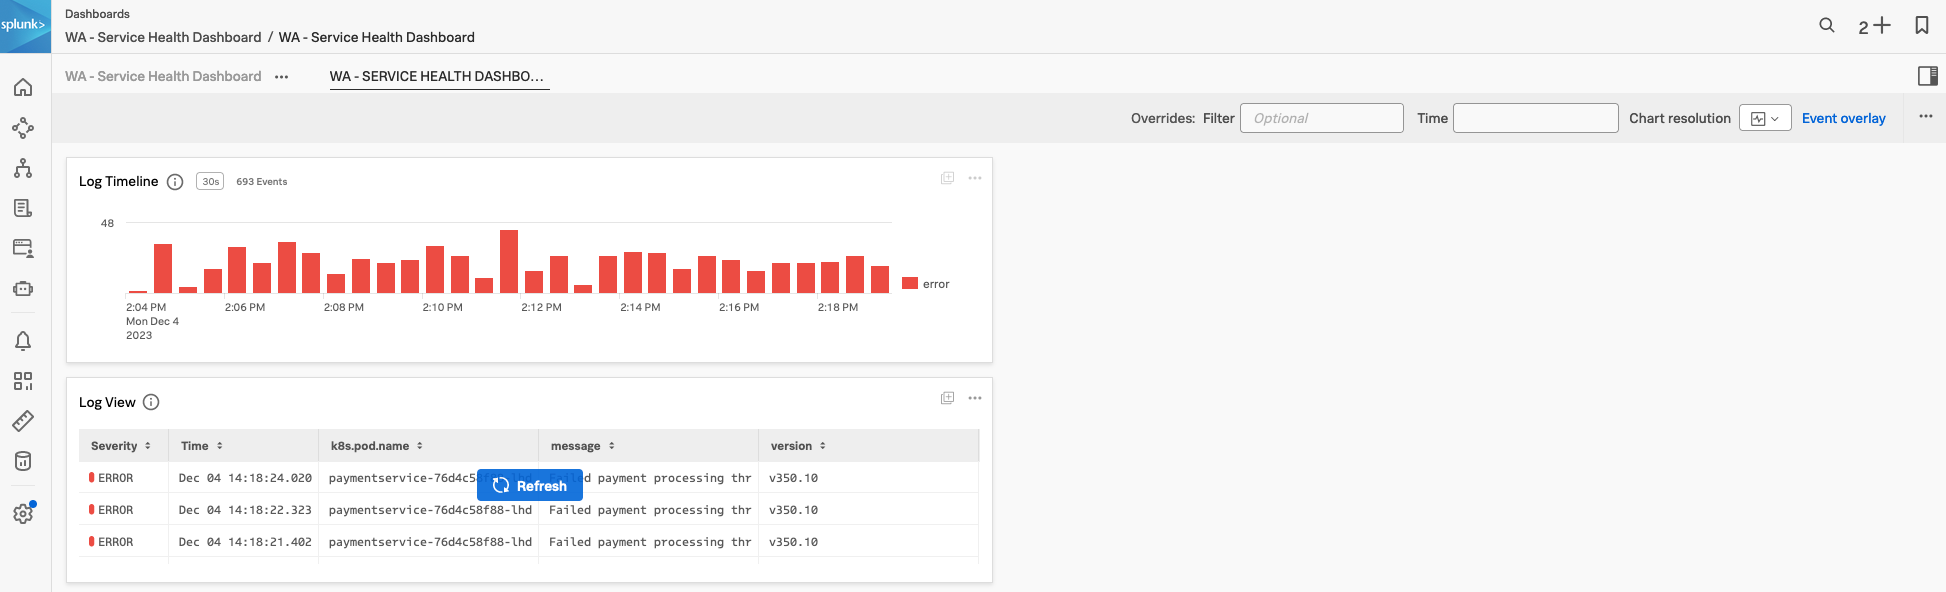
To see your dashboard click Save and go to dashboard.
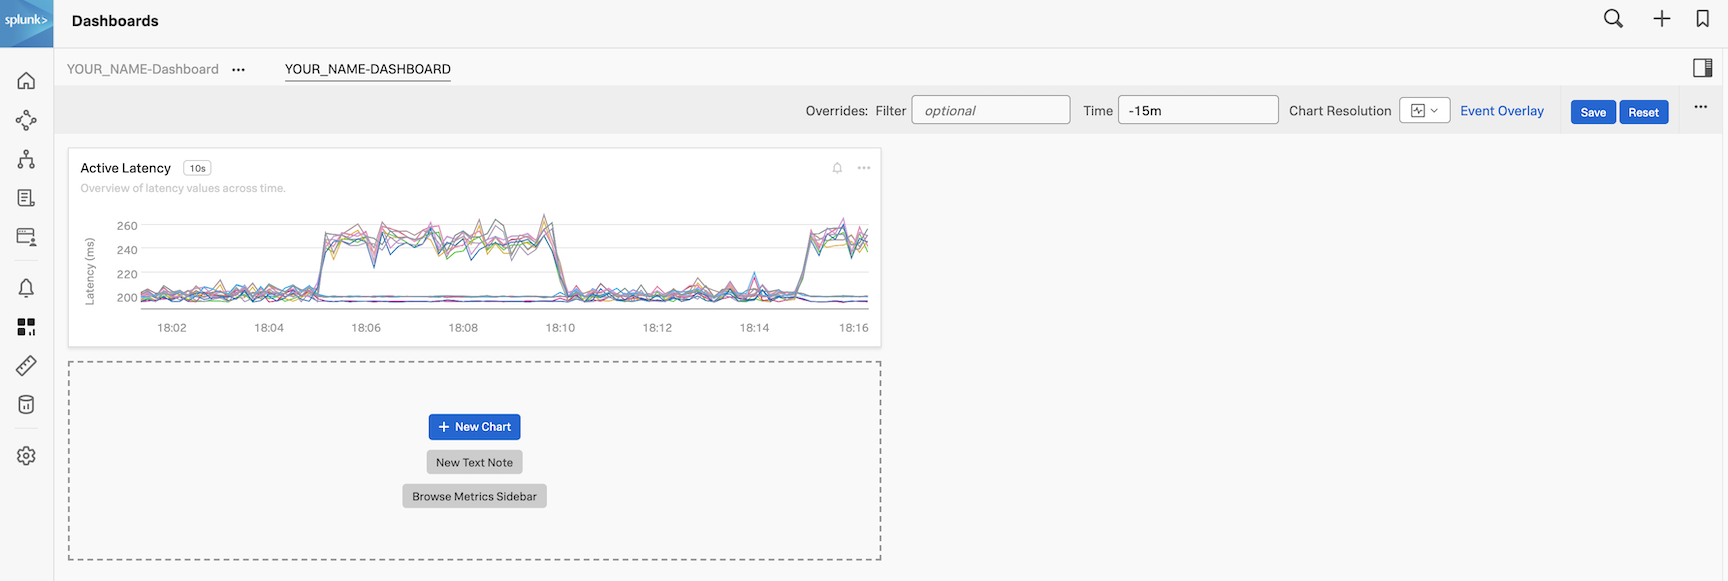
The result should be similar to the dashboard below:
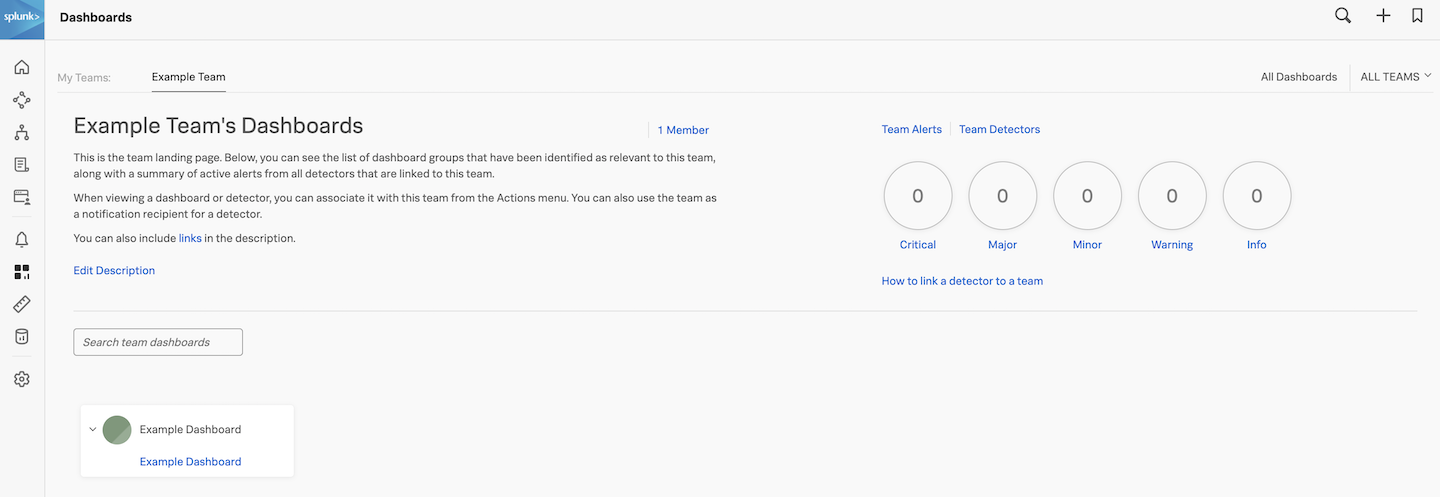
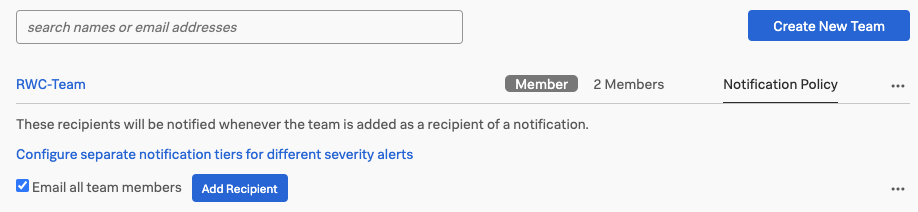
As the last step in this exercise, let us add your dashboard to your workshop team page, this will make it easy to find later in the workshop.
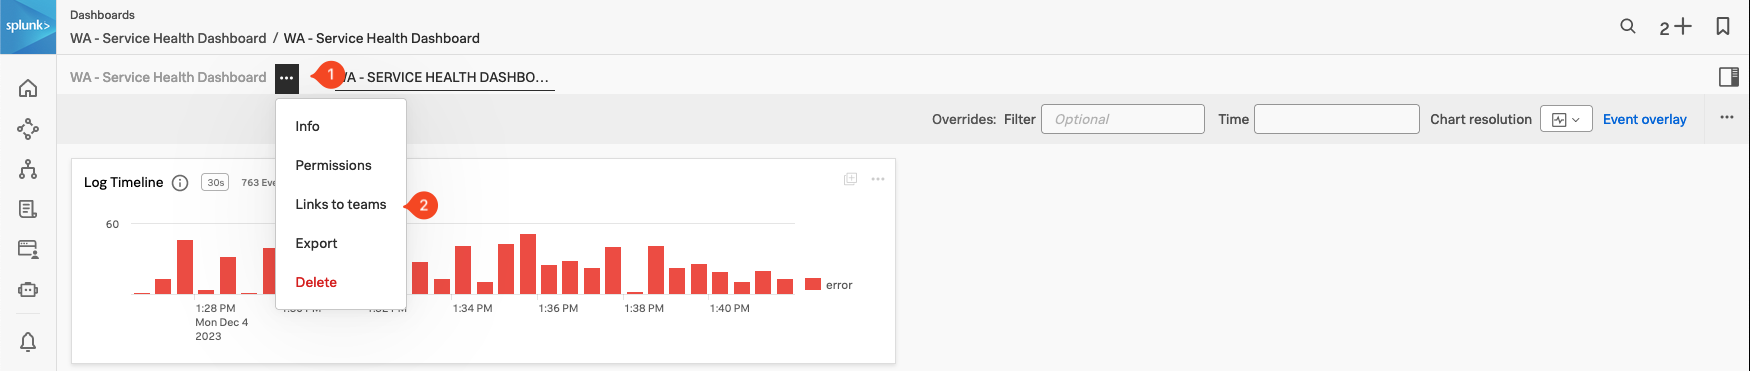
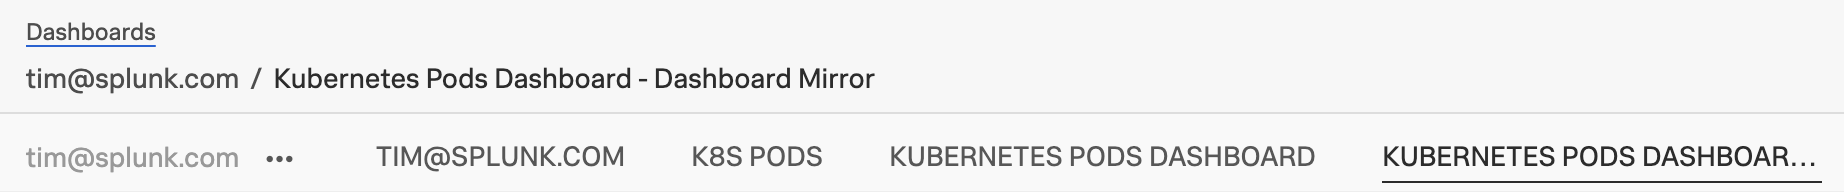
At the top of the page, click on the … to the left of your dashboard name (1).
Select Link to teams from the drop-down (2).
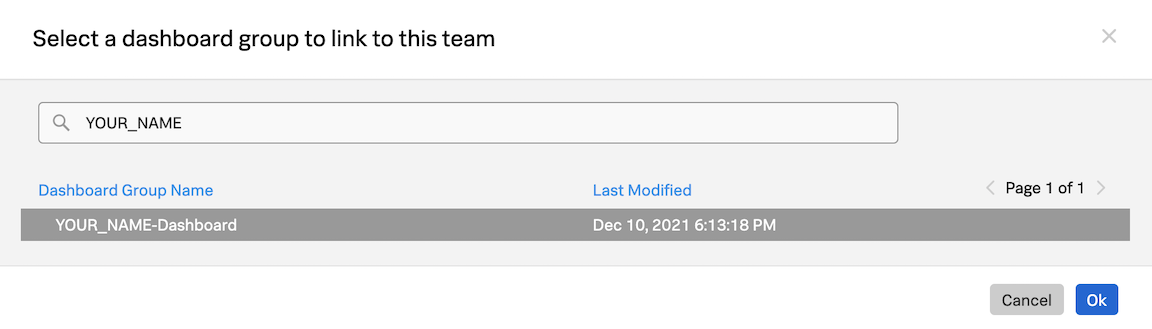
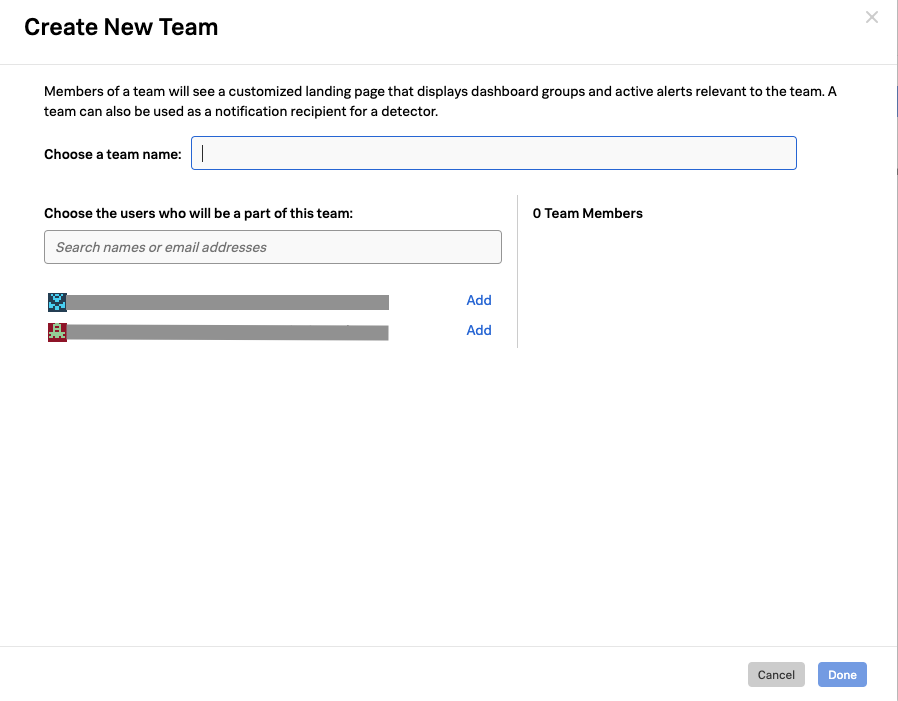
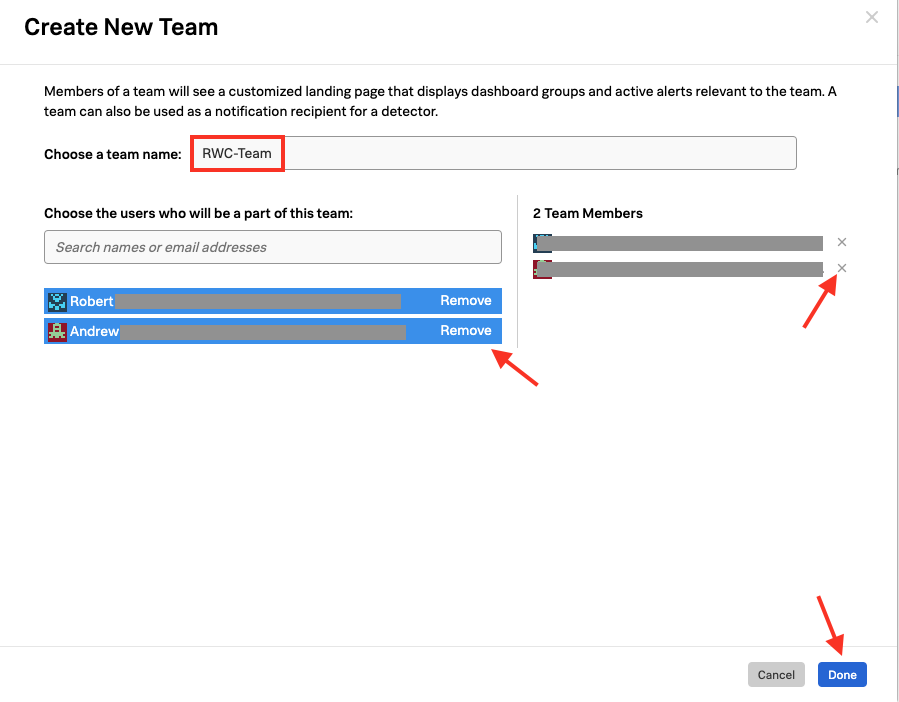
In the following Link to teams dialog box, find the Workshop team that your instructor will have provided for you and click Done.
In the next session, we will look at Splunk Synthetics and see how we can automate the testing of web-based applications.
Splunk Synthetics
15 minutes
Persona
Putting your SRE hat back on, you have been asked to set up monitoring for the Online Boutique. You need to ensure that the application is available and performing well 24 hours a day, 7 days a week.
Wouldn’t it be great if we could have 24/7 monitoring of our application, and be alerted when there is a problem? This is where Synthetics comes in. We will show you a simple test that runs every 1 minute and checks the performance and availability of a typical user journey through the Online Boutique.
Subsections of Splunk Synthetics
1. Synthetics Dashboard
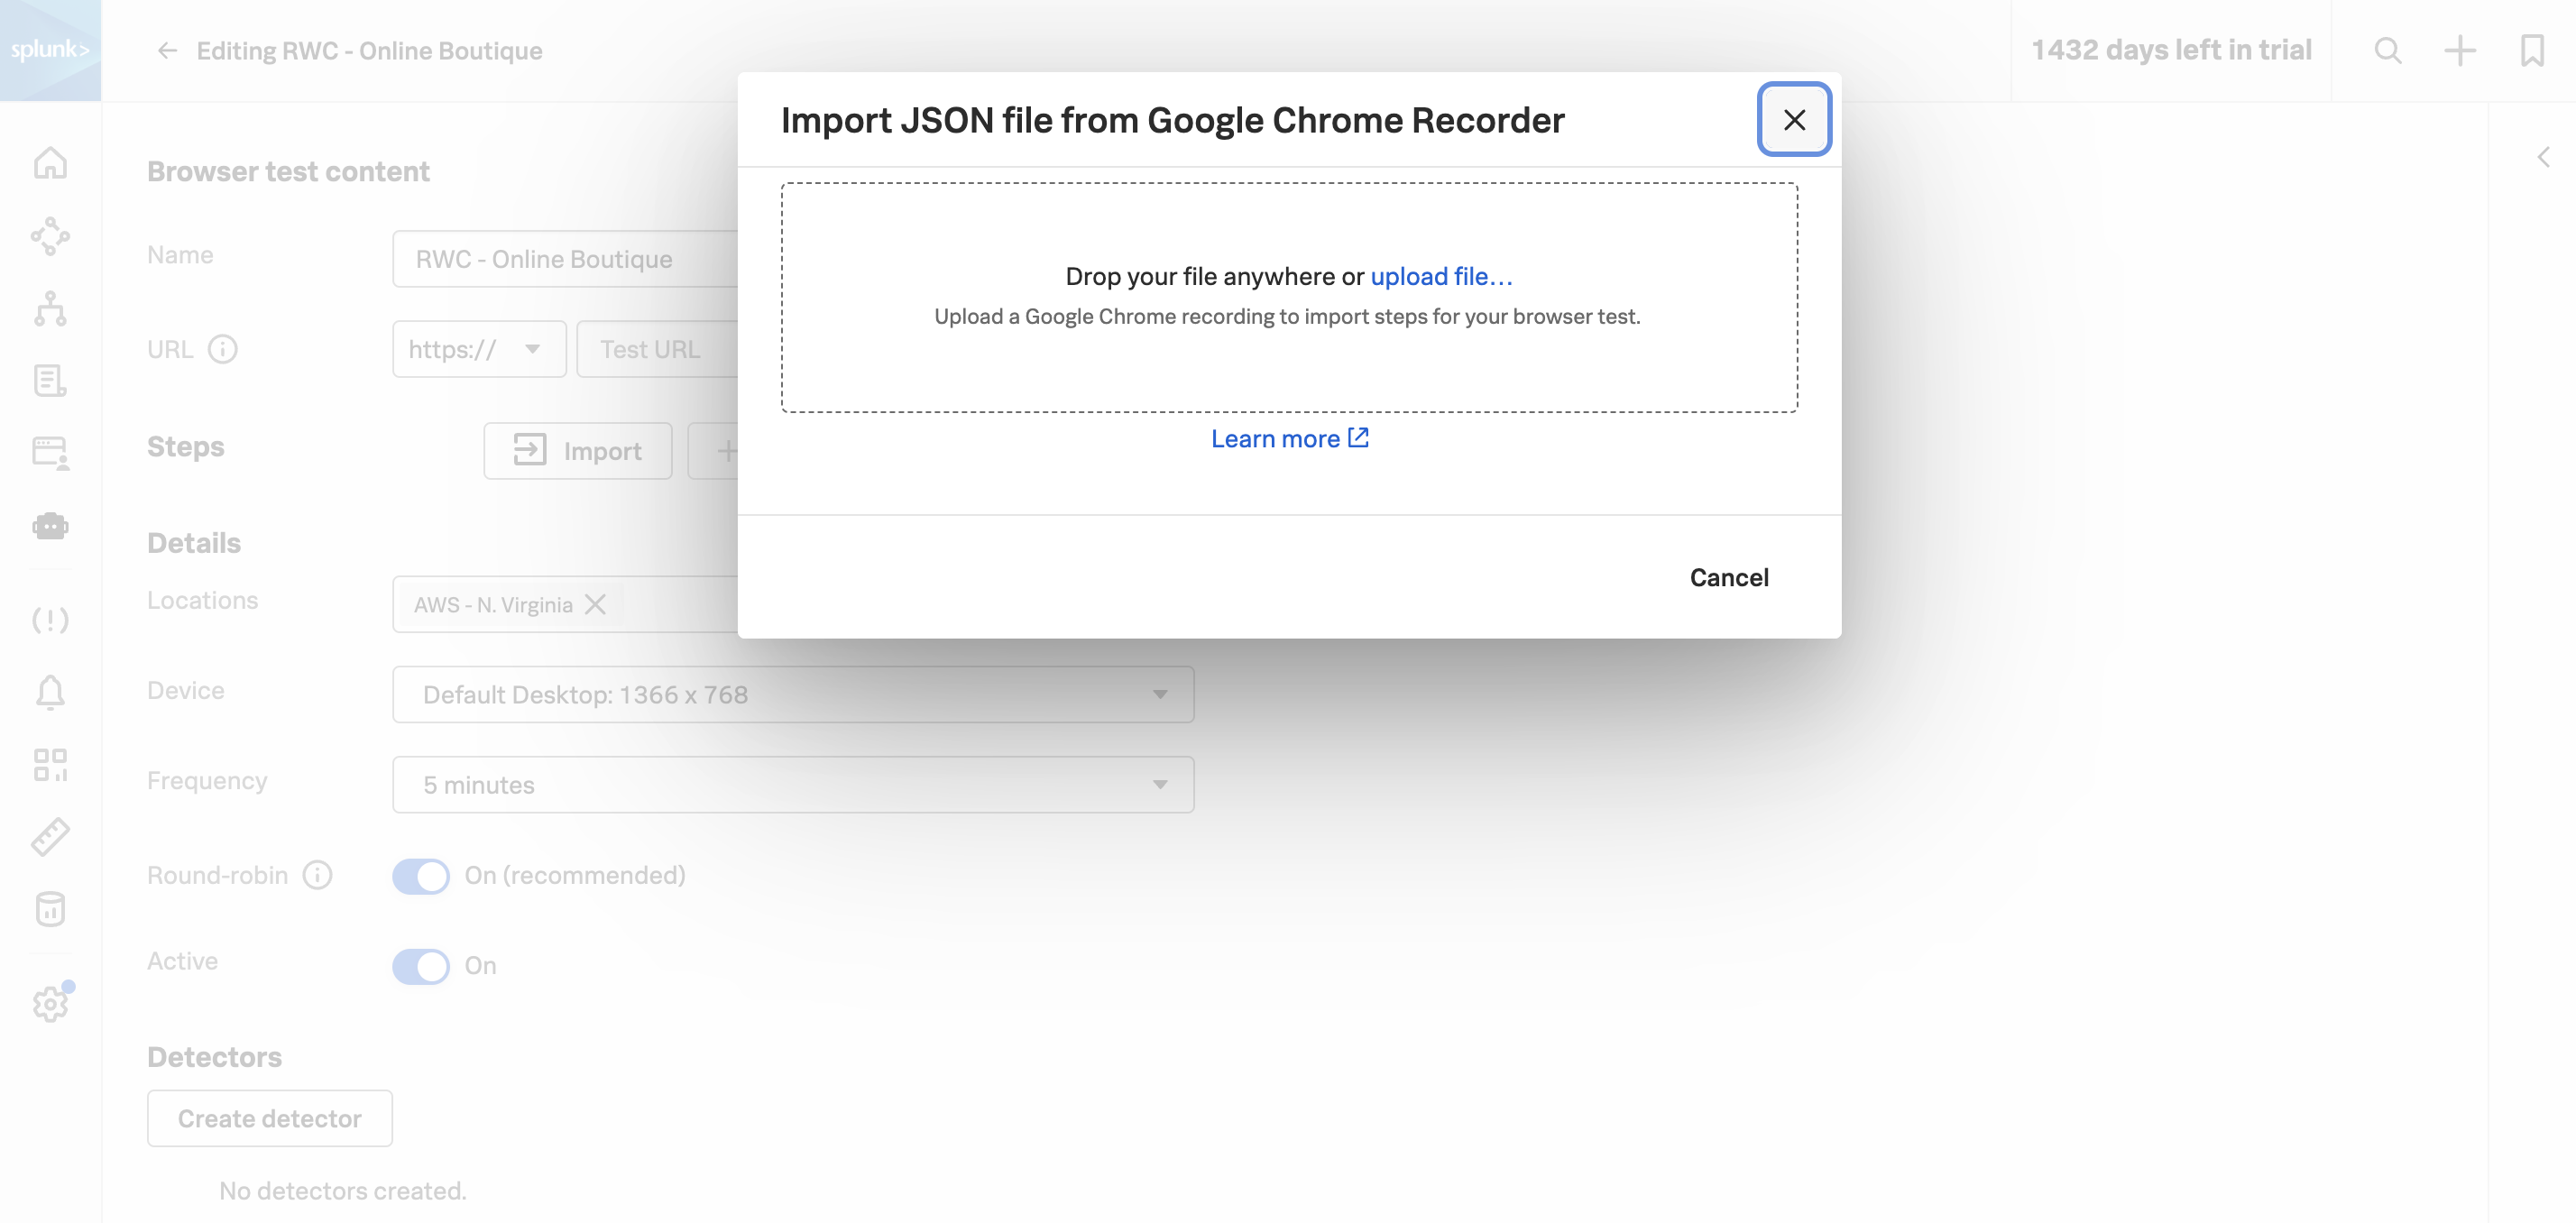
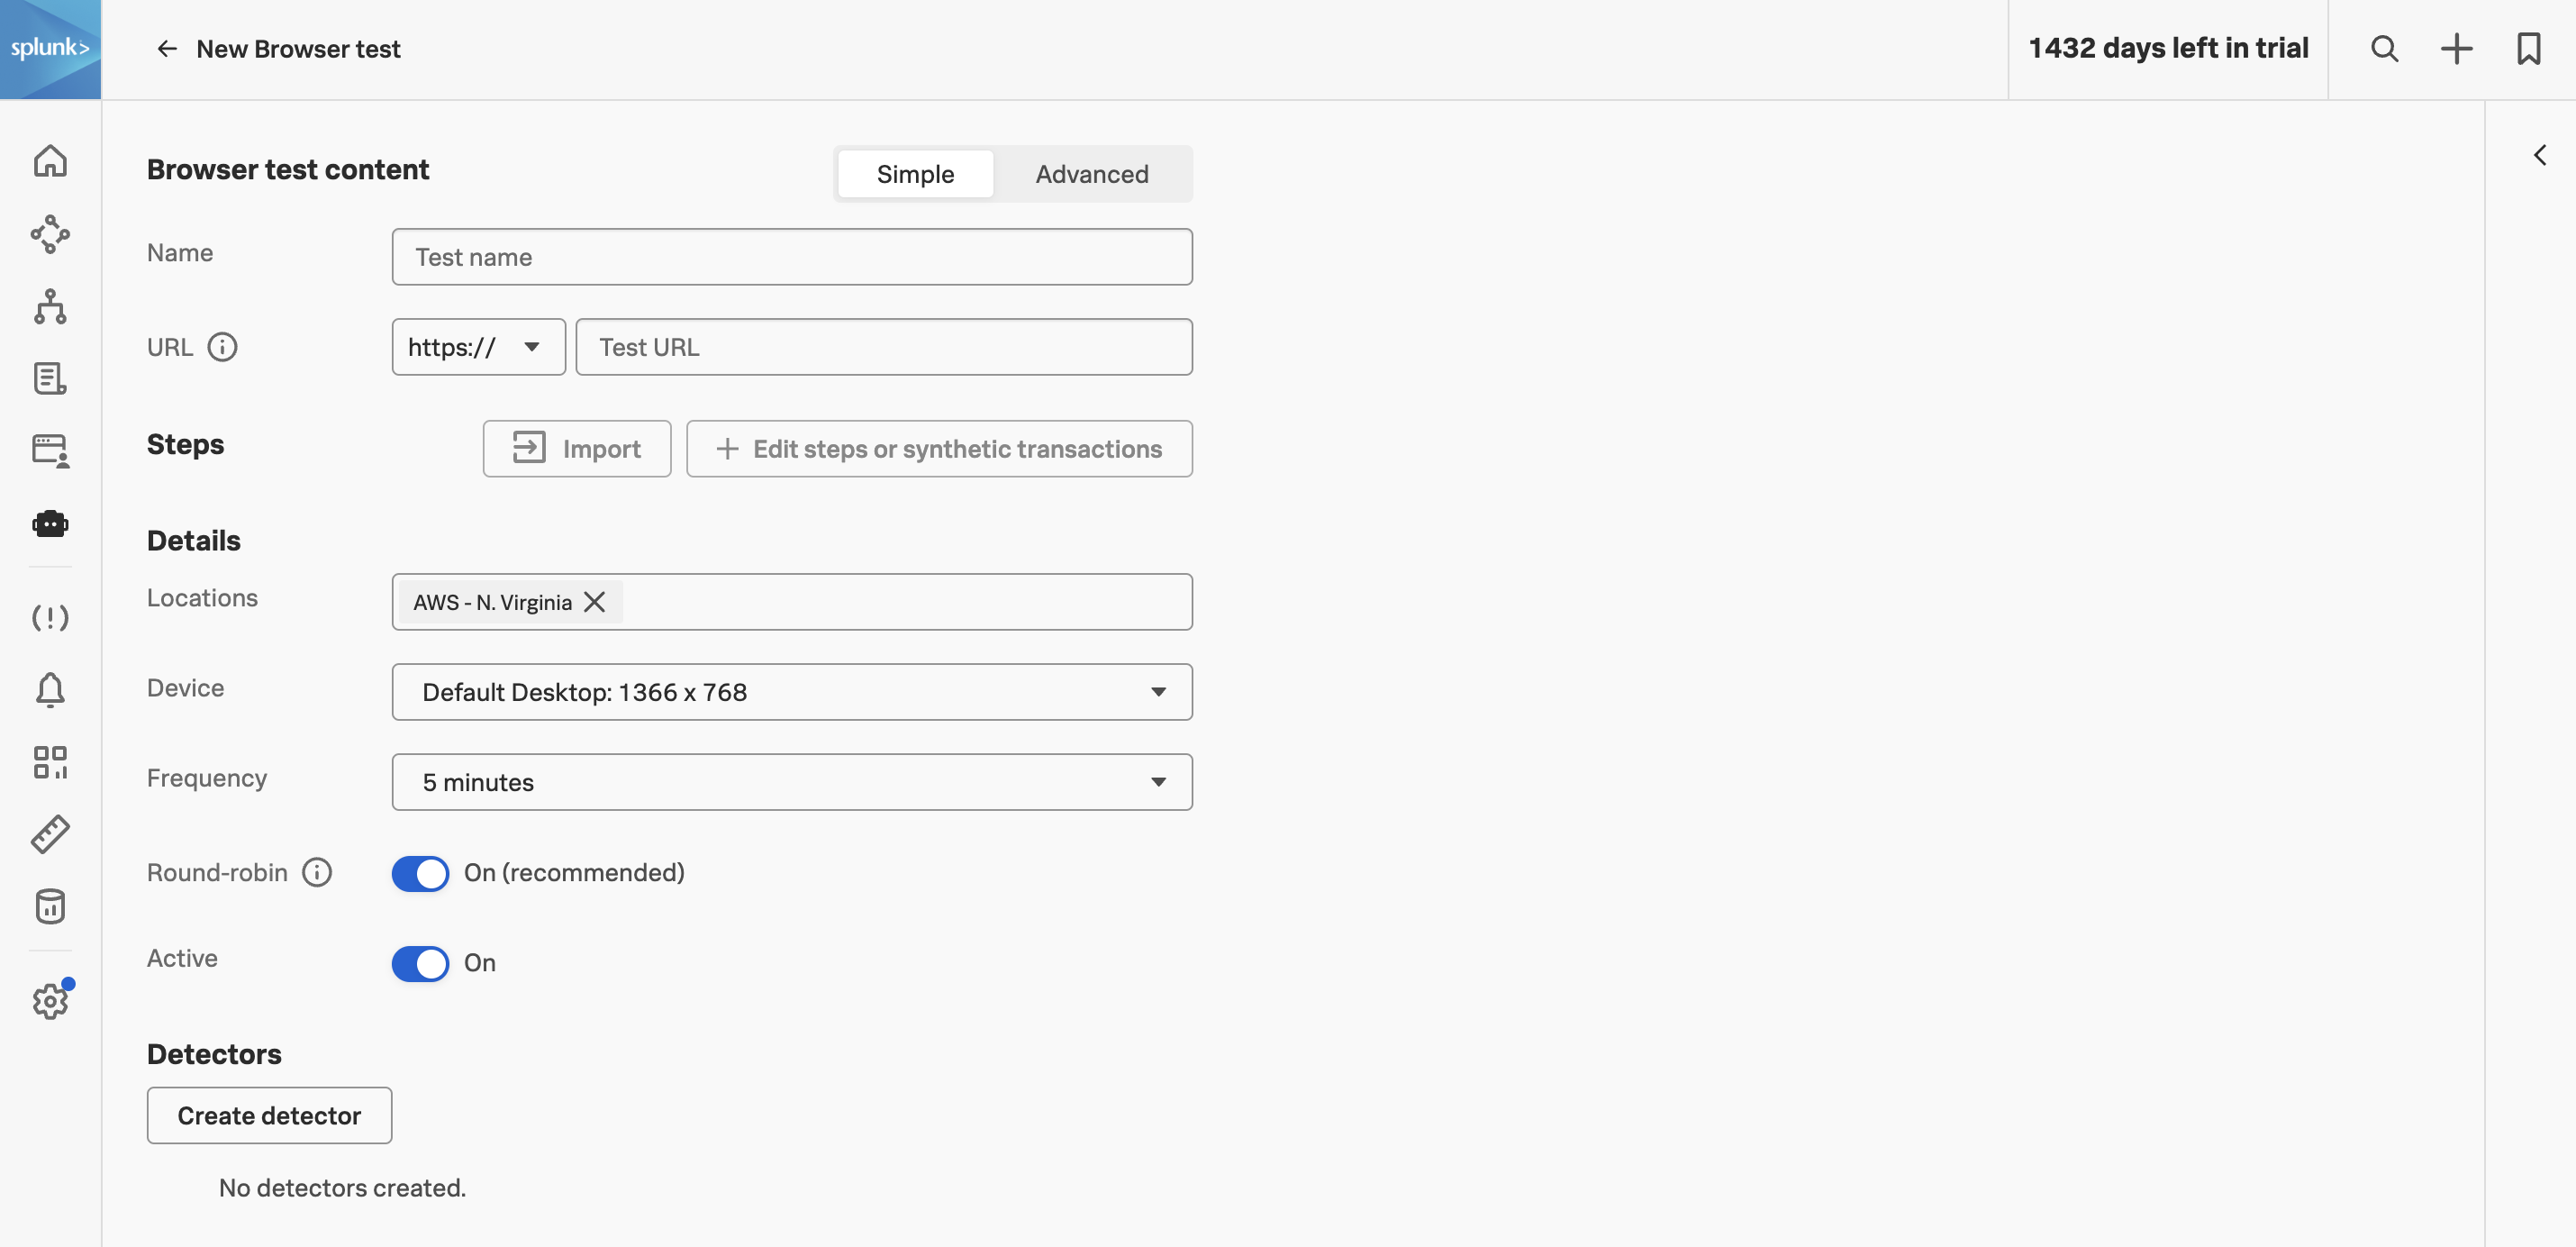
In Splunk Observability Cloud from the main menu, click on Synthetics. Click on All or Browser tests to see the list of active tests.
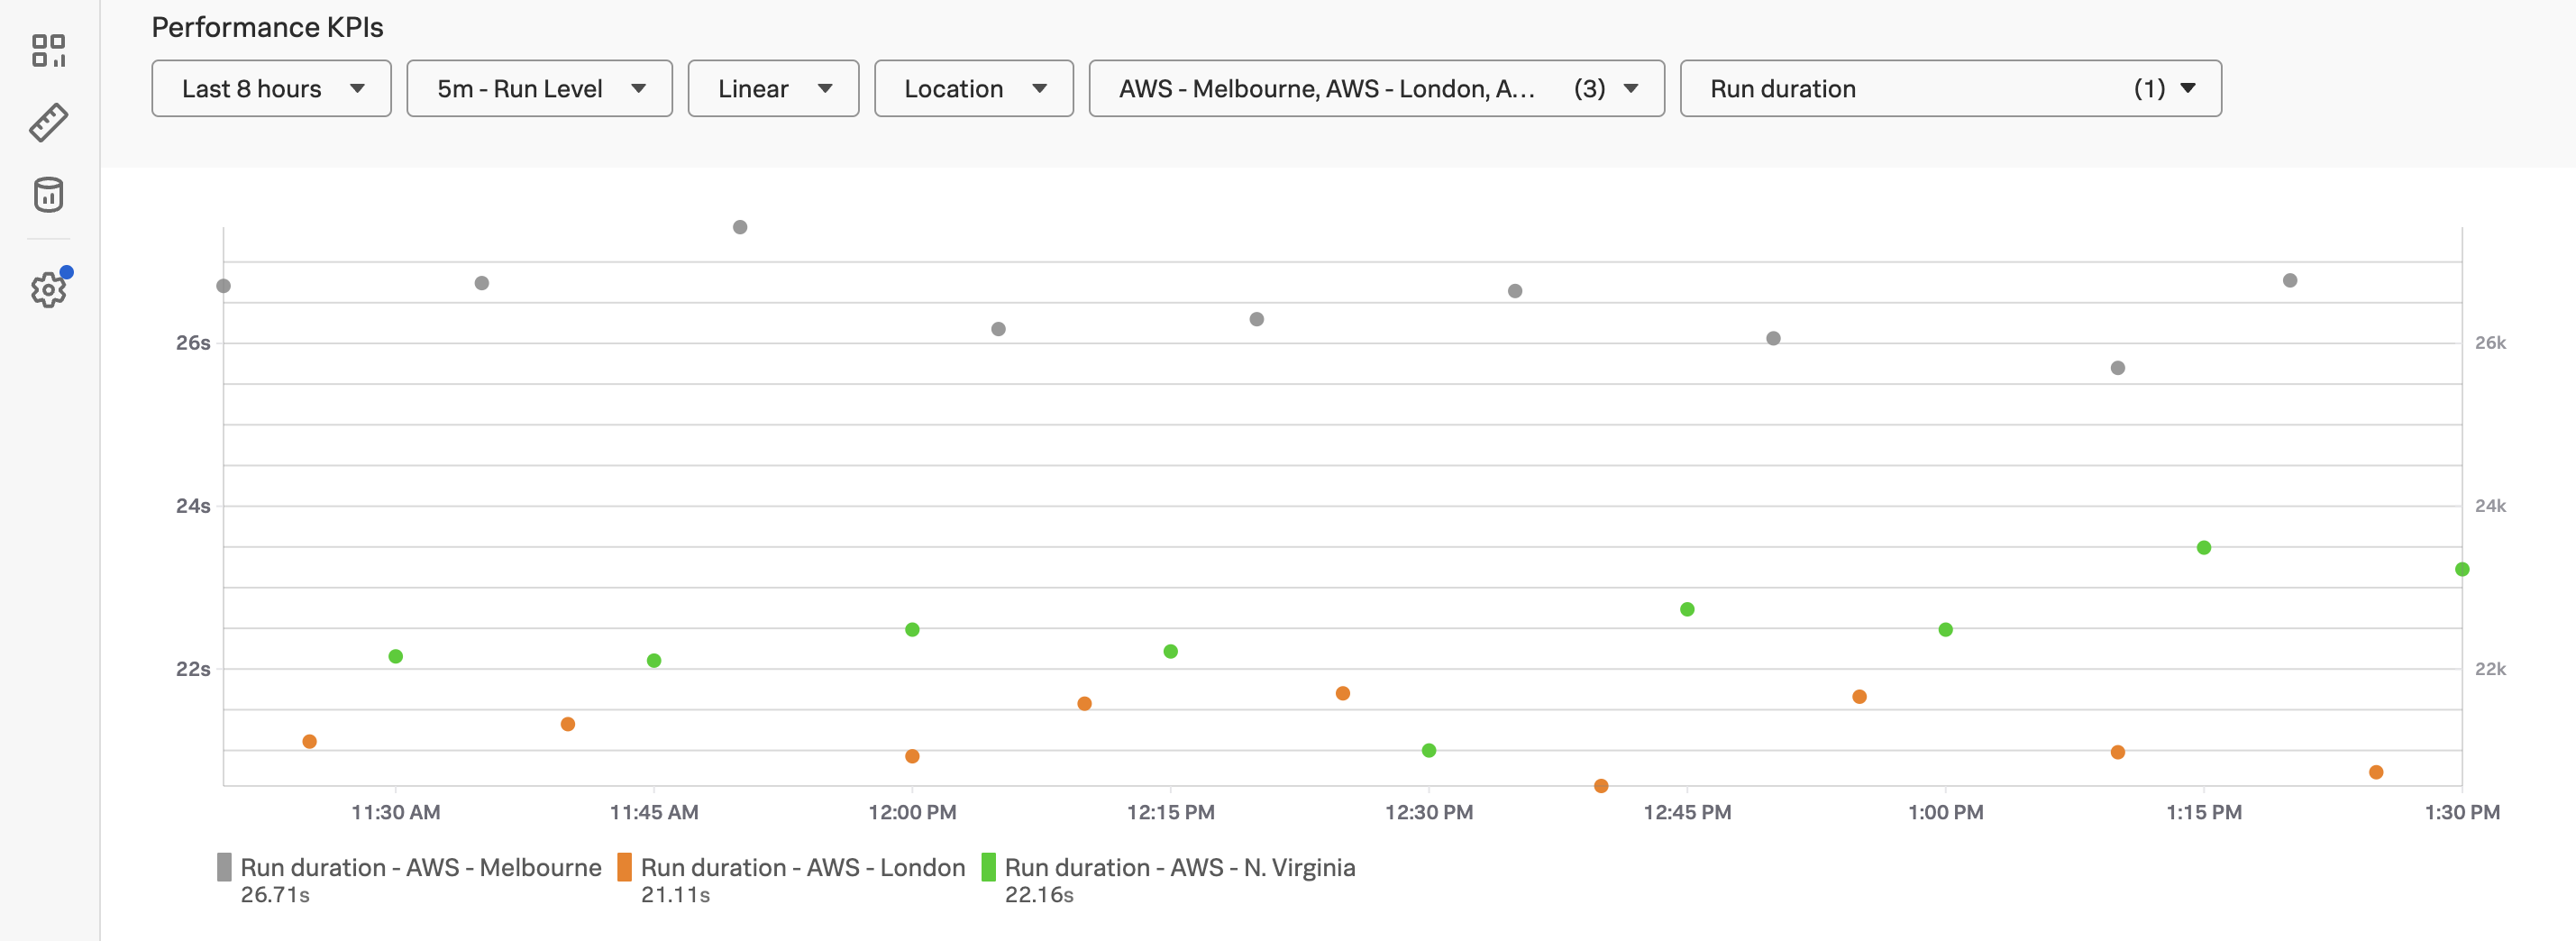
During our investigation in the RUM section, we found there was an issue with the Place Order Transaction. Let’s see if we can confirm this from the Synthetics test as well. We will be using the metric First byte time for the 4th page of the test, which is the Place Order step.
Exercise
In the Search box enter [WORKSHOP NAME] and select the test for your workshop (your instructor will advise as to which one to select).
Under Performance KPIs set the Time Picker to -30m and hit enter.
Click on Location and from the drop-down select Page. The next filter will be populated with the pages that are part of the test.
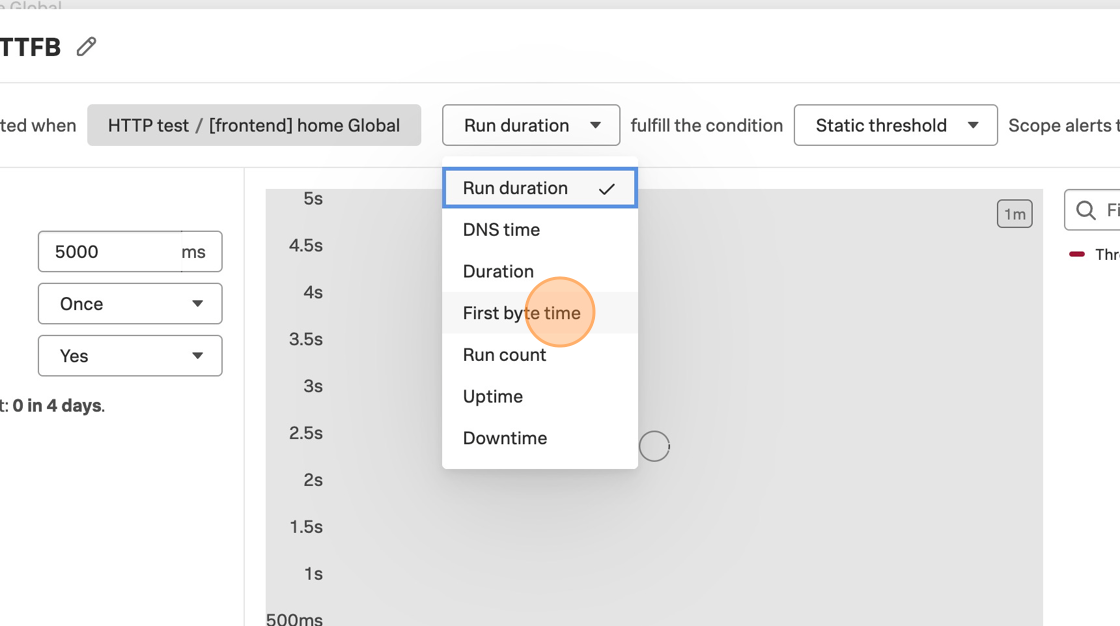
Click on Duration, deselect Duration and select First byte time.
Look at the legend and note the color of First byte time - Page 4.
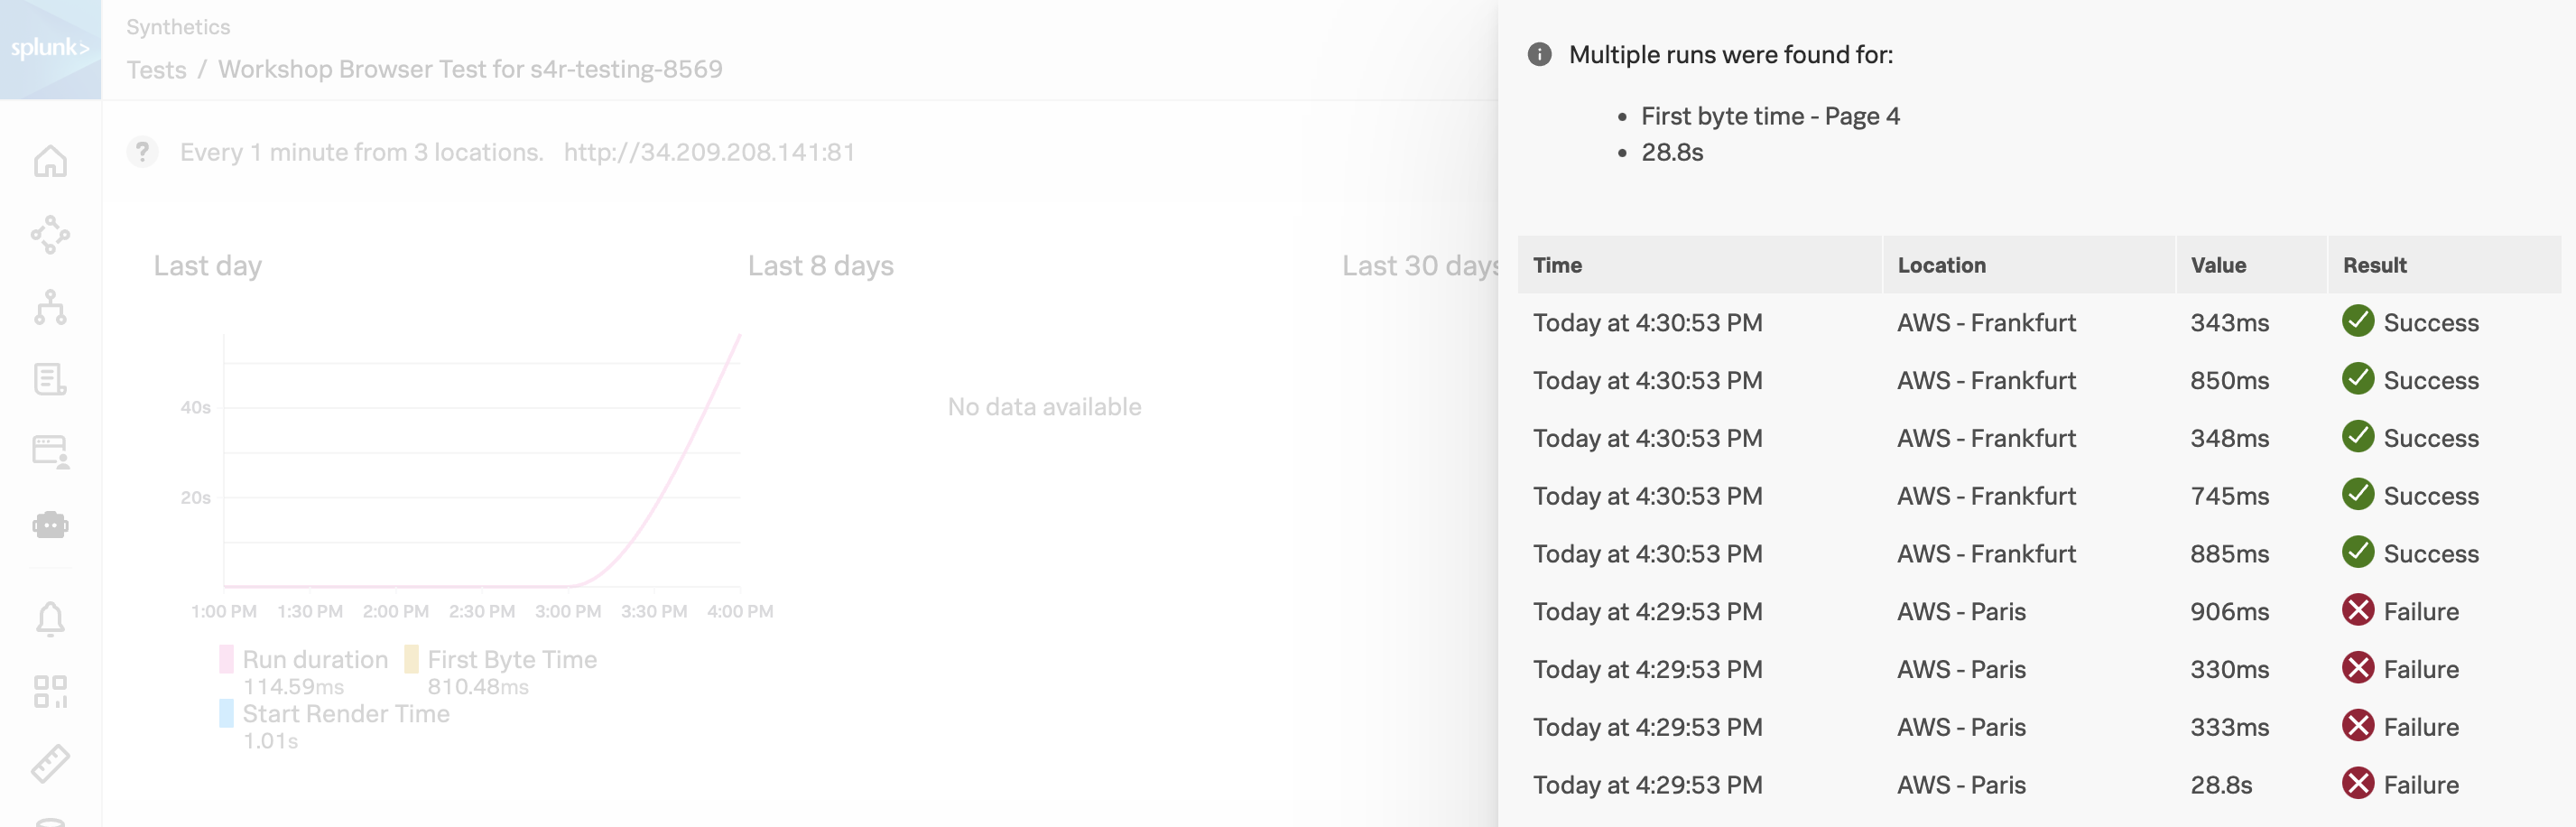
Select the highest data point for First byte time - Page 4.
A new pane will slide in from the right. Note the time at the top of the pane. Find this time in the list and click on it as this is the slowest test result.
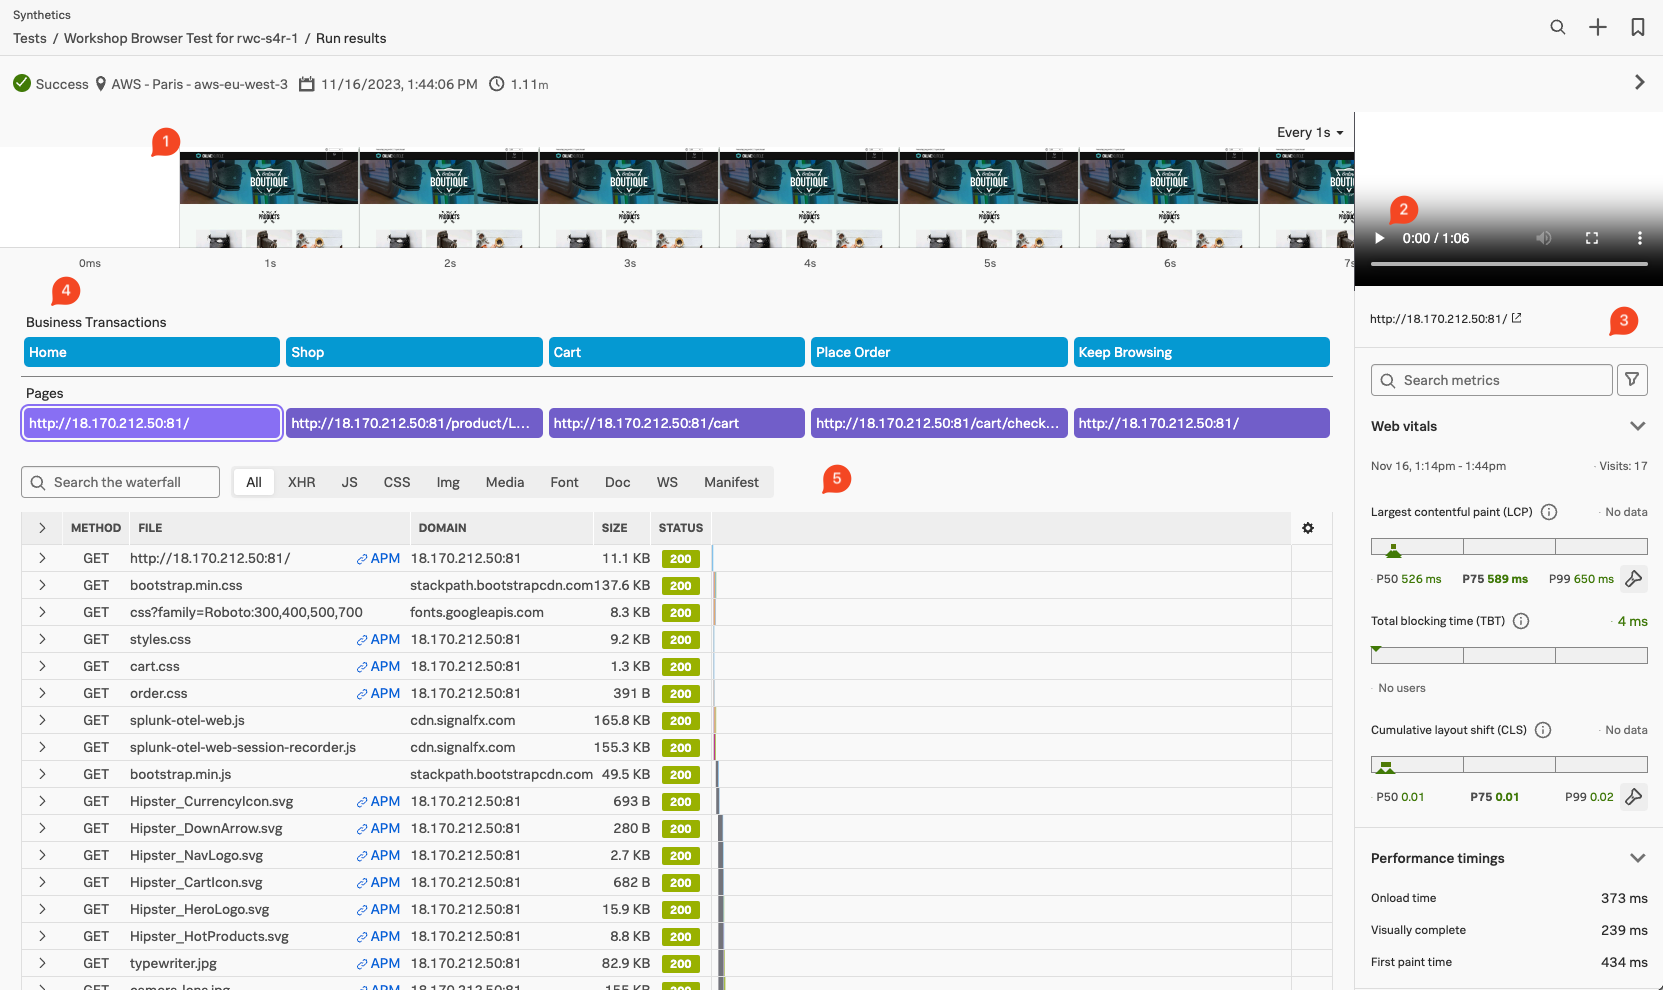
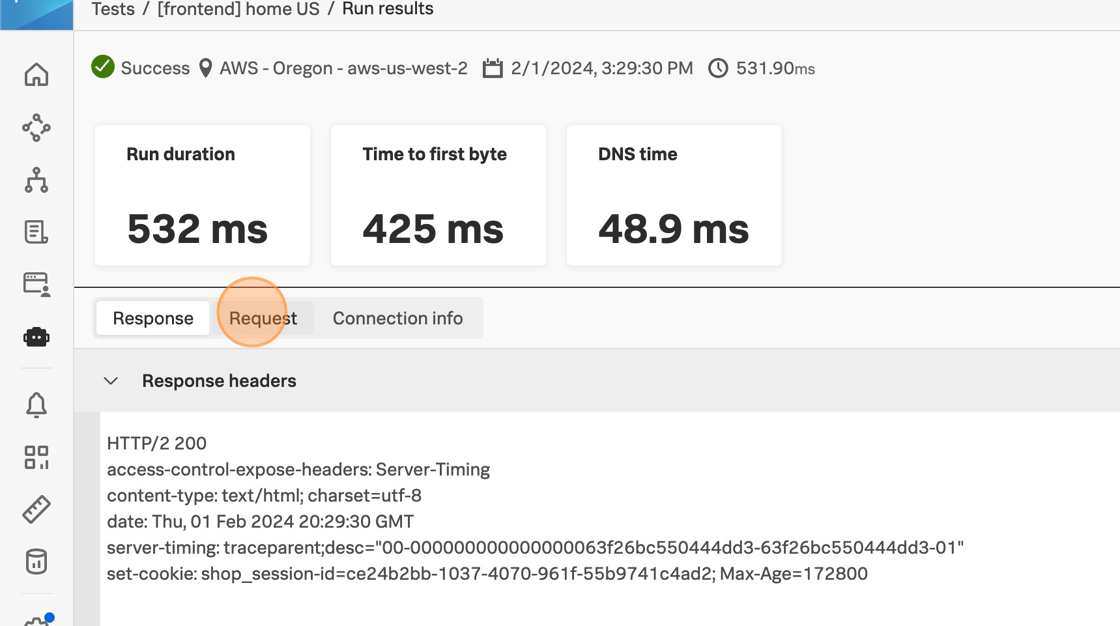
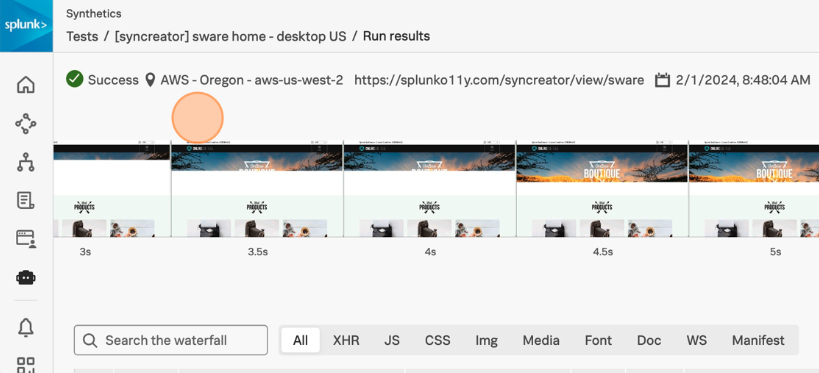
You will now be taken to the Run results for this particular test run.
2. Synthetics Test Detail
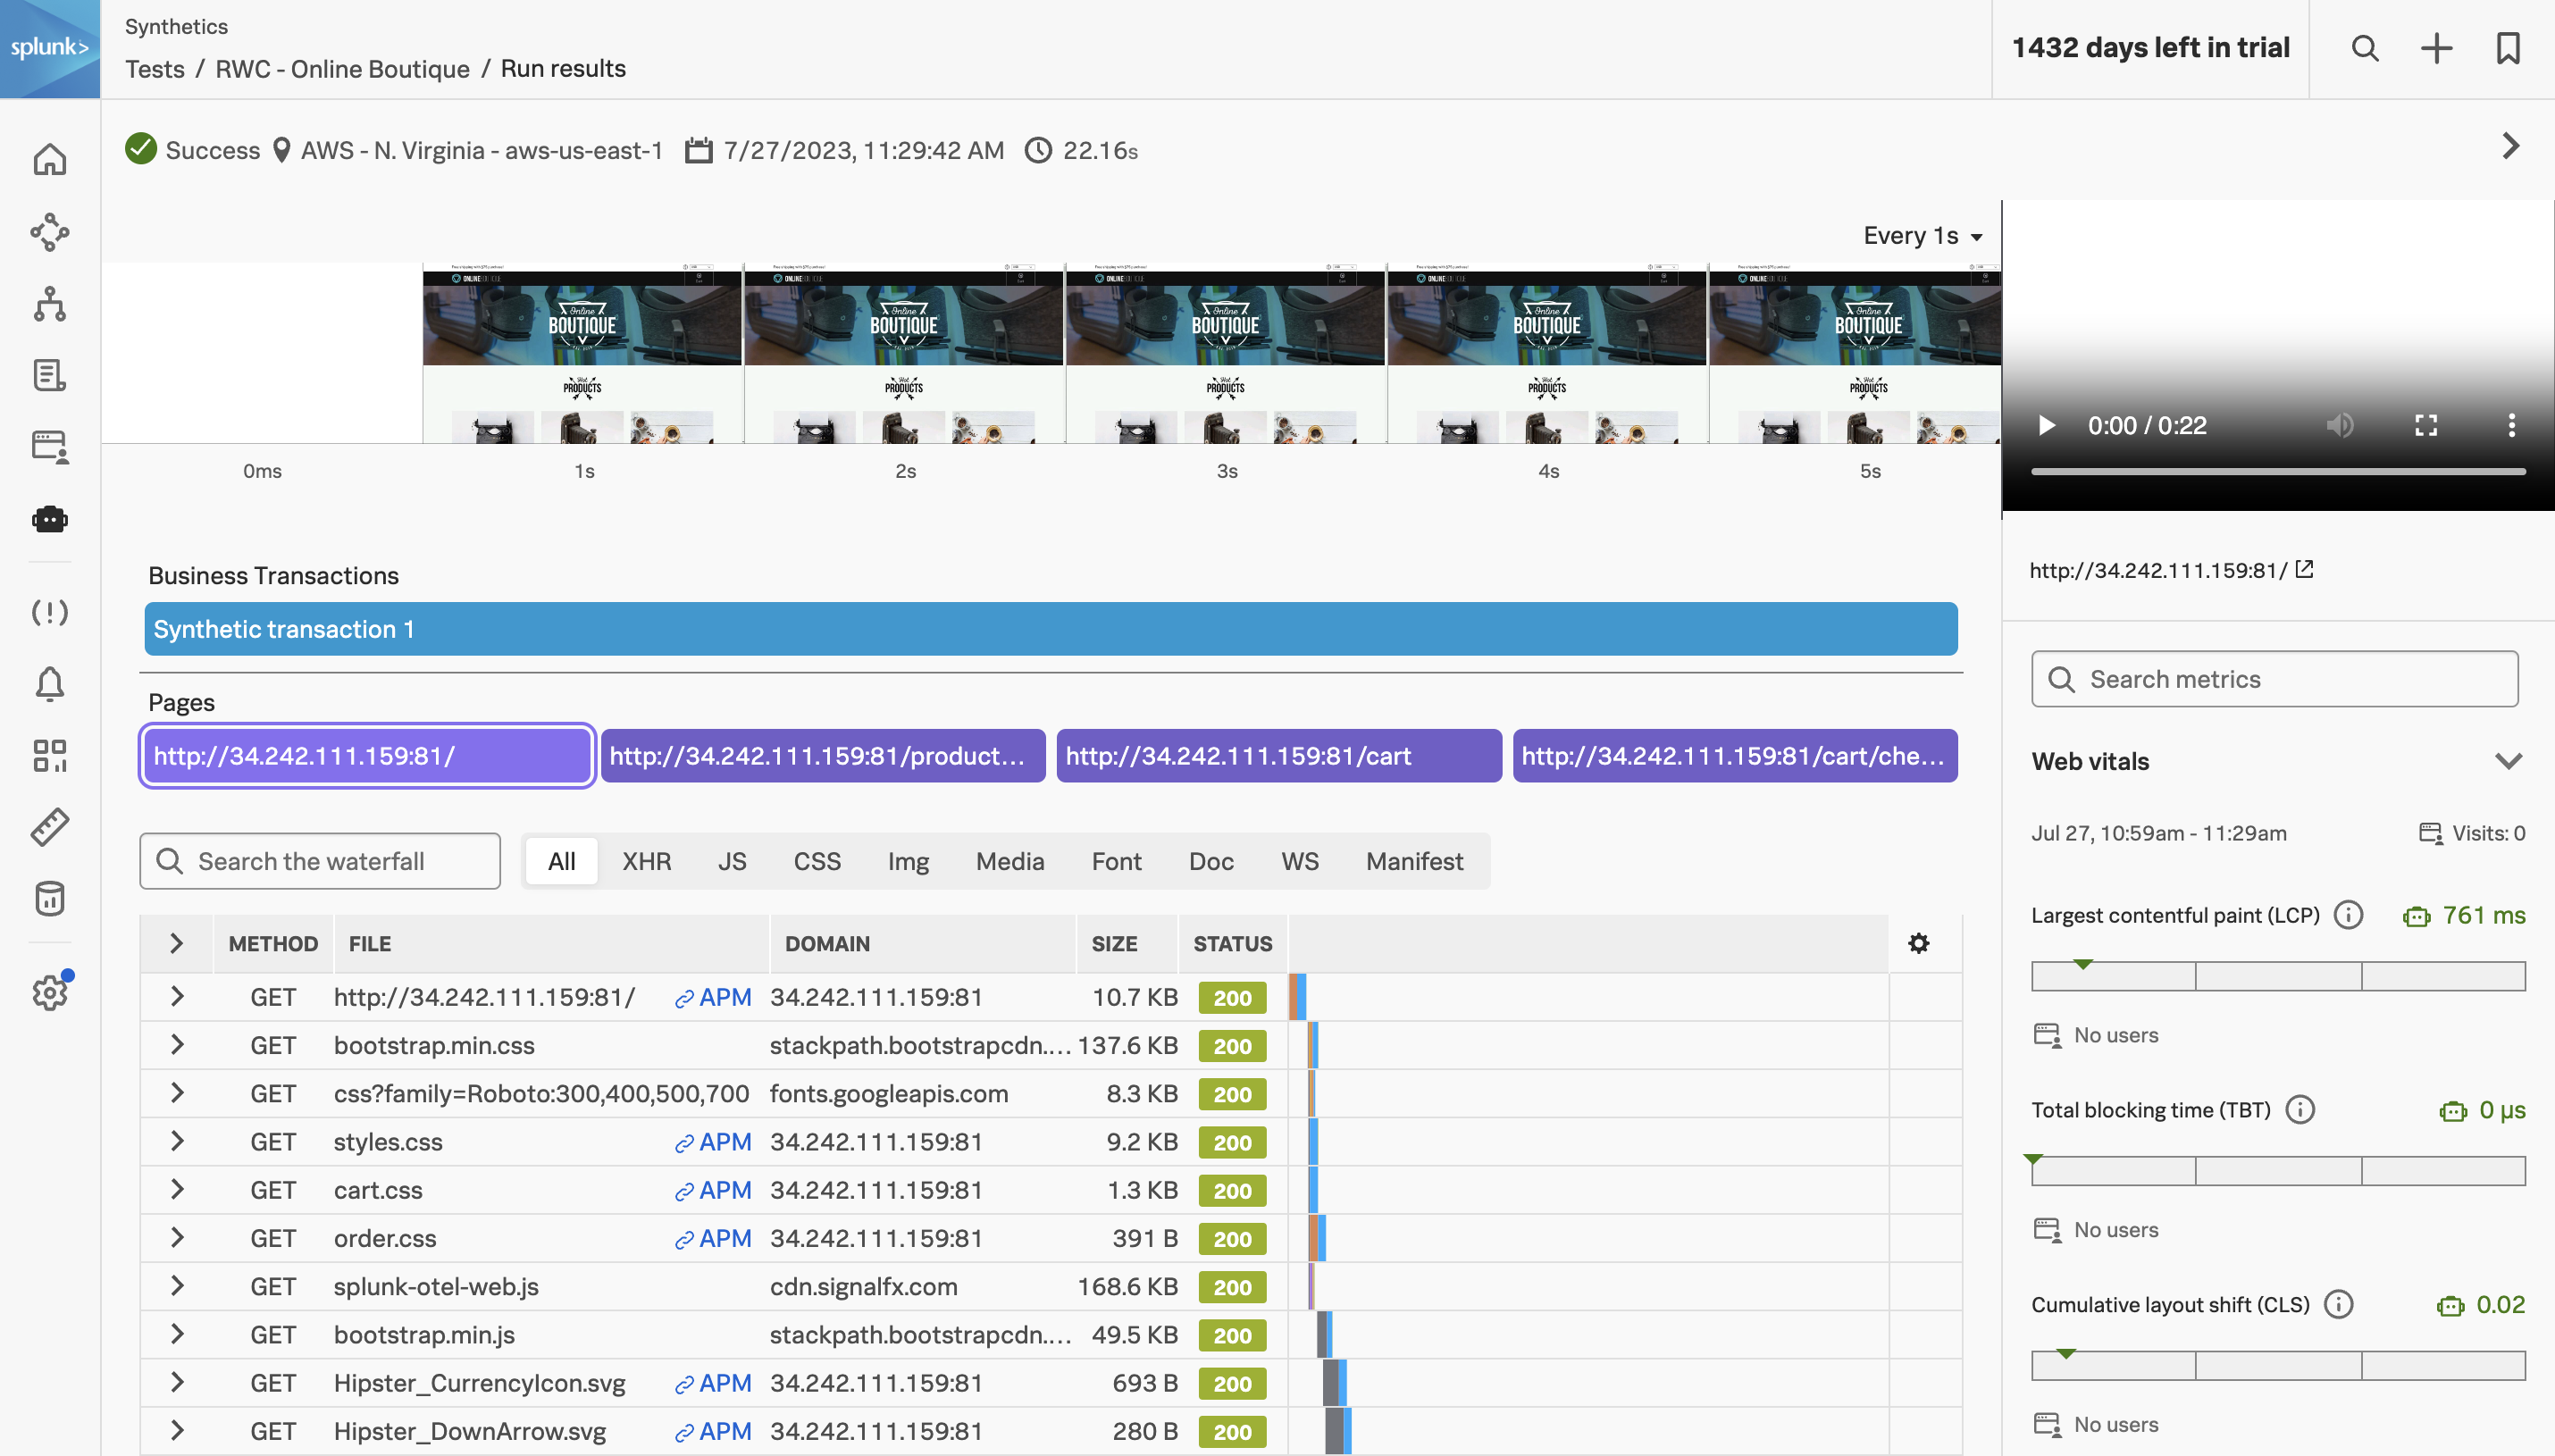
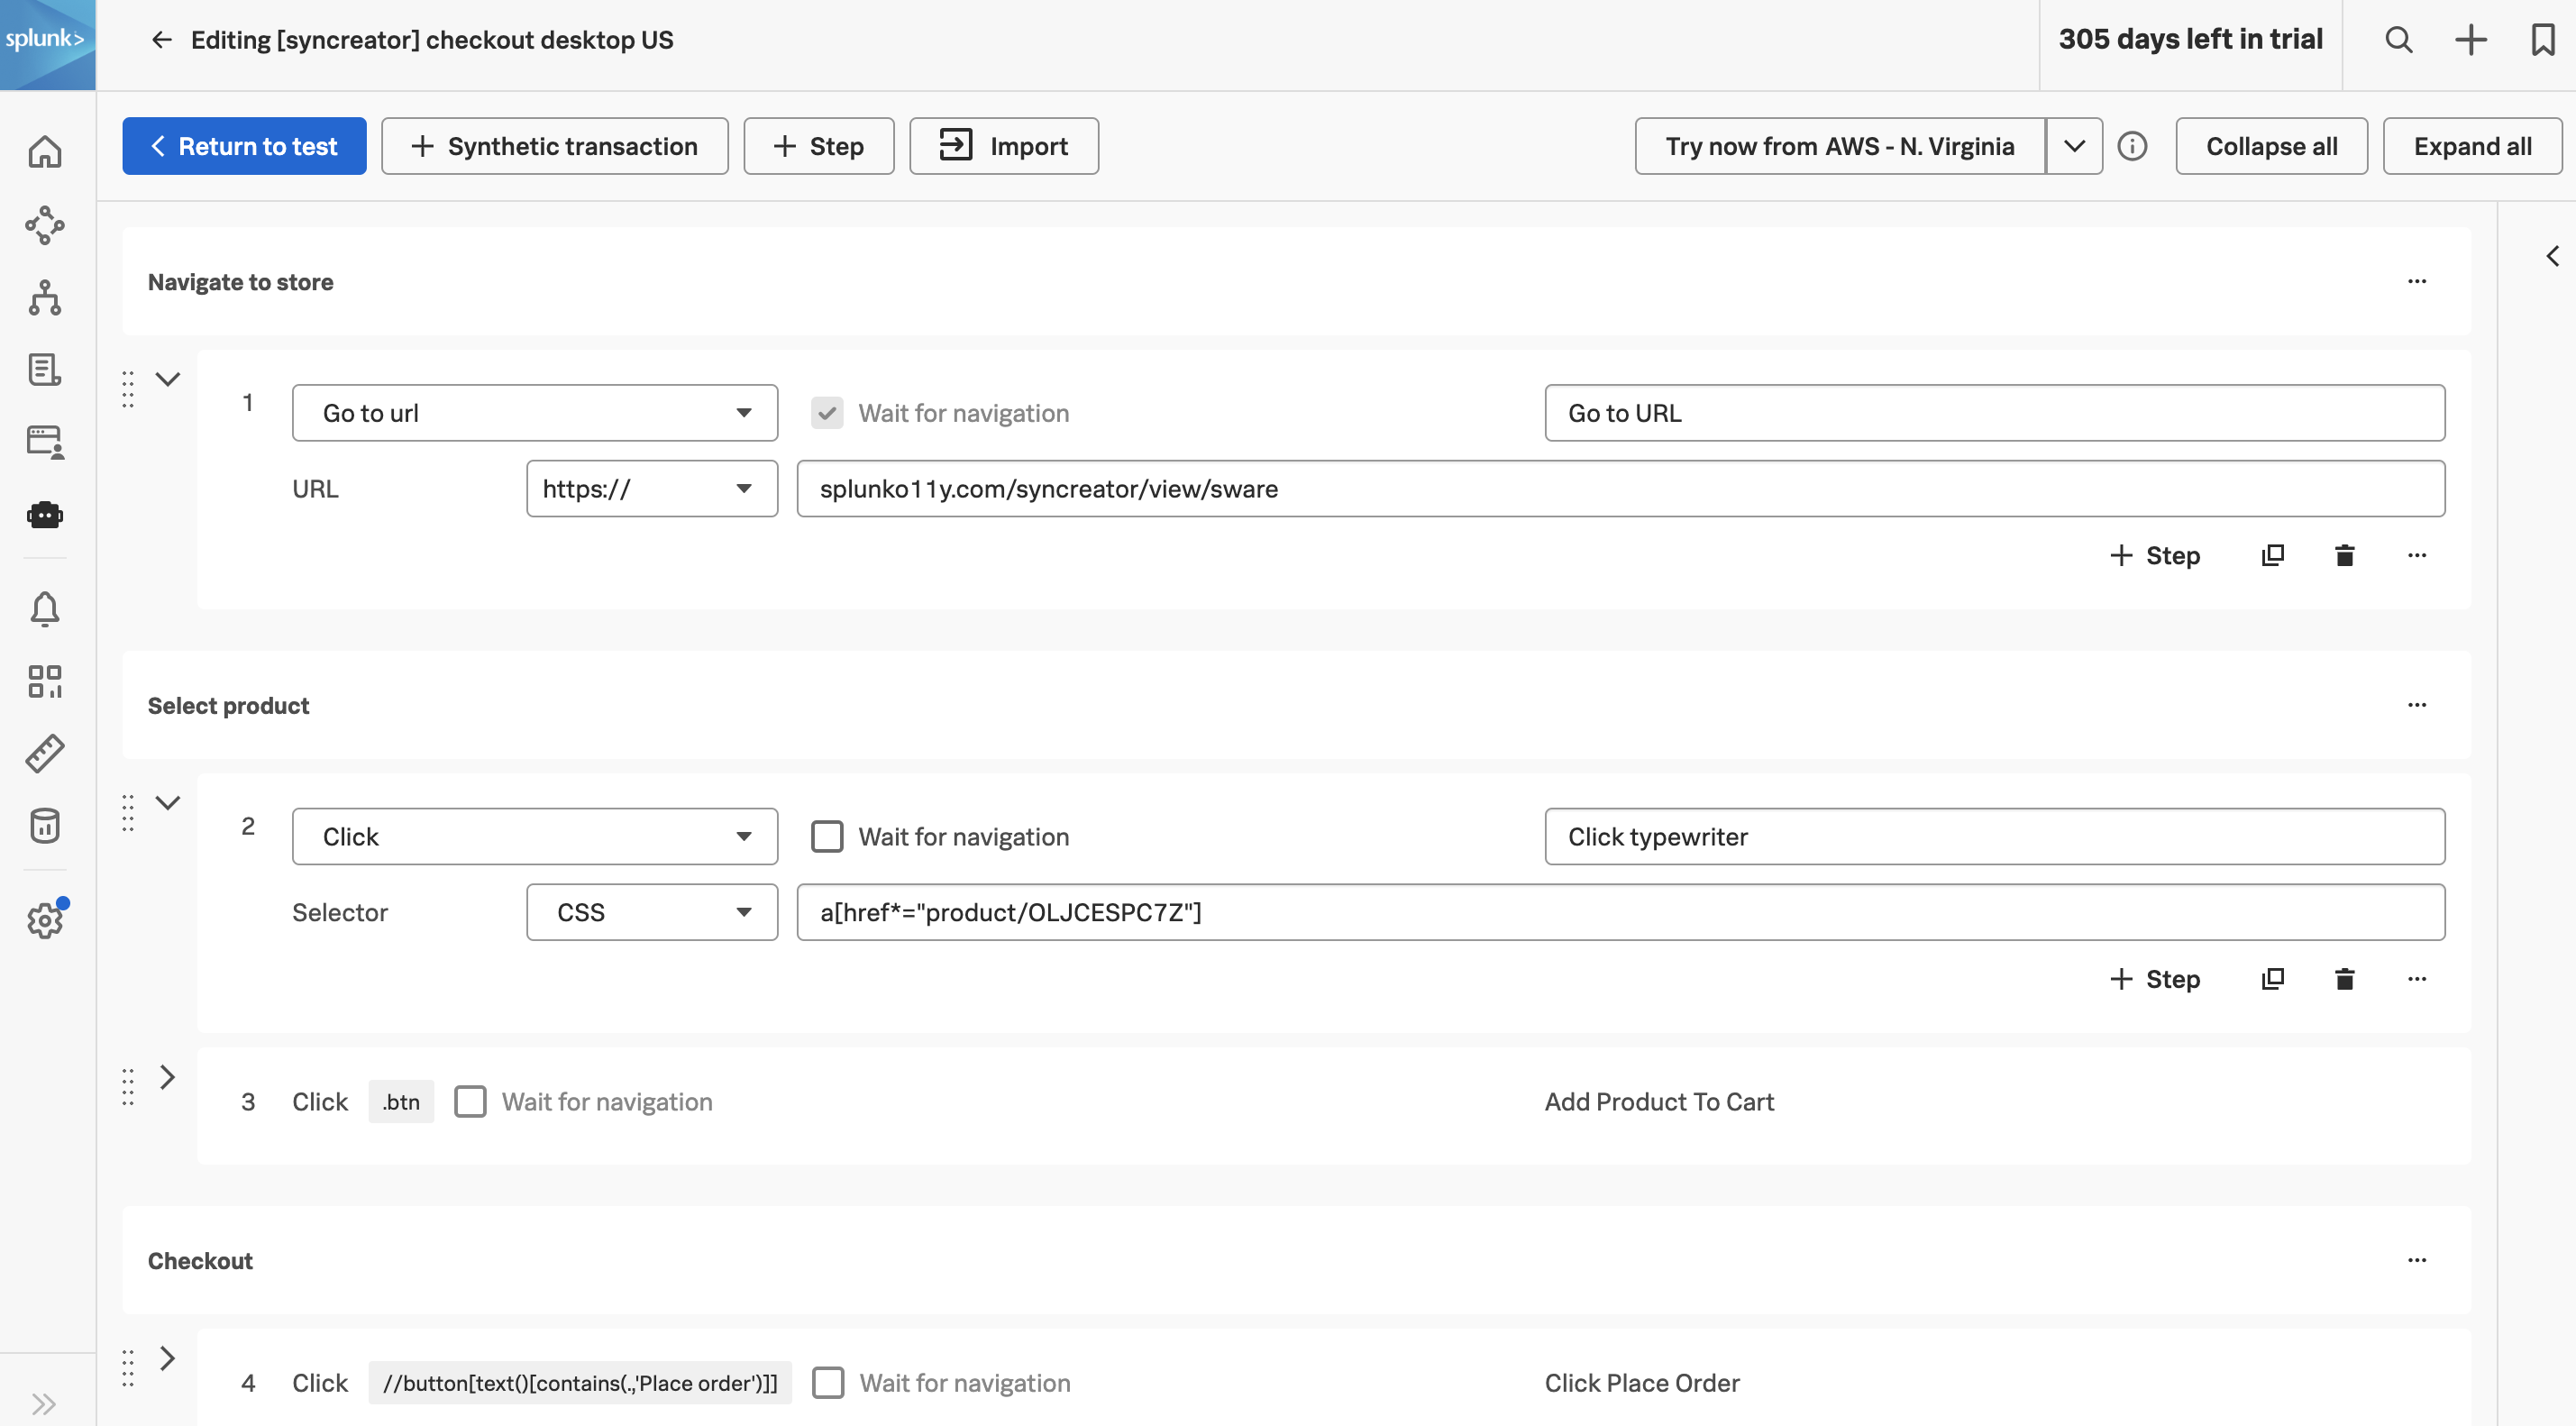
Right now we are looking at the result of a single Synthetic Browser Test. This test is split up into Business Transactions, think of this as a group of one or more logically related interactions that represent a business-critical user flow.
Info
The screenshot below doesn’t contain a red banner with an error in it however you might be seeing one in your run results. This is expected as in some cases the test run fails and does not impact the workshop.
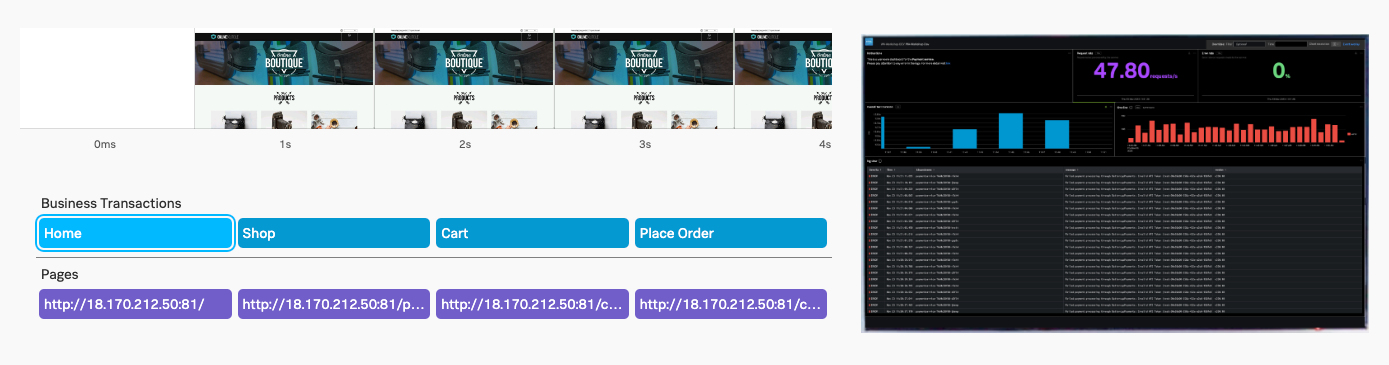
Filmstrip: Offers a set of screenshots of site performance so that you can see how the page responds in real-time.
Video: This lets you see exactly what a user trying to load your site from the location and device of a particular test run would experience.
Browser test metrics: A View that offers you a picture of website performance.
Synthetic transactions: List of the Synthetic transactions that made up the interaction with the site
Waterfall chart The waterfall chart is a visual representation of the interaction between the test runner and the site being tested.
By default, Splunk Synthetics provides screenshots and video capture of the test. This is useful for debugging issues. You can see, for example, the slow loading of large images, the slow rendering of a page etc.
Exercise
Use your mouse to scroll left and right through the filmstrip to see how the site was being rendered during the test run.
In the Video pane, press on the play button ▶ to see the test playback. If you click the ellipses ⋮ you can change the playback speed, view it Picture in Picture and even Download the video.
In the Synthetic Transaction pane, under the header Business Transactions, click on the first button Home
The waterfall below will show all the objects that make up the page. The first line is the HTML page itself. The next lines are the objects that make up the page (HTML, CSS, JavaScript, Images, Fonts, etc.).
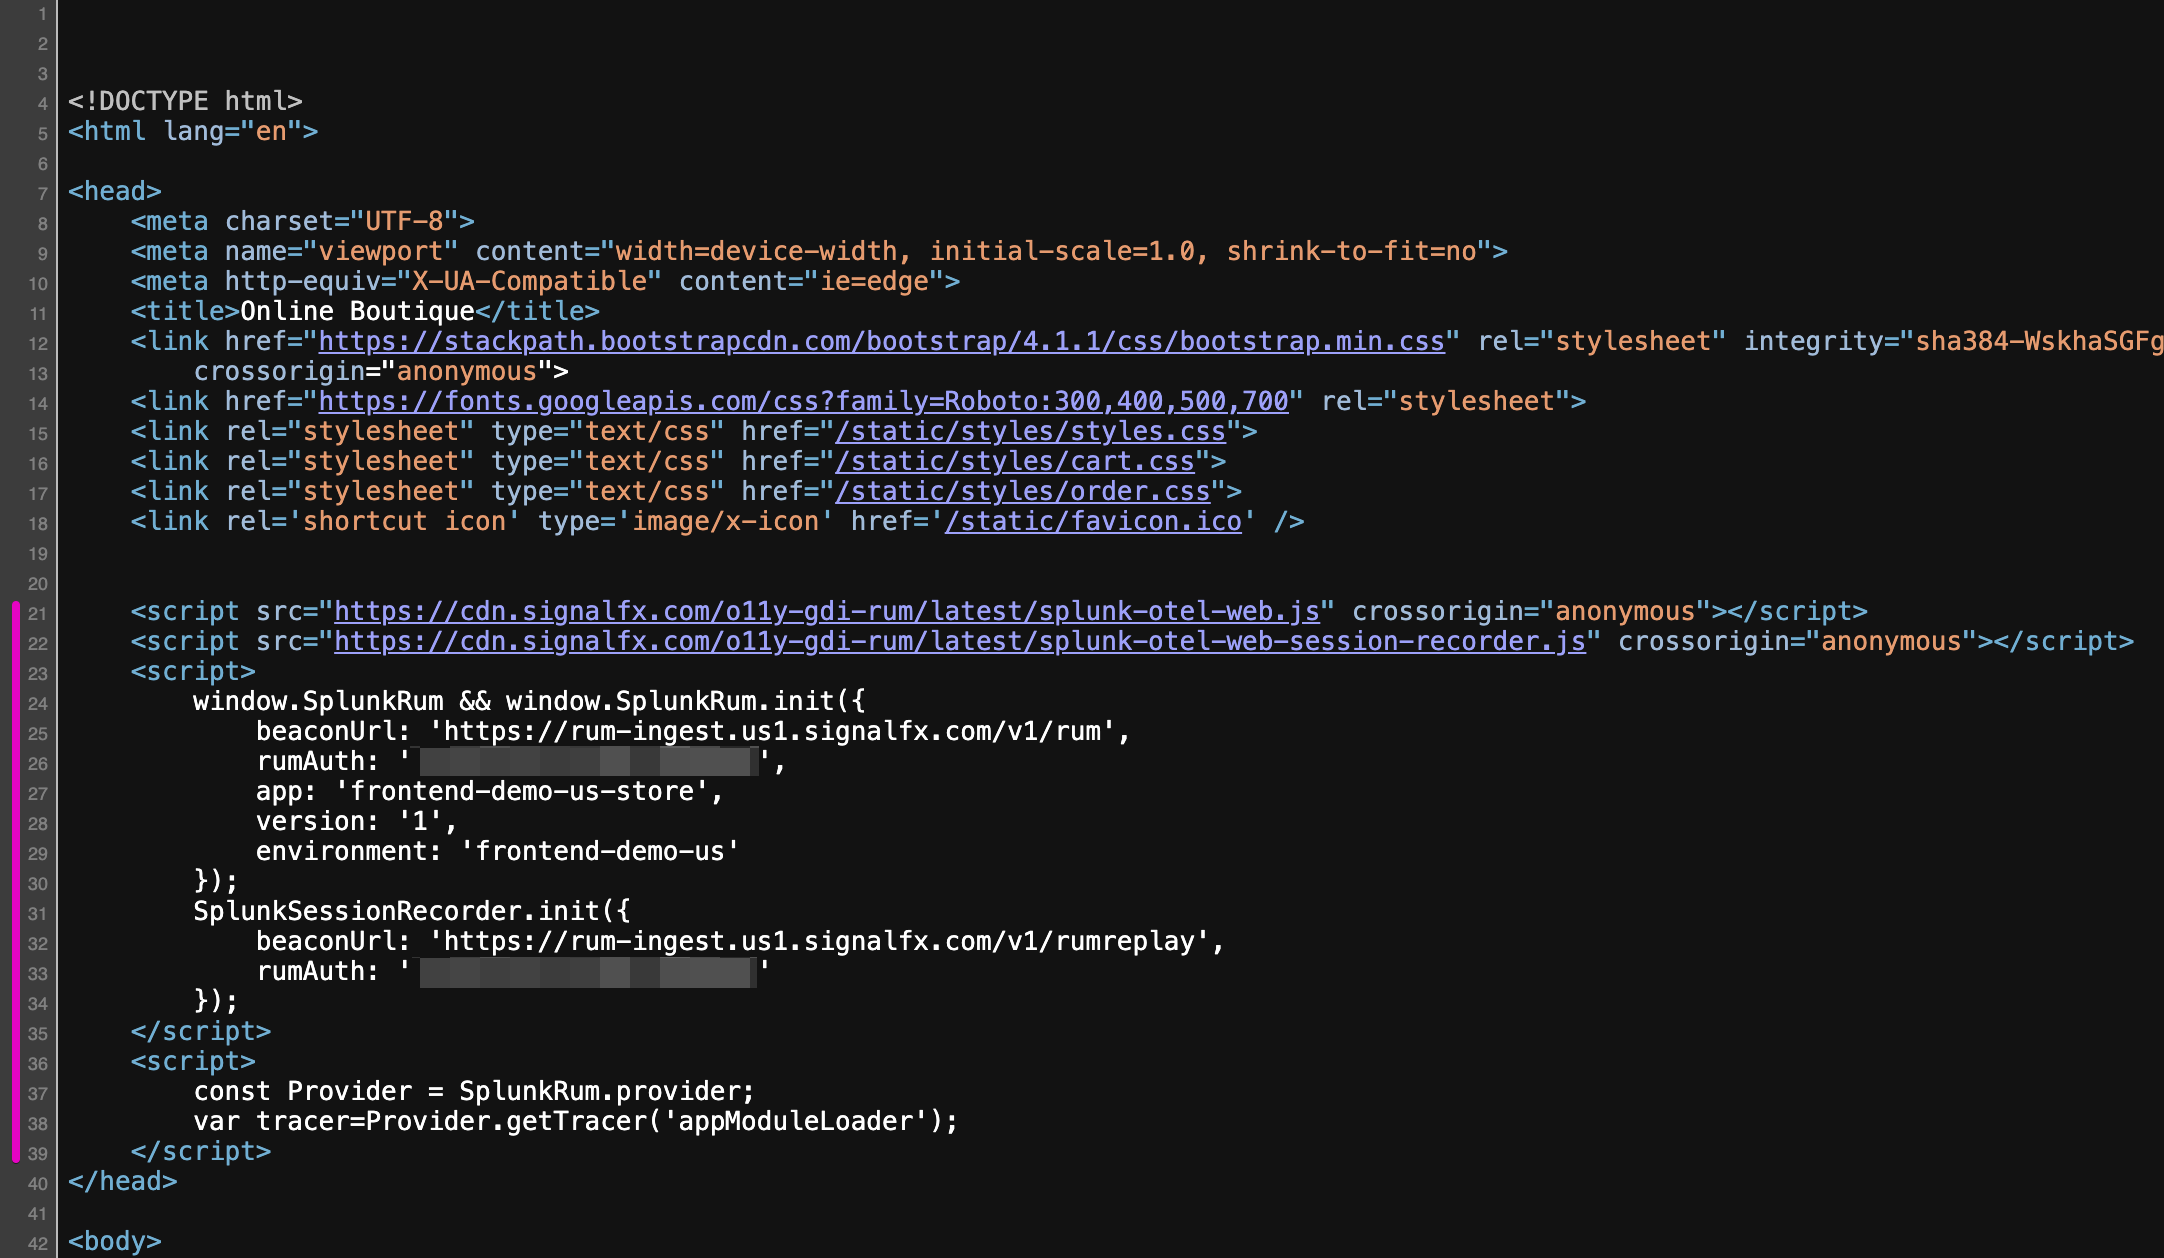
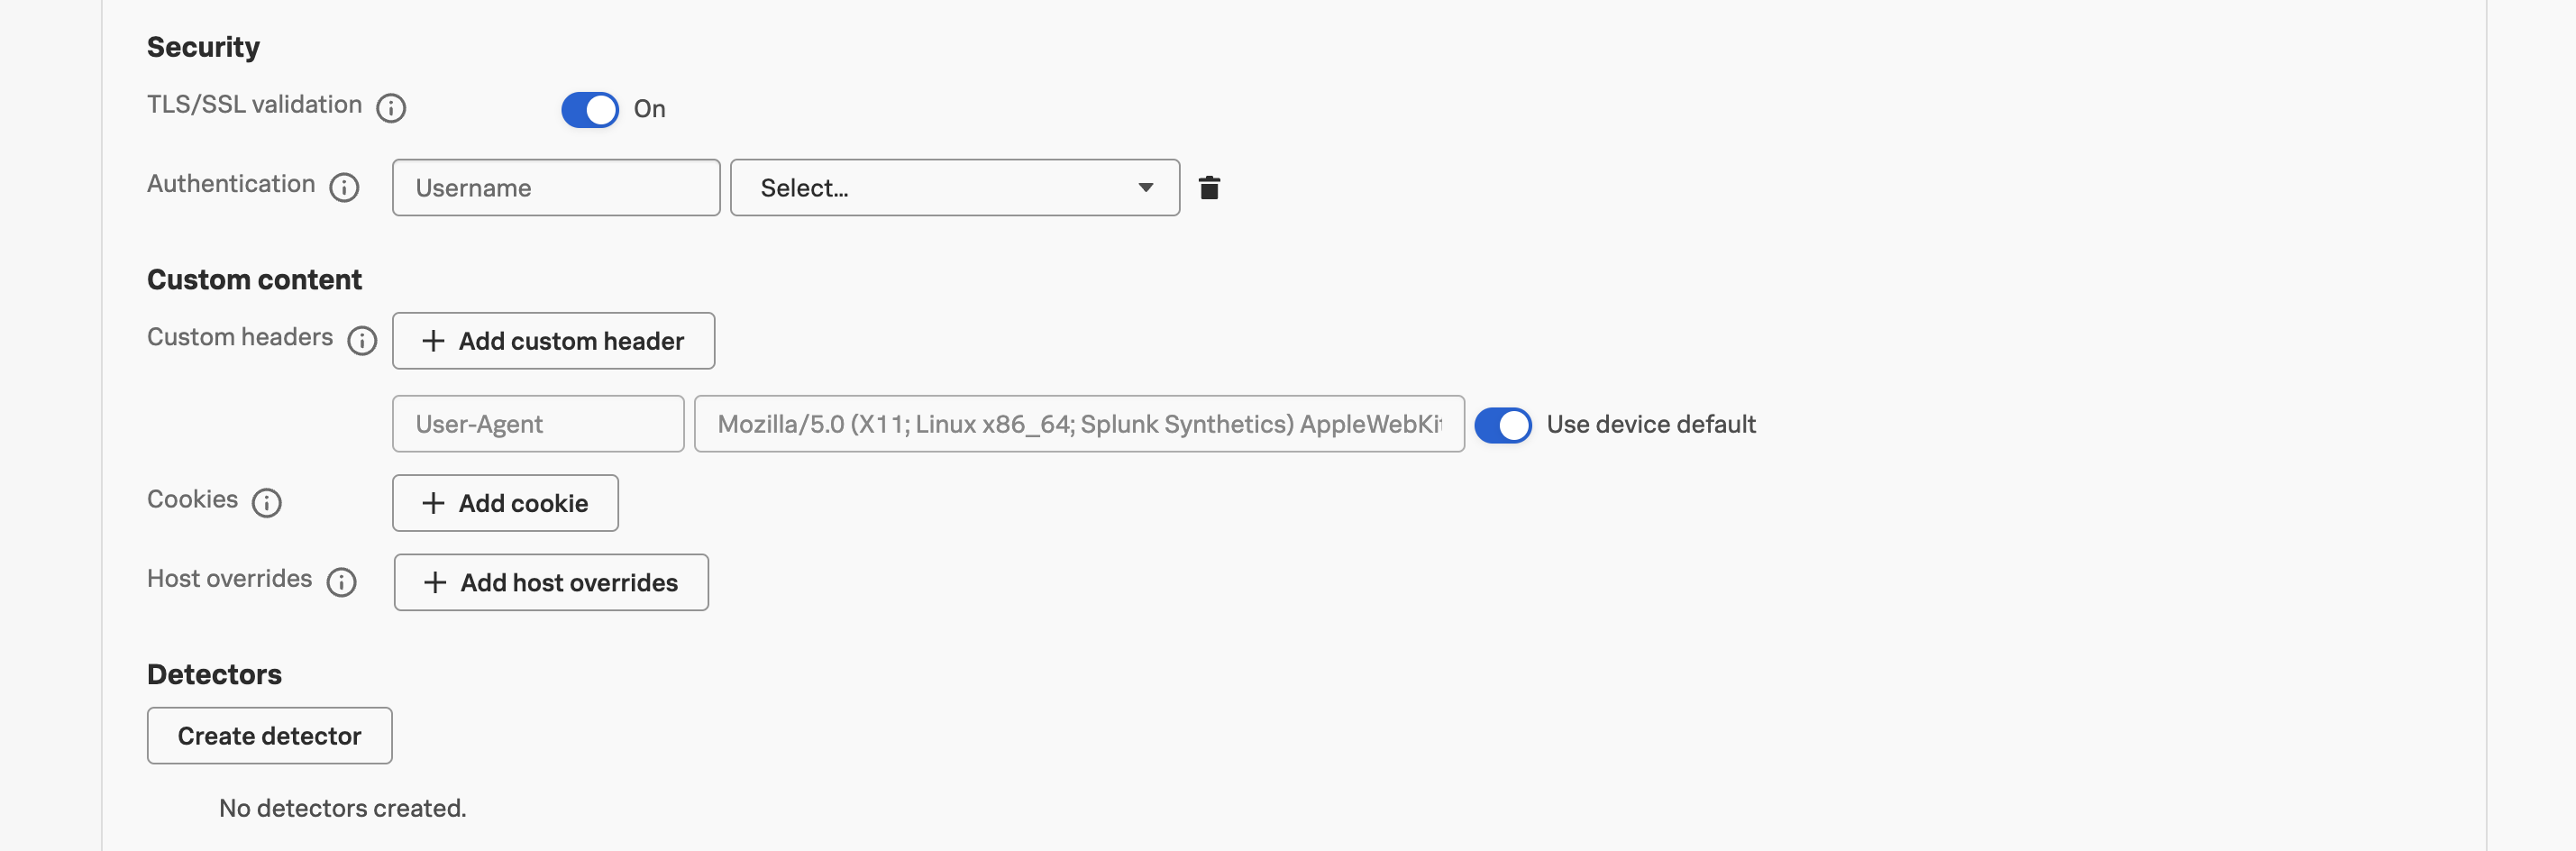
In the waterfall find the line GETsplunk-otel-web.js.
Click on the > button to open the metadata section to see the Request/Response Header information.
In the Synthetic Transaction pane, click on the second Business Transaction Shop. Note that the filmstrip adjusts and moves to the beginning of the new transaction.
Repeat this for all the other Transactions, then finally select thePlaceOrder transaction.
3. Synthetics to APM
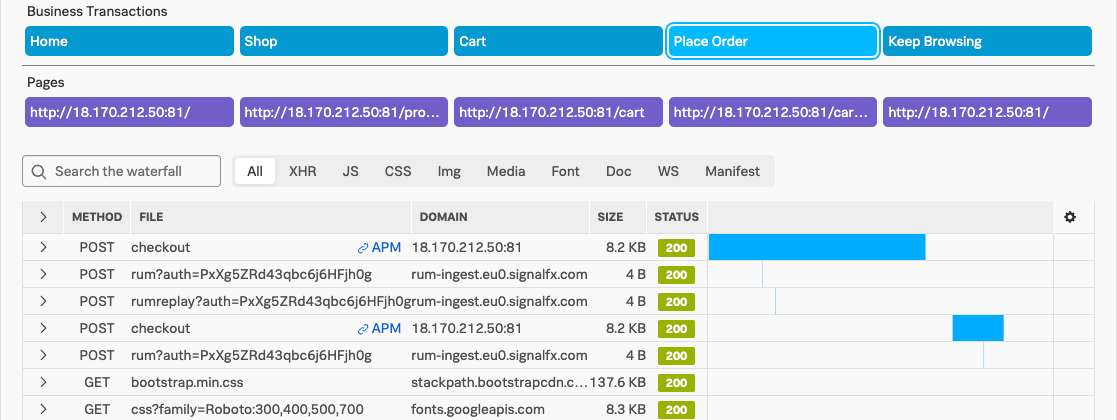
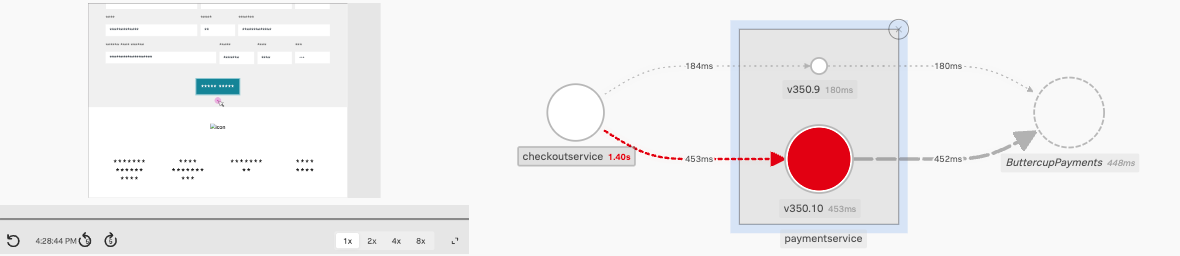
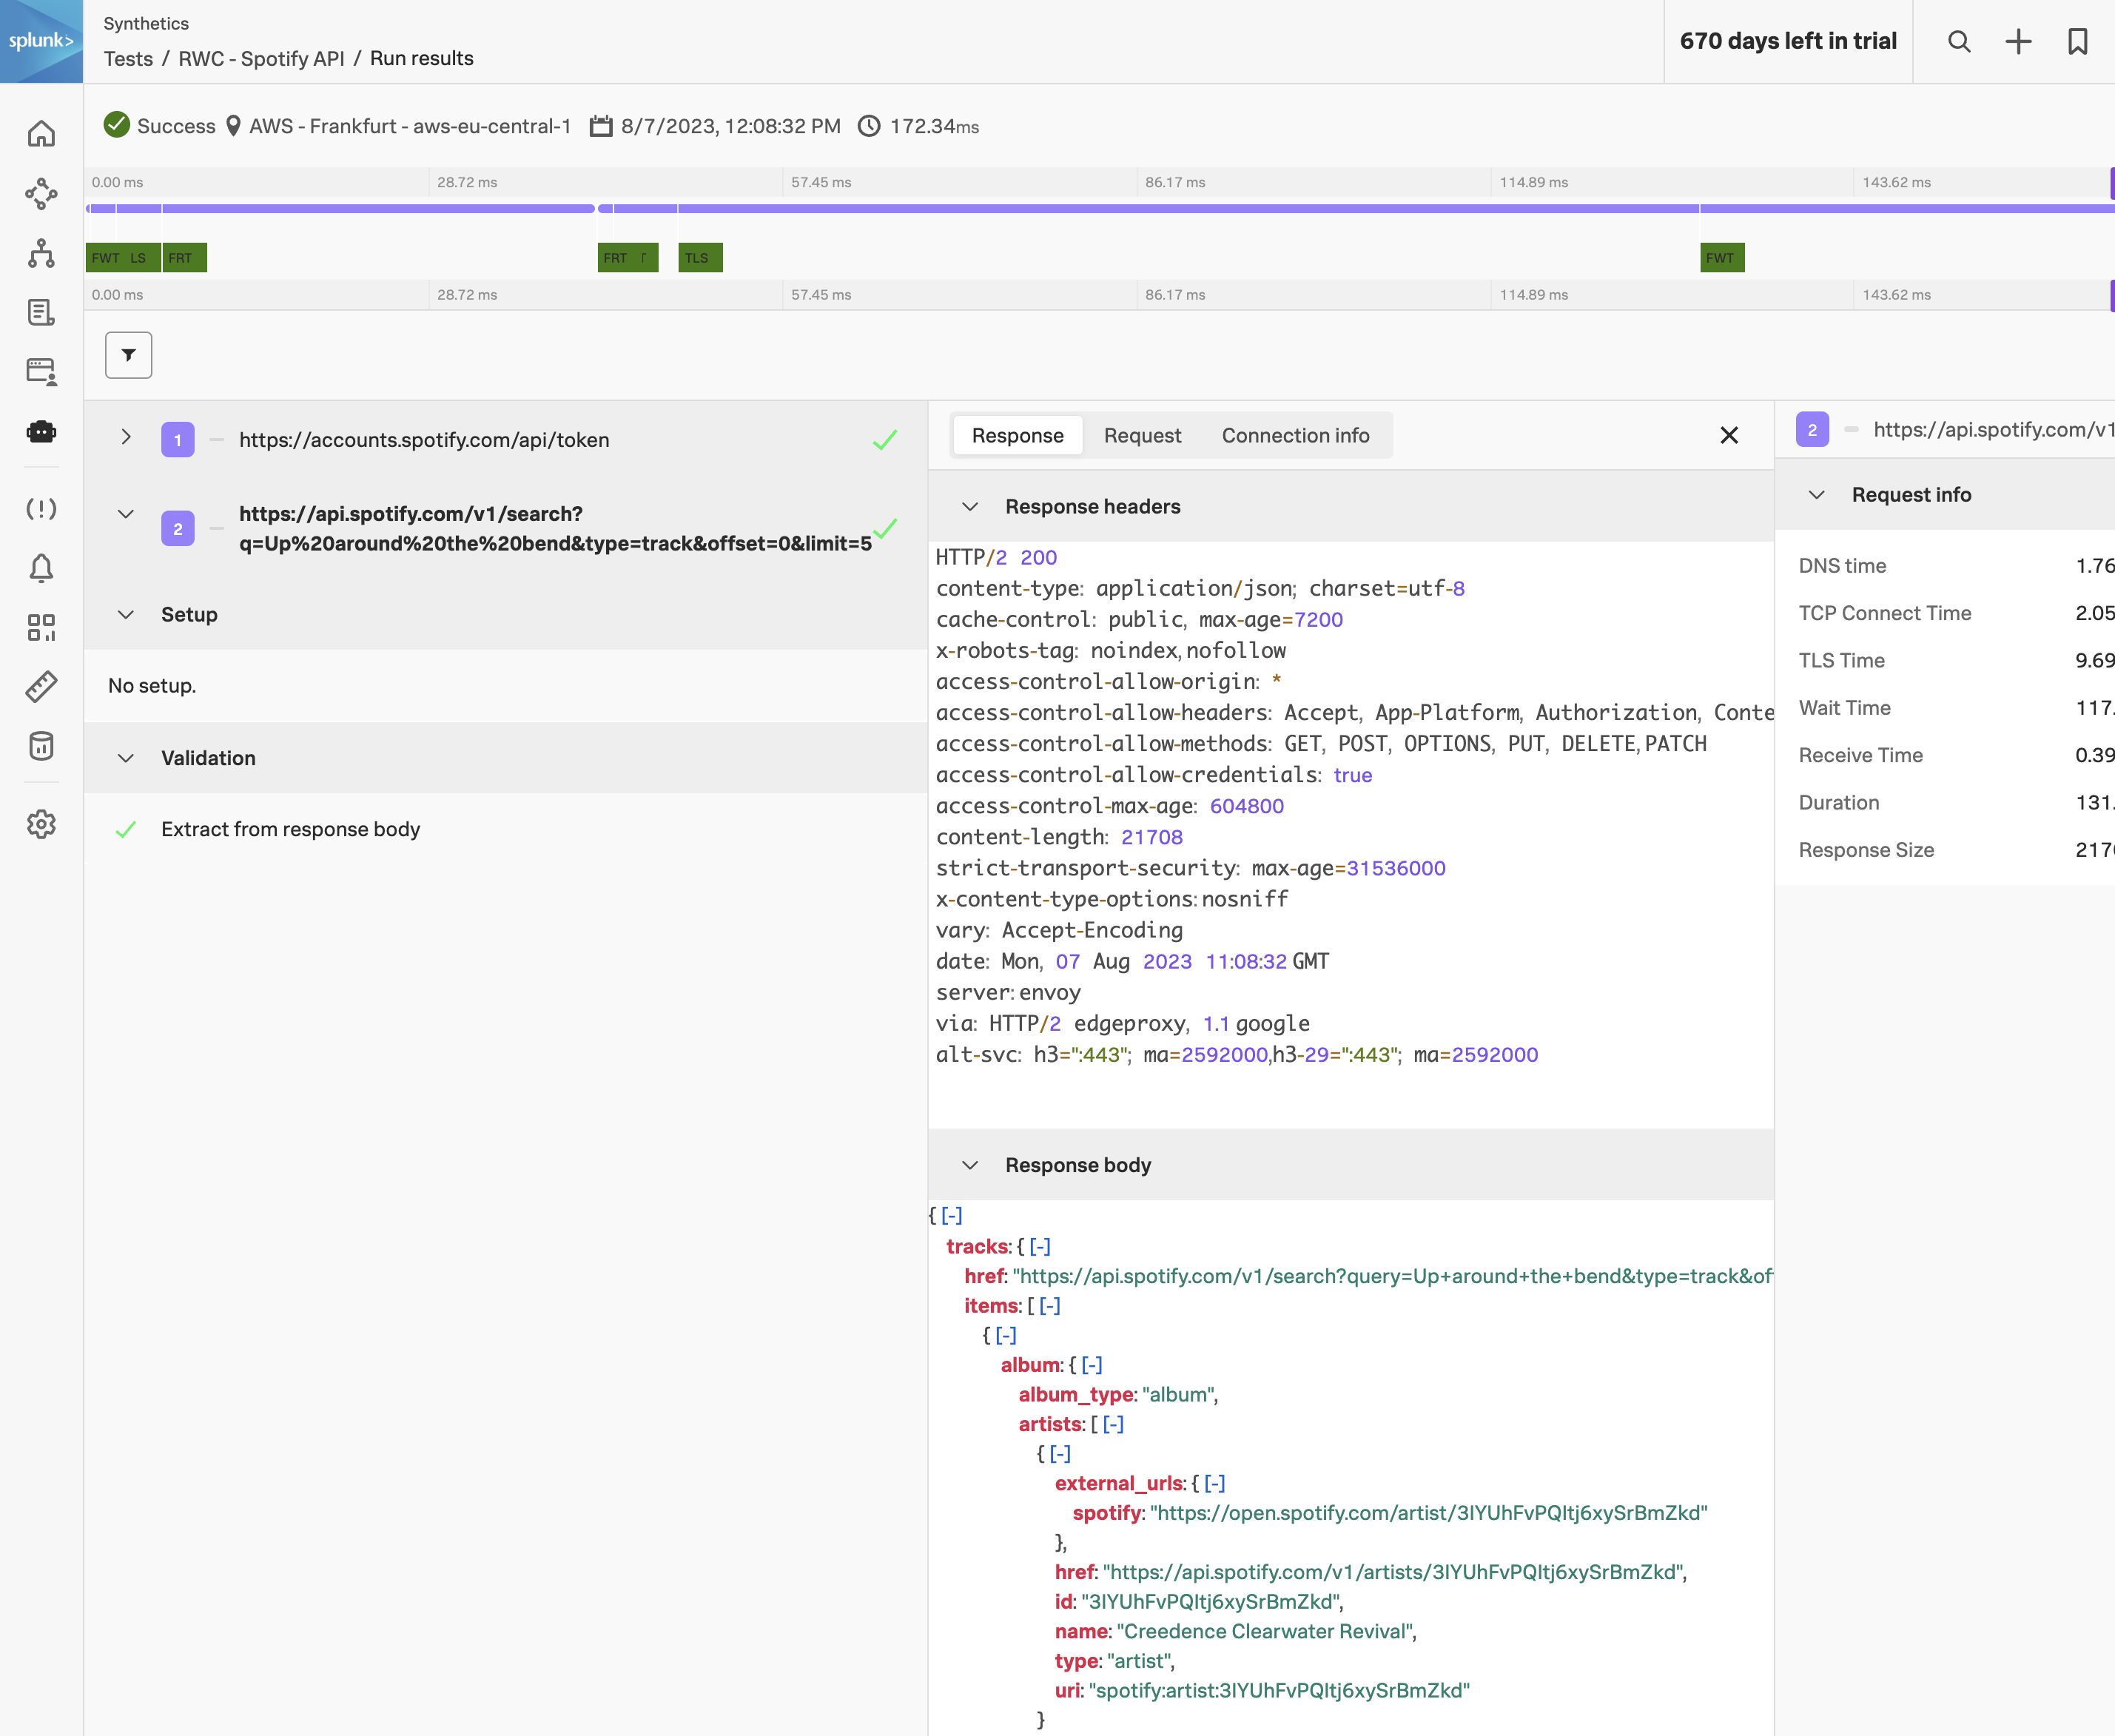
We now should have a view similar to the one below.
Exercise
In the waterfall find an entry that starts with POST checkout.
Click on the > button in front of it to drop open the metadata section. Observe the metadata that is collected, and note the Server-Timing header. This header is what allows us to correlate the test run to a back-end trace.
Click on the blue APM link on the POST checkout line in the waterfall.
Exercise
Validate you see one or more errors for the paymentservice (1).
To validate that it’s the same error, click on the related content for Logs (2).
Repeat the earlier exercise to filter down to the errors only.
View the error log to validate the failed payment due to an invalid token.
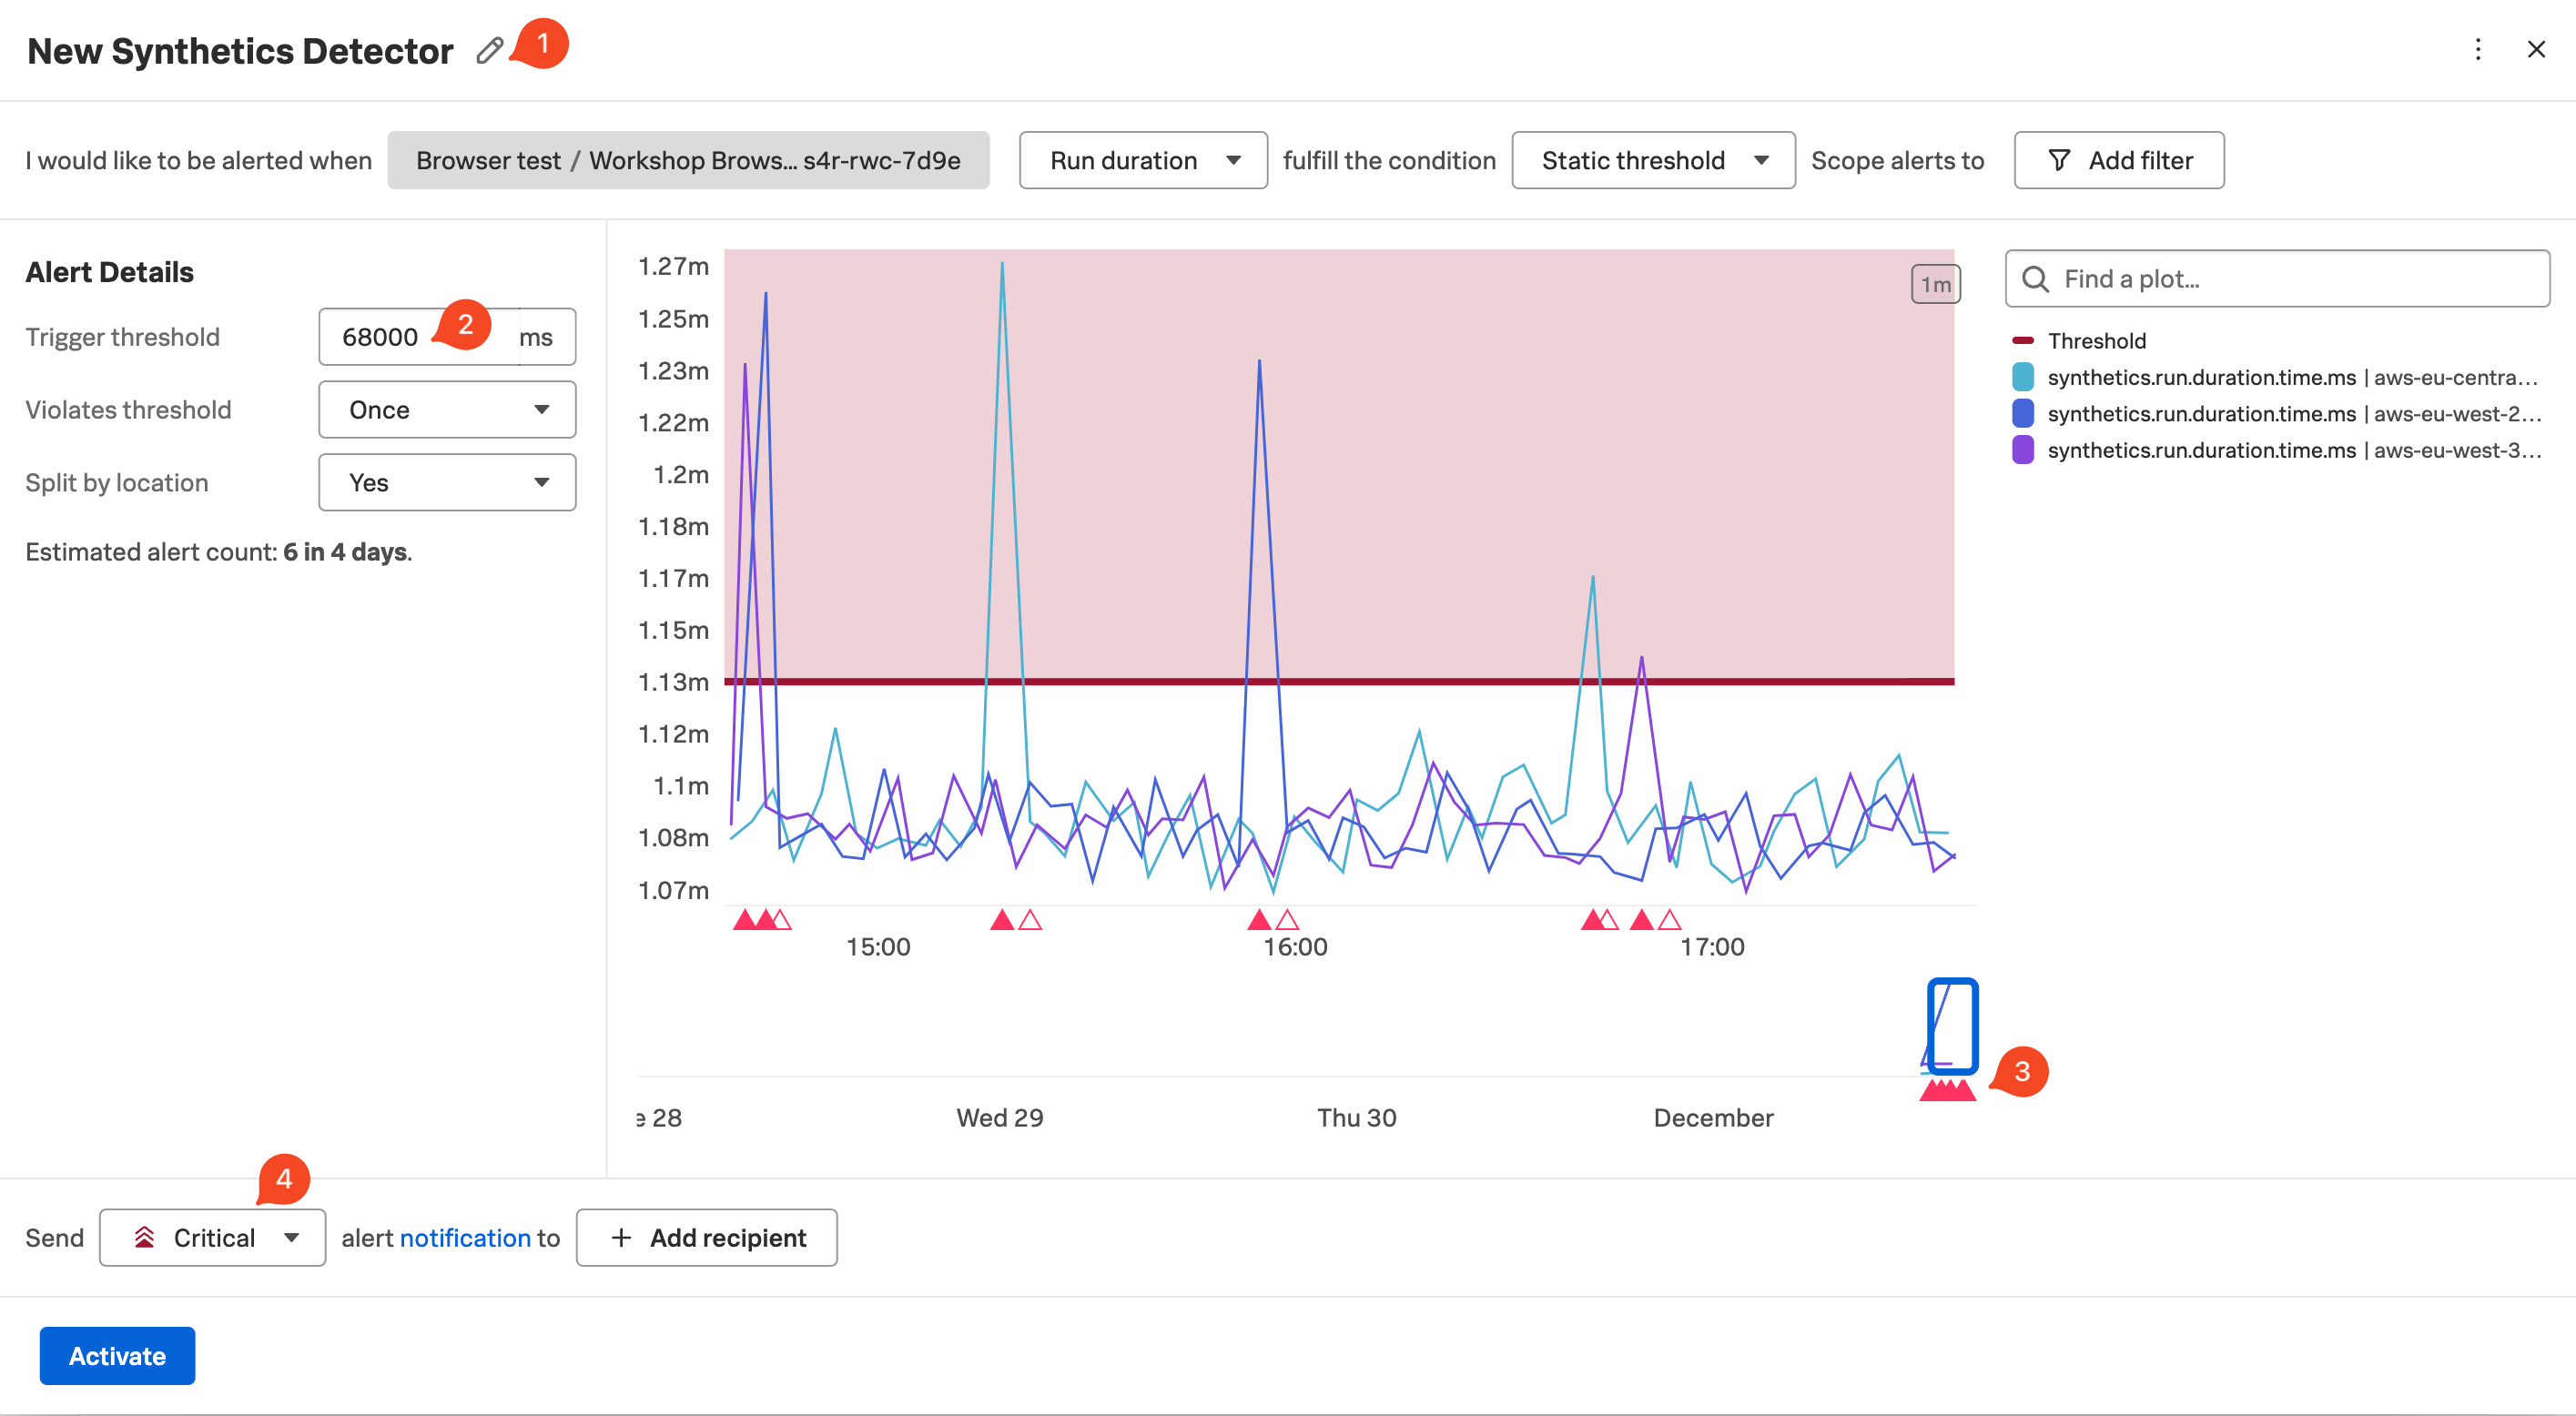
4. Synthetics Detector
Given you can run these tests 24/7, it is an ideal tool to get warned early if your tests are failing or starting to run longer than your agreed SLA instead of getting informed by social media, or Uptime websites.
To stop that from happening let’s detect if our test is taking more than 1.1 minutes.
Exercise
Go back to the Synthetics home page via the menu on the left
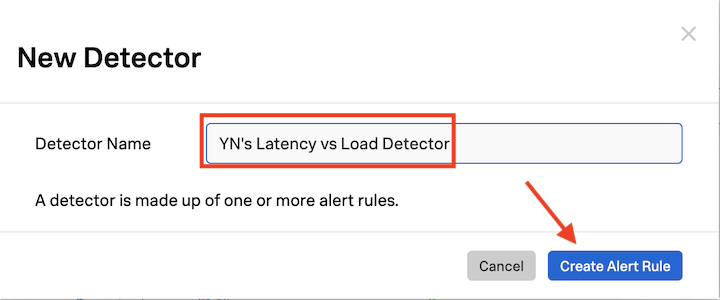
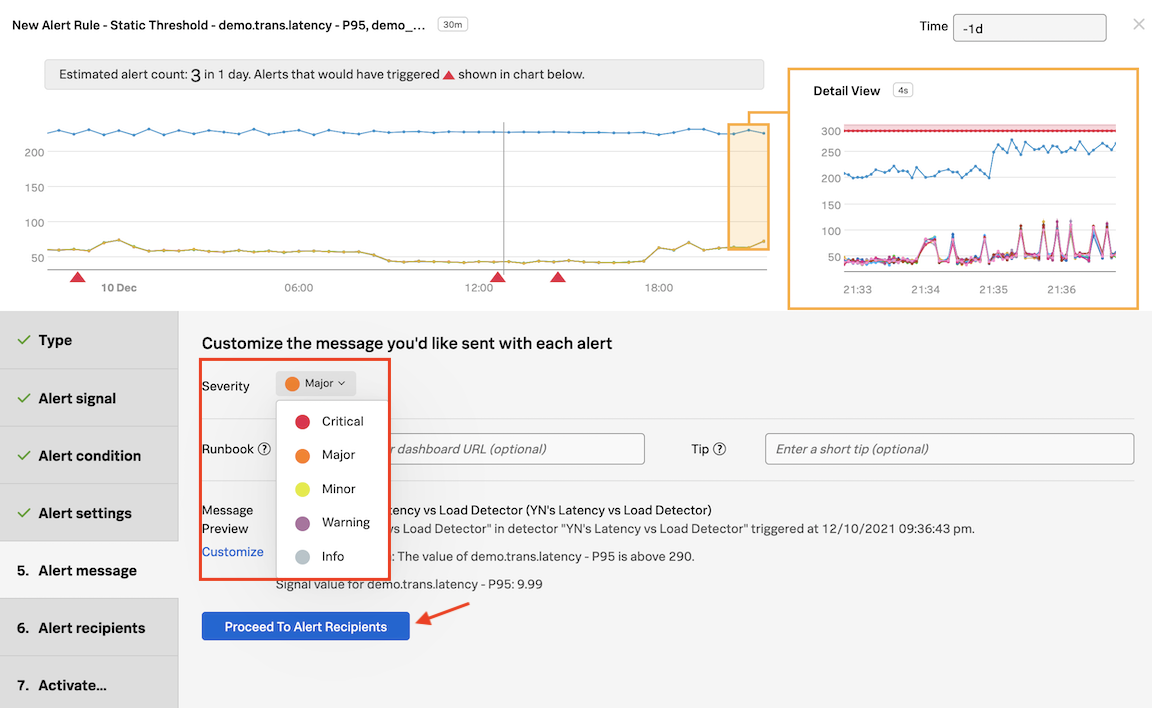
Select the workshop test again and click the Create Detector button at the top of the page.
Edit the text New Synthetics Detector (1) and replace it with INITIALS - [WORKSHOPNAME]`.
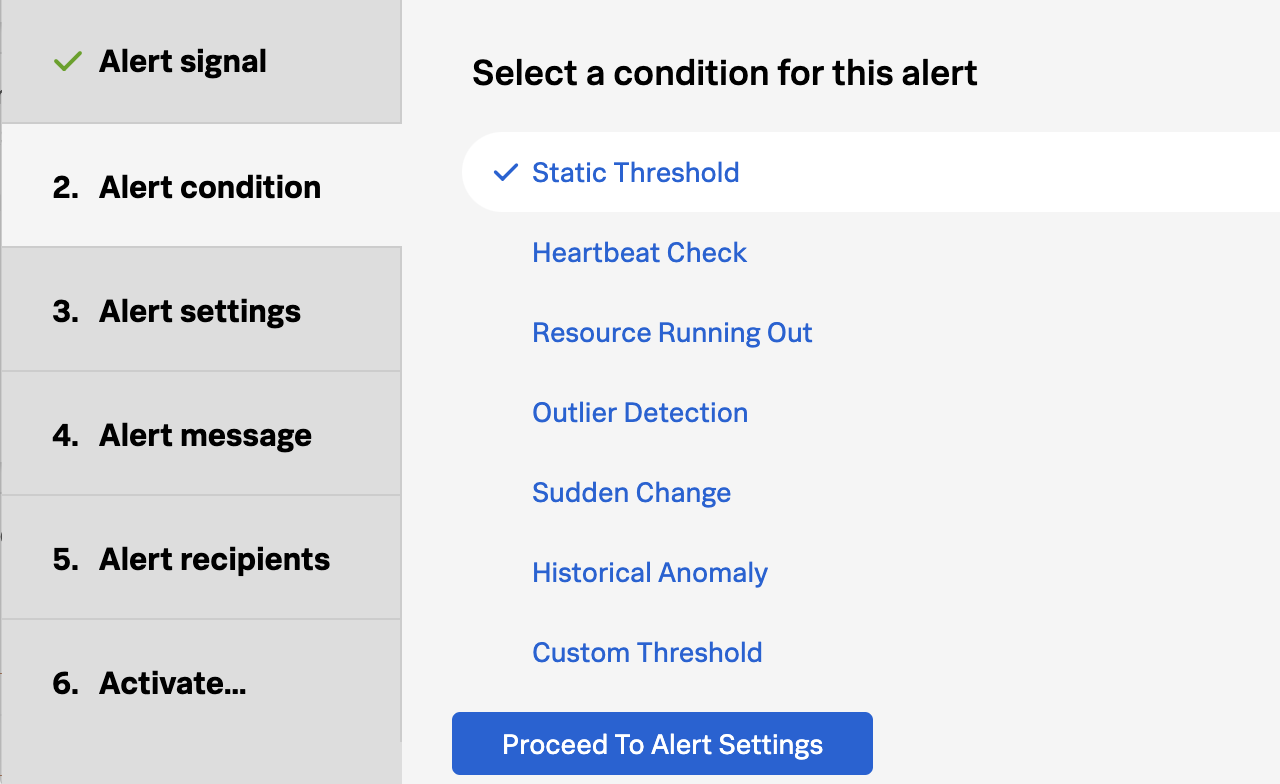
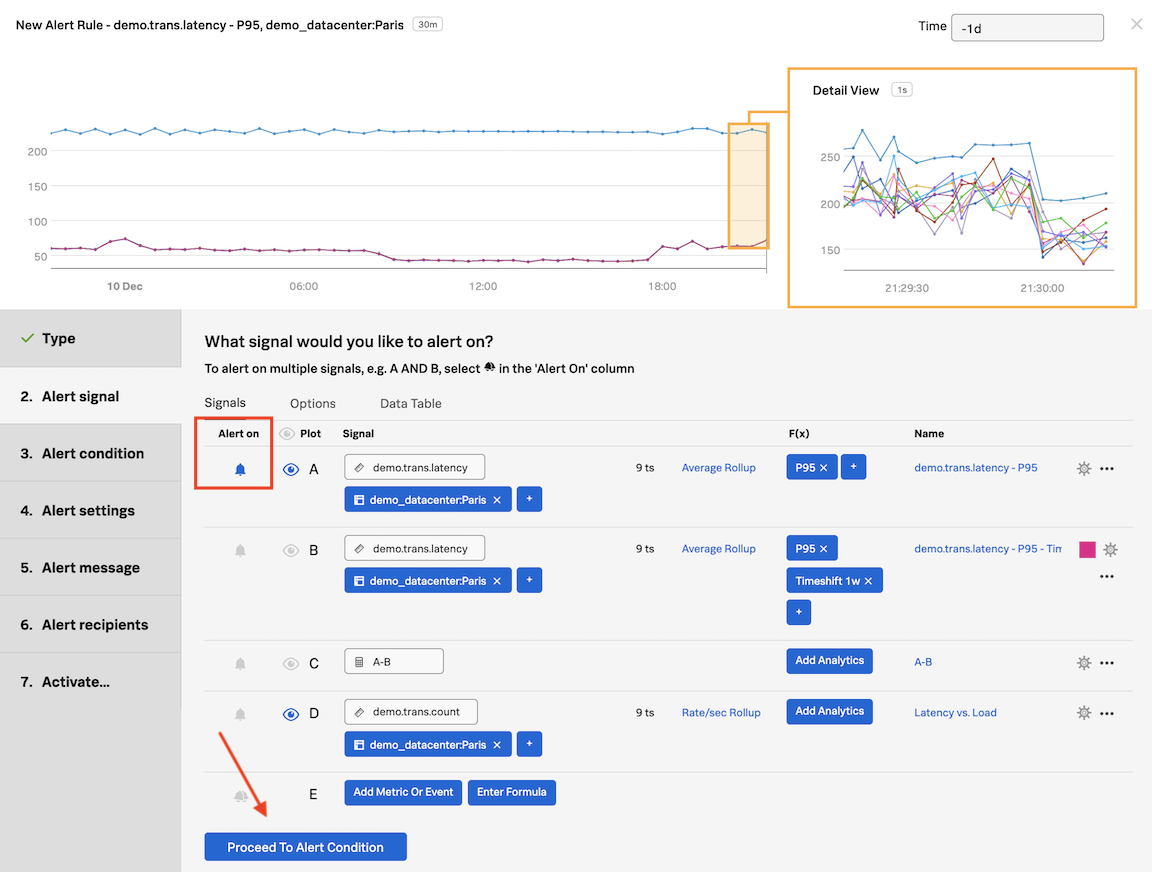
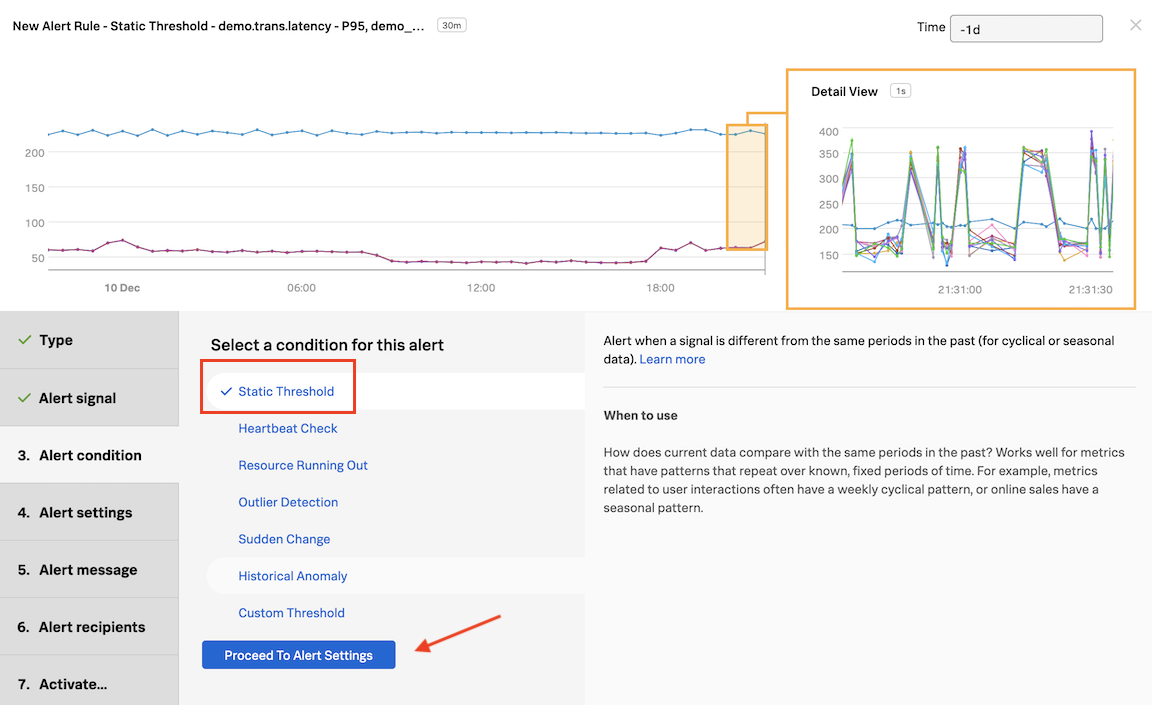
Ensure that Run duration and Static threshold are selected.
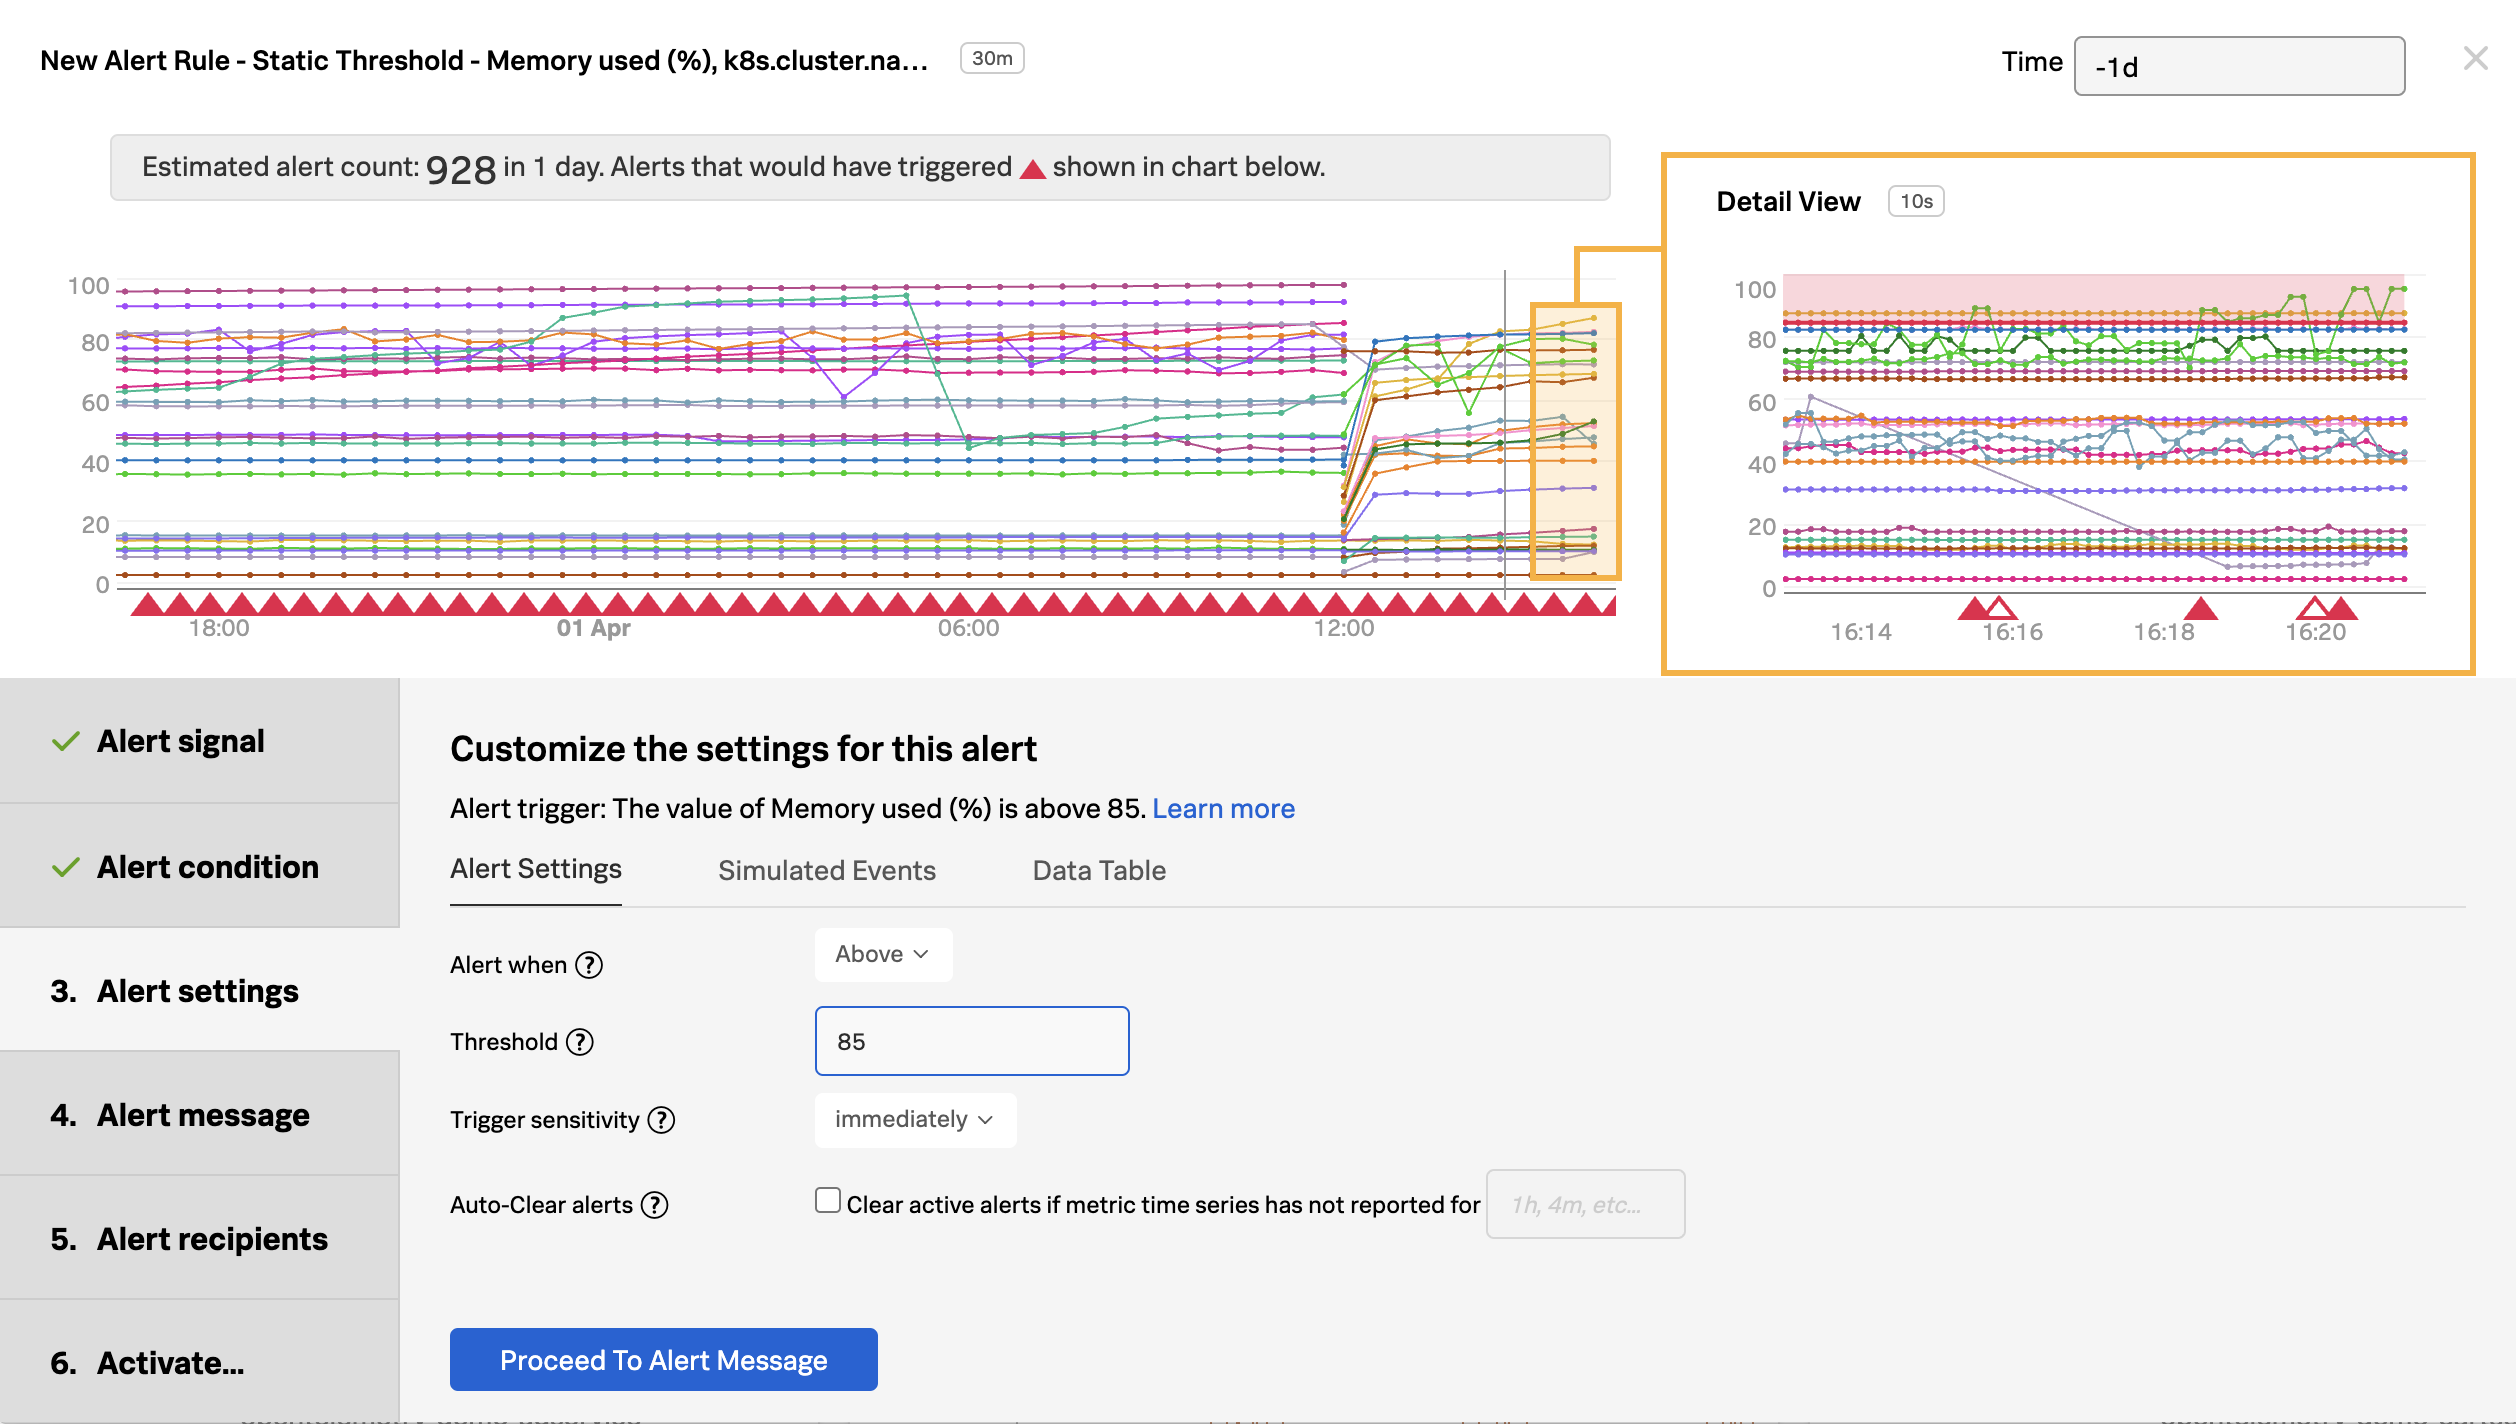
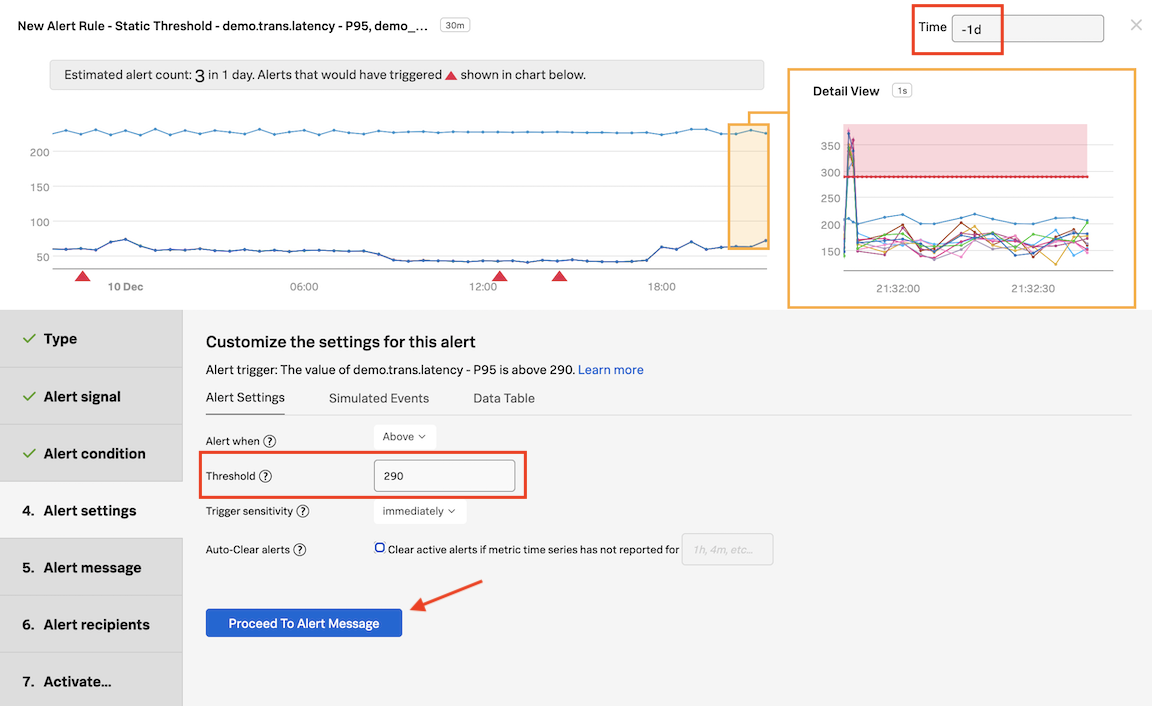
Set the Trigger threshold (2) to be around 65,000 to 68,000 and hit enter to update the chart. Make sure you have more than one spike cutting through the threshold line as shown above (you may have to adjust the threshold value a bit to match your actual latency).
Leave the rest as default.
Note that there is now a row of red and white triangles appearing below the spikes (3). The red triangles let you know that your detector found that your test was above the given threshold & the white triangle indicates that the result returned below the threshold. Each red triangle will trigger an alert.
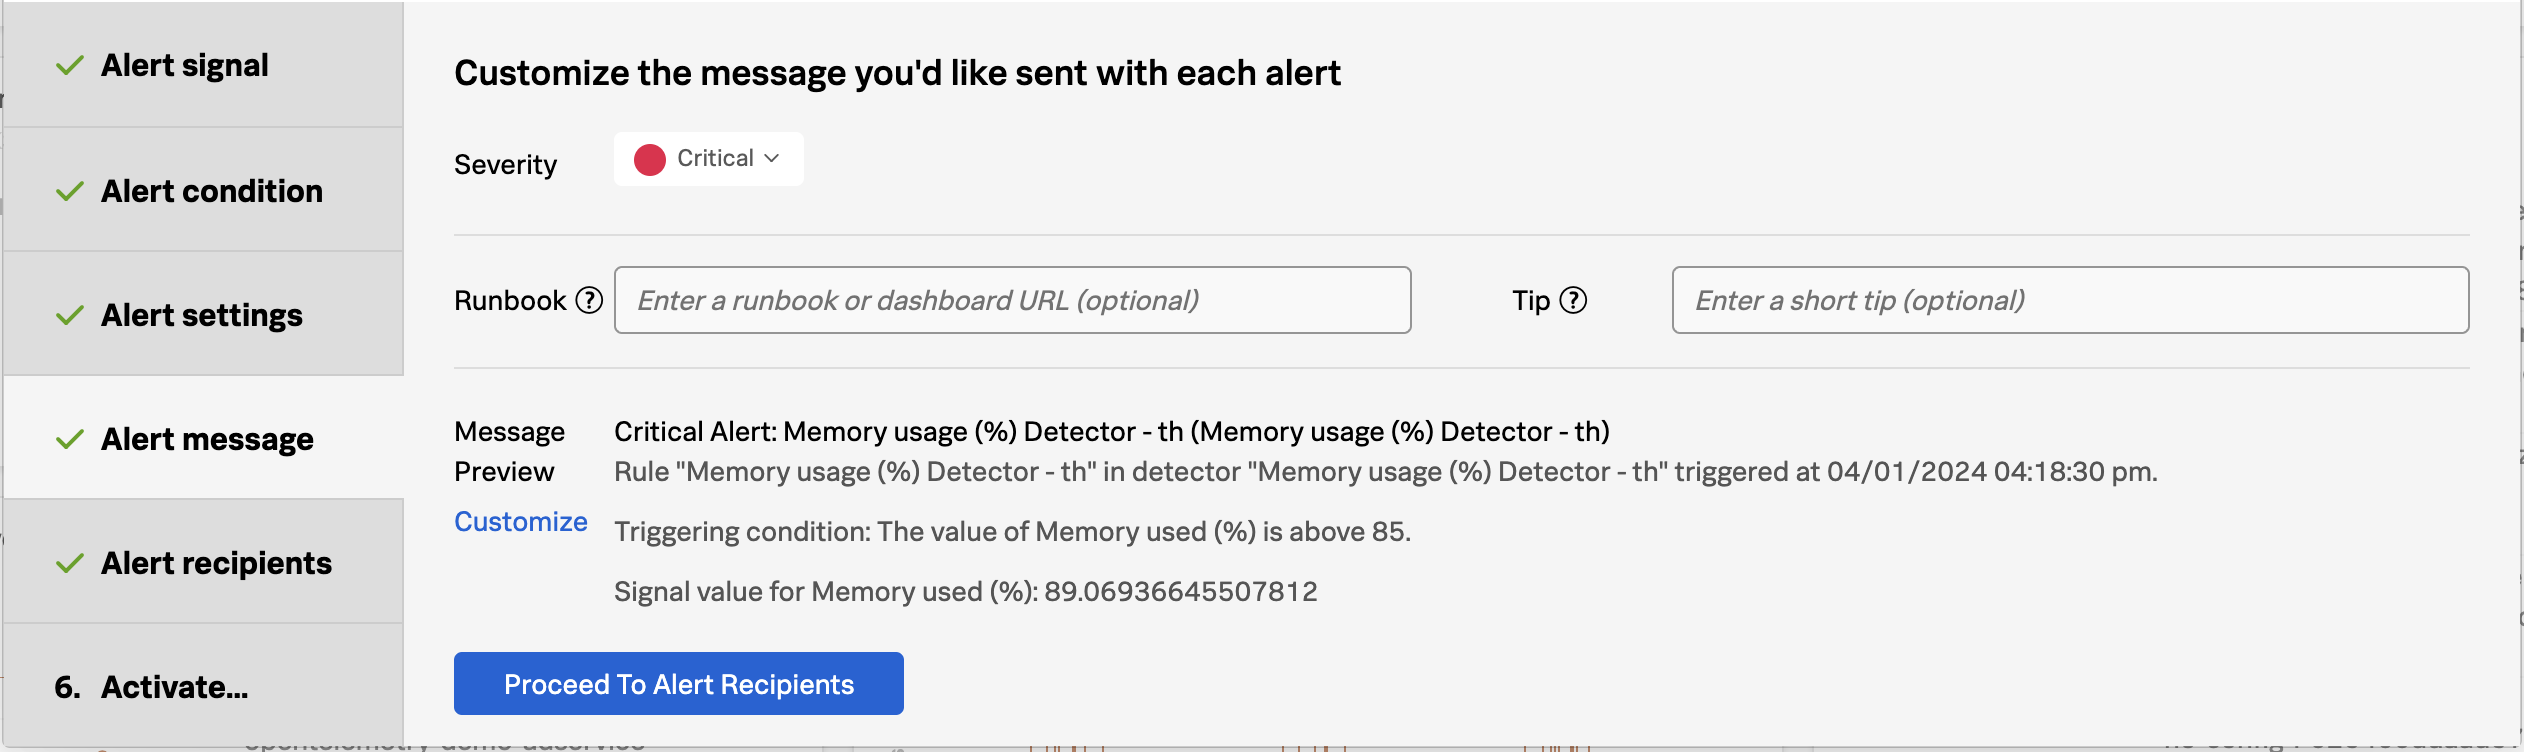
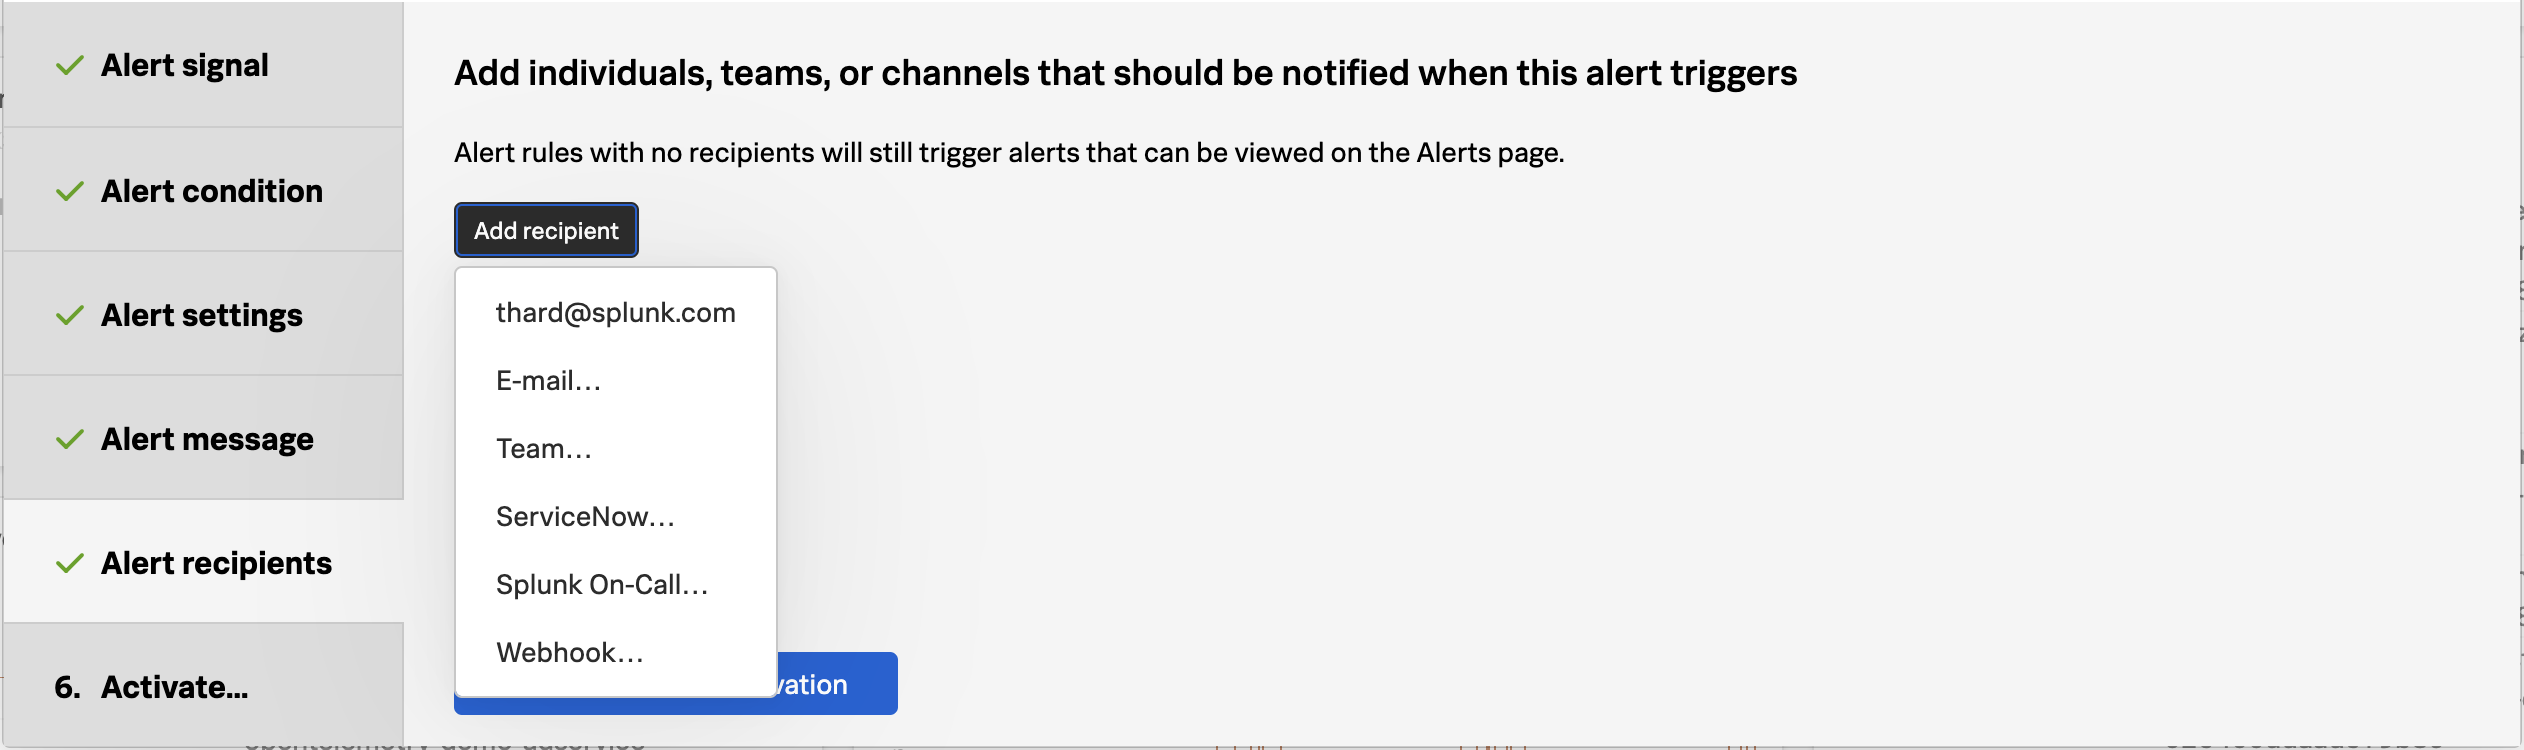
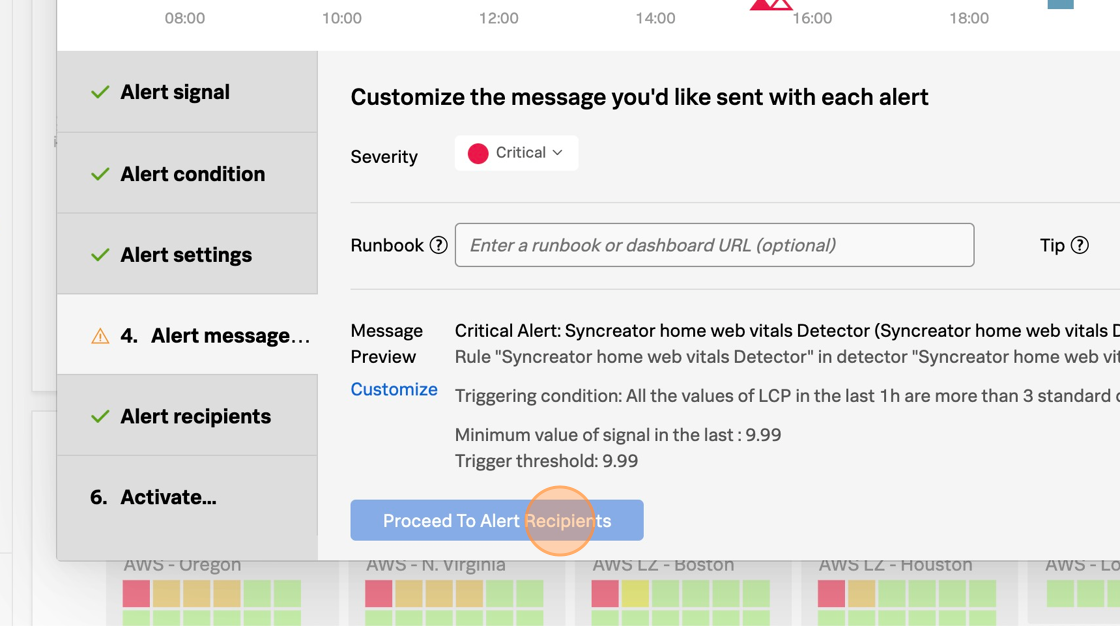
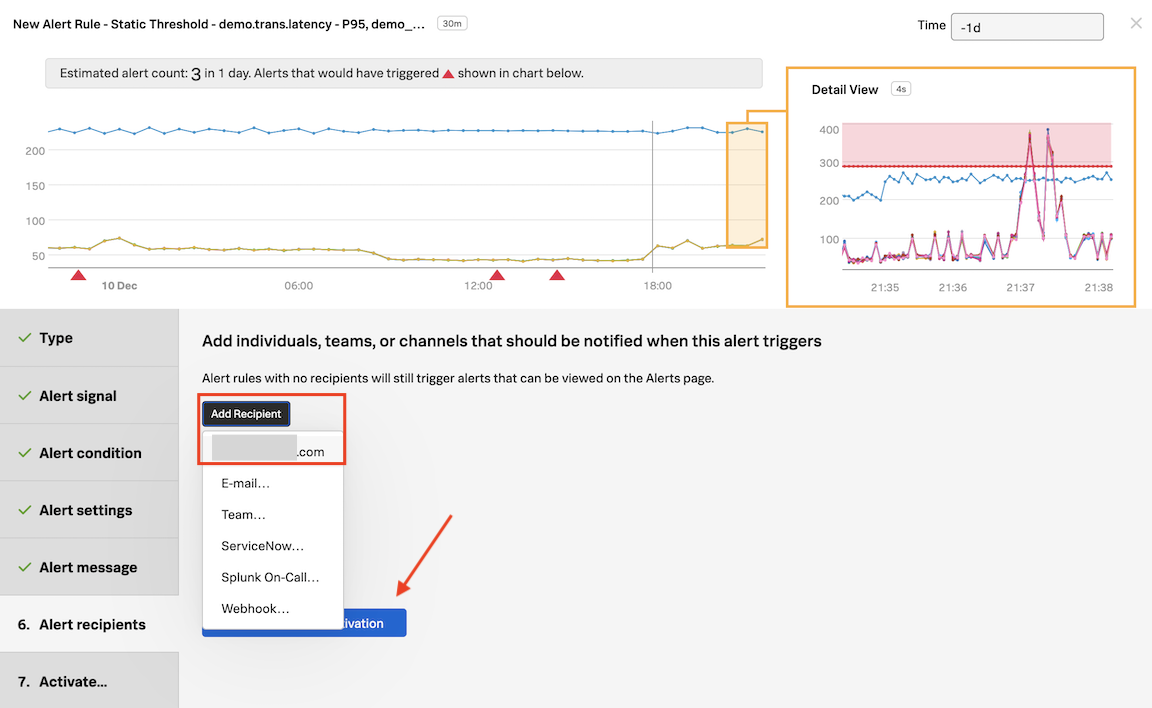
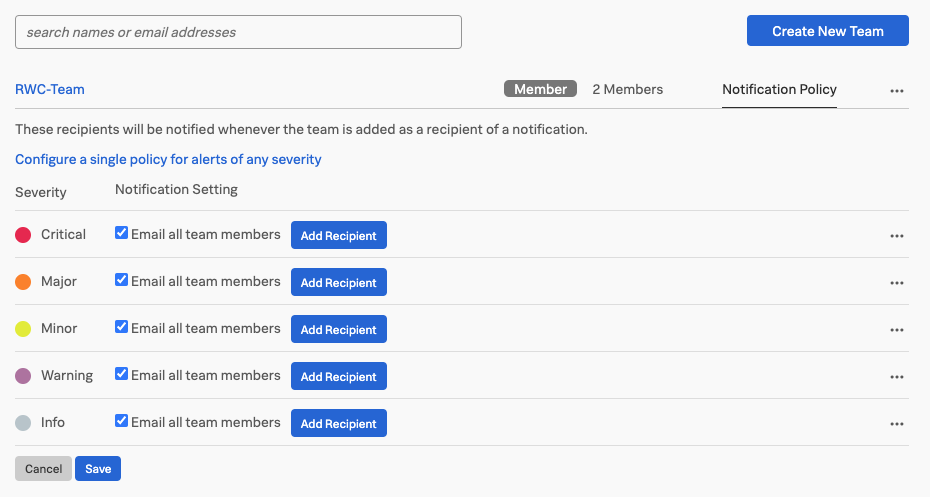
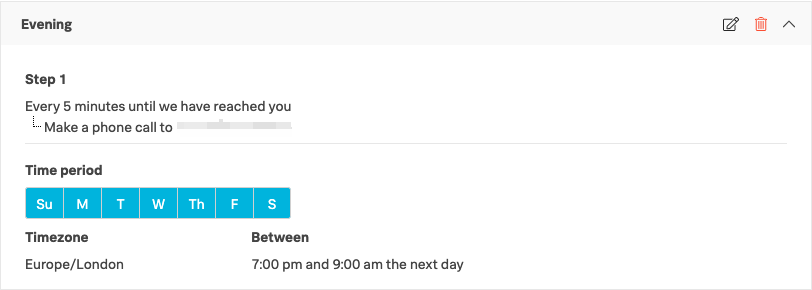
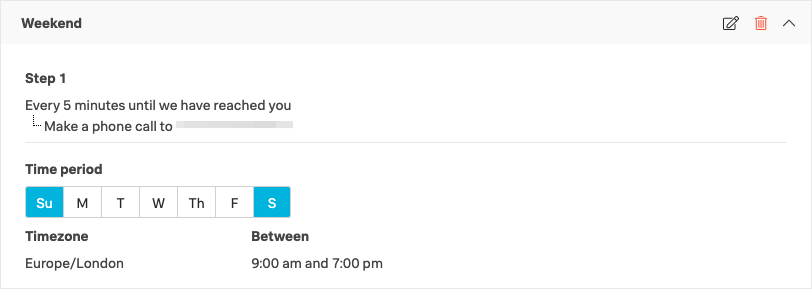
You can change the Alerts criticality (4) by changing the drop-down to a different level, as well as the method of alerting. Make sure you do NOT add a Recipient as this could lead to you being subjected to an alert storm!
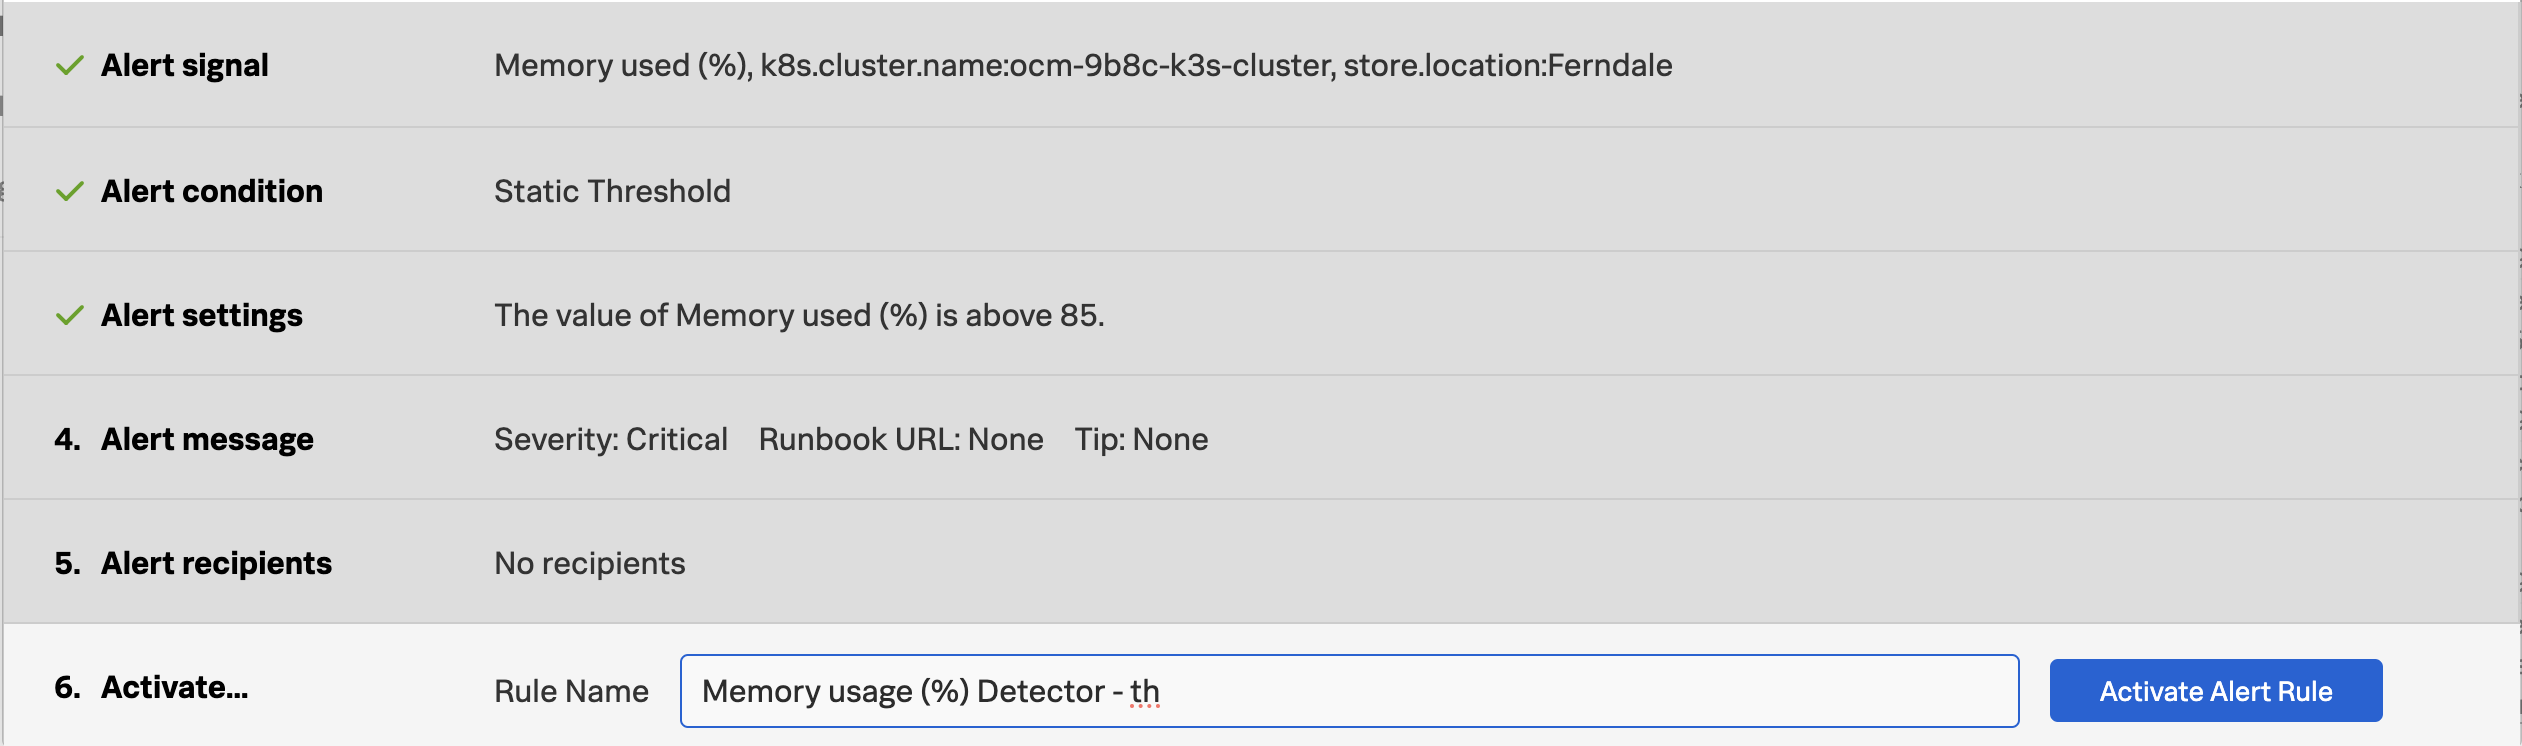
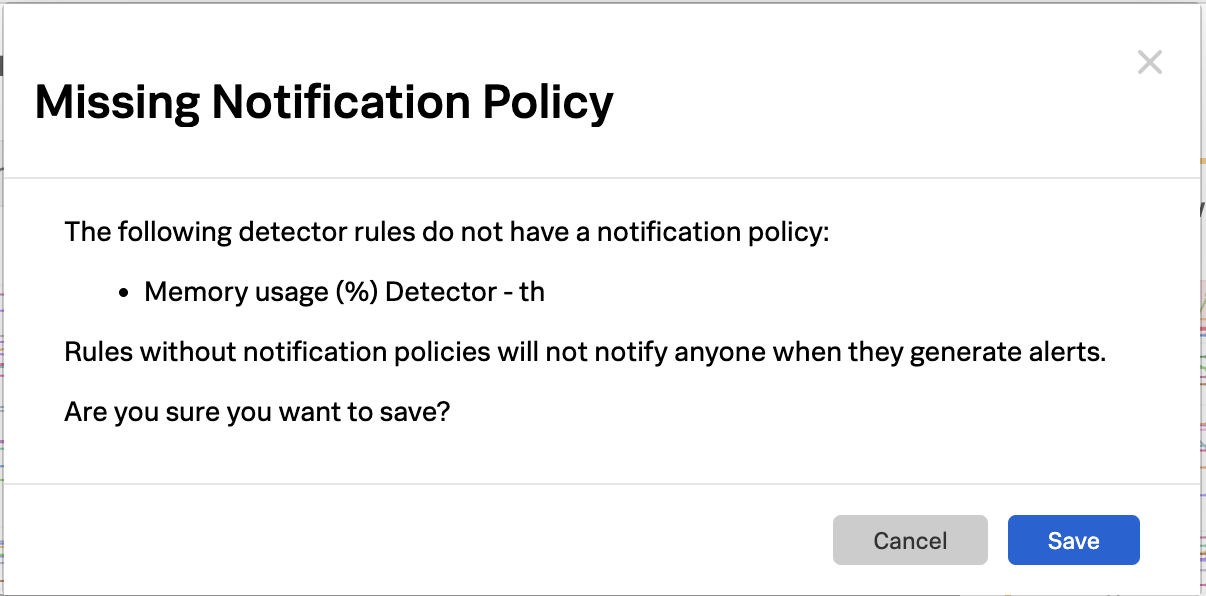
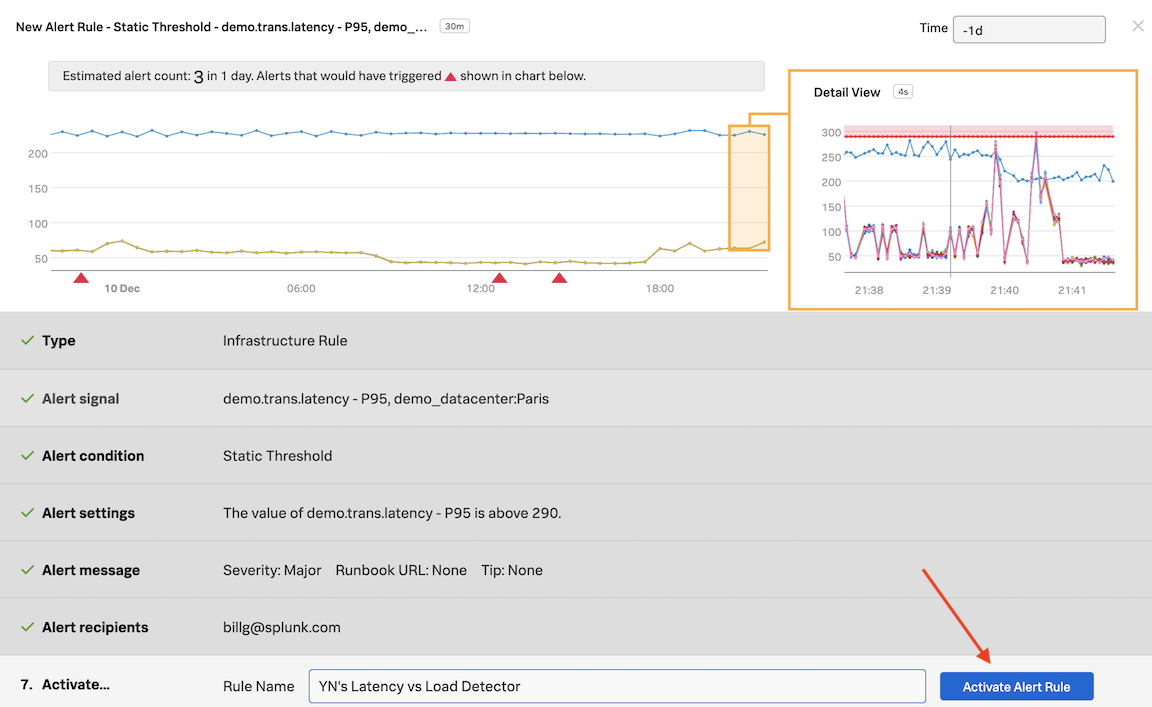
Click Activate to deploy your detector.
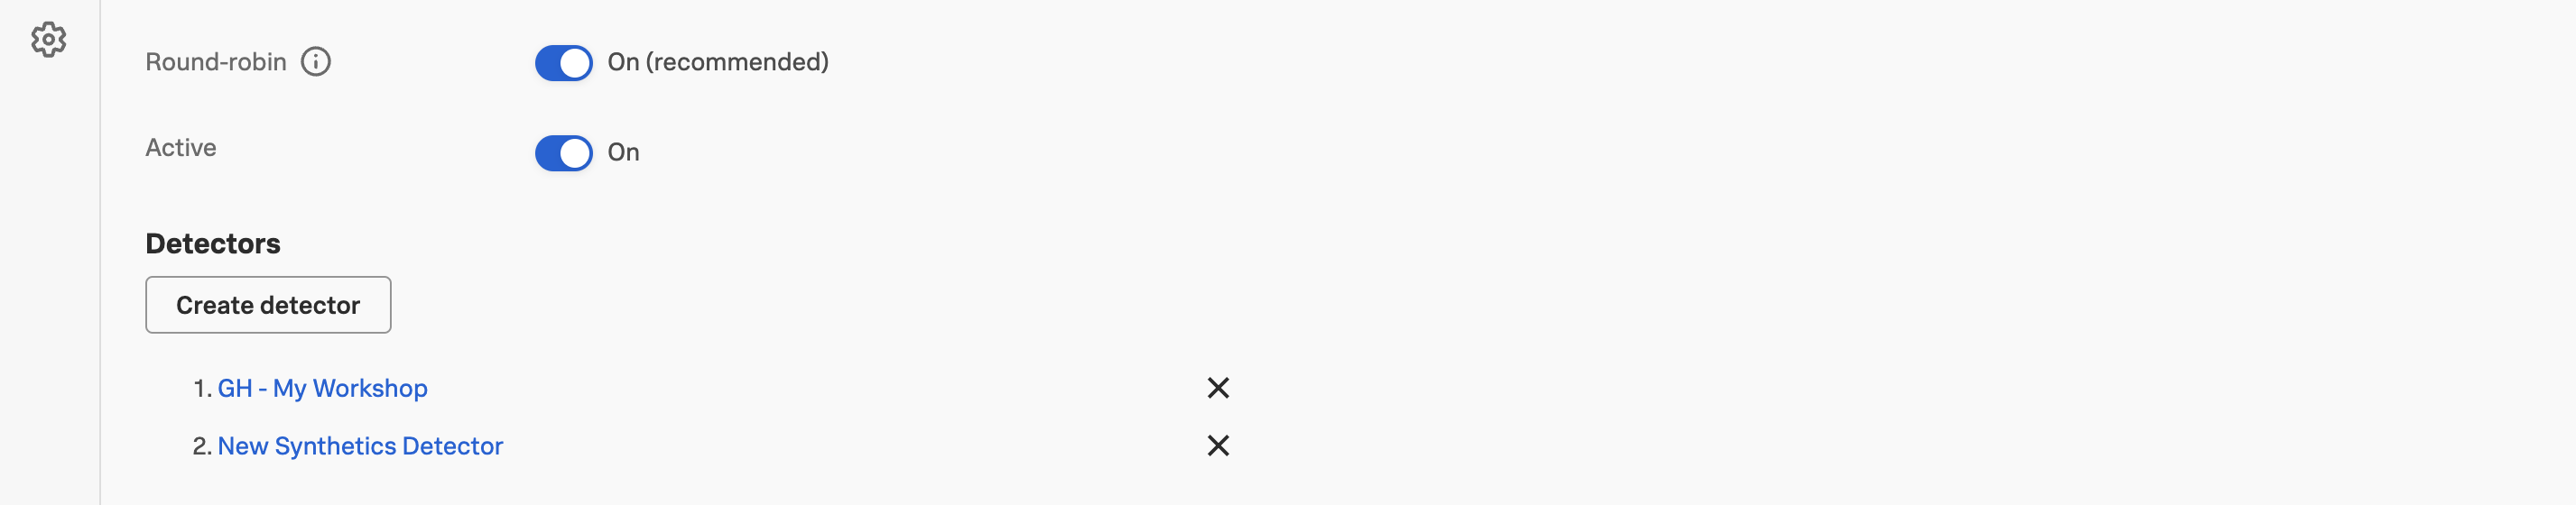
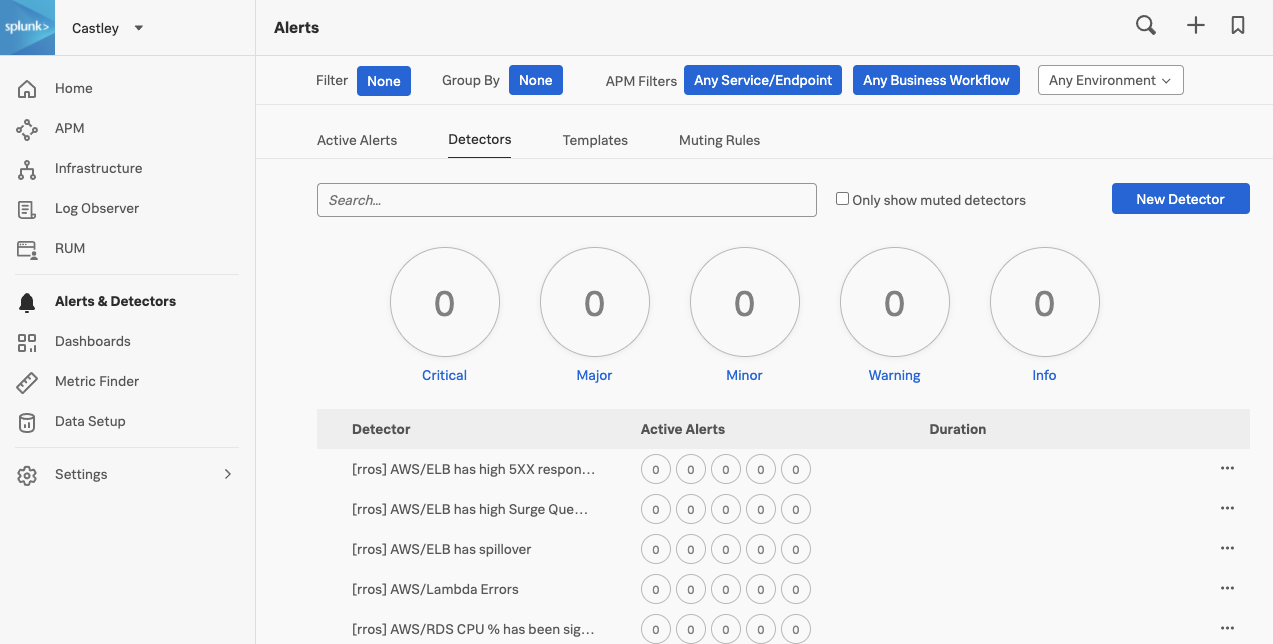
To see your new created detector click Edit Test button
At the bottom of the page is a list of active detectors.
If you can’t find yours, but see one called New Synthetic Detector, you may not have saved it correctly with your name. Click on the New Synthetic Detector link, and redo the rename.
Click on the Close button to exit the edit mode.
Custom Service Health Dashboard 🏥
15 minutes
Persona
As the SRE hat suits you let’s keep it on as you have been asked to build a custom Service Health Dashboard for the paymentservice. The requirement is to display RED metrics, logs and Synthetic test duration results.
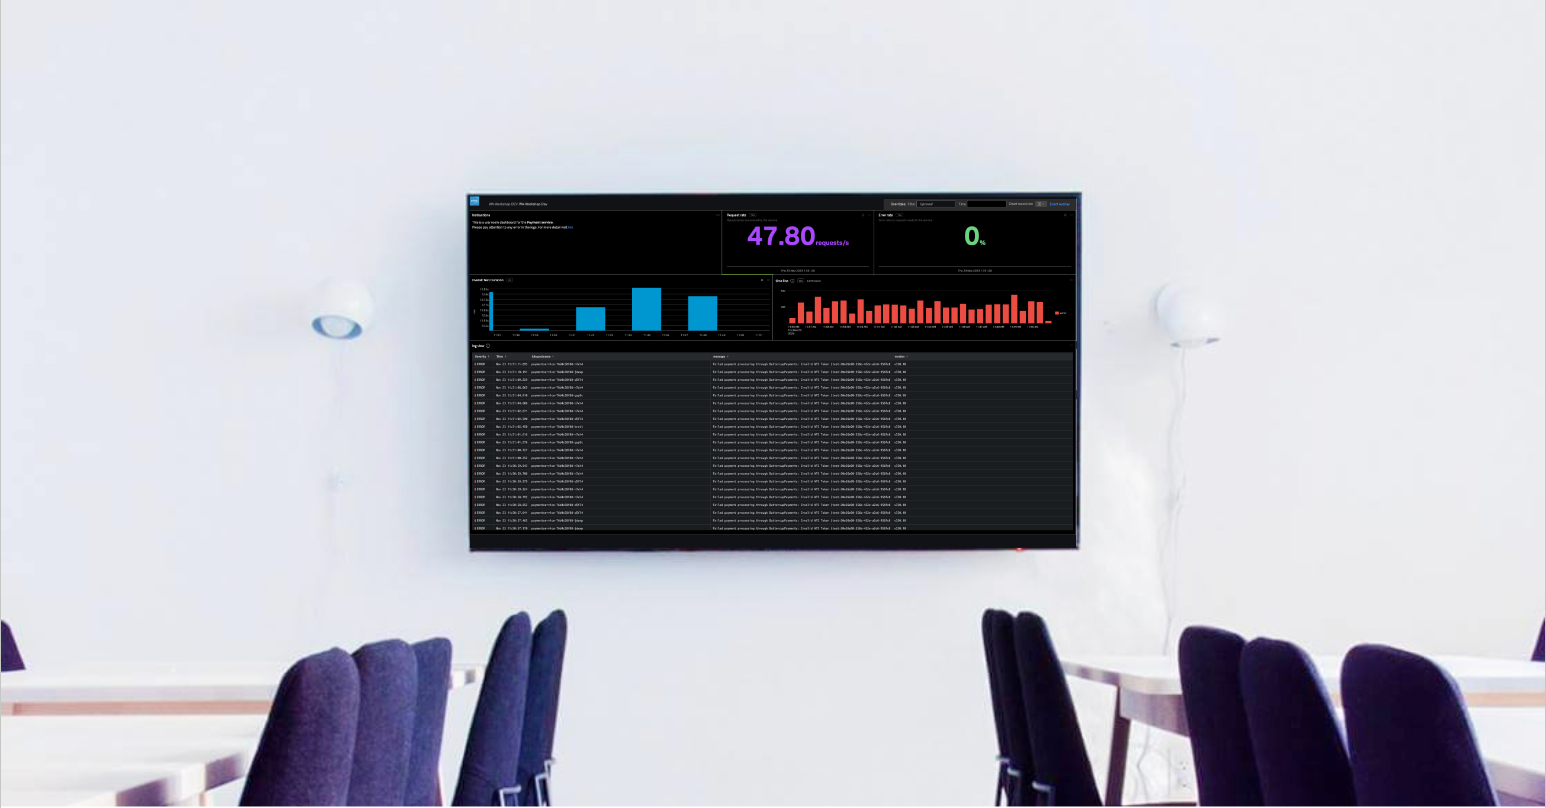
It is common for development and SRE teams to require a summary of the health of their applications and/or services. More often or not these are displayed on wall-mounted TVs. Splunk Observability Cloud has the perfect solution for this by creating custom dashboards.
In this section we are going to build a Service Health Dashboard we can use to display on teams’ monitors or TVs.
Subsections of Custom Service Health Dashboard 🏥
Enhancing the Dashboard
As we already saved some useful log charts in a dashboard in the Log Observer exercise, we are going to extend that dashboard.
Exercise
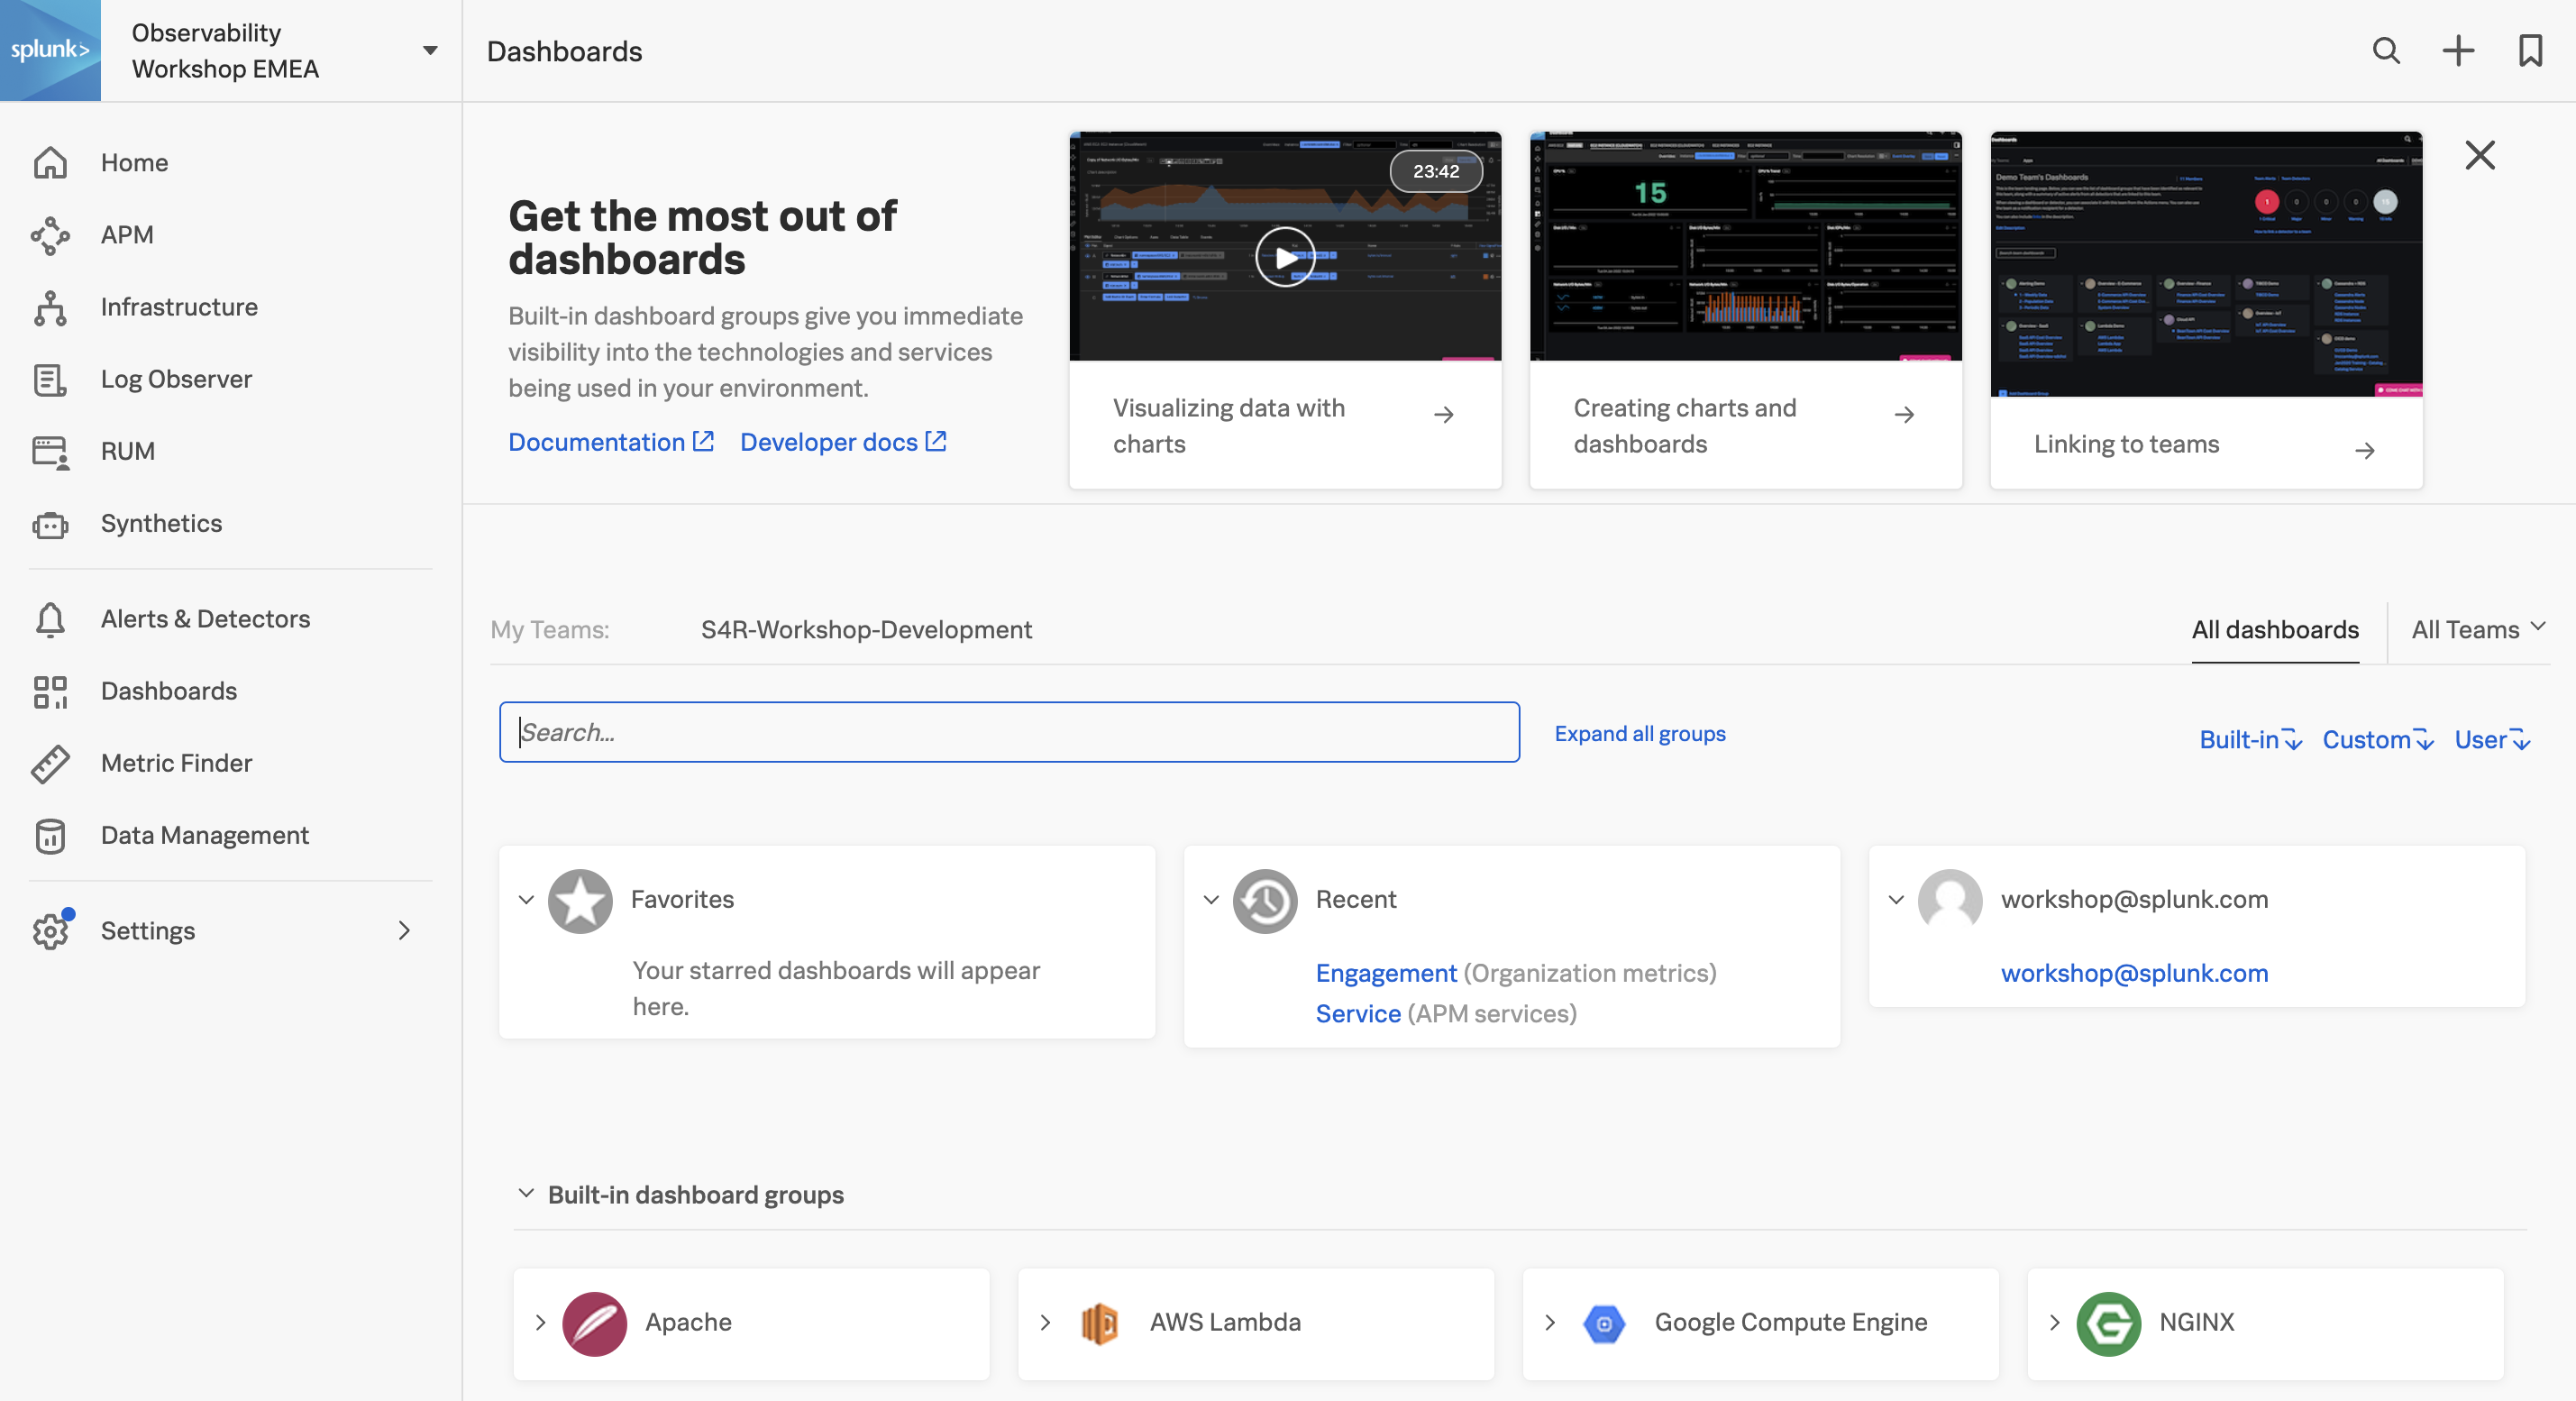
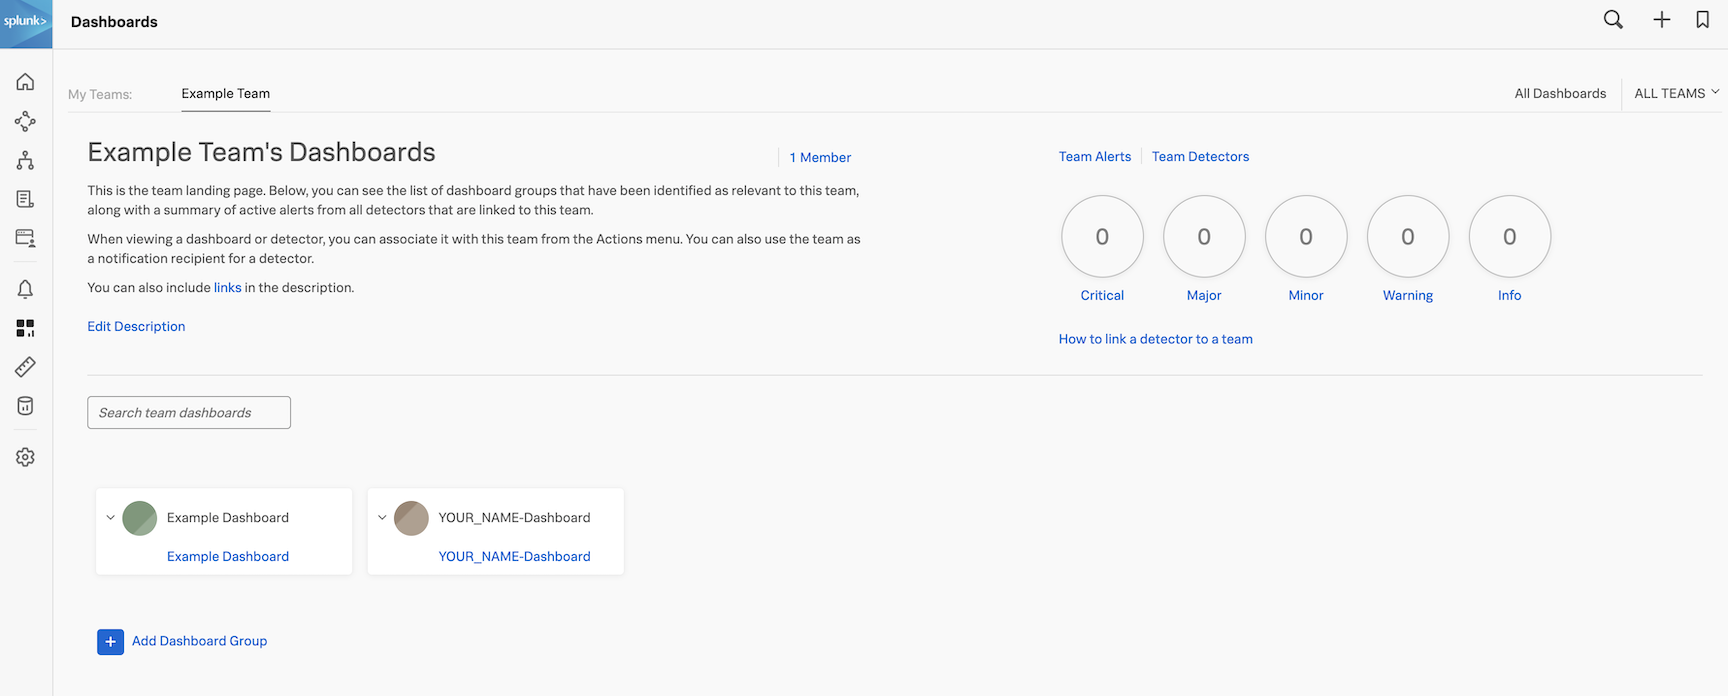
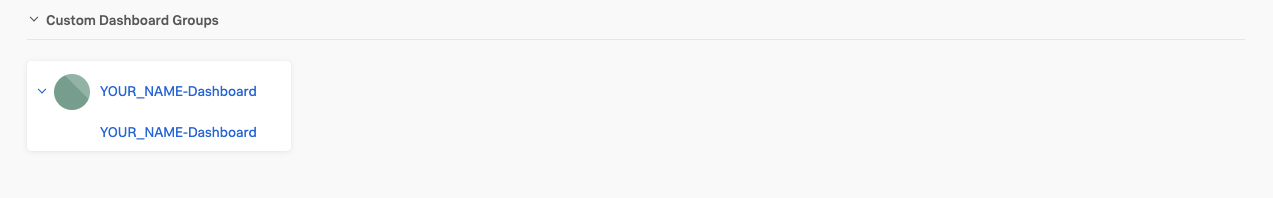
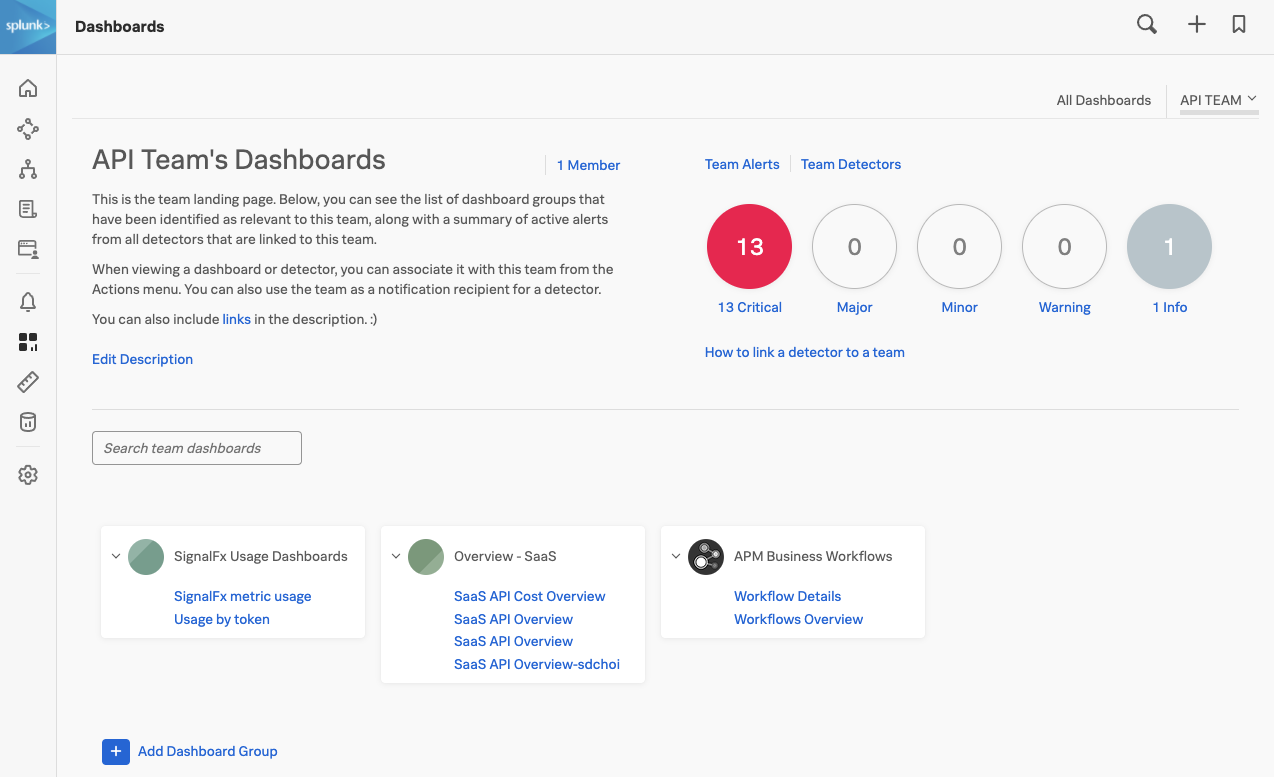
To get back to your dashboard with the two log charts, click on Dashboards from the main menu and you will be taken to your Team Dashboard view. Under Dashboards click in Search dashboards to search for your Service Health Dashboard group.
Click on the name and this will bring up your previously saved dashboard.
Even if the log information is useful, it will need more information to have it make sense for our team so let’s add a bit more information
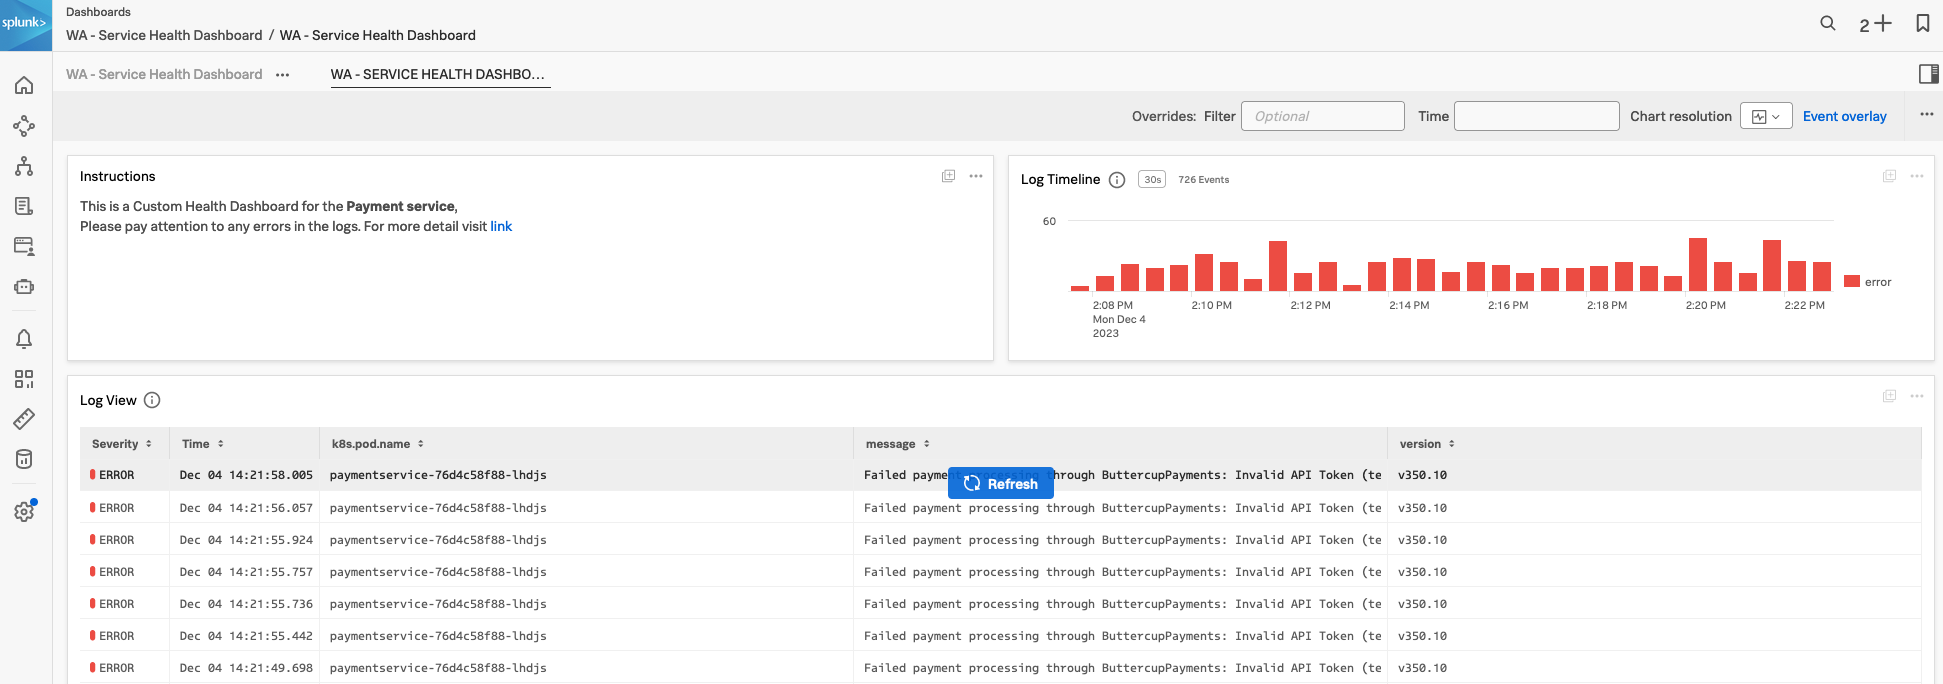
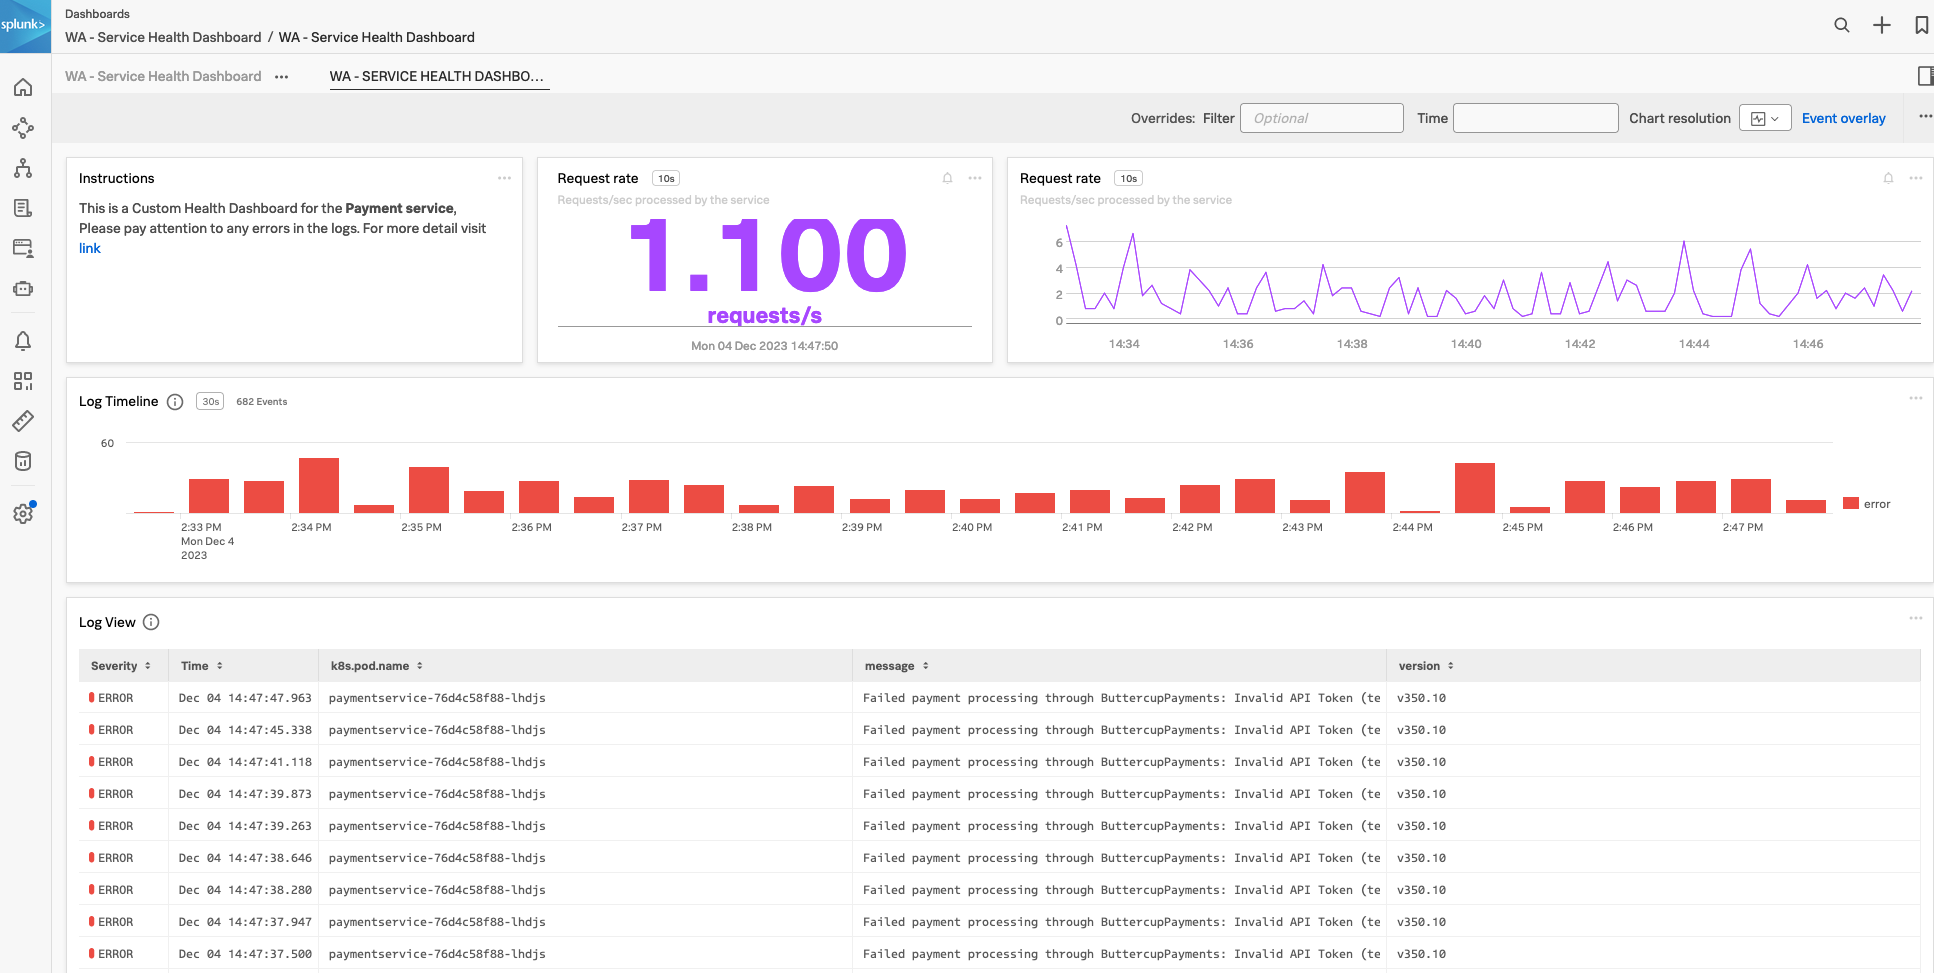
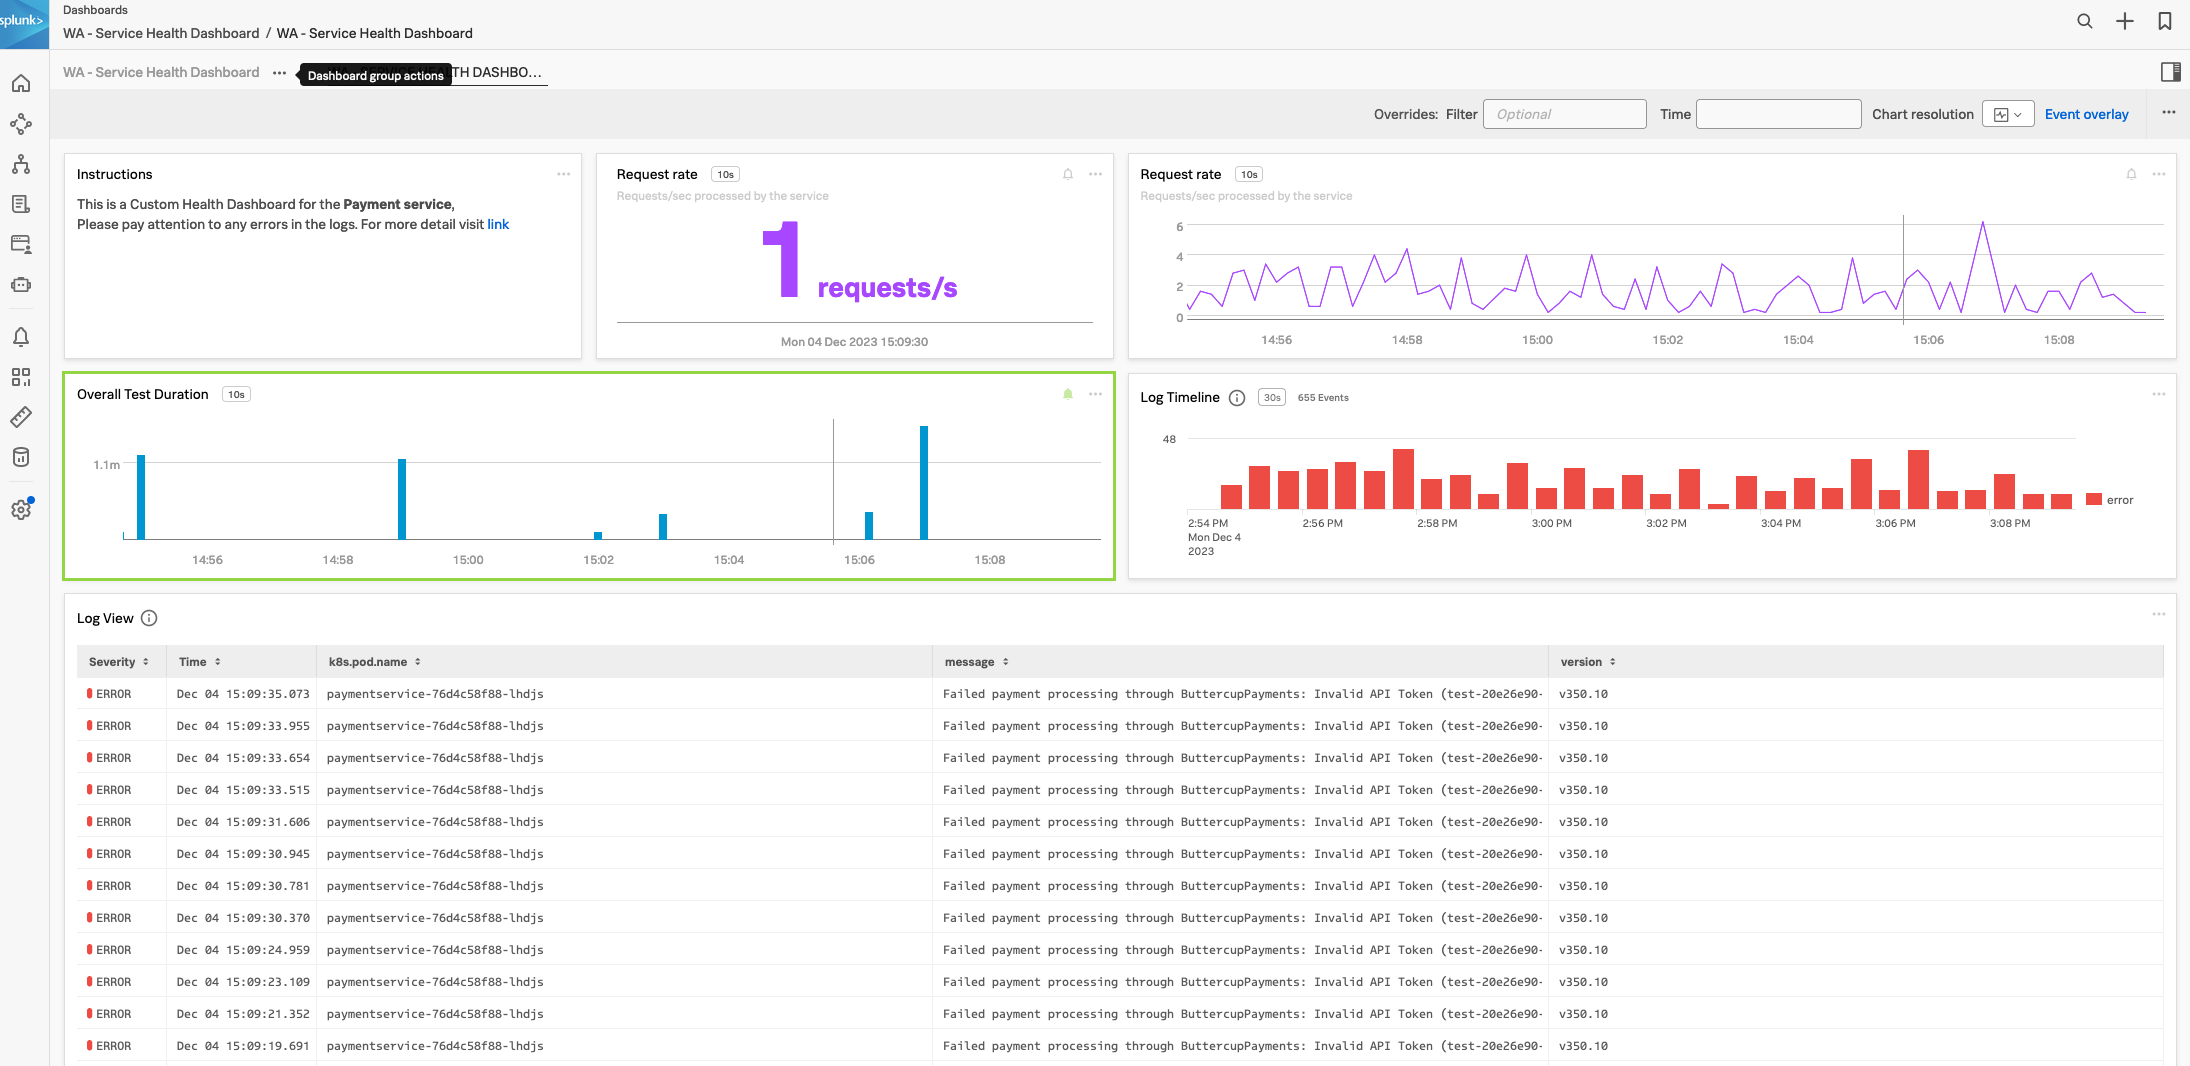
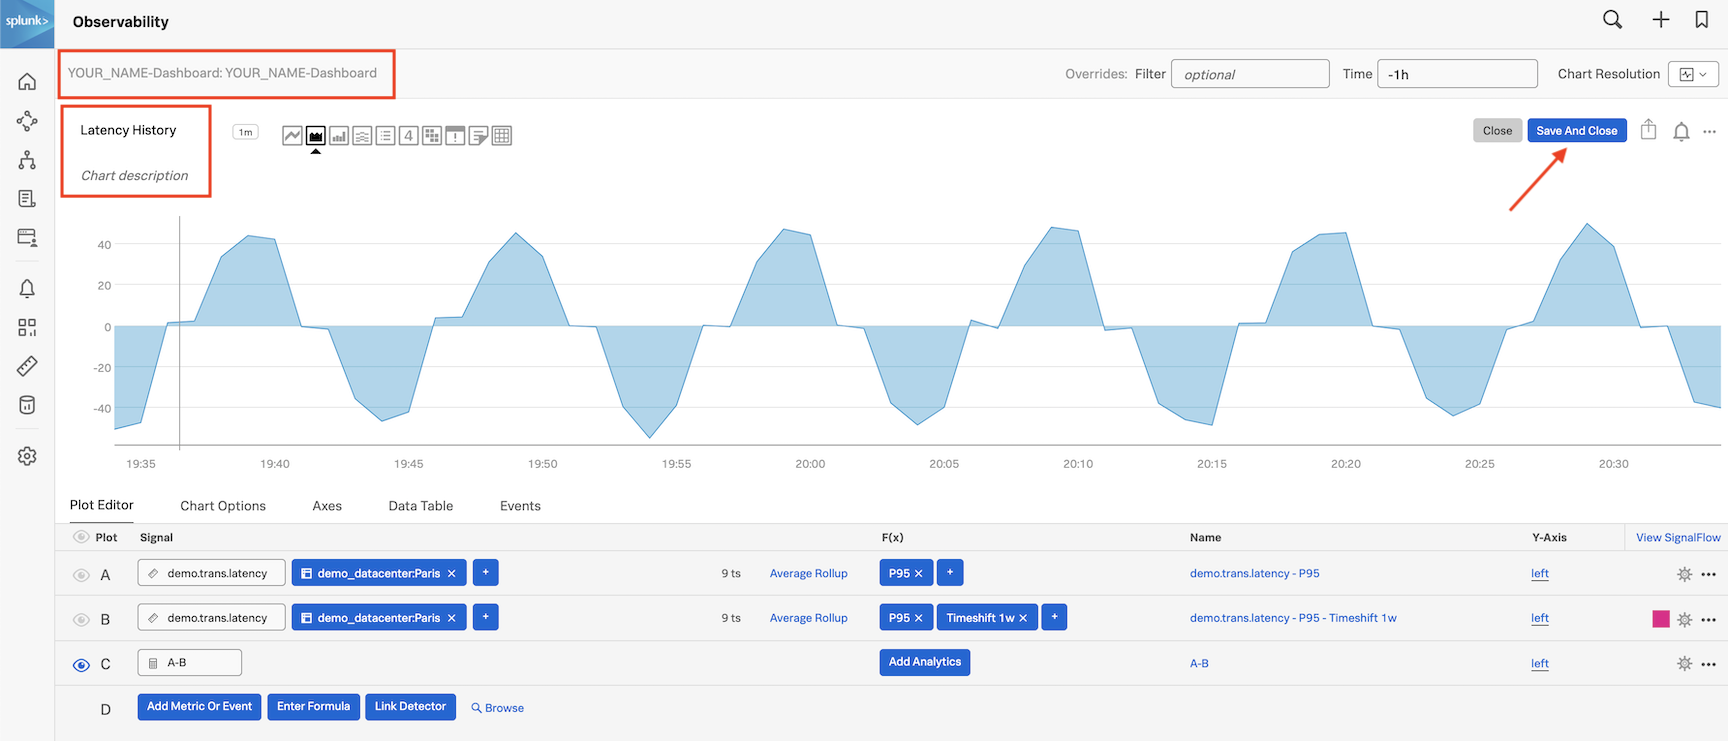
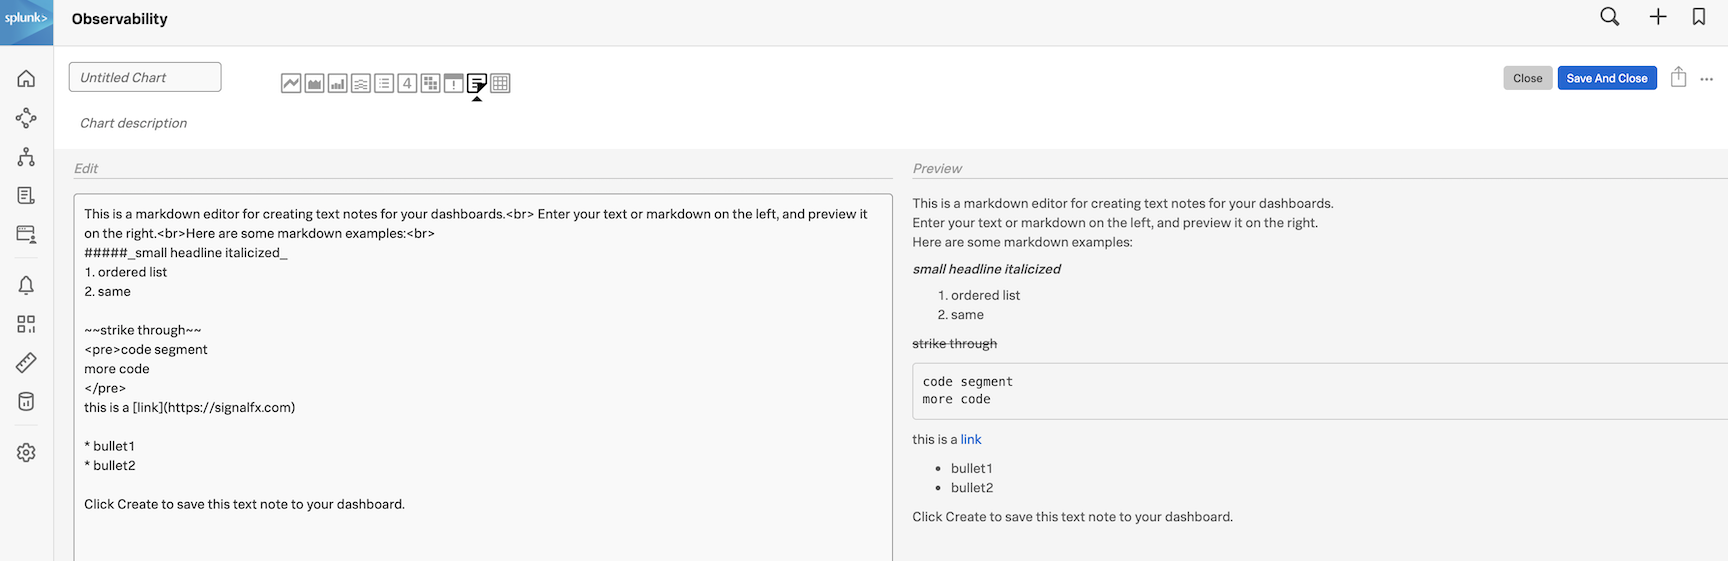
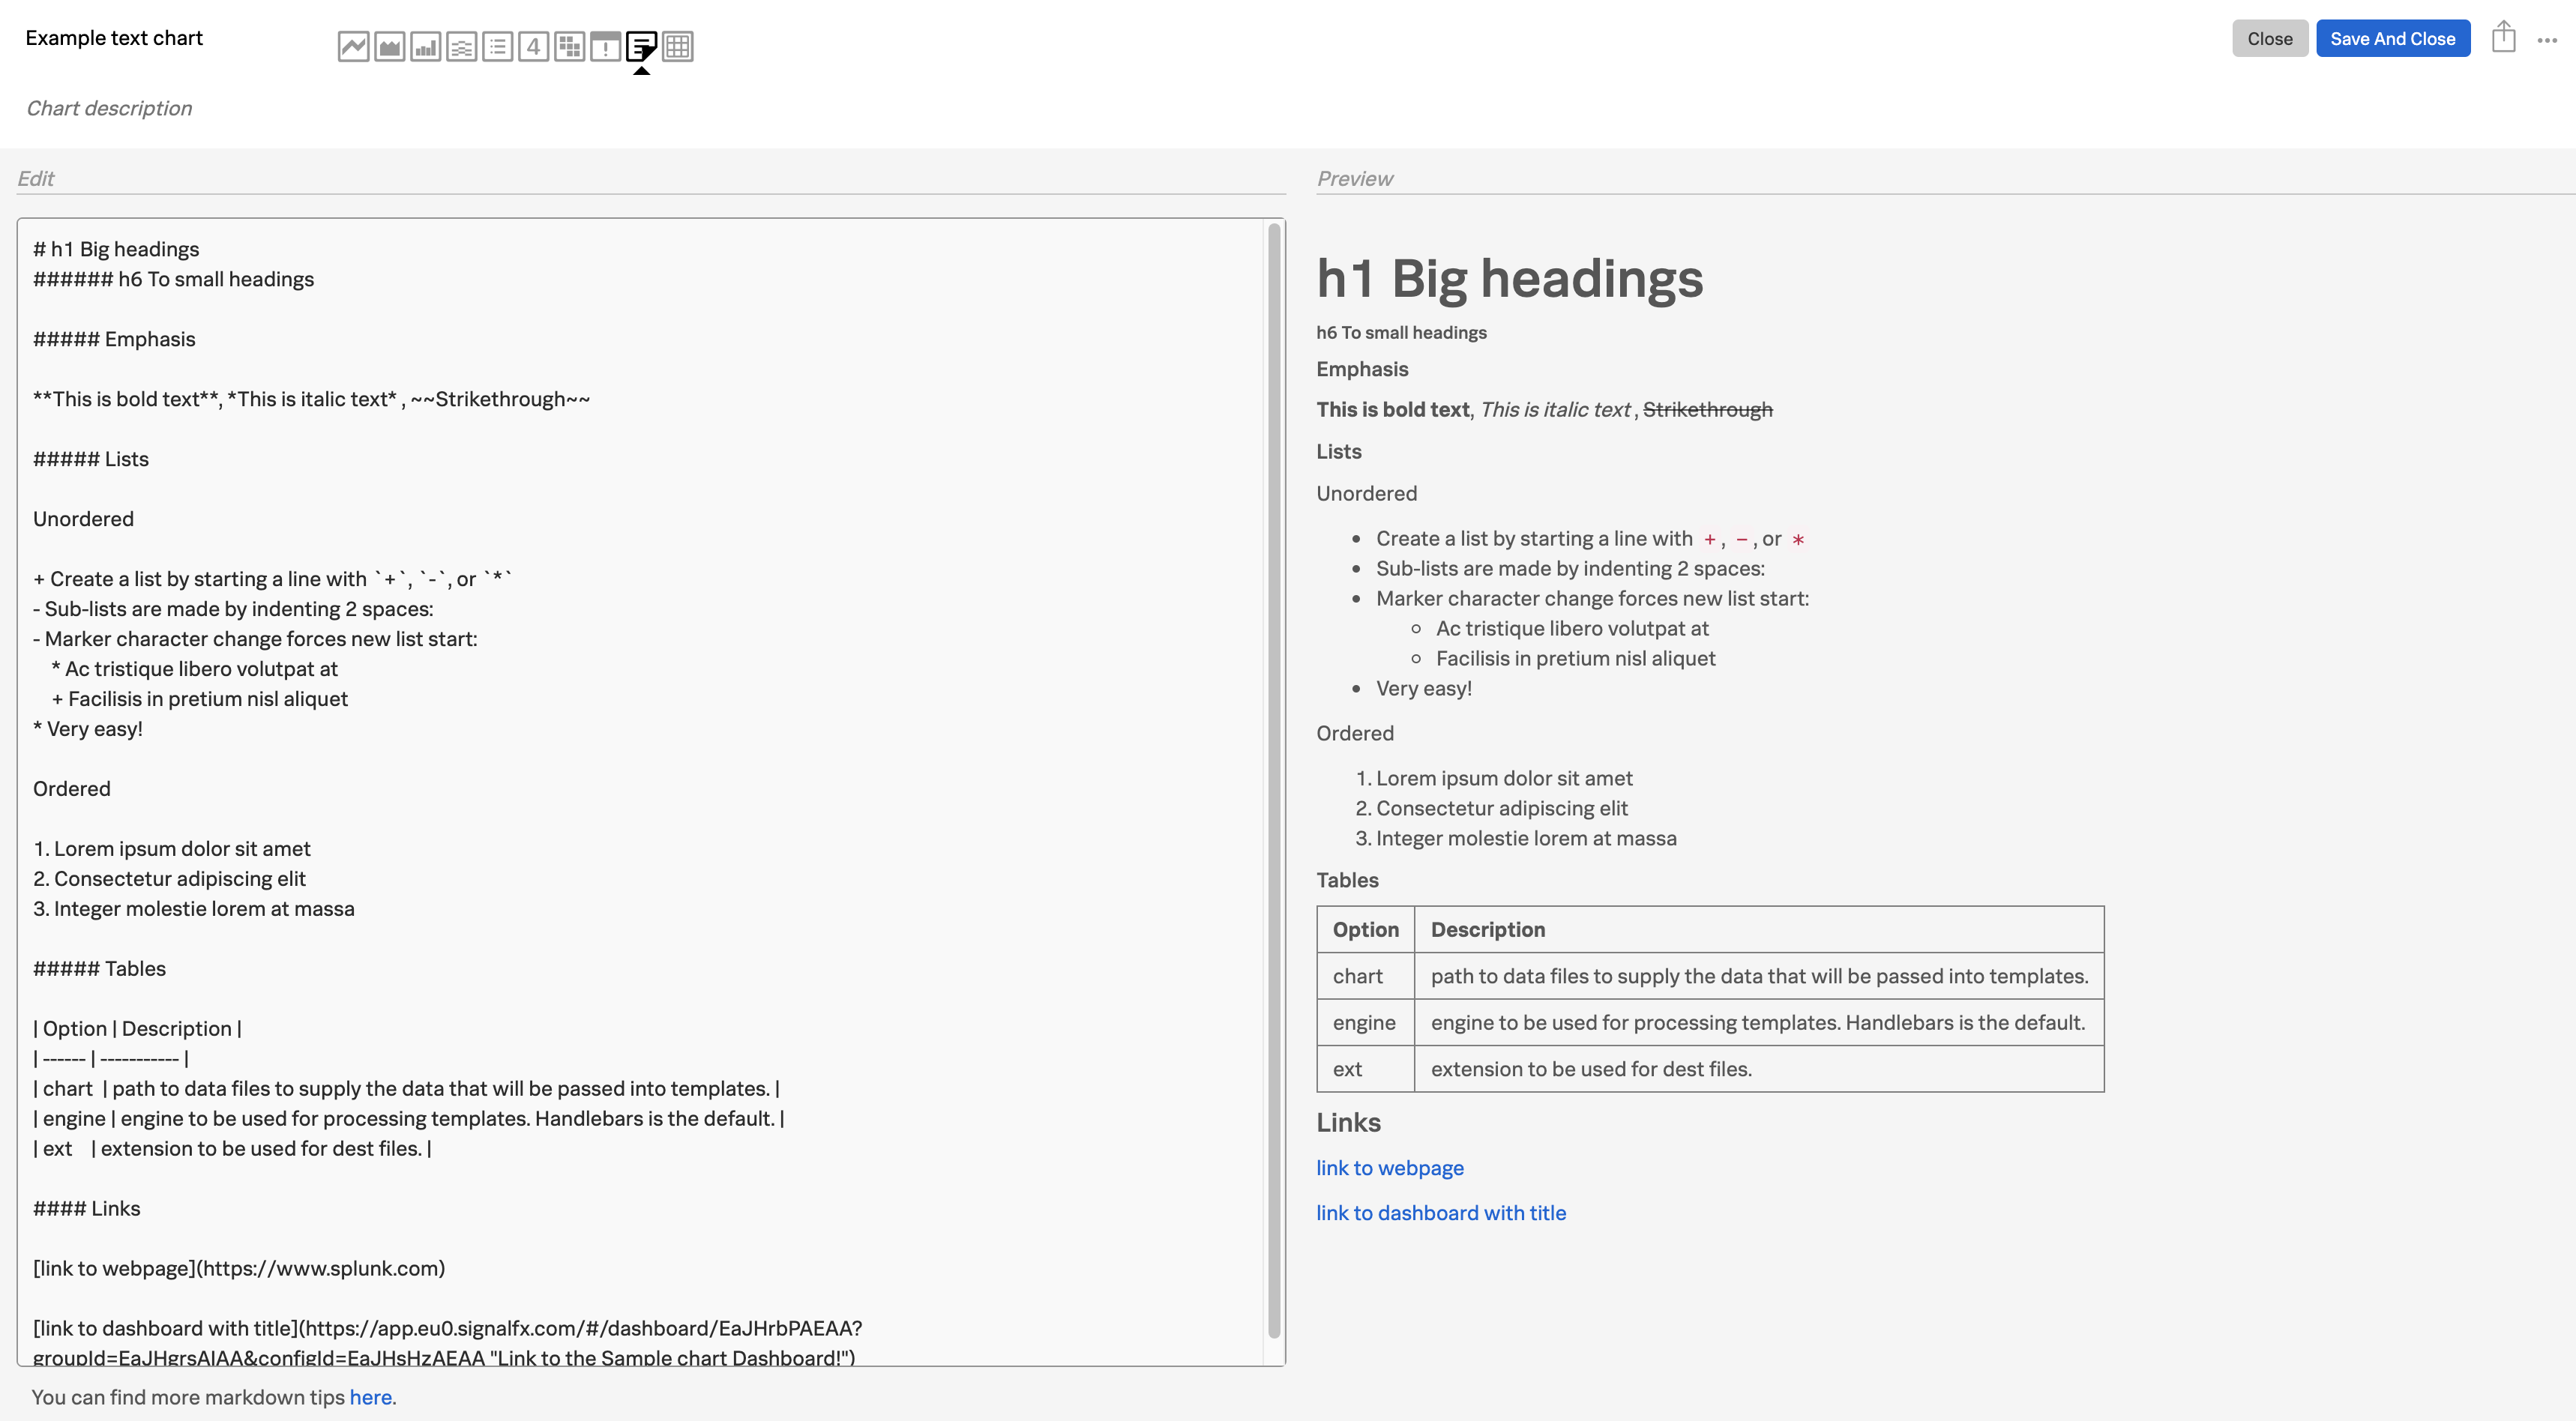
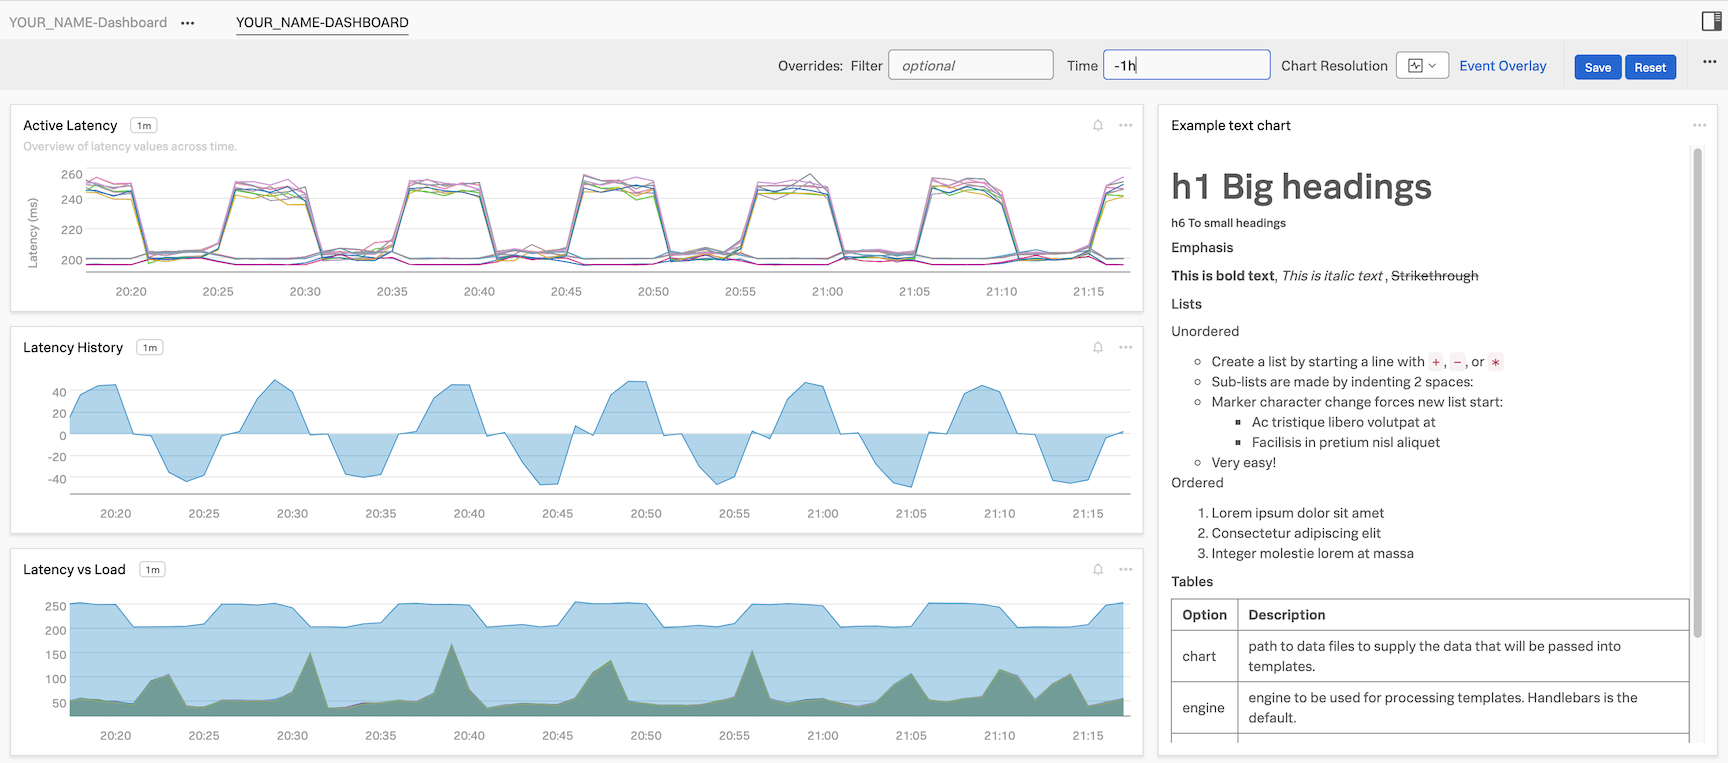
The first step is adding a description chart to the dashboard. Click on the New text note and replace the text in the note with the following text and then click the Save and close button and name the chart Instructions
Information to use with text note
This is a Custom Health Dashboard for the **Payment service**,
Please pay attention to any errors in the logs.
For more detail visit [link](https://https://www.splunk.com/en_us/products/observability.html)
The charts are not in a nice order, let’s correct that and rearrange the charts so that they are useful.
Move your mouse over the top edge of the Instructions chart, your mouse pointer will change to a ☩. This will allow you to drag the chart in the dashboard. Drag the Instructions chart to the top left location and resize it to a 1/3rd of the page by dragging the right-hand edge.
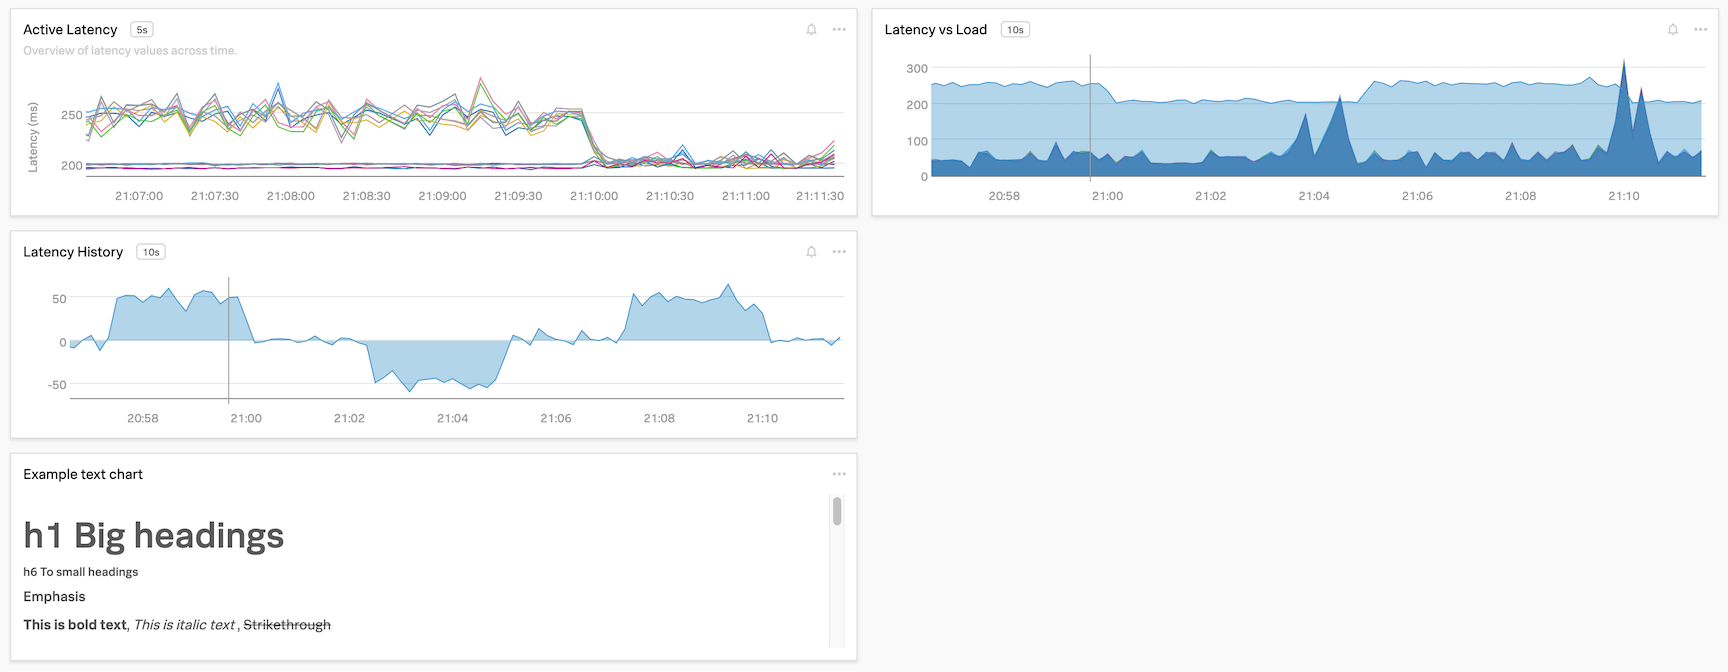
Drag and add the Log Timeline view chart next to the Instruction chart, resize it so it fills the other 2/3rd of the page to be the error rate chart next to the two the chart and resize it so it fills the page
Next, resize the Log lines chart to be the width of the page and resize it the make it at least twice as long.
You should have something similar to the dashboard below:
This looks great, let’s continue and add more meaningful charts.
Adding Copied Charts
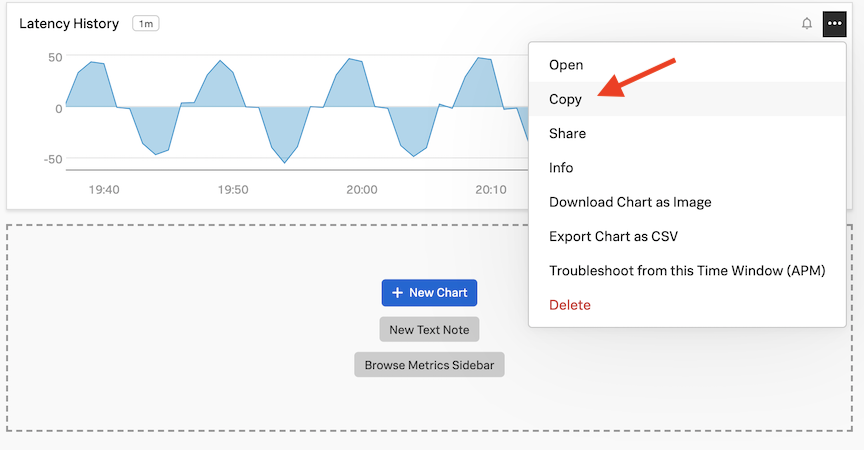
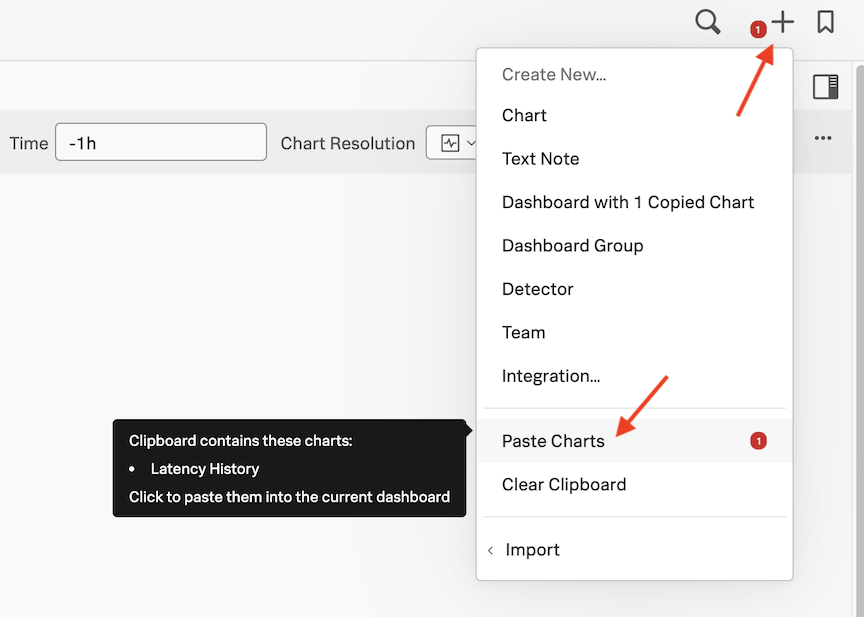
In this section, we are going to use the Copy and Paste functionality to extend our dashboard. Remember we copied some charts during the APM Service Dashboard section, we will now add those charts to our dashboard.
Exercise
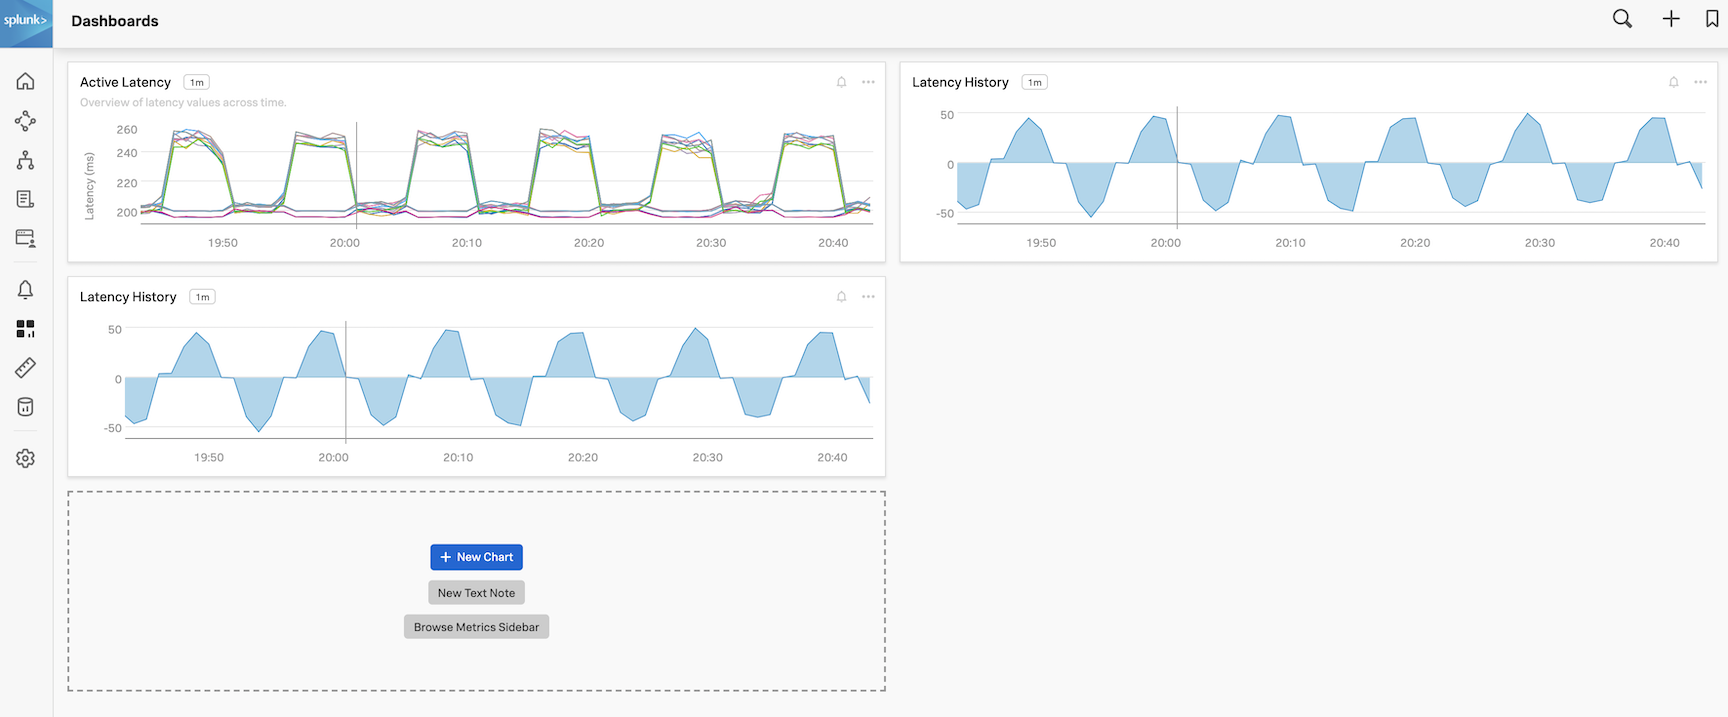
Select the 2+ at the top of the page and select Paste charts, this will create the charts in your custom dashboard.
The chart currently shows data for all Environments and Services, so let’s add a filter for our environment and the paymentservice.
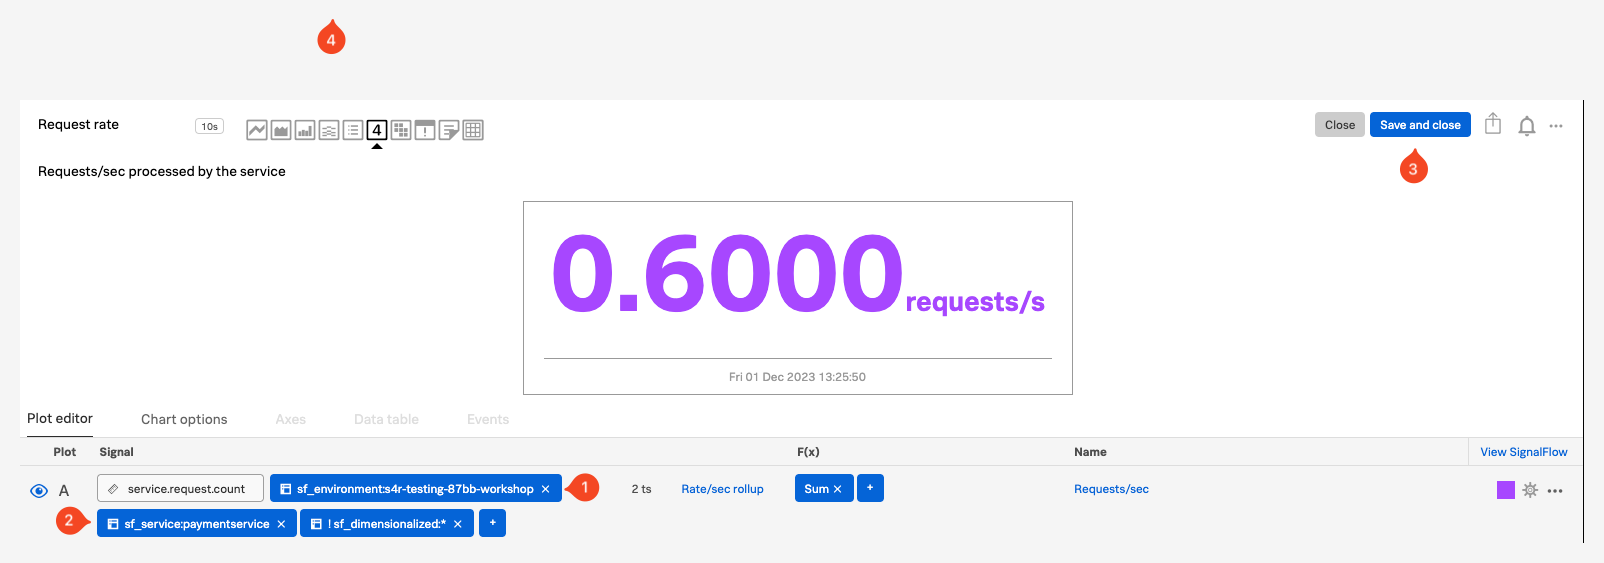
Click on the 3 dots … at the top right side of the Request Rate single value chart. This will open the chart in edit mode.
In the new screen, click on the x in the sf_environment:* x button (1) in the middle of the screen to close it.
Click on the + to add a new filter and select sf_environment then pick the [WORKSHOPNAME] from the drop-down and hit Apply. The button will change to sf_environment:[WORKSHOPNAME]
Do the same with for the sf_service. button (2), close it and create a new filter for sf_service. Only this time change it to paymentservice.
Click the Save and close button (3).
Repeat the previous 4 steps for the Request Rate text chart
Click Save after you have update the two charts.
As the new pasted charts appeared at the bottom of our dashboard, we need to re-organize our dashboard again.
Using the drag and drop and resizing skills you learned earlier, make your dashboard look like the image below.
Next, we are going to create a custom chart based on our Synthetic test that is running.
Adding a Custom Chart
In this part of the workshop we are going to create a chart that we will add to our dashboard, we will also link it to the detector we previously built. This will allow us to see the behavior of our test and get alerted if one or more of our test runs breach its SLA.
Exercise
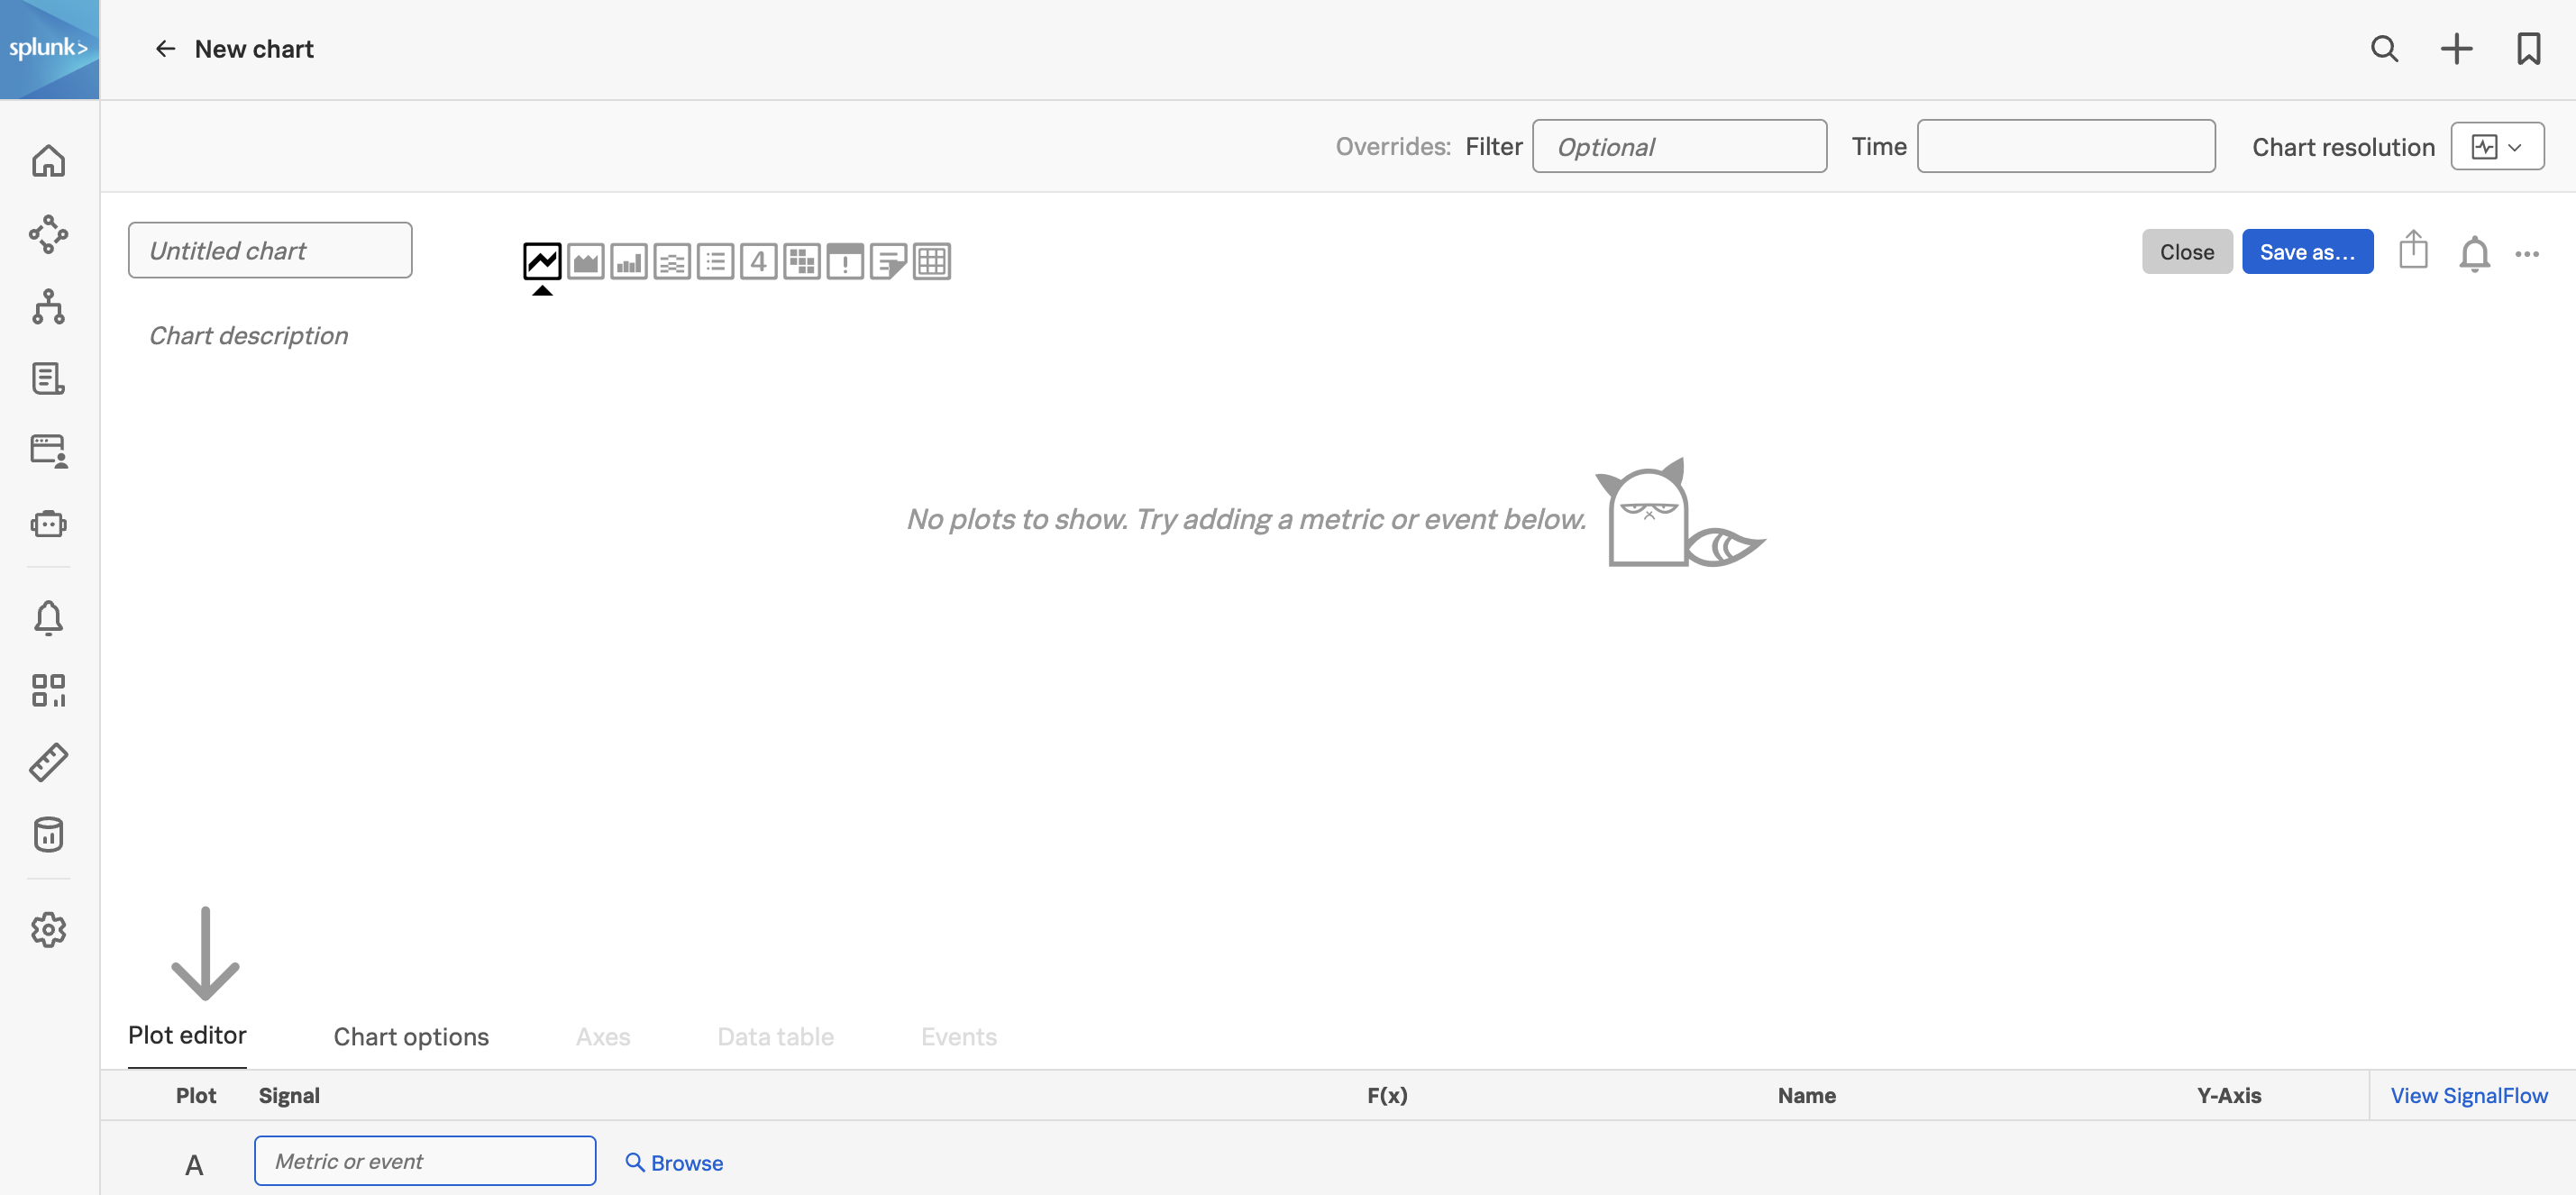
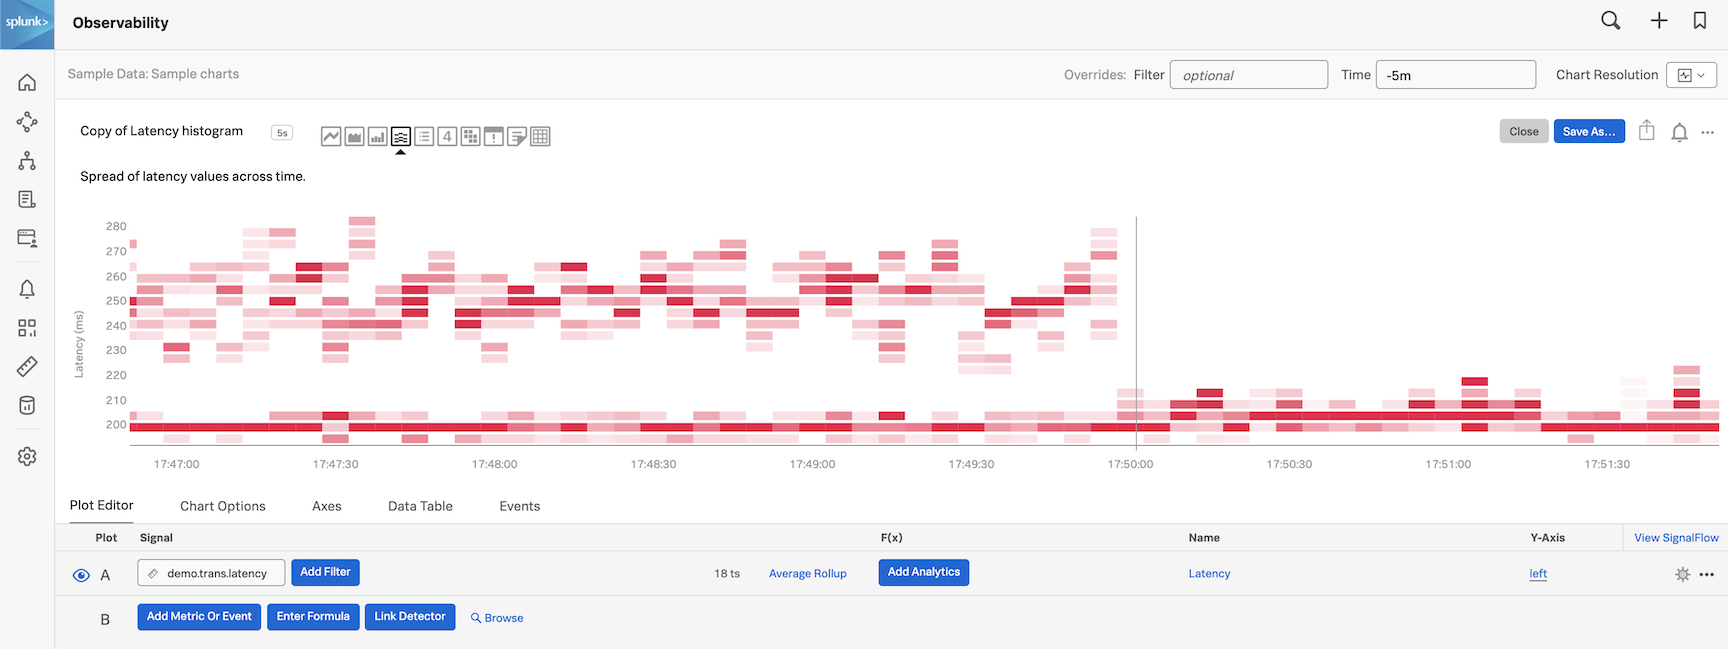
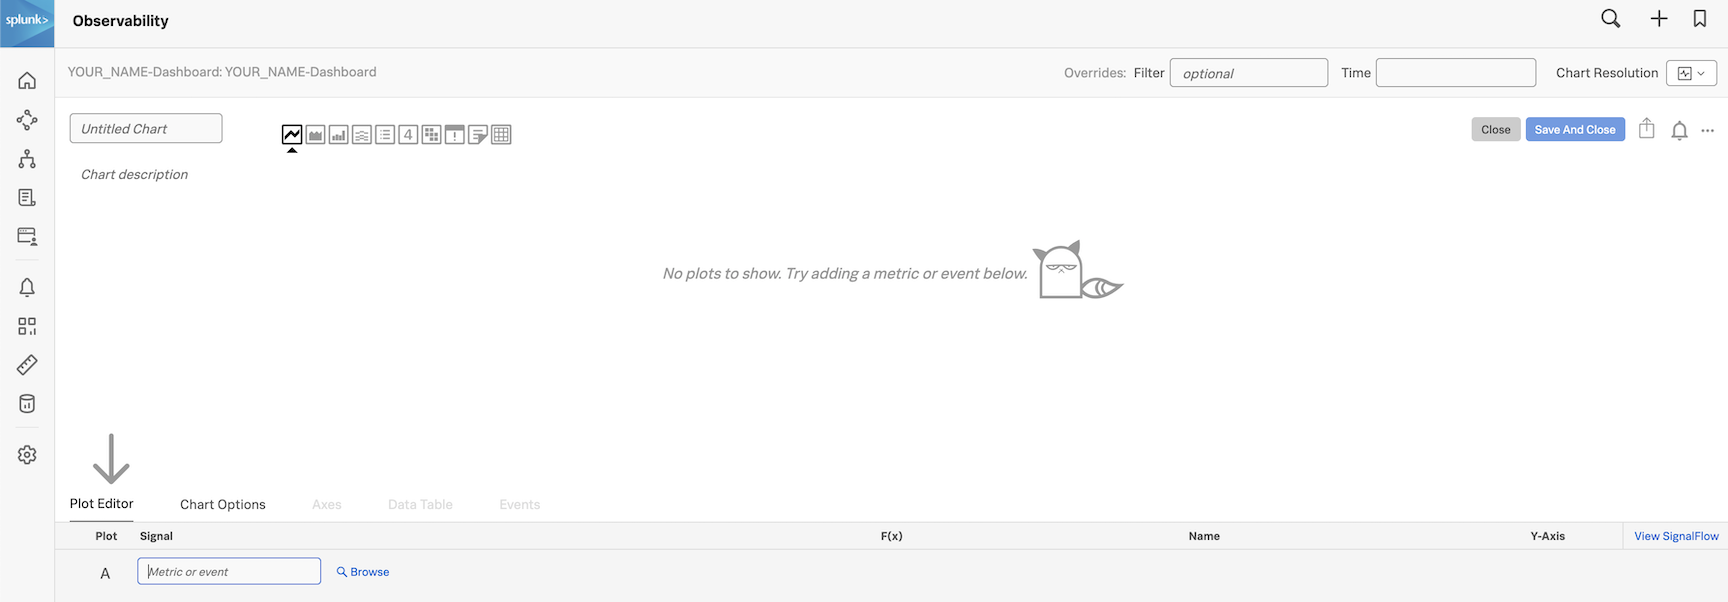
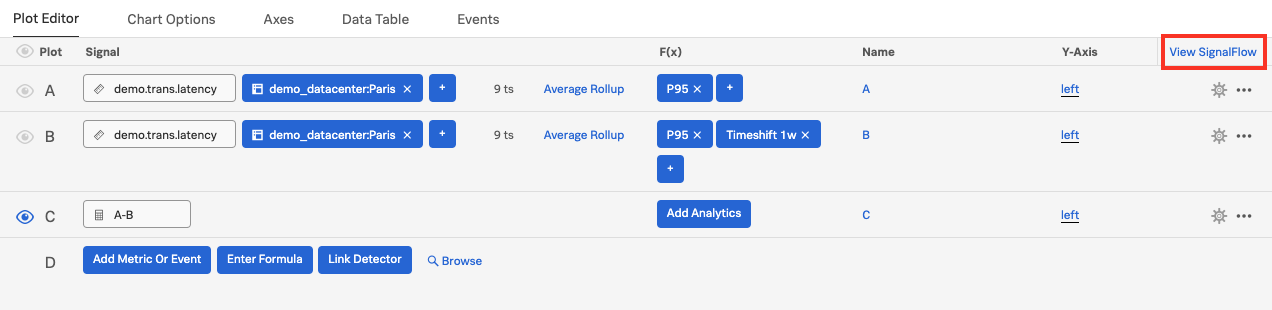
At the top of the dashboard click on the + and select Chart.
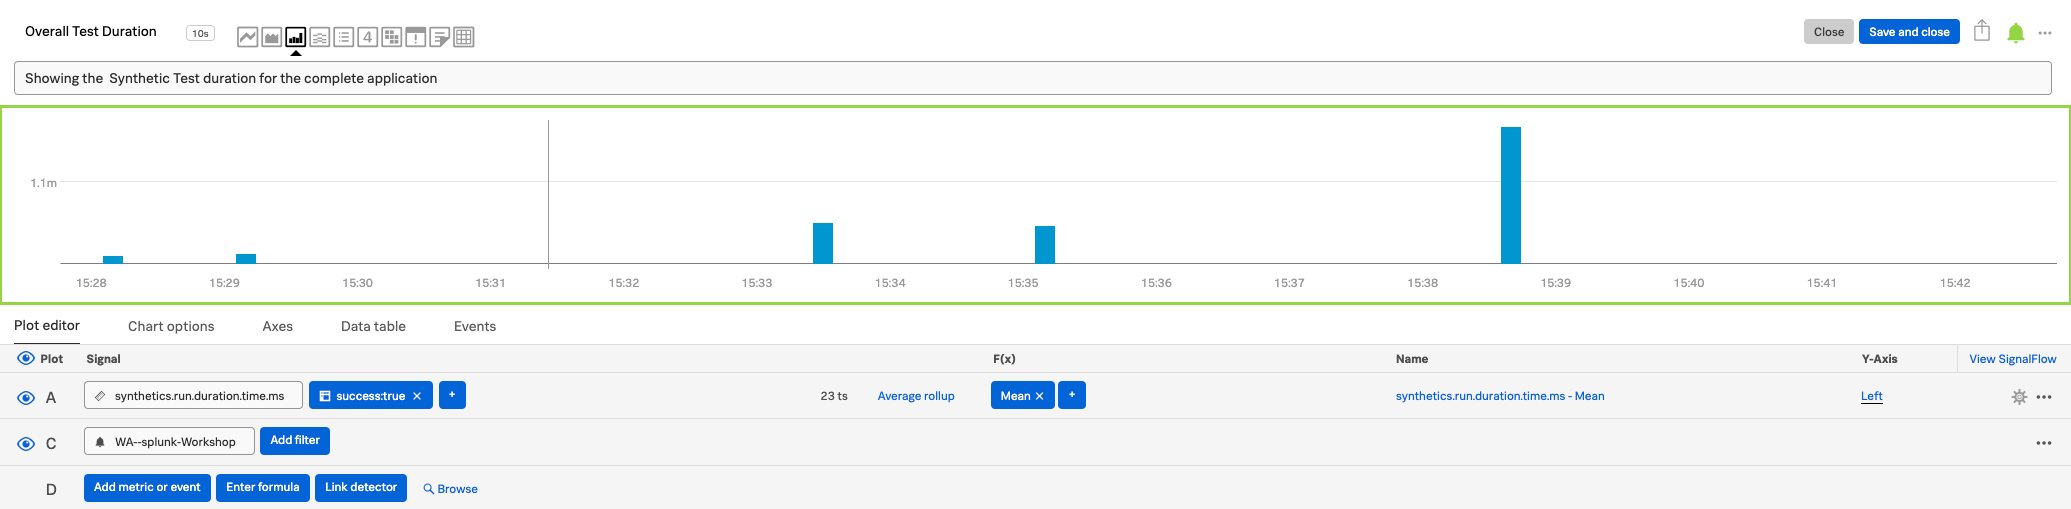
First, use the Untitled chart input field and name the chart Overall Test Duration.
For this exercise we want a bar or column chart, so click on the 3rd icon in the chart option box.
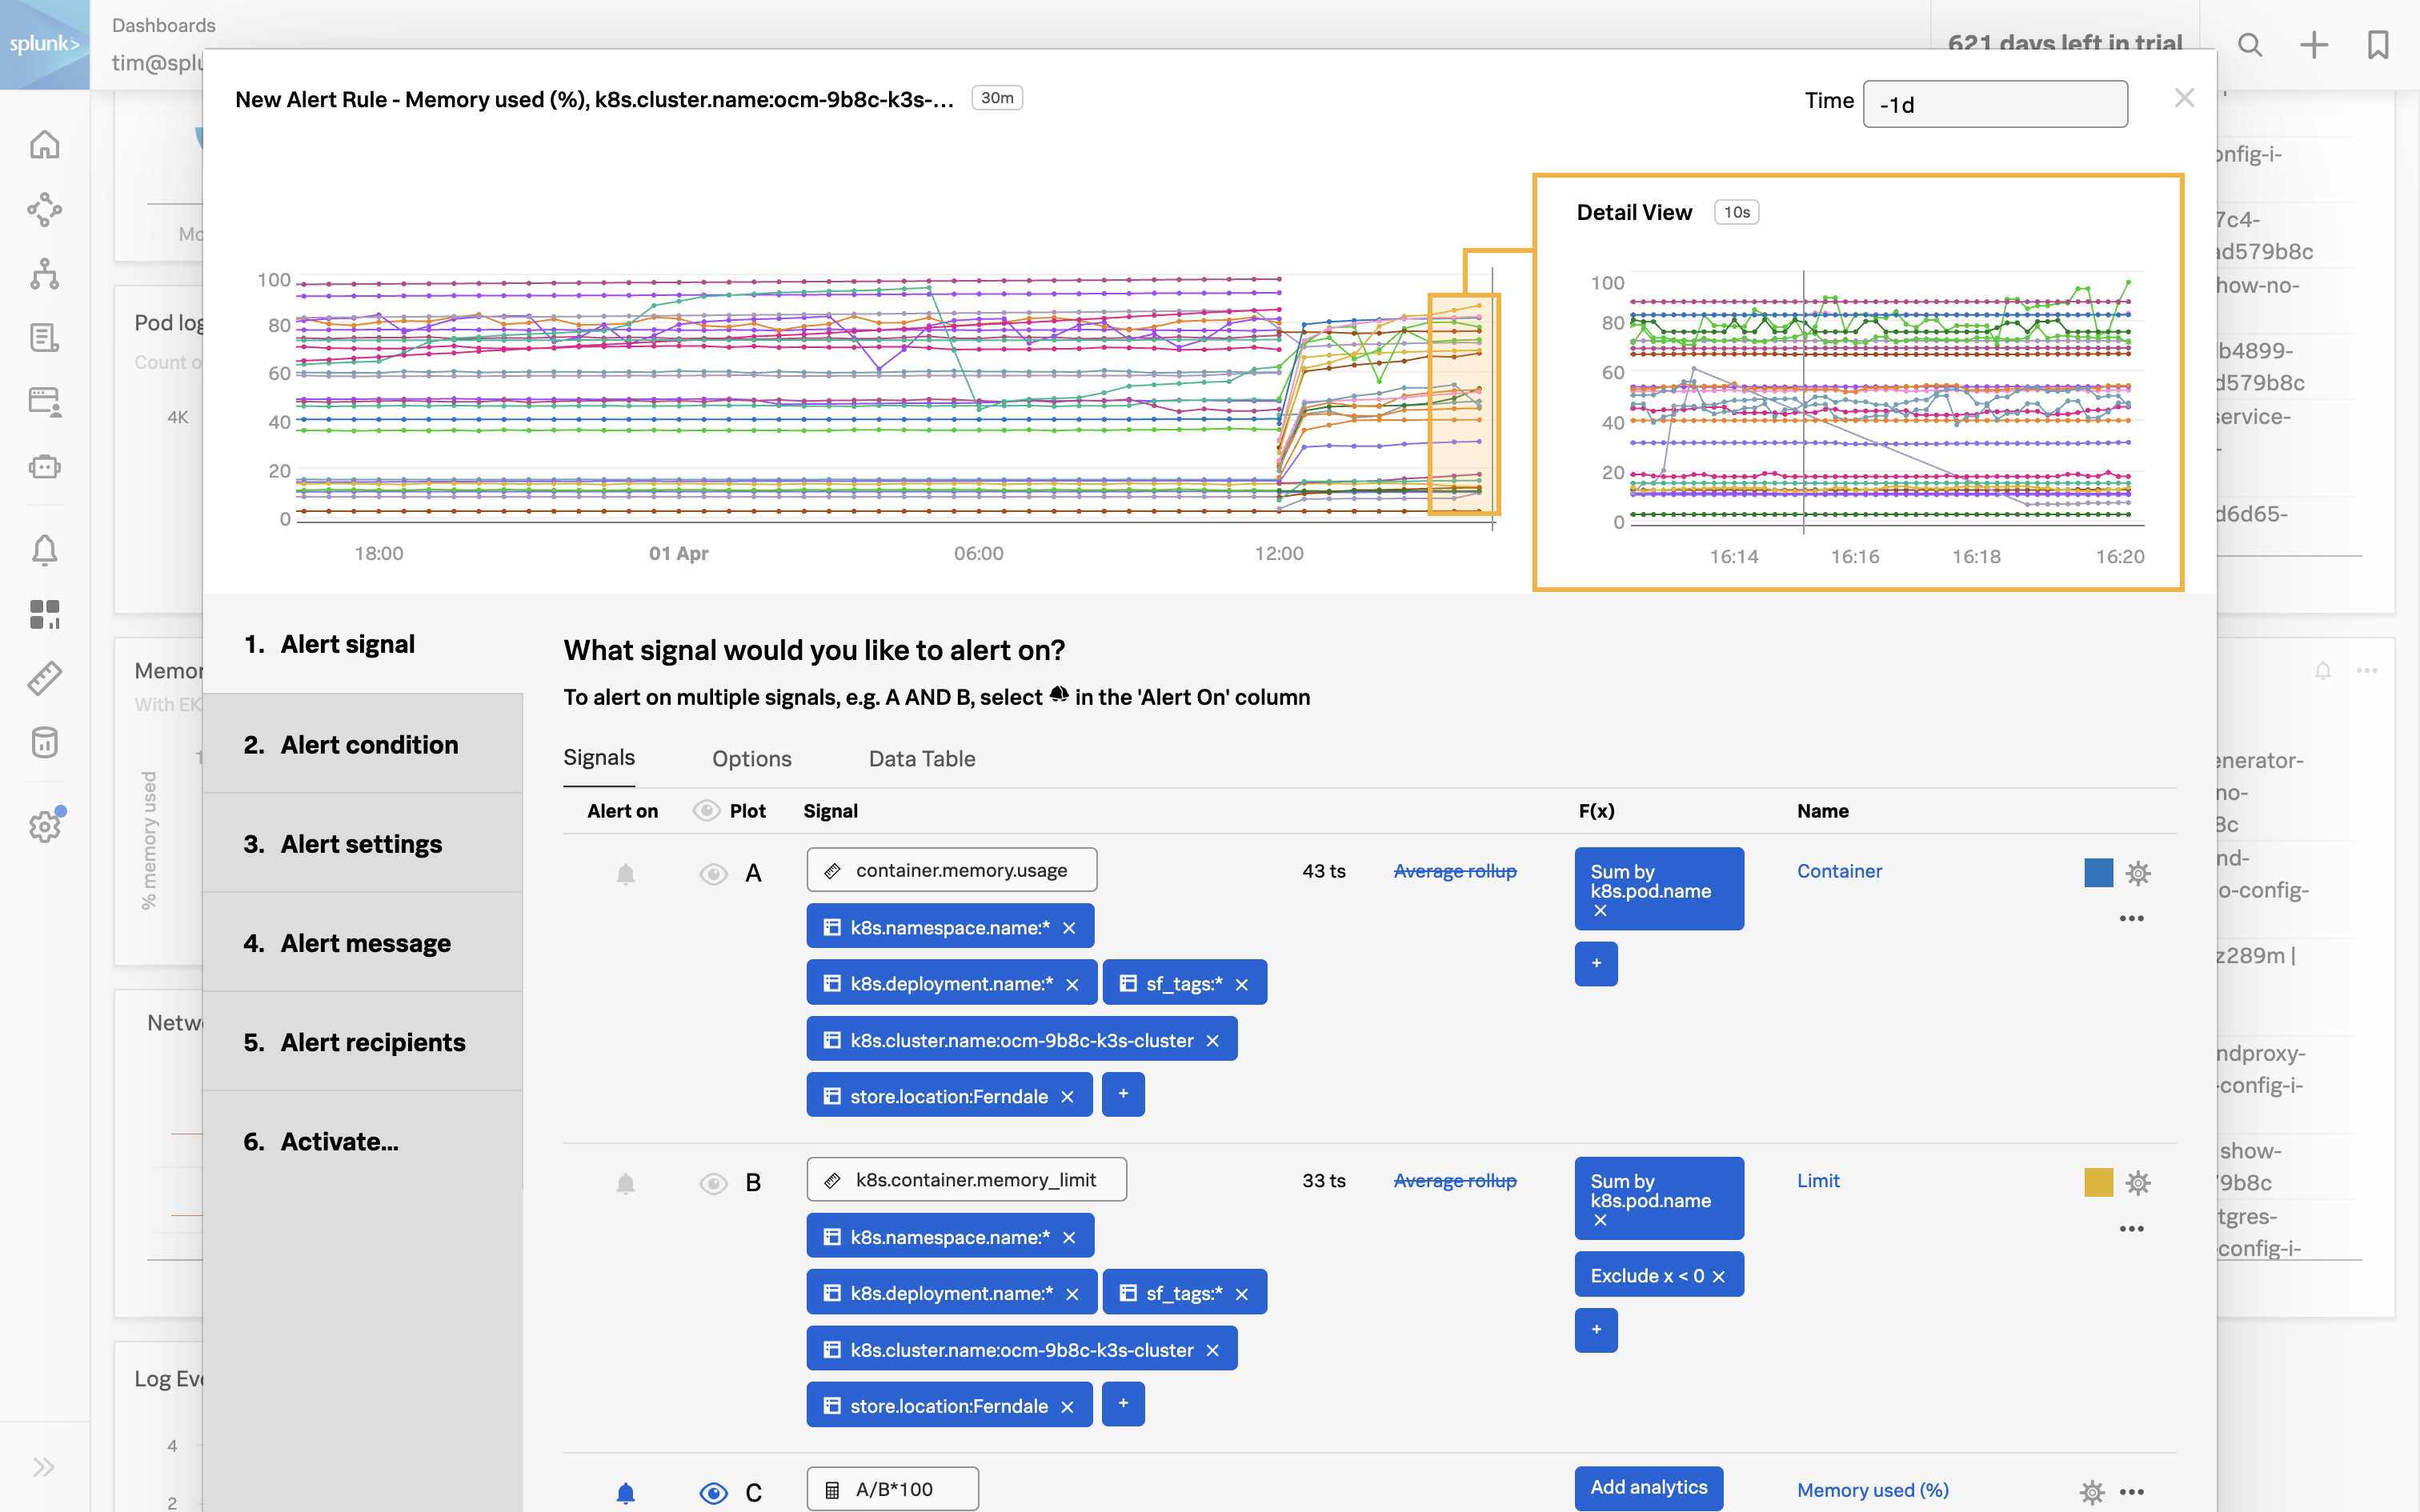
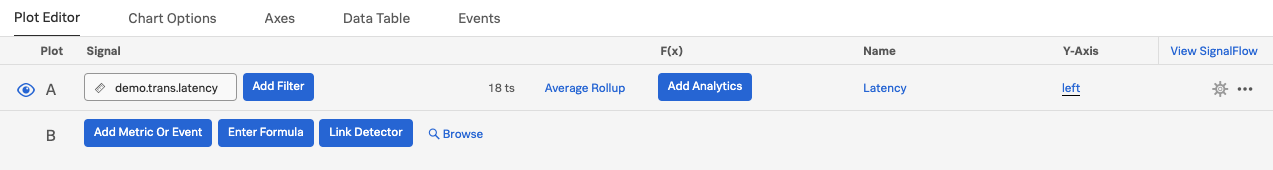
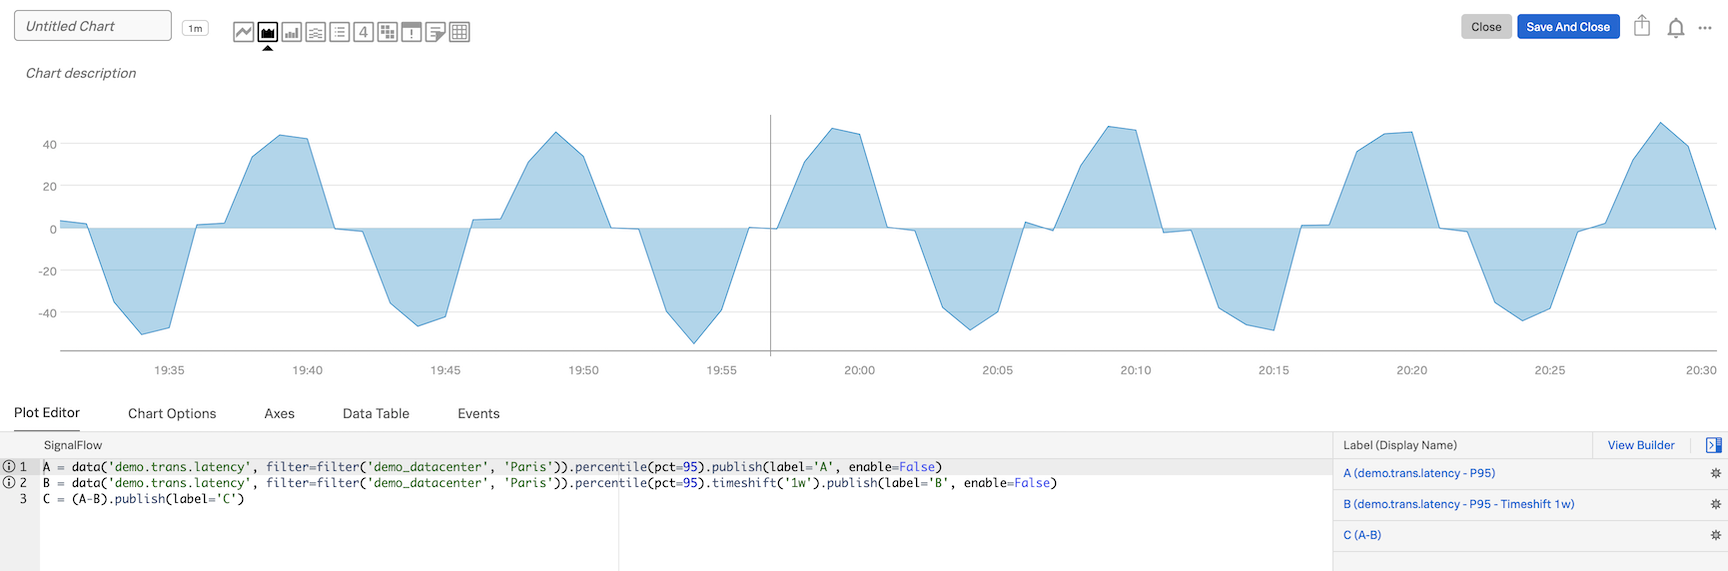
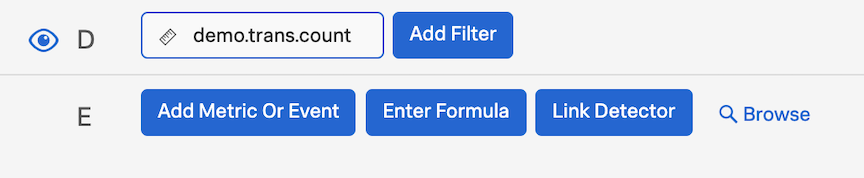
In the Plot editor enter synthetics.run.duration.time.ms (this is runtime in duration for our test) in the Signal box and hit enter.
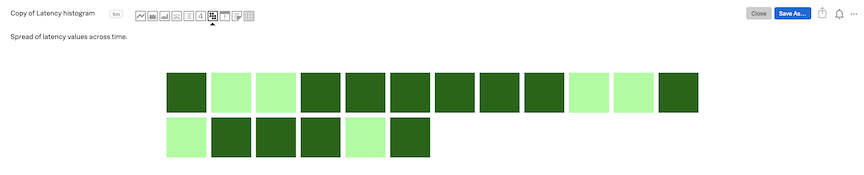
Right now we see different colored bars, a different color for each region the test runs from. As this is not needed we can change that behavior by adding some analytics.
Click the Add analytics button.
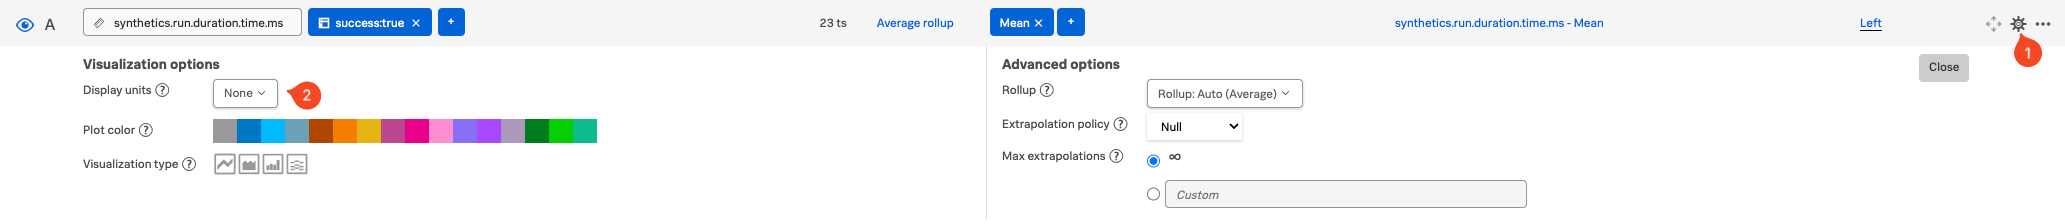
From the drop-down choose the Mean option, then pick mean:aggregation and click outside the dialog box. Notice how the chart changes to a single color as the metrics are now aggregated.
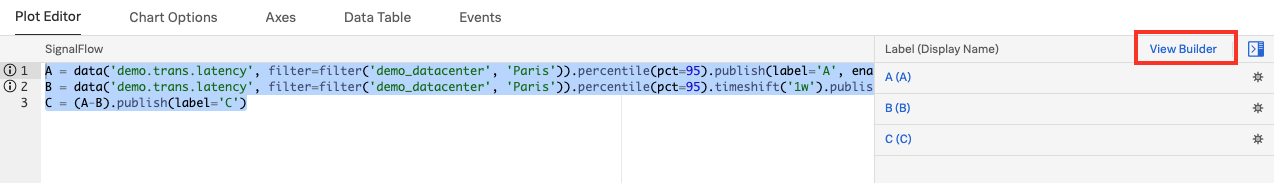
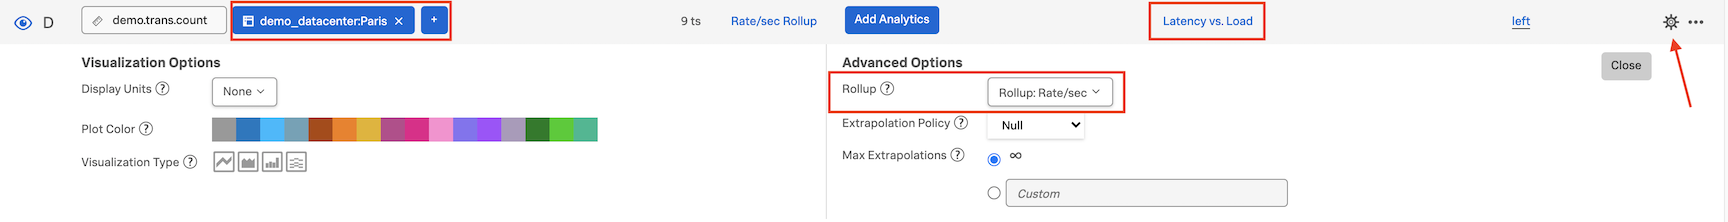
The x-axis does not currently represent time to change this click on the settings icon at the end of the plot line. The following following dialog will open:
Change the Display units (2) in the drop-down box from None to Time (autoscaling)/Milliseconds(ms). The drop-down changes to Millisecond and the x-axis of the chart now represents the test duration time.
Close the dialog, either by clicking on the settings icon or the close button.
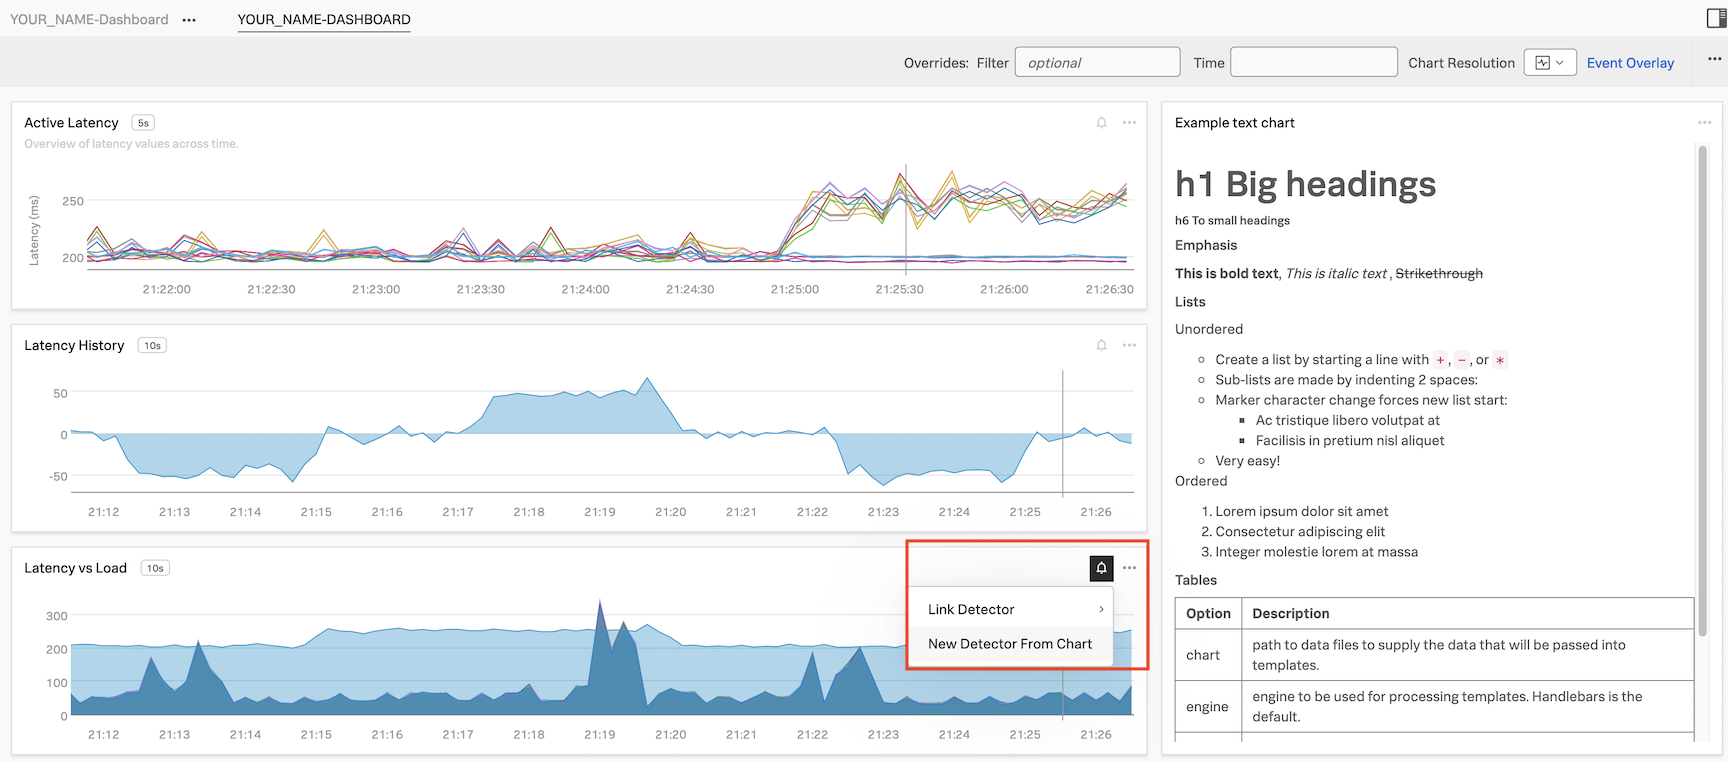
Add our detector by clicking the Link Detector button and start typing the name of the detector you created earlier.
Click on the detector name to select it.
Notice that a colored border appears around the chart, indicating the status of the alert, along with a bell icon at the top of the dashboard as shown below:
Click the Save and close button.
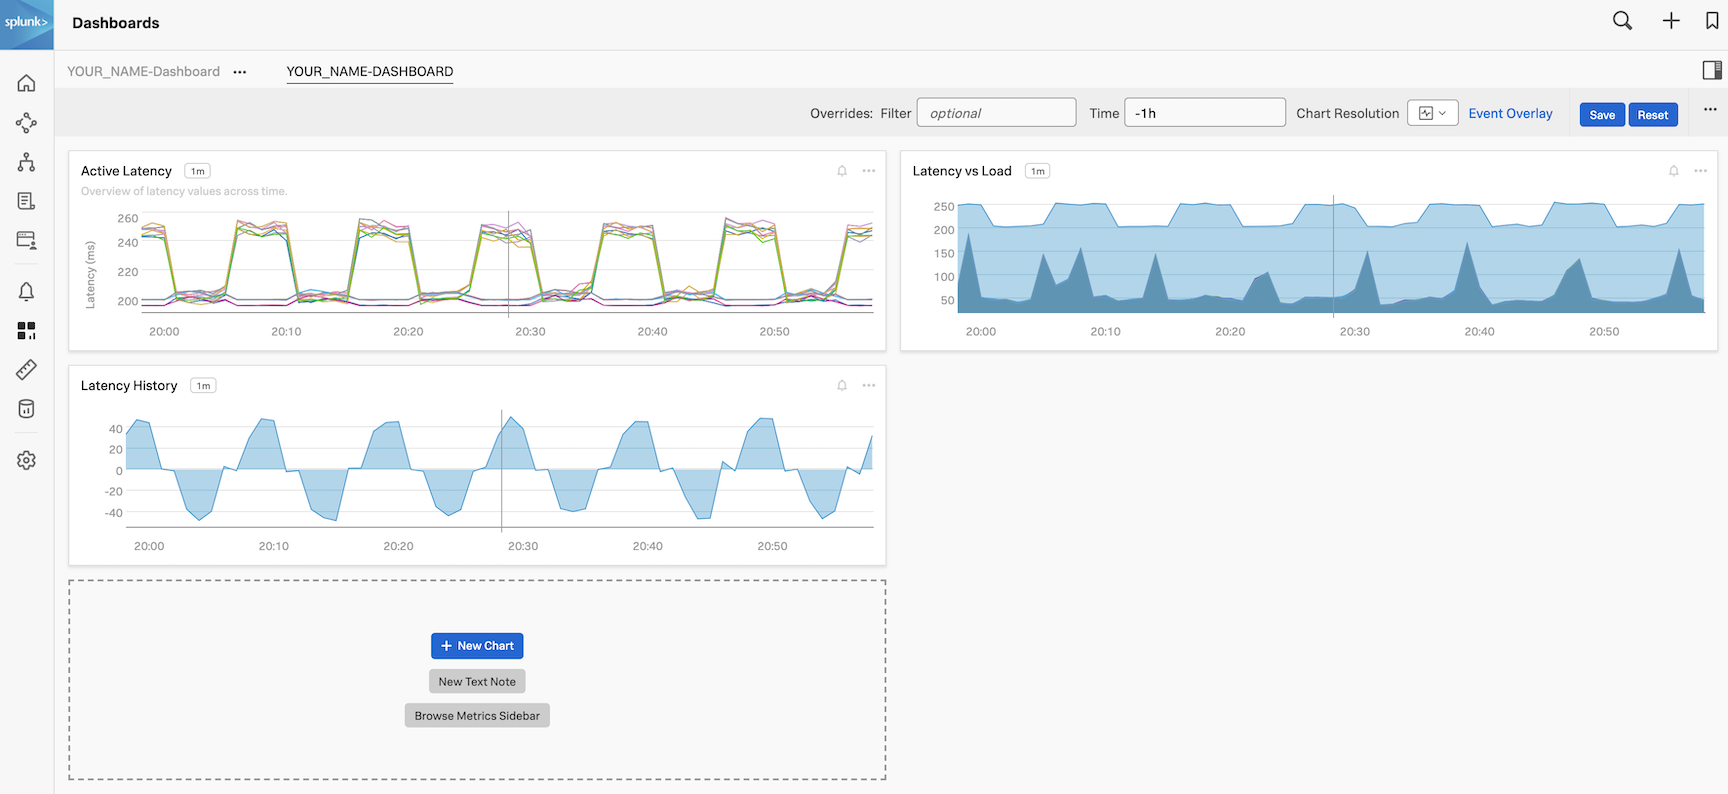
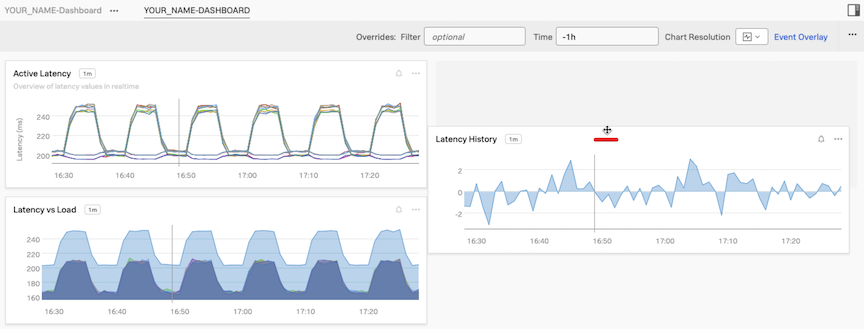
In the dashboard, move the charts so they look like the screenshot below:
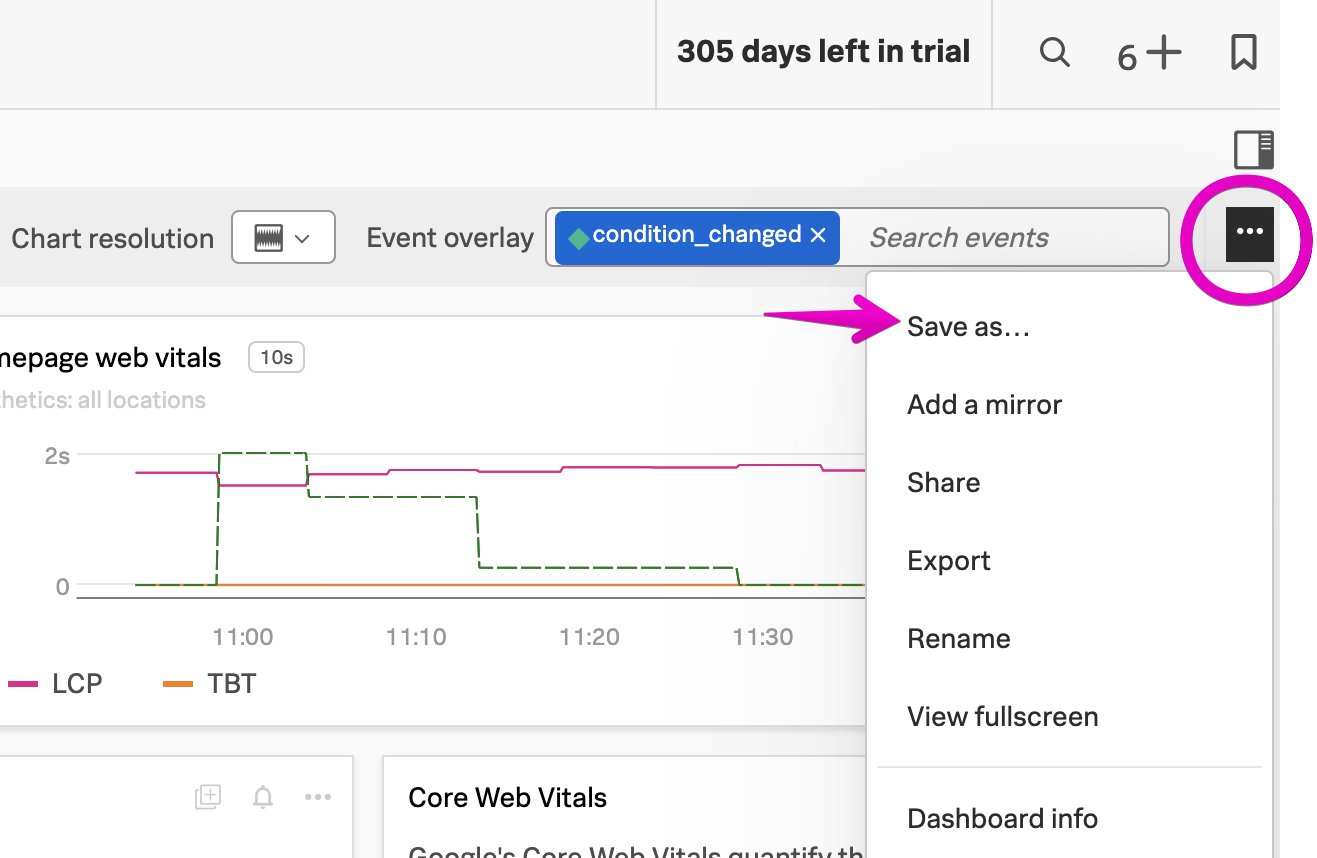
For the final task, click three dots … at the top of the page (next to Event Overlay) and click on View fullscreen. This will be the view you would use on the TV monitor on the wall (press Esc to go back).
Tip
In your spare time have a try at adding another custom chart to the dashboard using RUM metrics. You could copy a chart from the out-of-the-box RUM applications dashboard group. Or you could use the RUM metric rum.client_error.count to create a chart that shows the number of client errors in the application.
Finally, we will run through a workshop wrap-up.
Workshop Wrap-up 🎁
10 minutes
Congratulations, you have completed the Splunk4Rookies - Observability Cloud Workshop. Today, you have become familiar with how to use Splunk Observability Cloud to monitor your applications and infrastructure.
Celebrate your achievement by adding this certificate to your LinkedInprofile.
Let’s recap what we have learned and what you can do next.
Subsections of Workshop Wrap-up 🎁
Key Takeaways
During the workshop, we have seen how the Splunk Observability Cloud in combination with the OpenTelemetry signals (metrics, traces and logs) can help you to reduce mean time to detect (MTTD) and also reduce mean time to resolution (MTTR).
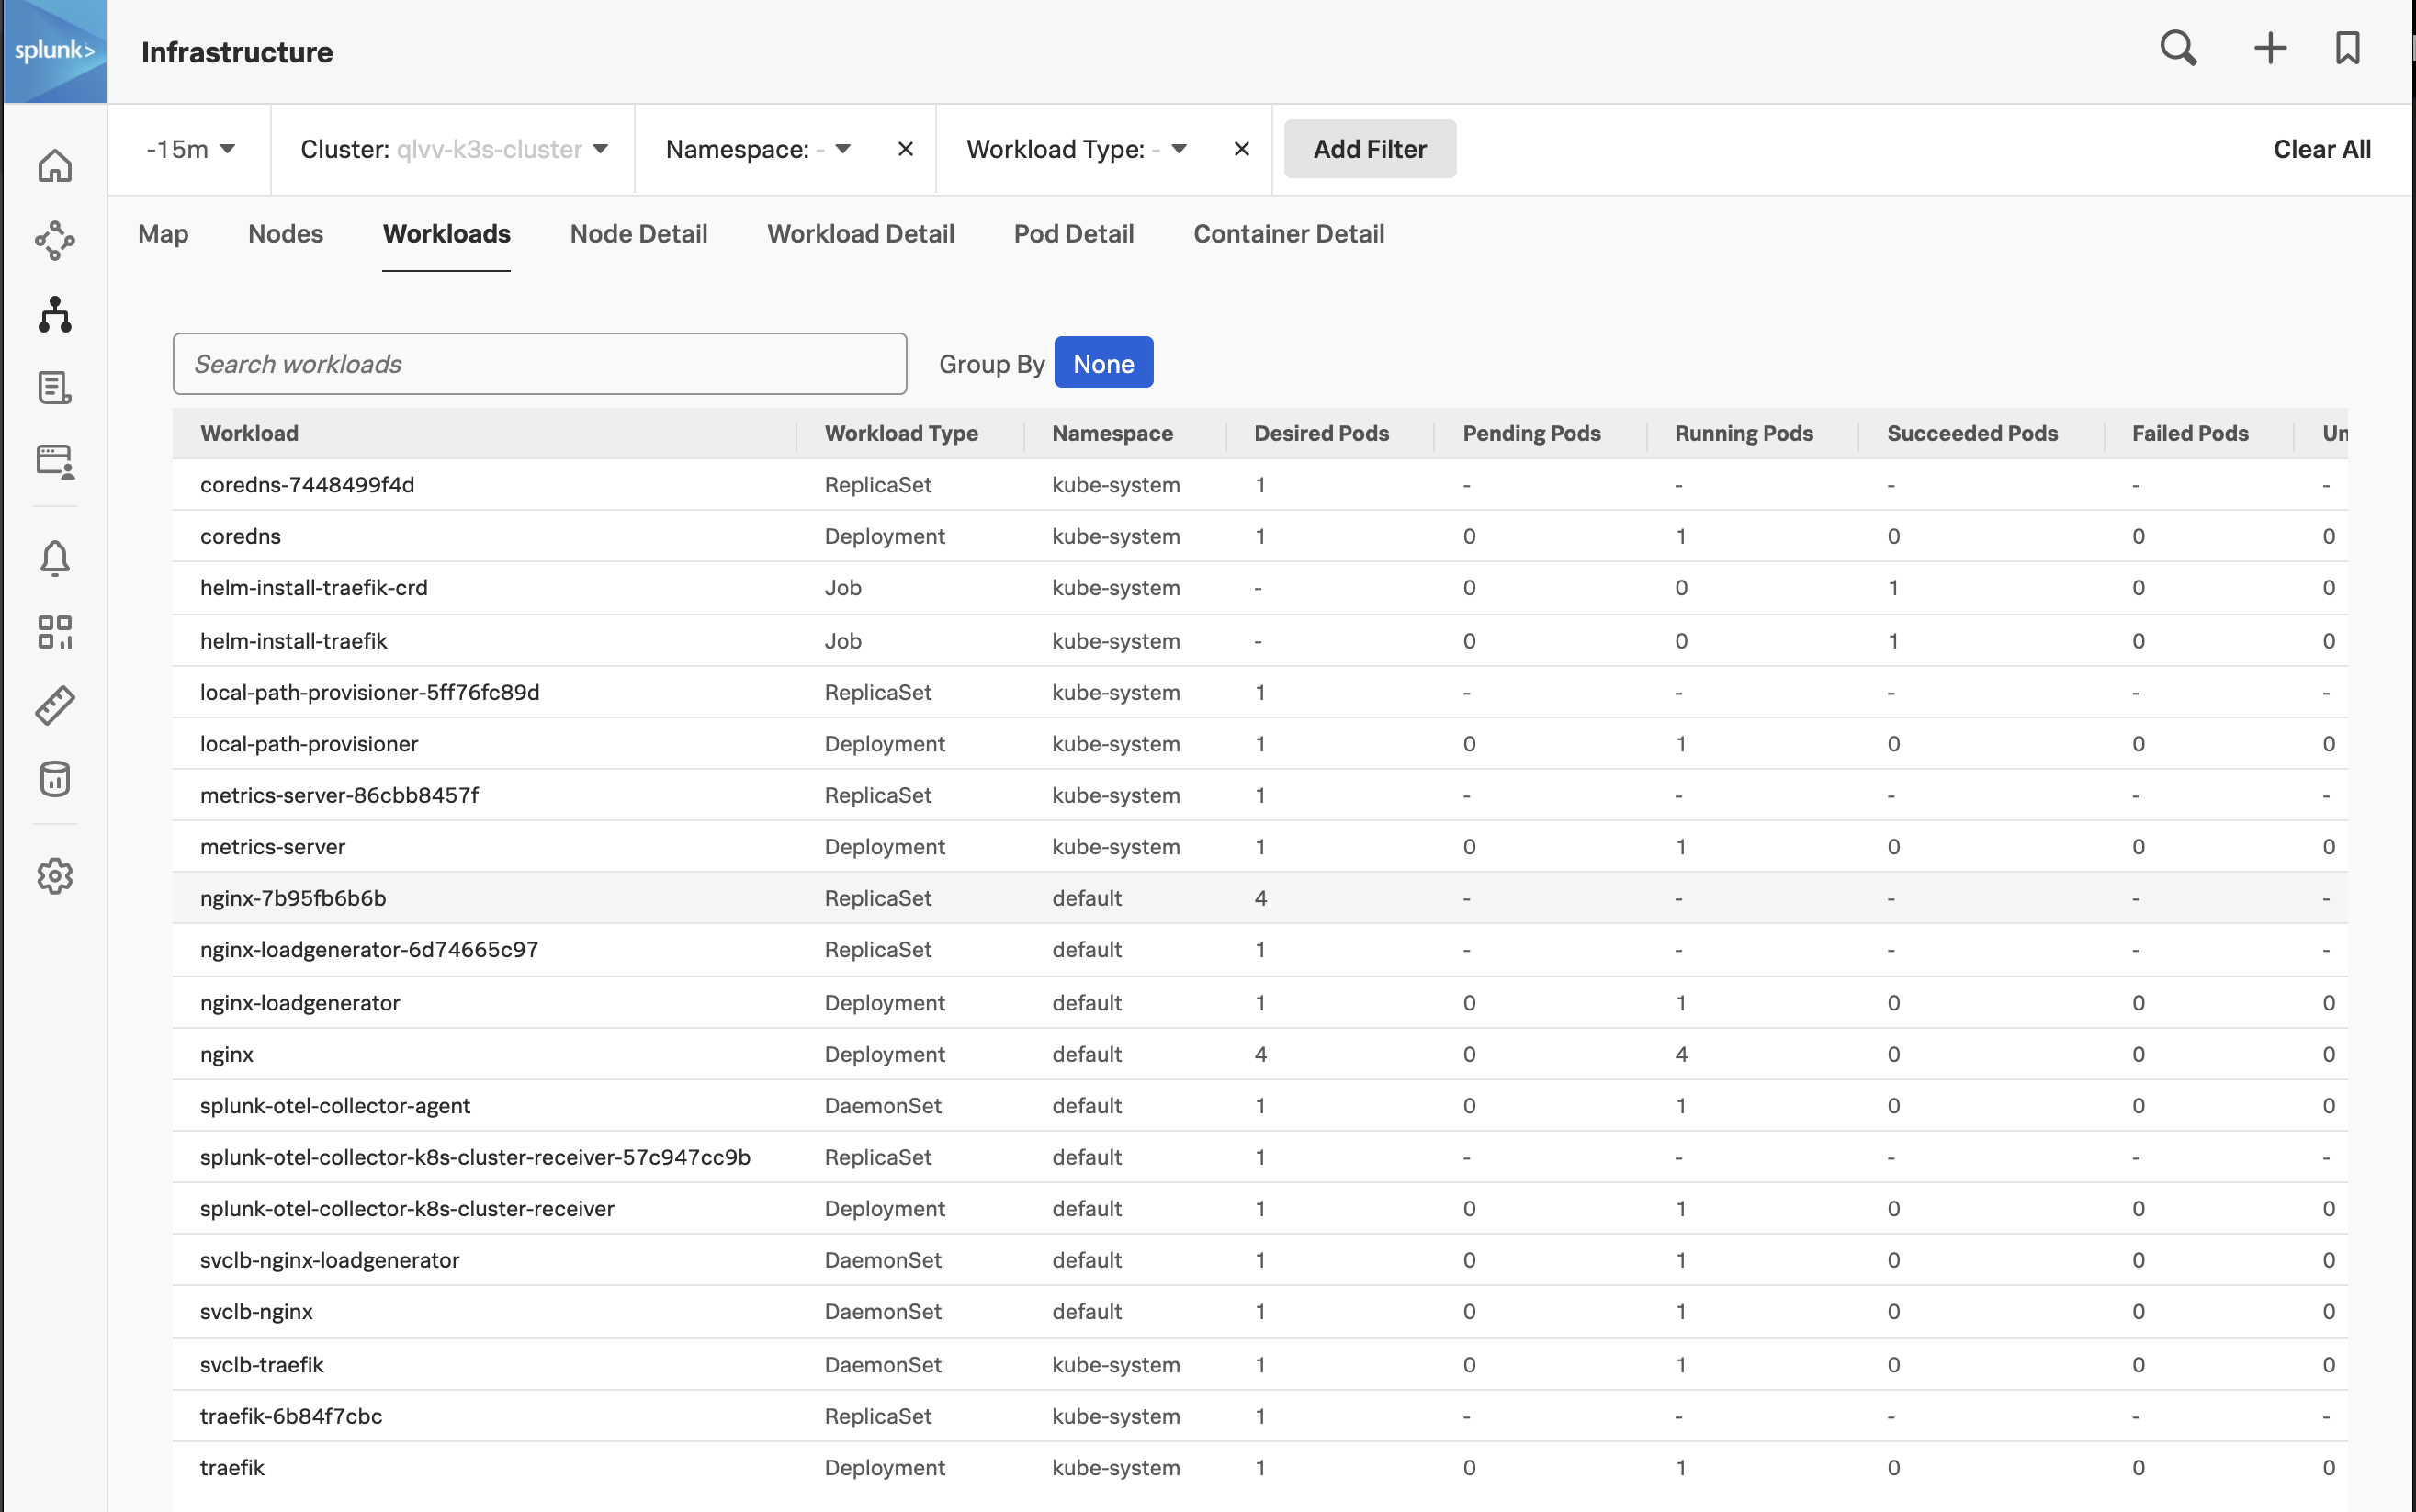
We have a better understanding of the Main User interface and its components, the Landing, Infrastructure, APM, RUM, Synthetics, Dashboard pages, and a quick peek at the Settings page.
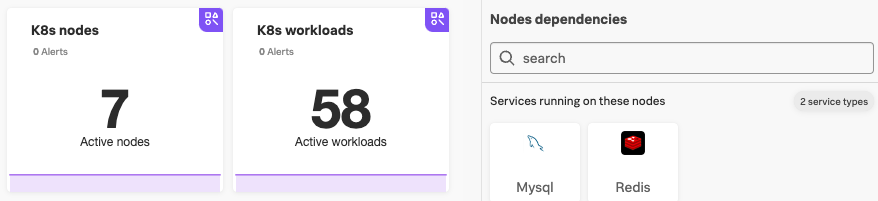
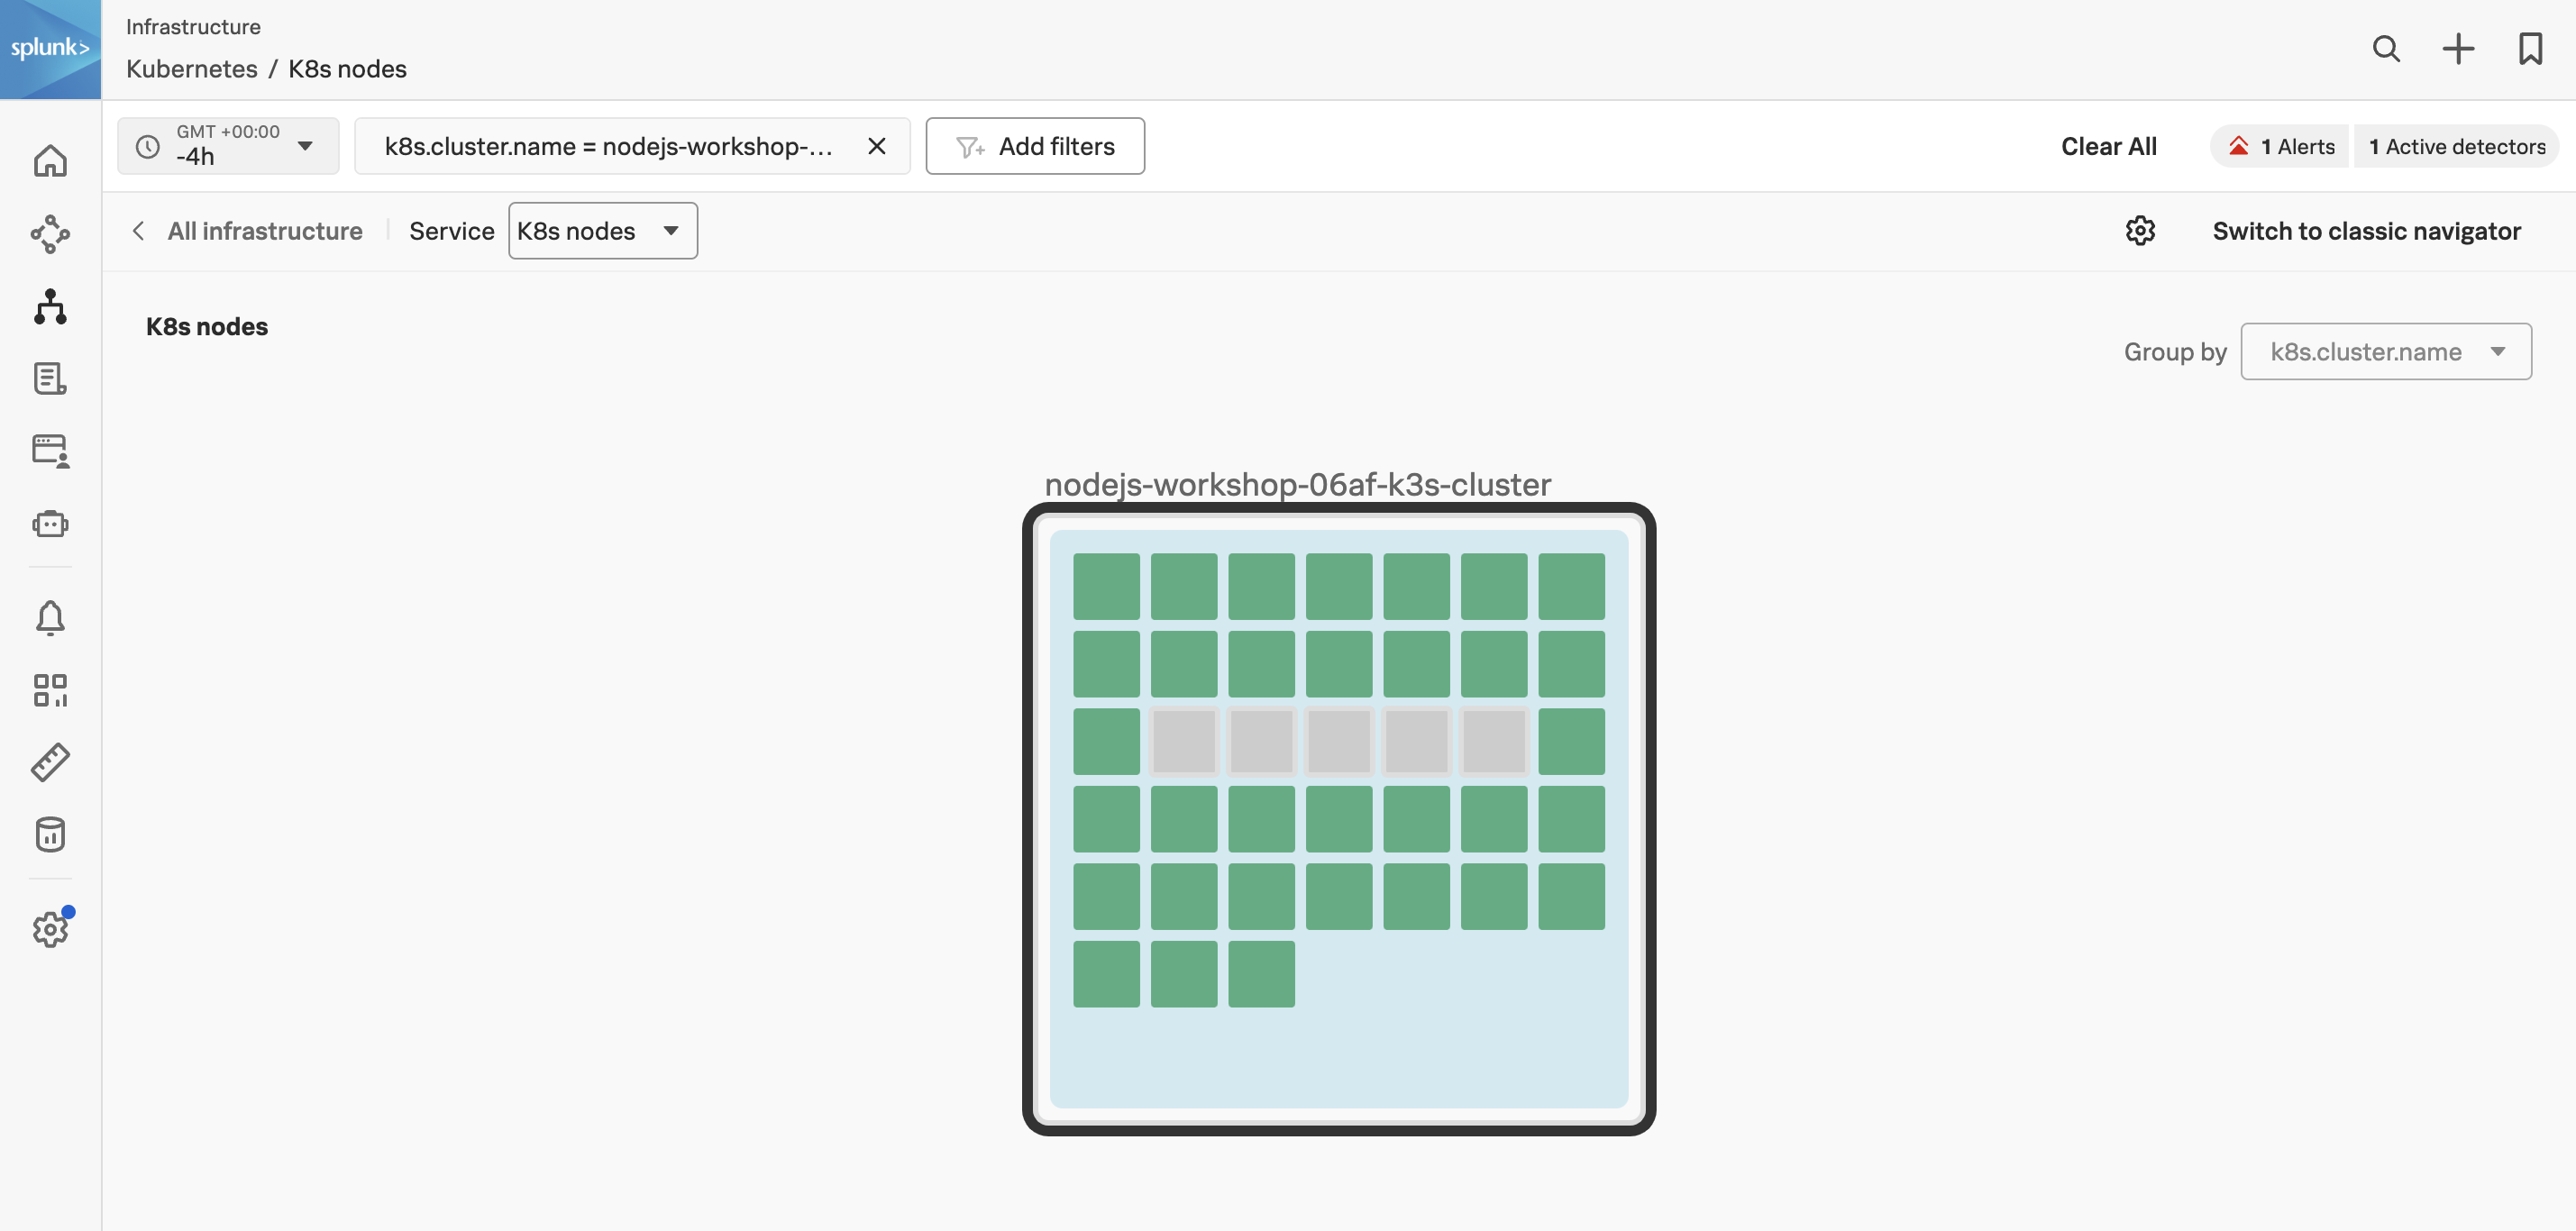
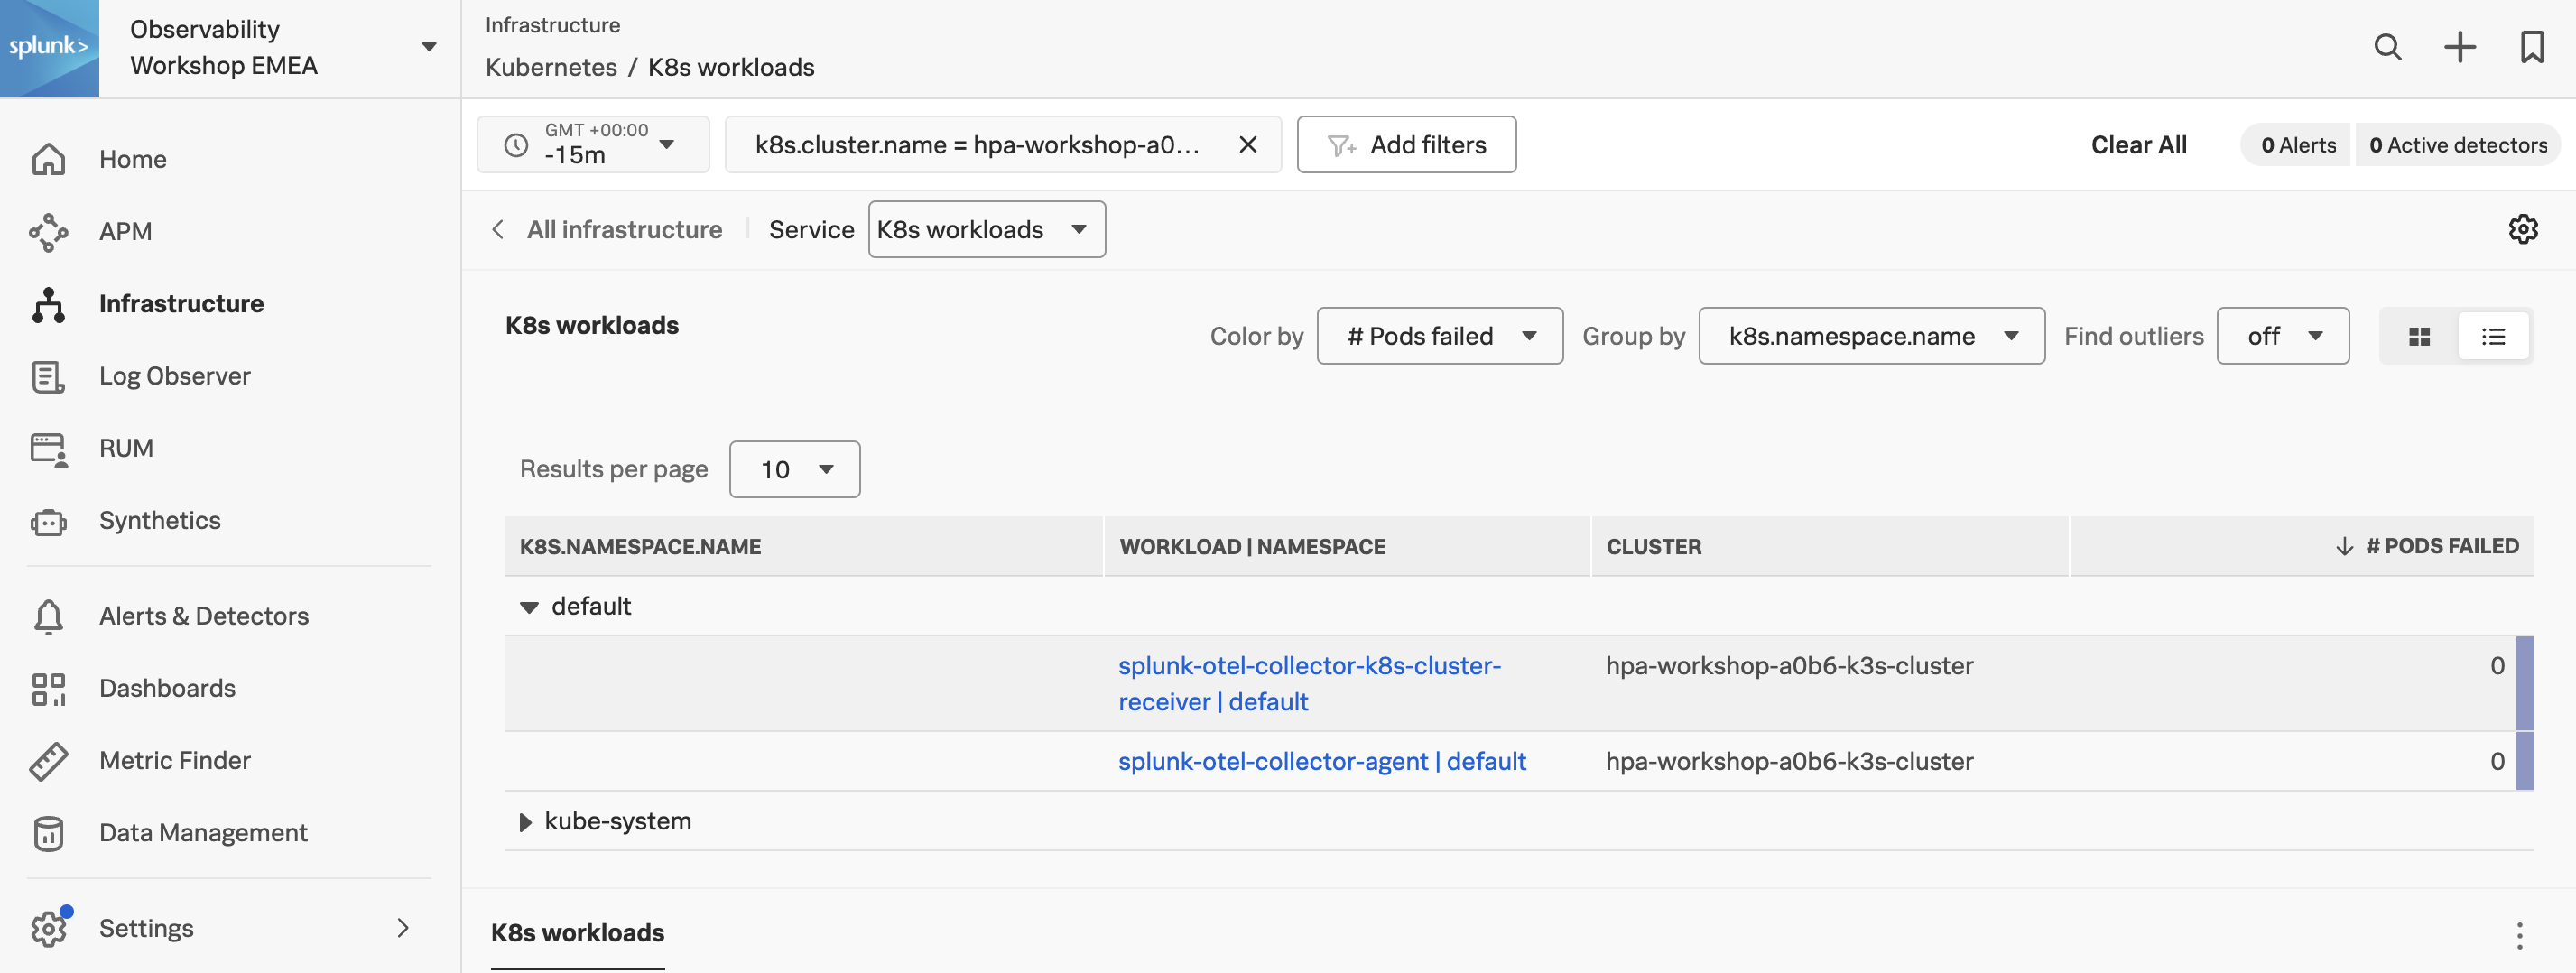
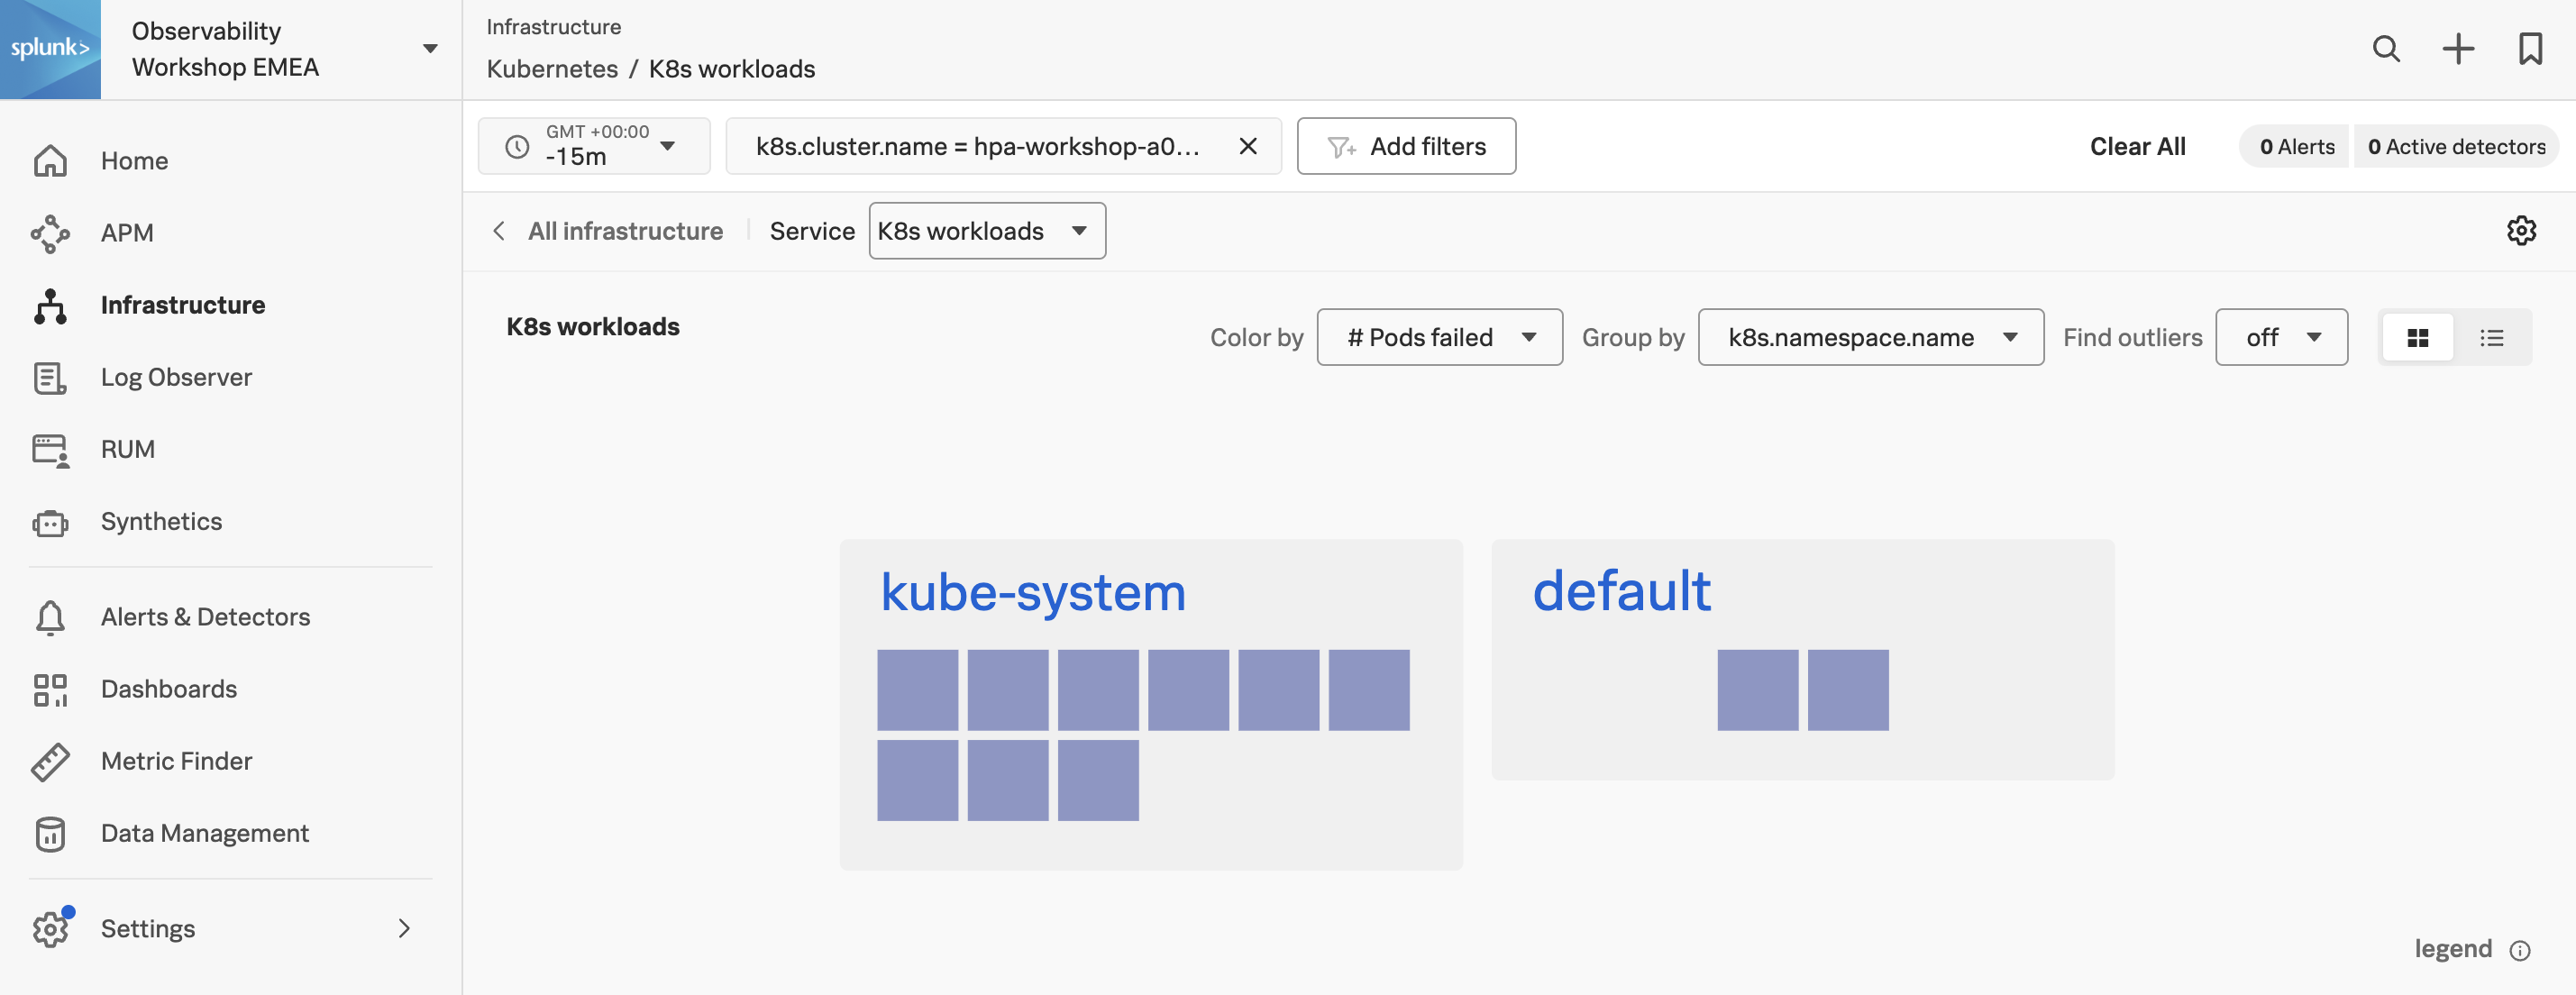
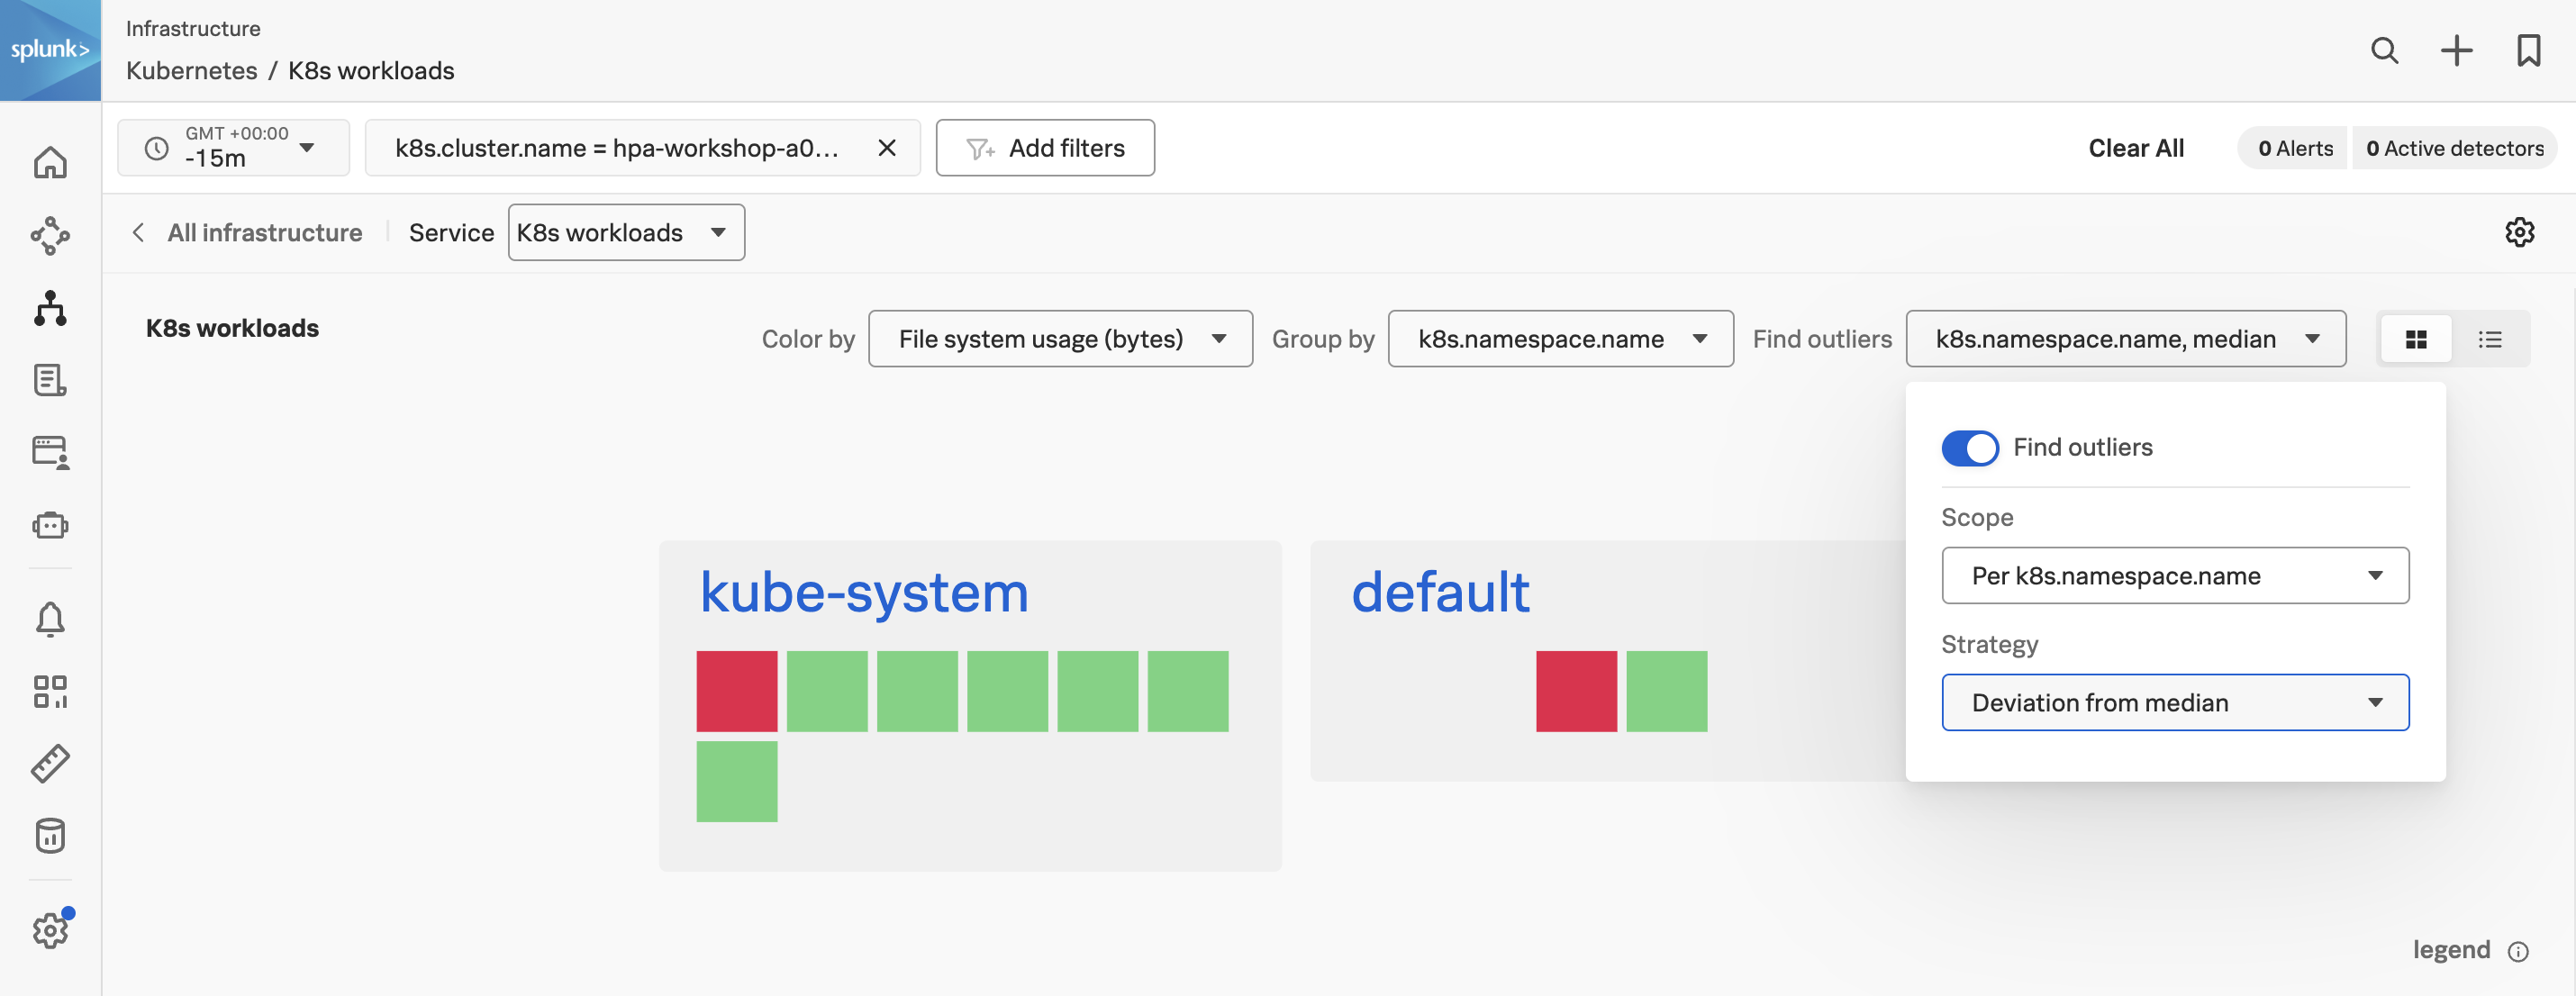
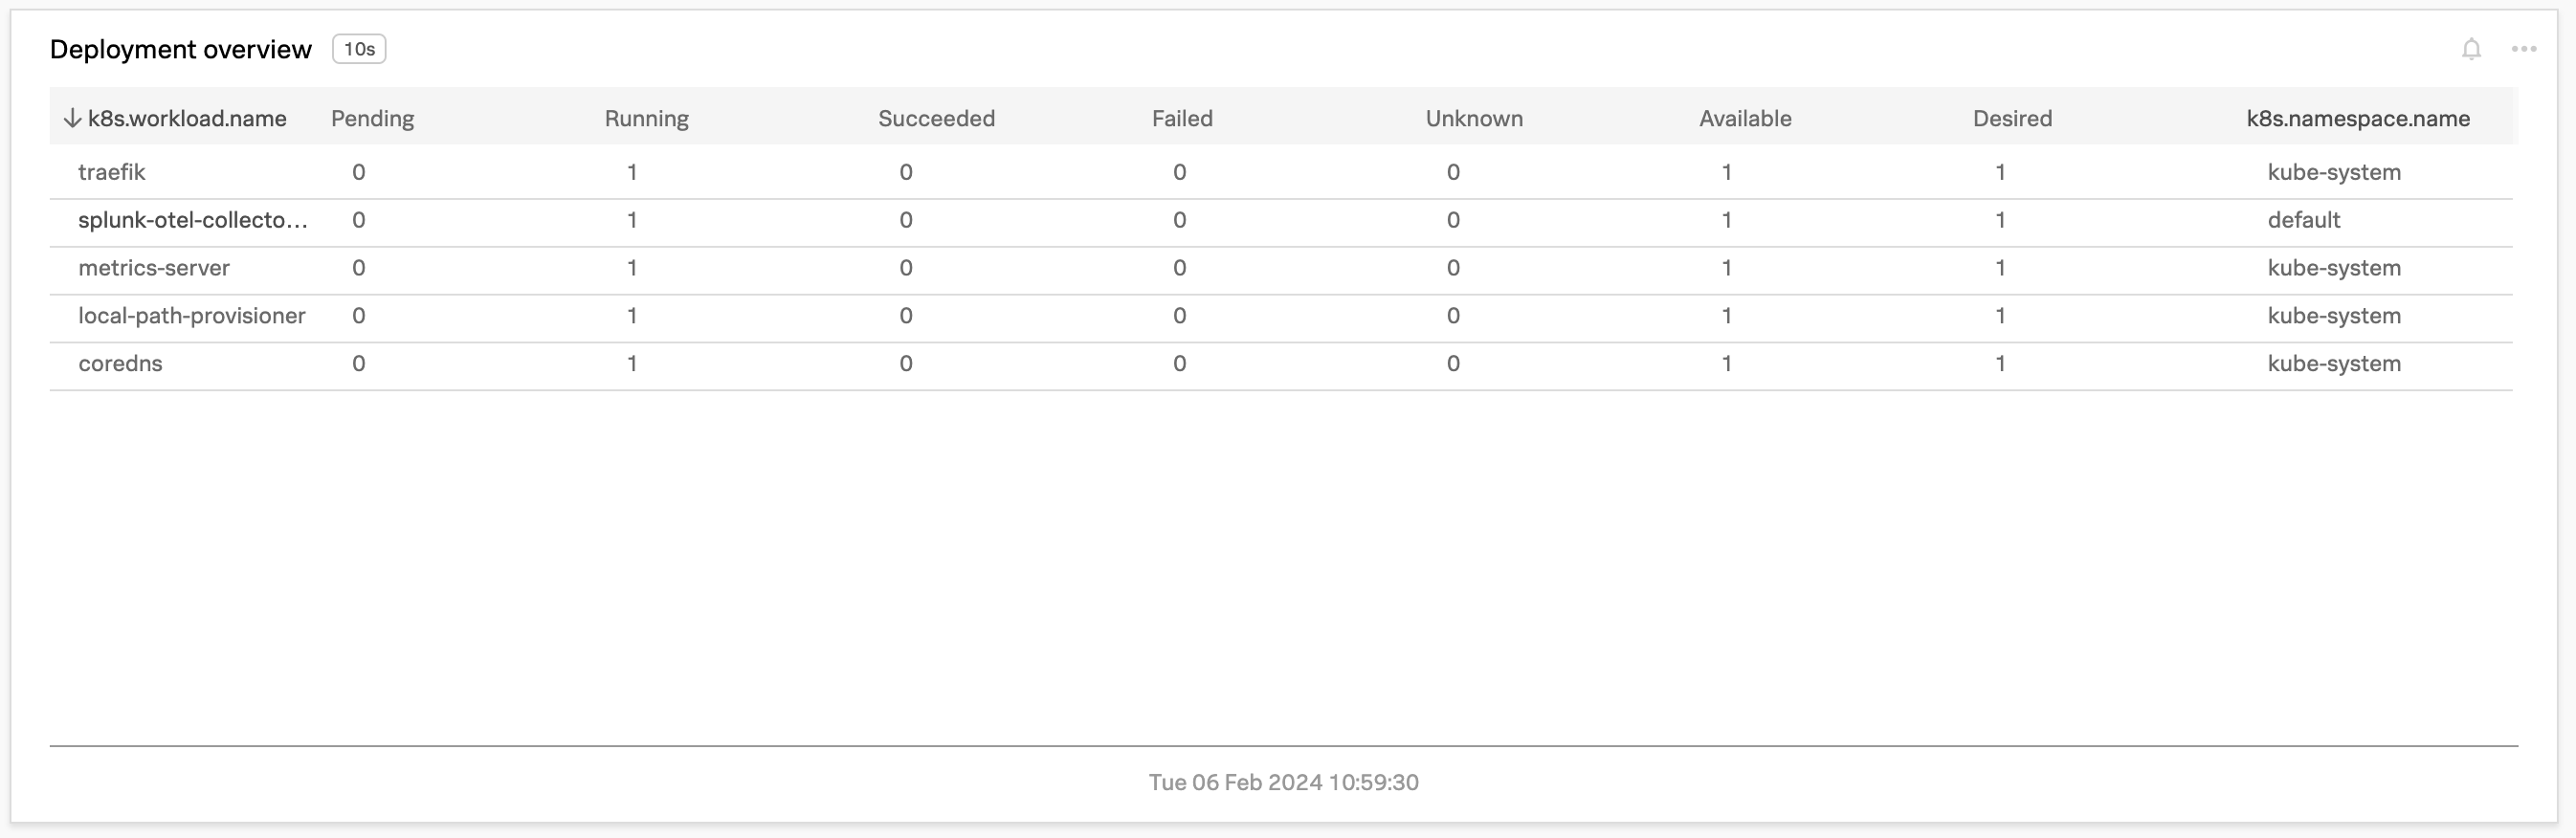
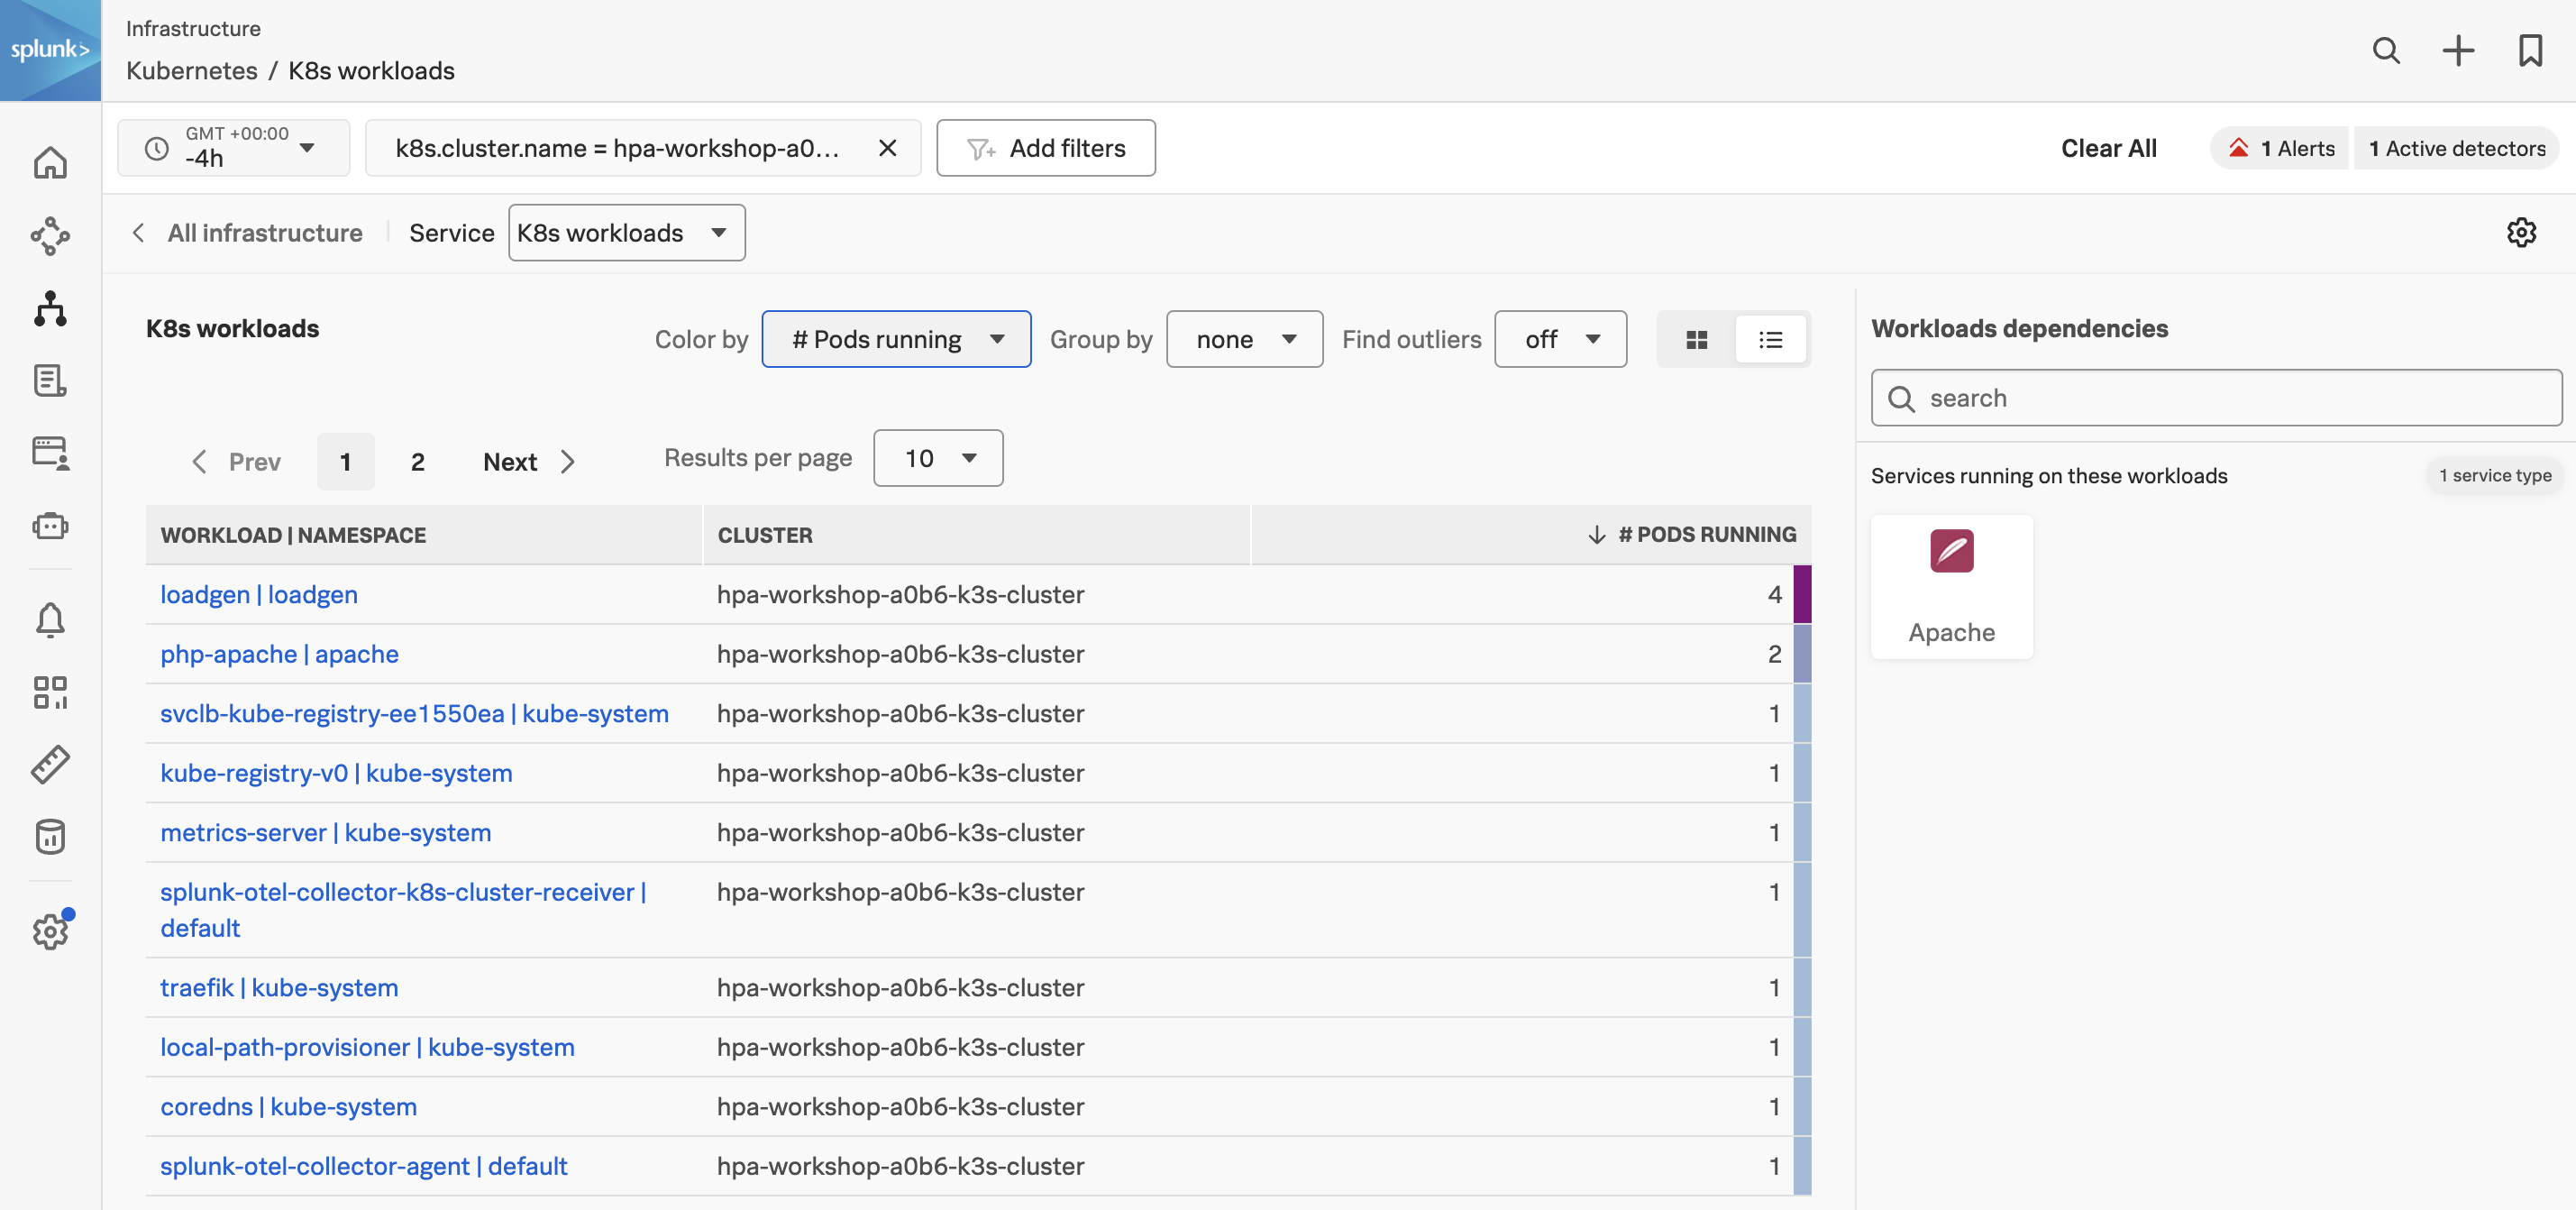
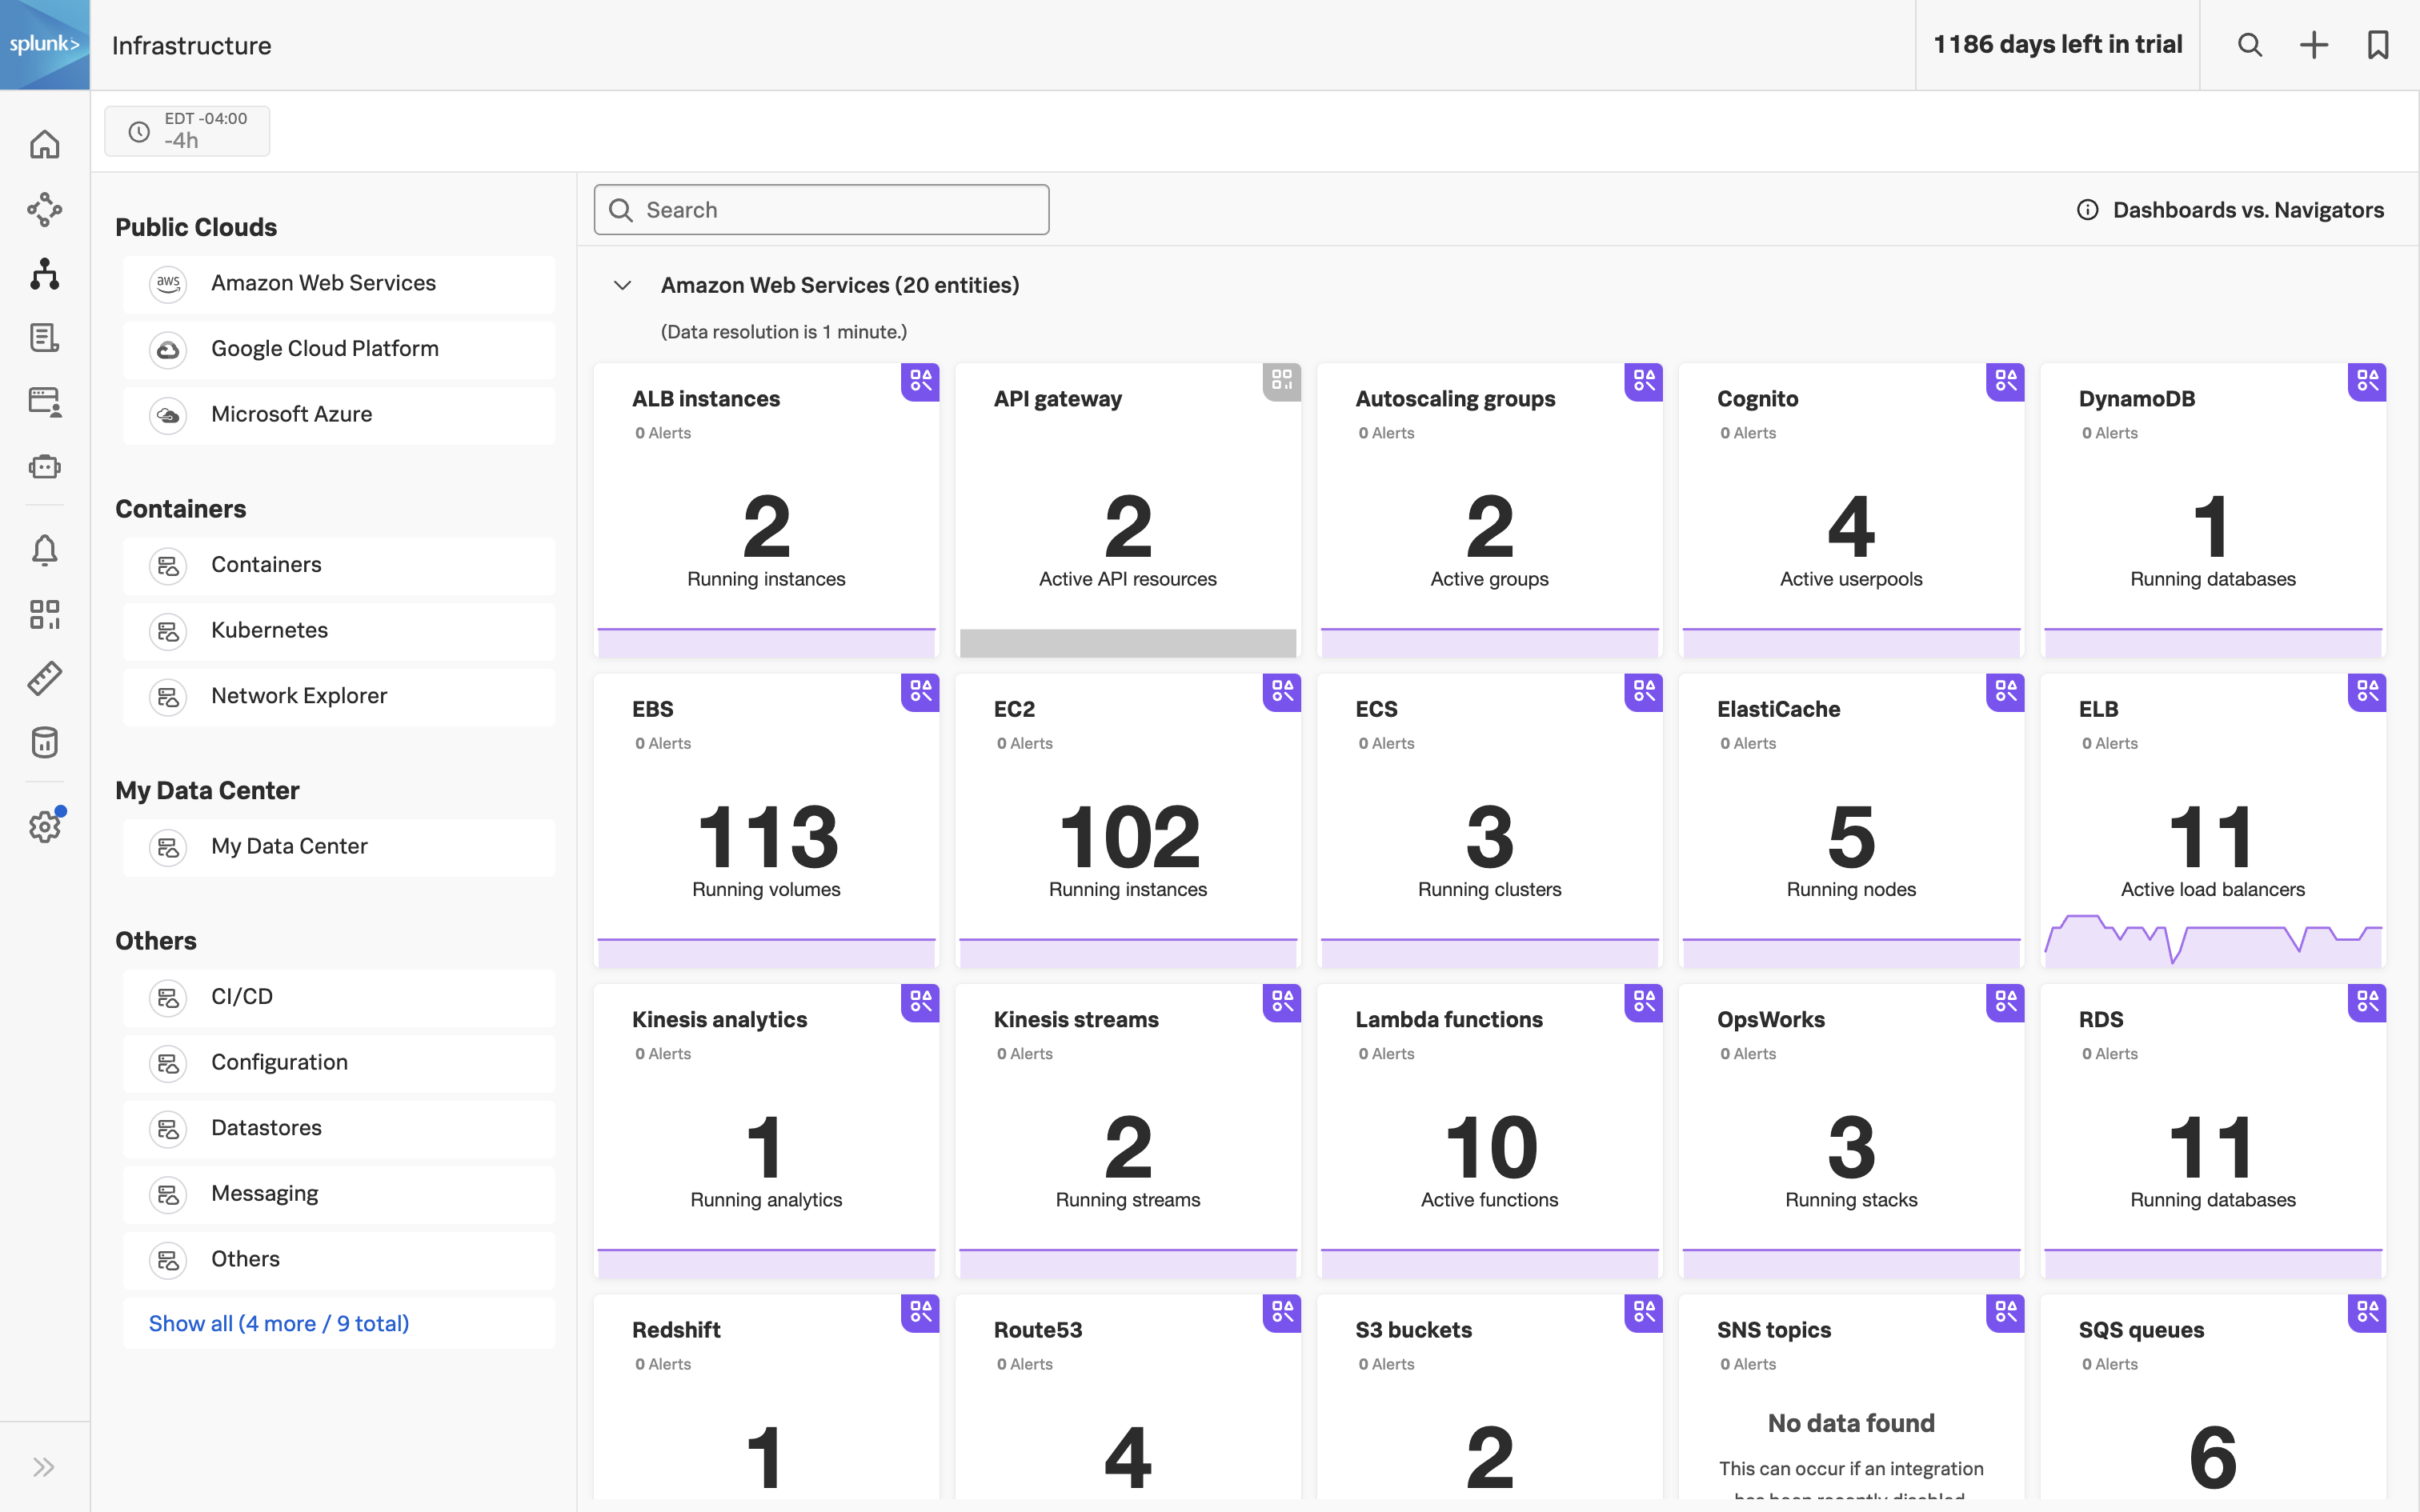
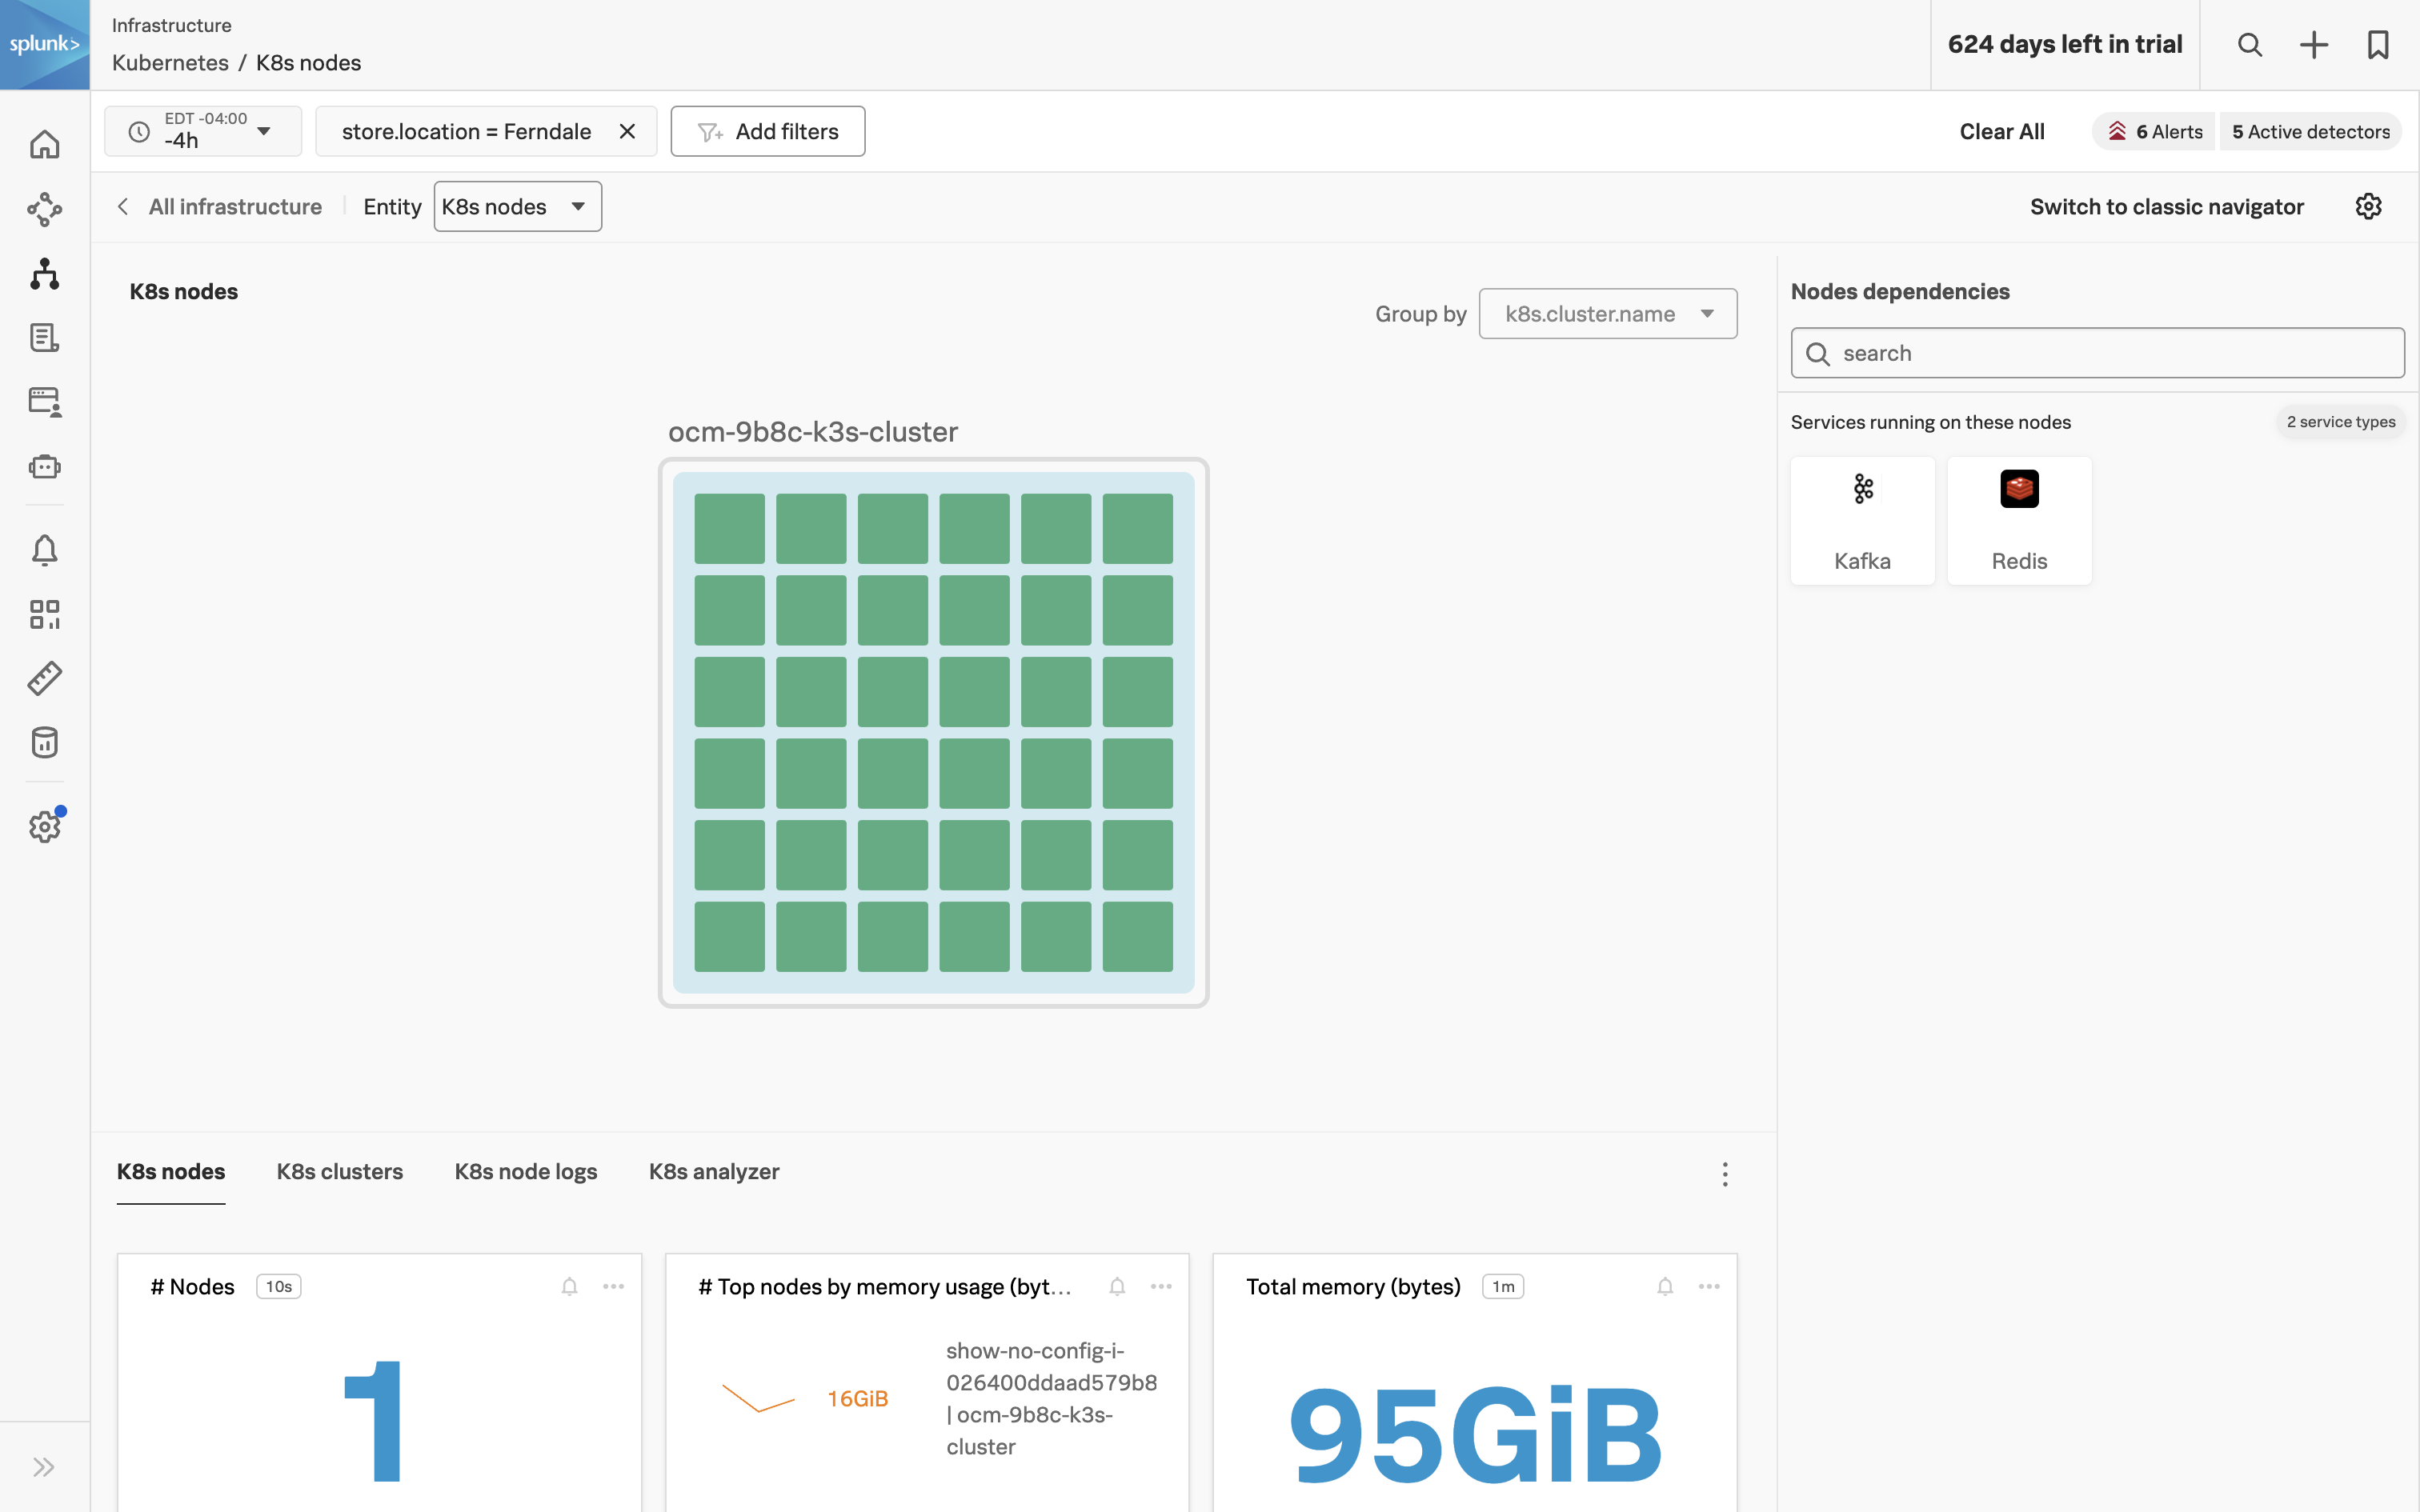
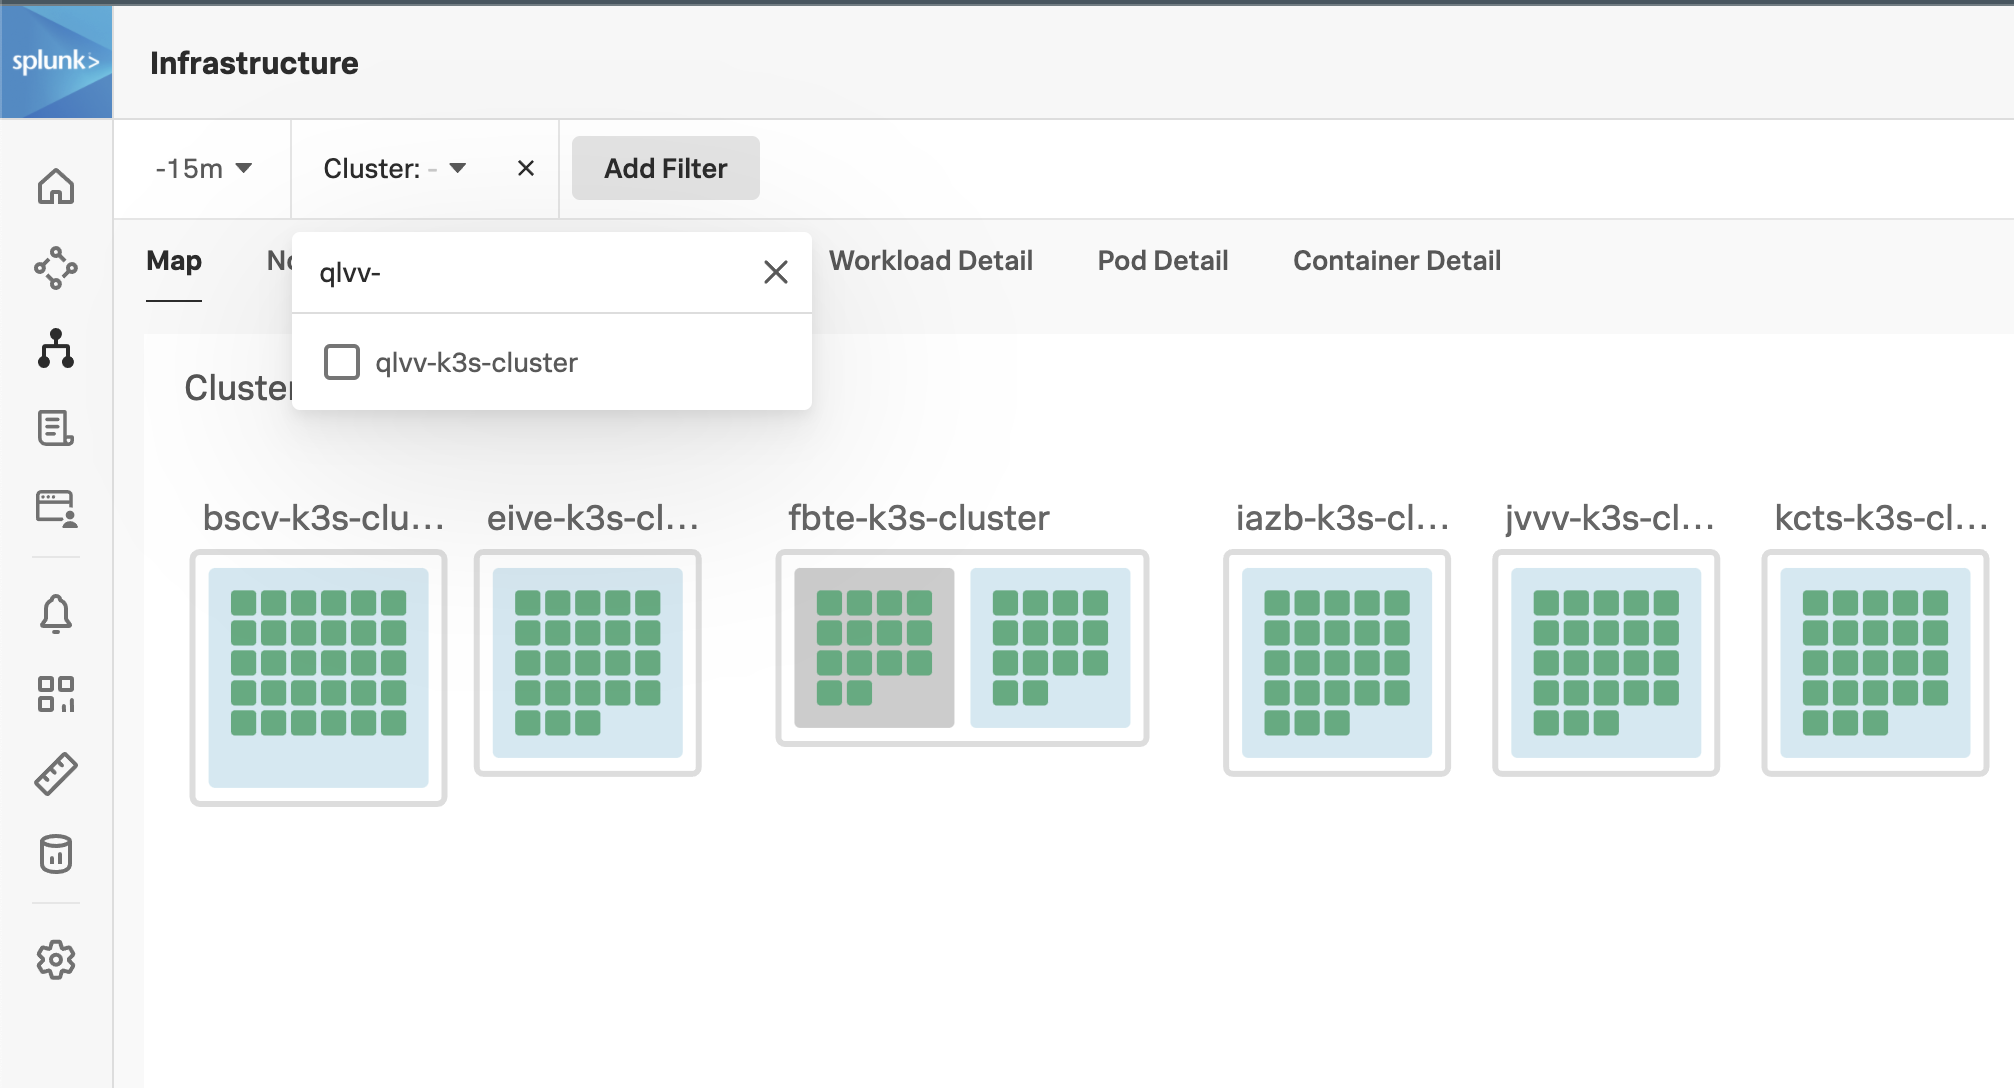
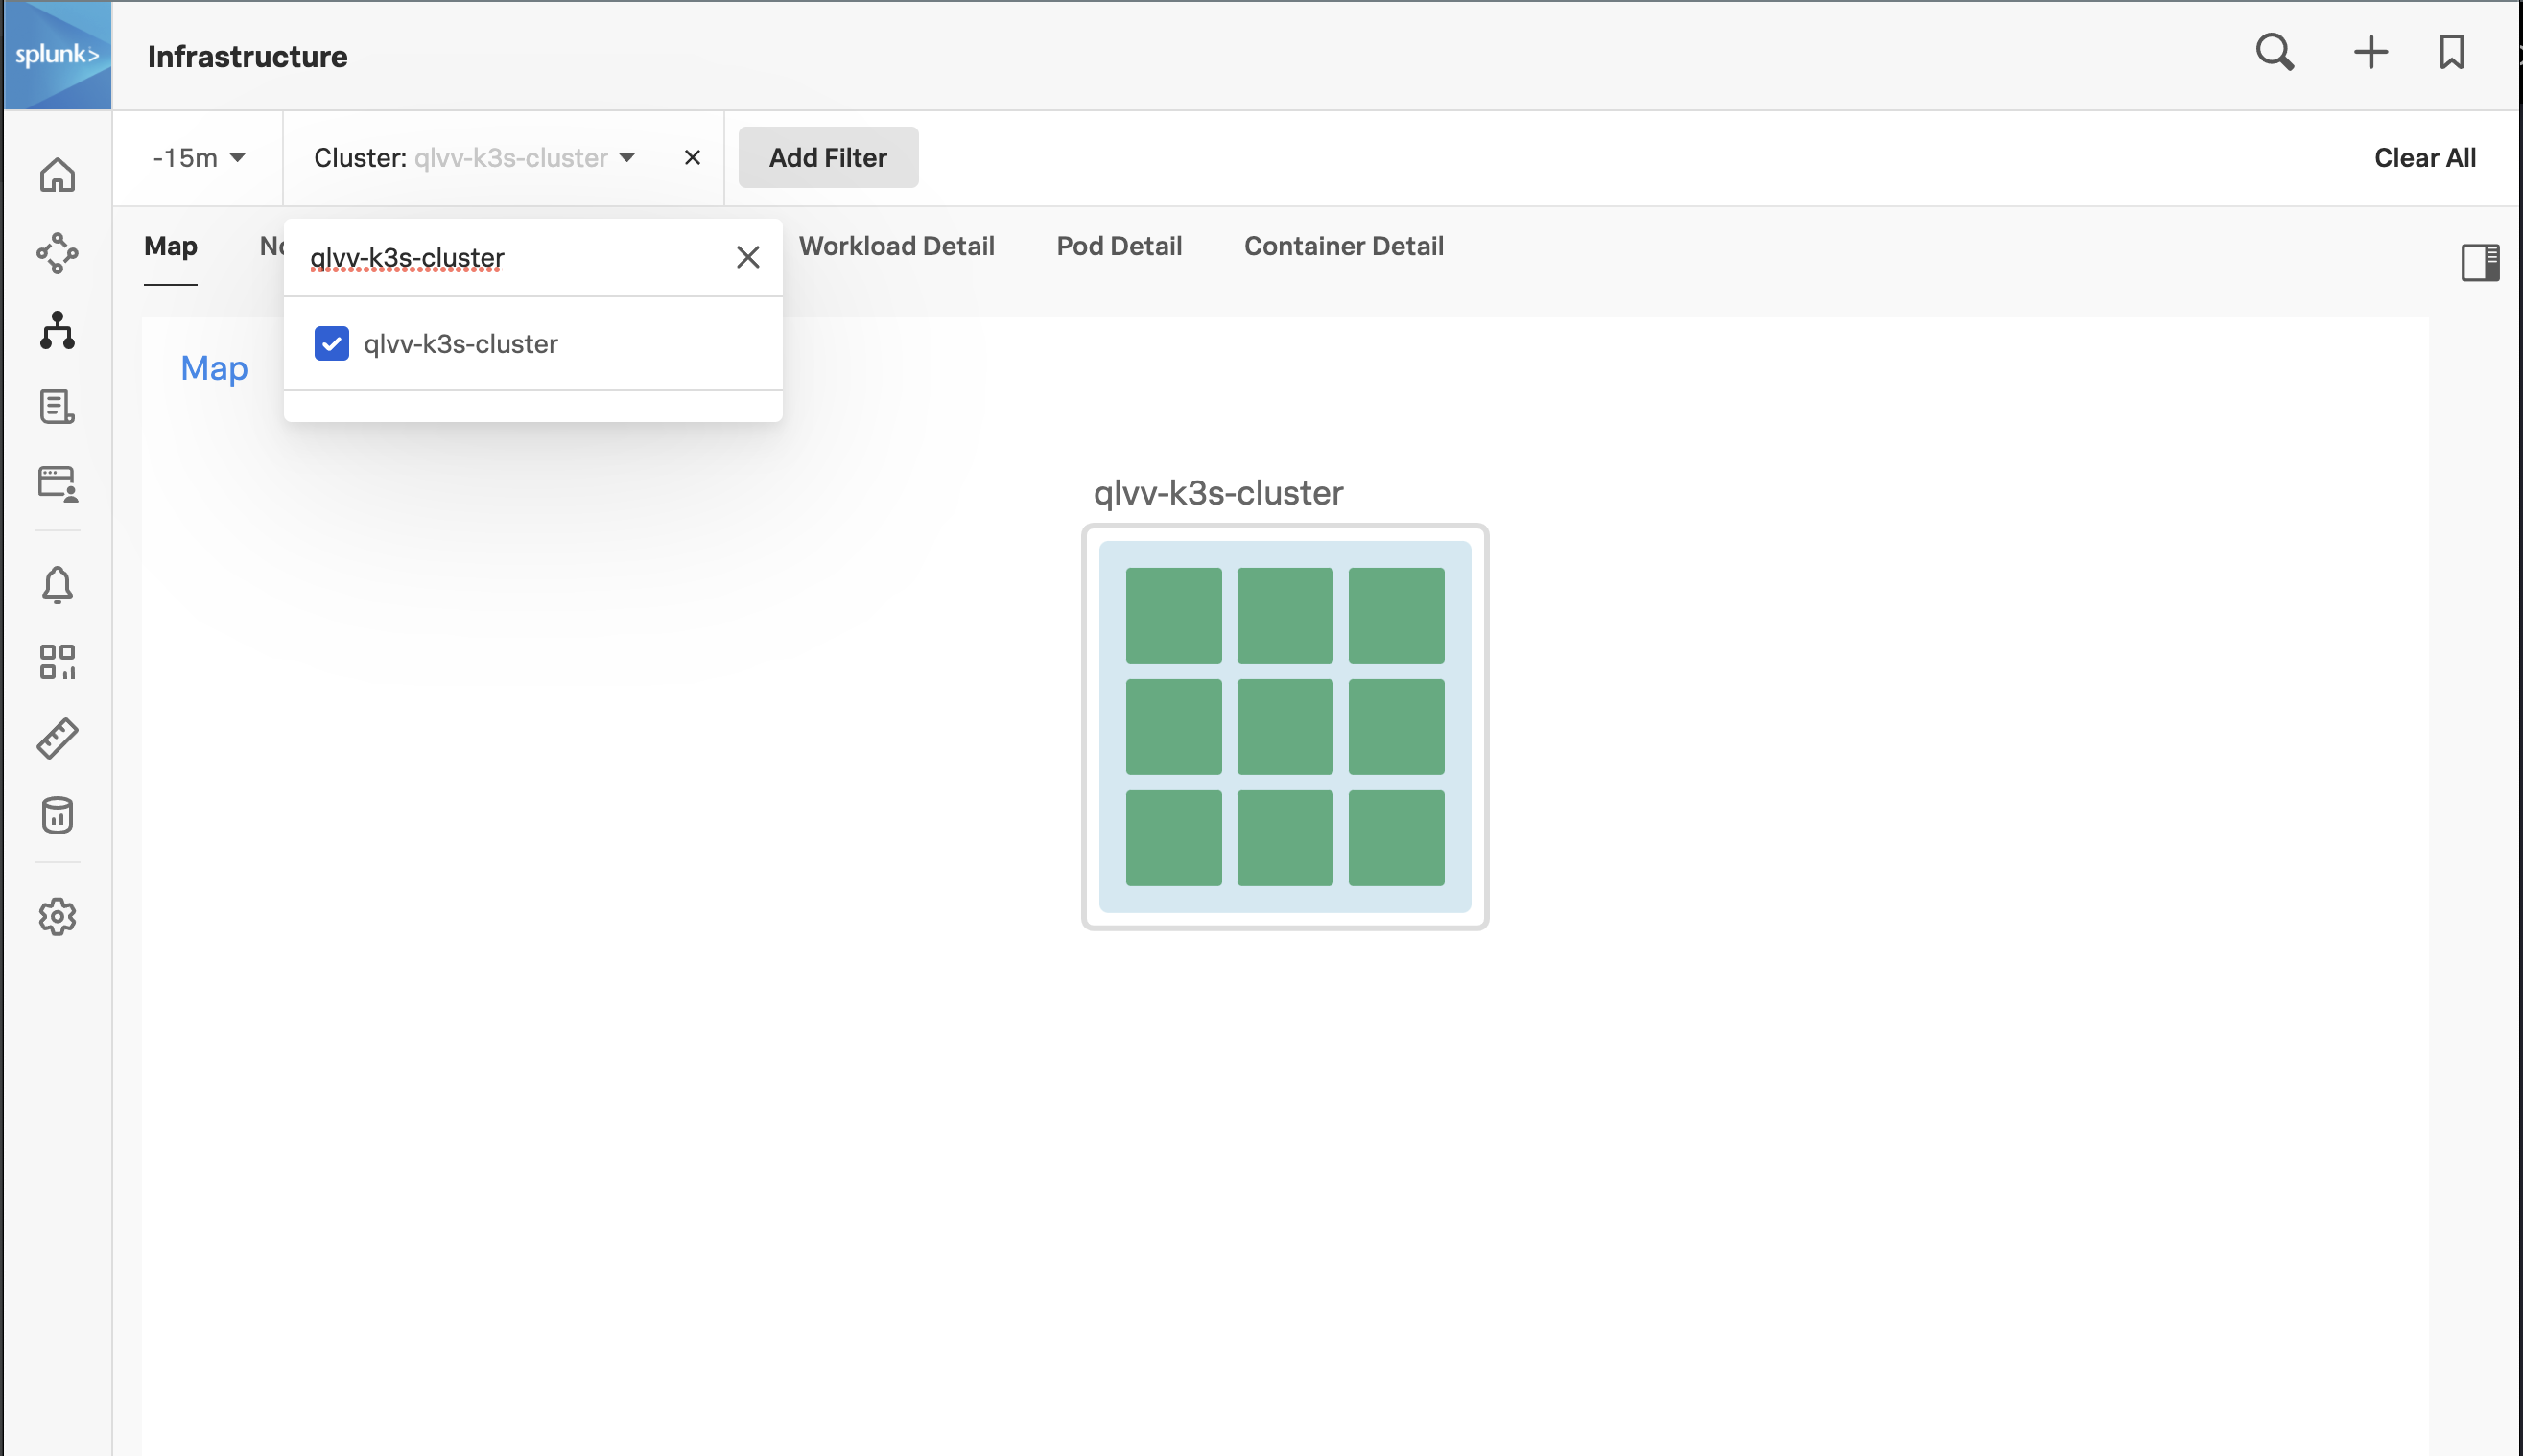
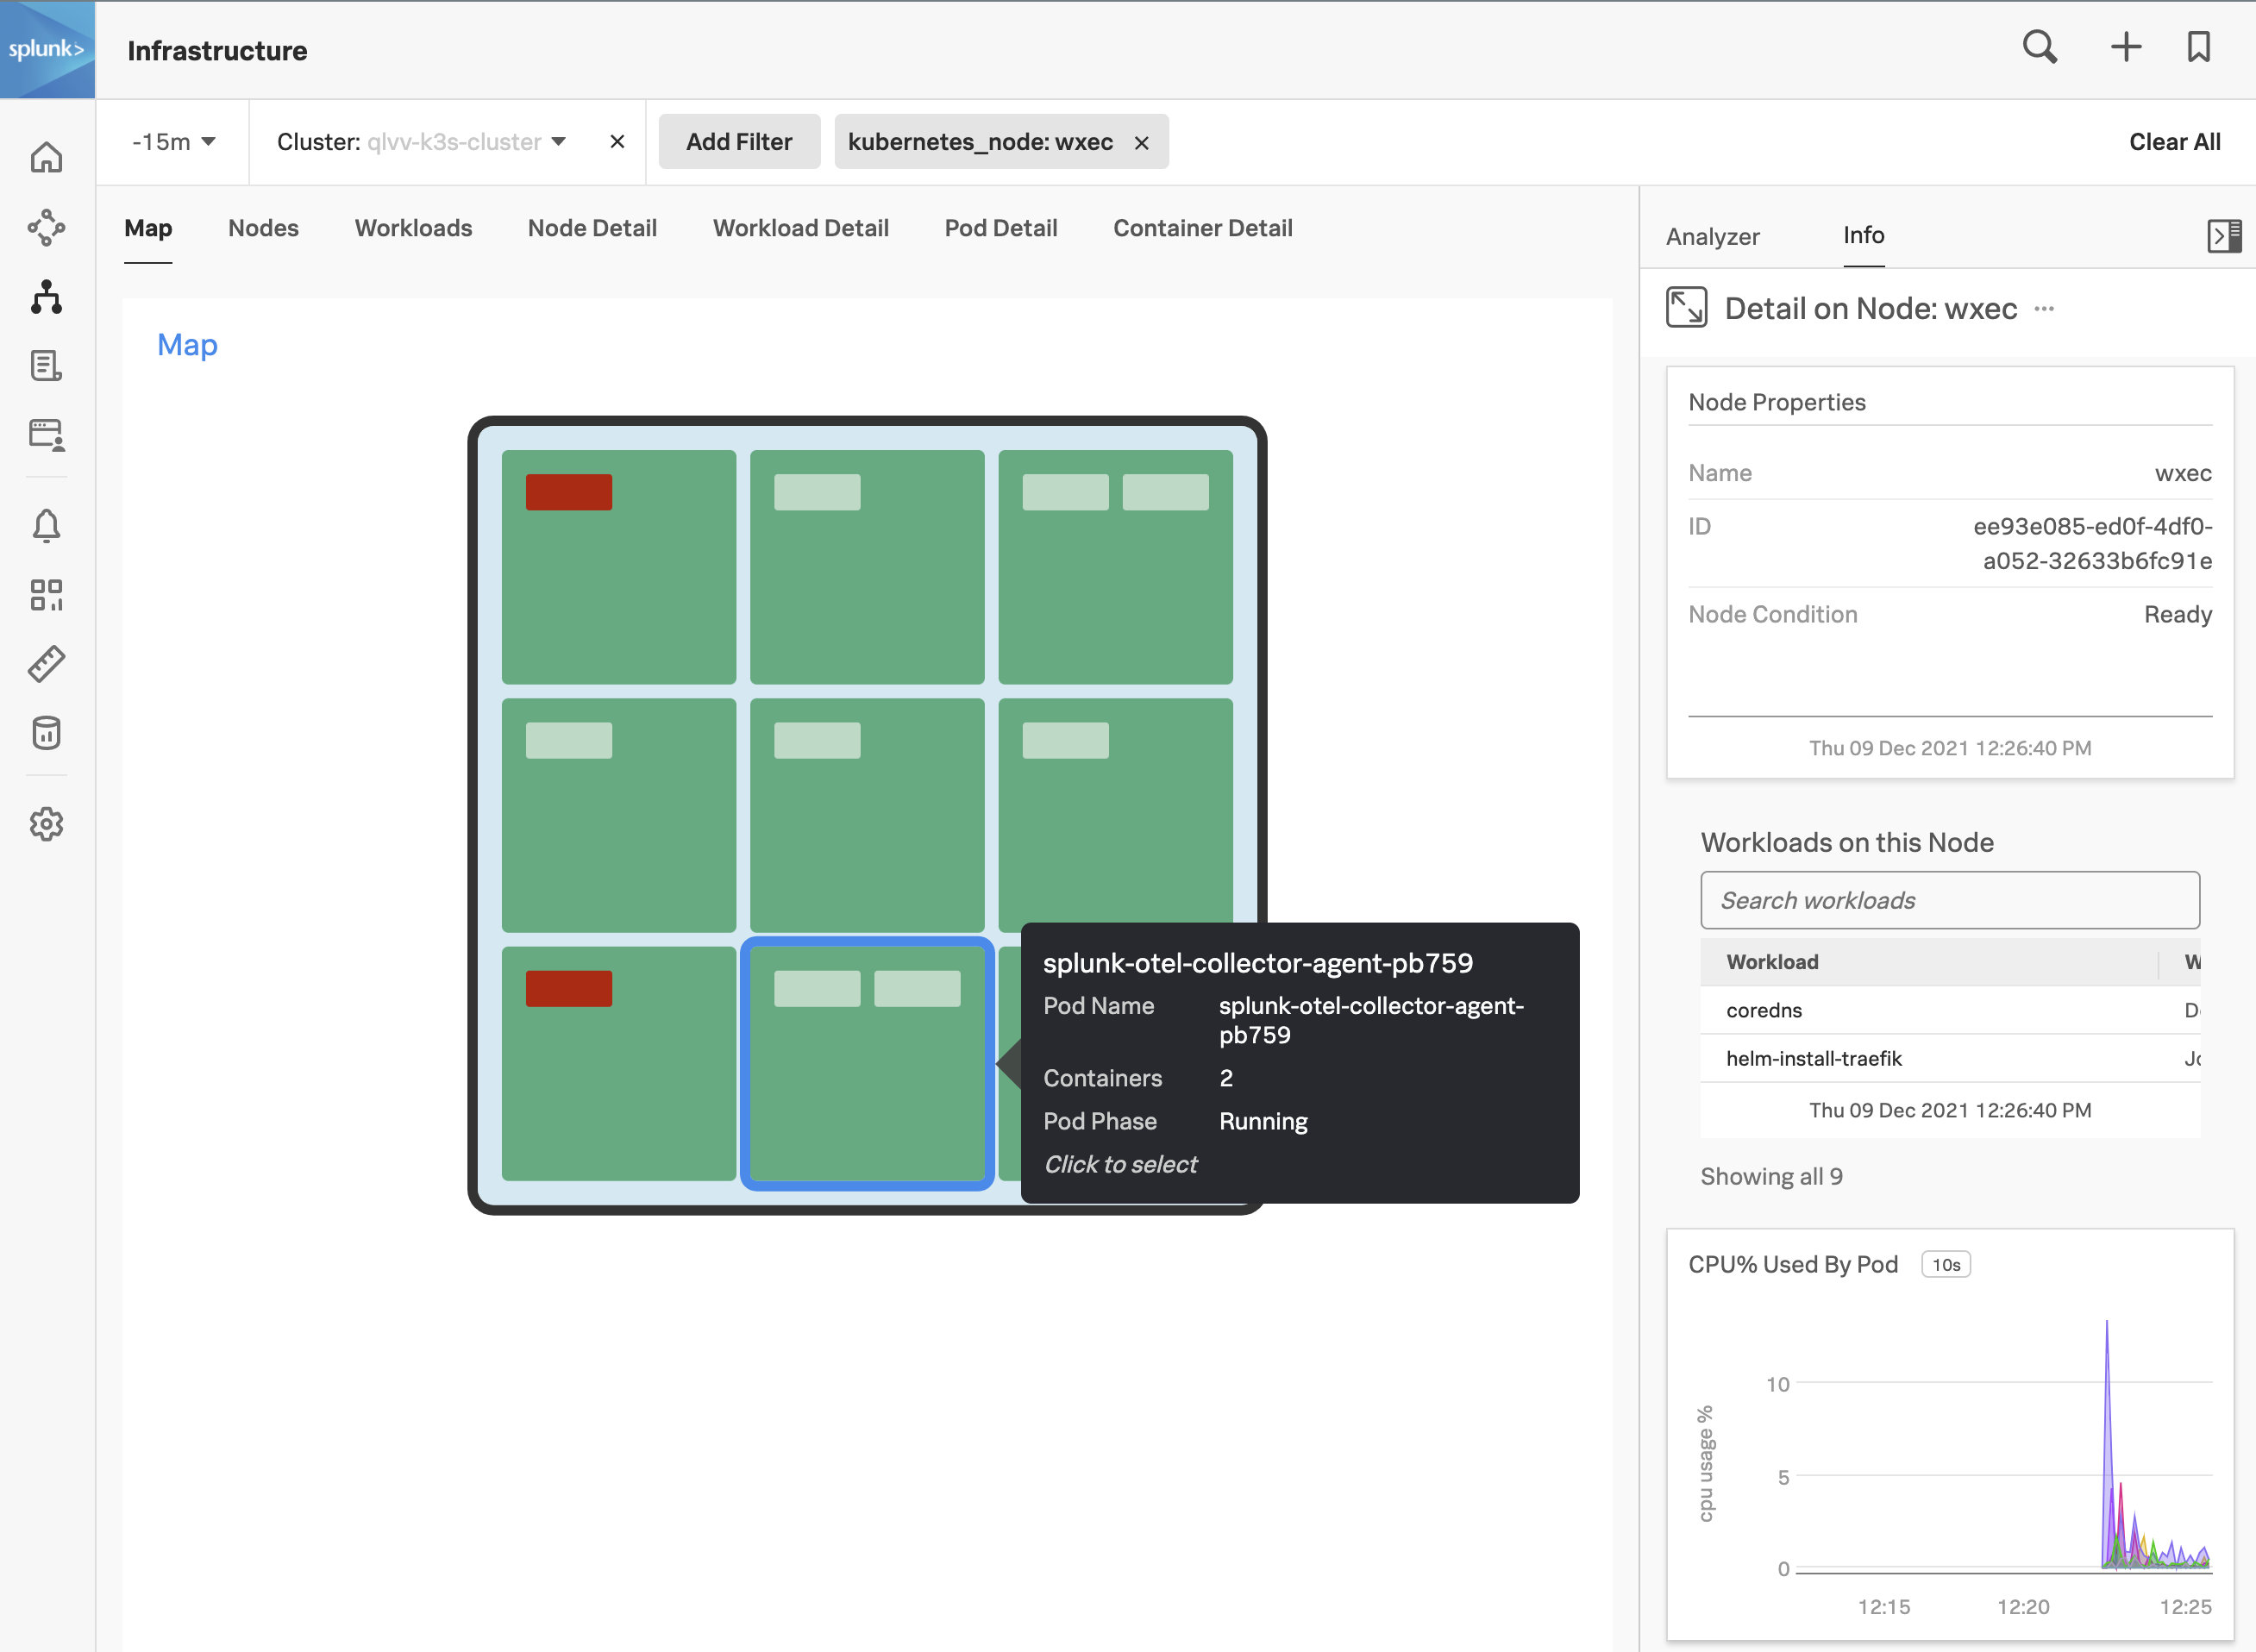
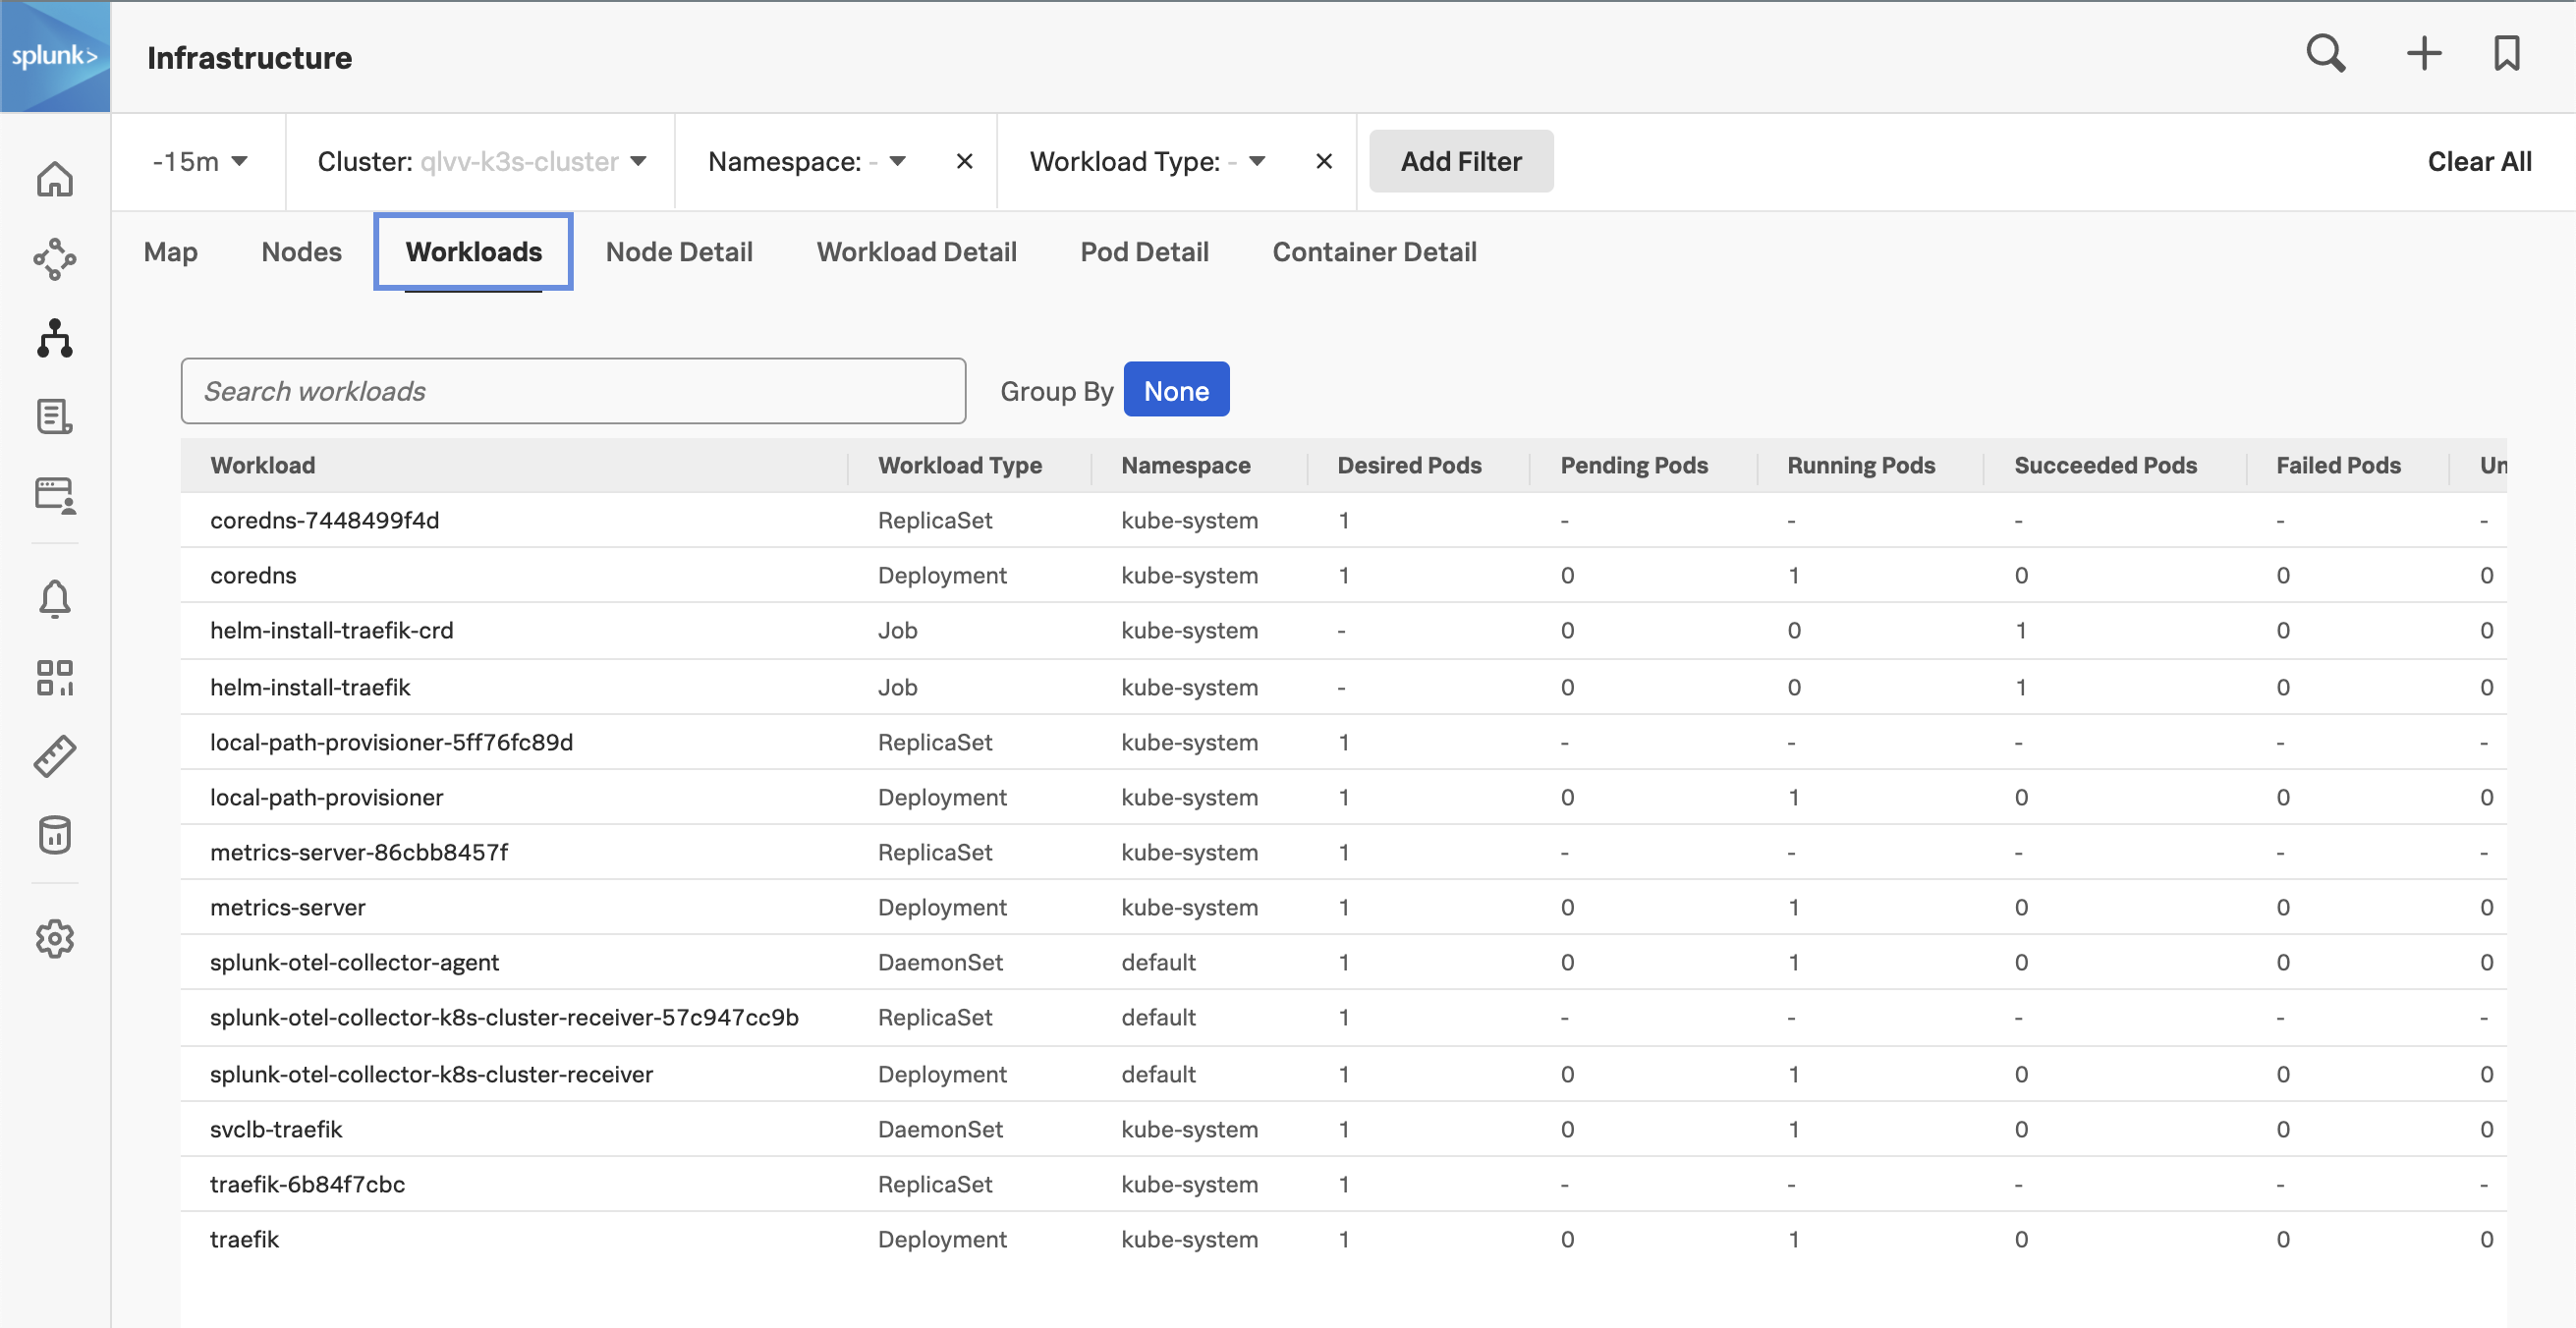
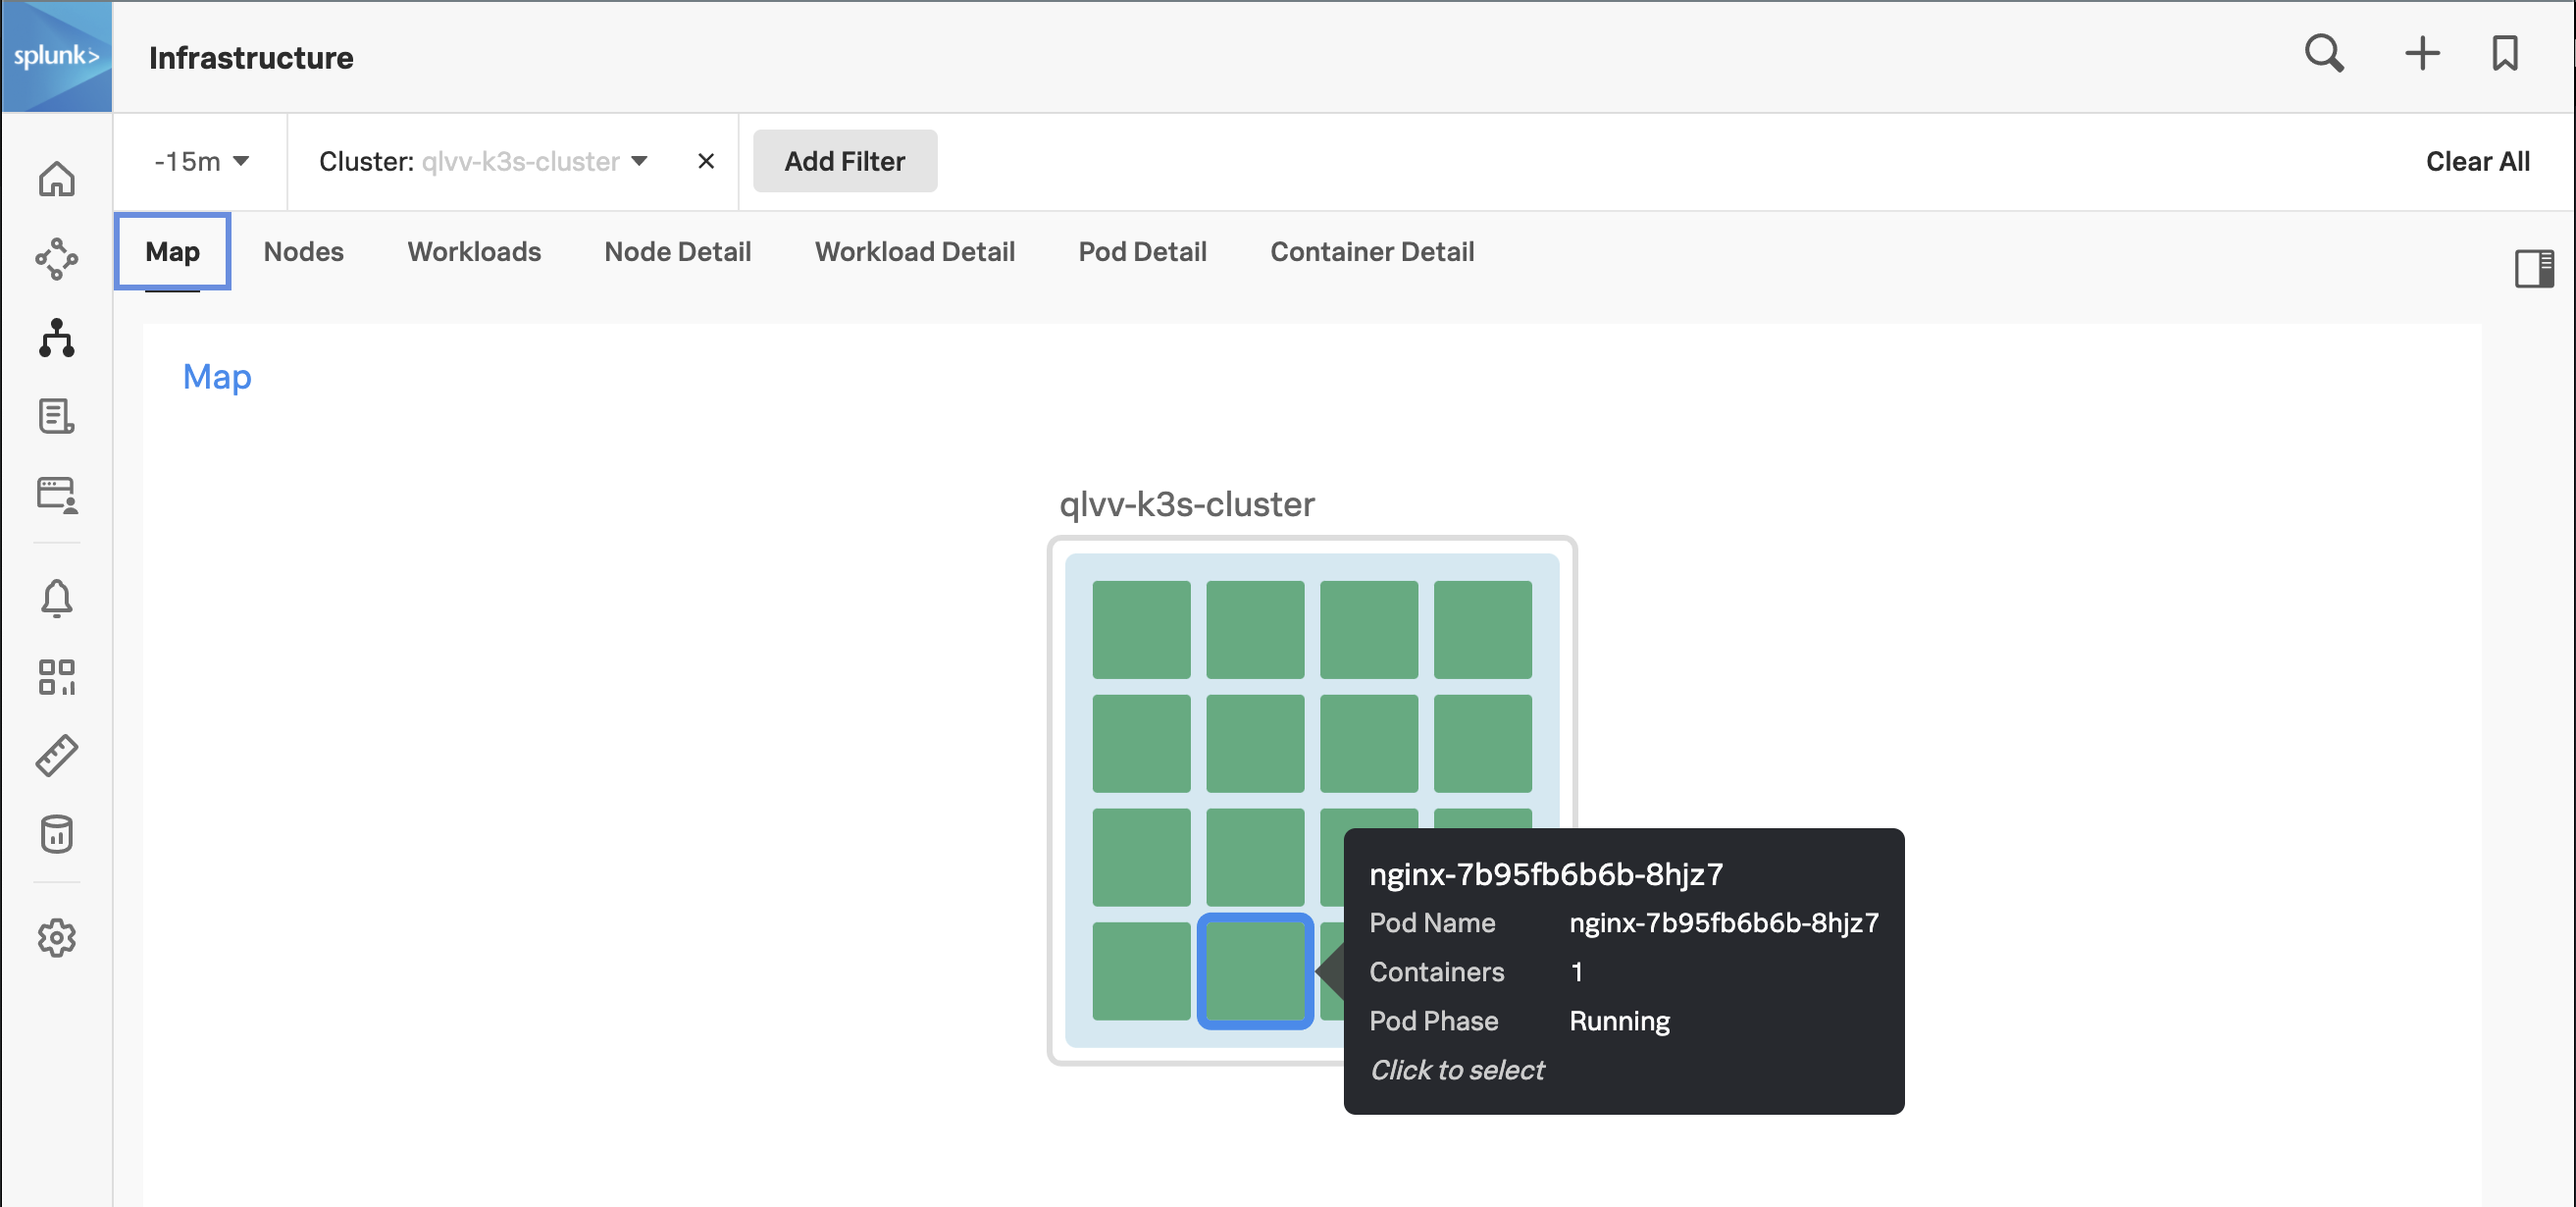
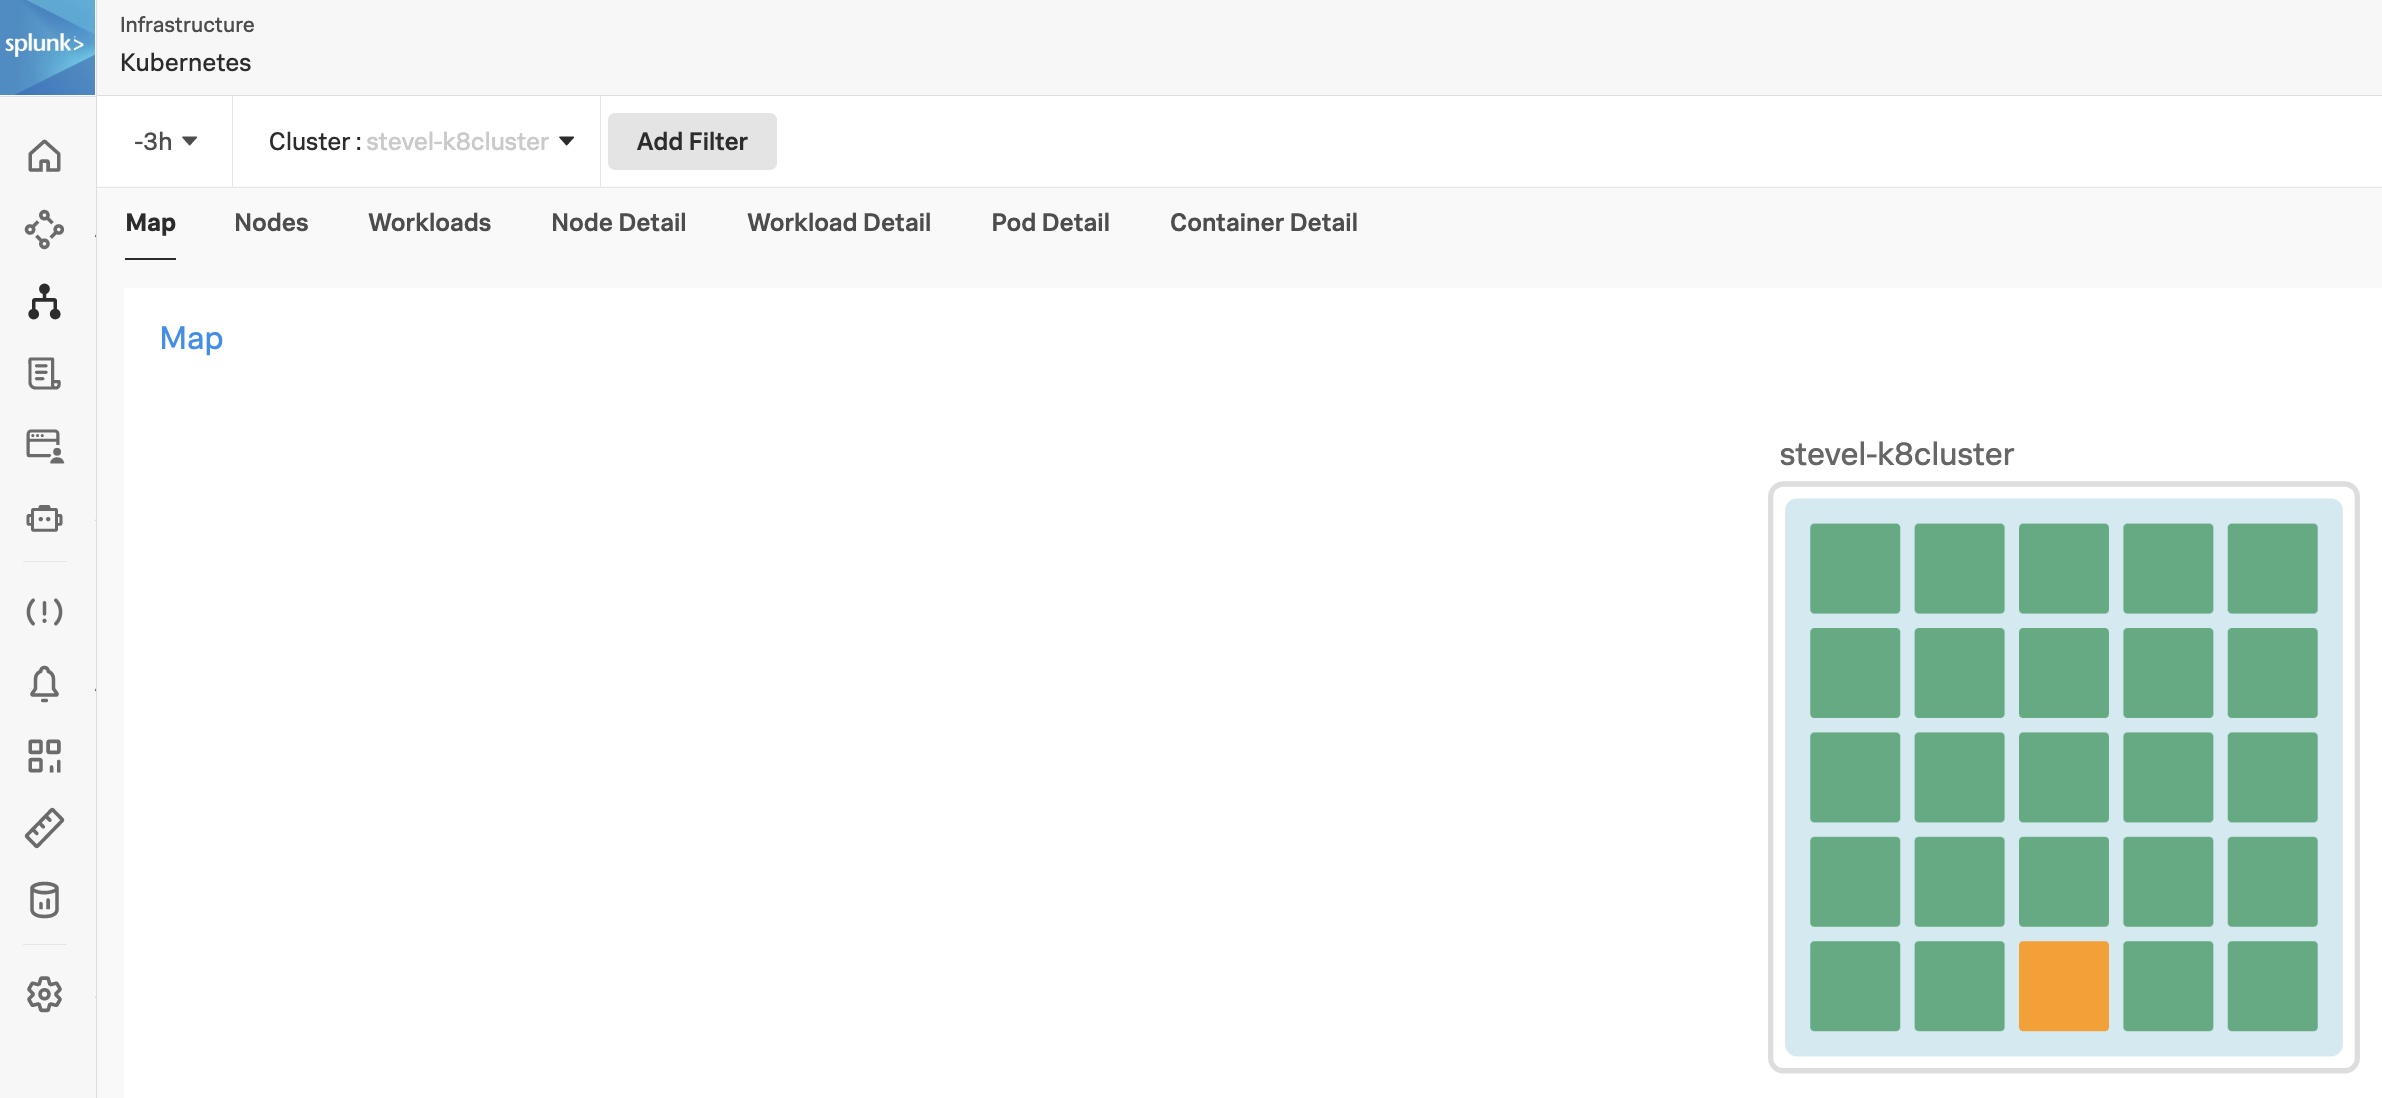
Depending on time, we did an Infrastructure exercise and looked at Metrics used in the Kubernetes Navigators and saw related services found on our Kubernetes cluster:
Understood what users were experiencing and used RUM & APM to Troubleshoot a particularly long page load, by following its trace across the front and back end and right to the log entries.
We used tools like RUM Session replay and the APM Dependency map with Breakdown to discover what is causing our issue:
Used Tag Spotlight, in both RUM and APM, to understand blast radius, detect trends and context for our performance issues and errors. We drilled down in Span’s in the APM Trace waterfall to see how services interacted and find errors:
We used the Related content feature to follow the link between our Trace directly to the Logs related to our Trace and used filters to drill down to the exact cause of our issue.
We then looked at Synthetics, which can simulate web and mobile traffic and we used the available Synthetic Test, first to confirm our finding from RUM/AMP and Log observer, then we created a Detector so we would be alerted if when the run time of a test exceeded our SLA.
In the final exercise, we created a health dashboard to keep that running for our Developers and SREs on a TV screen:
Learn how to enable automatic discovery and configuration for your Java-based application running in Kubernetes. Experience real-time monitoring to help you maximize application behavior with end-to-end visibility.
A workshop using Zero Configuration Auto-Instrumentation for NodeJS.
Subsections of Automatic Discovery Workshops
PetClinic Monolith Workshop
30 minutesAuthor
Robert Castley
The goal is to walk through the basic steps to configure the following components of the Splunk Observability Cloud platform:
Splunk Infrastructure Monitoring (IM)
Splunk Automatic Discovery for Java (APM)
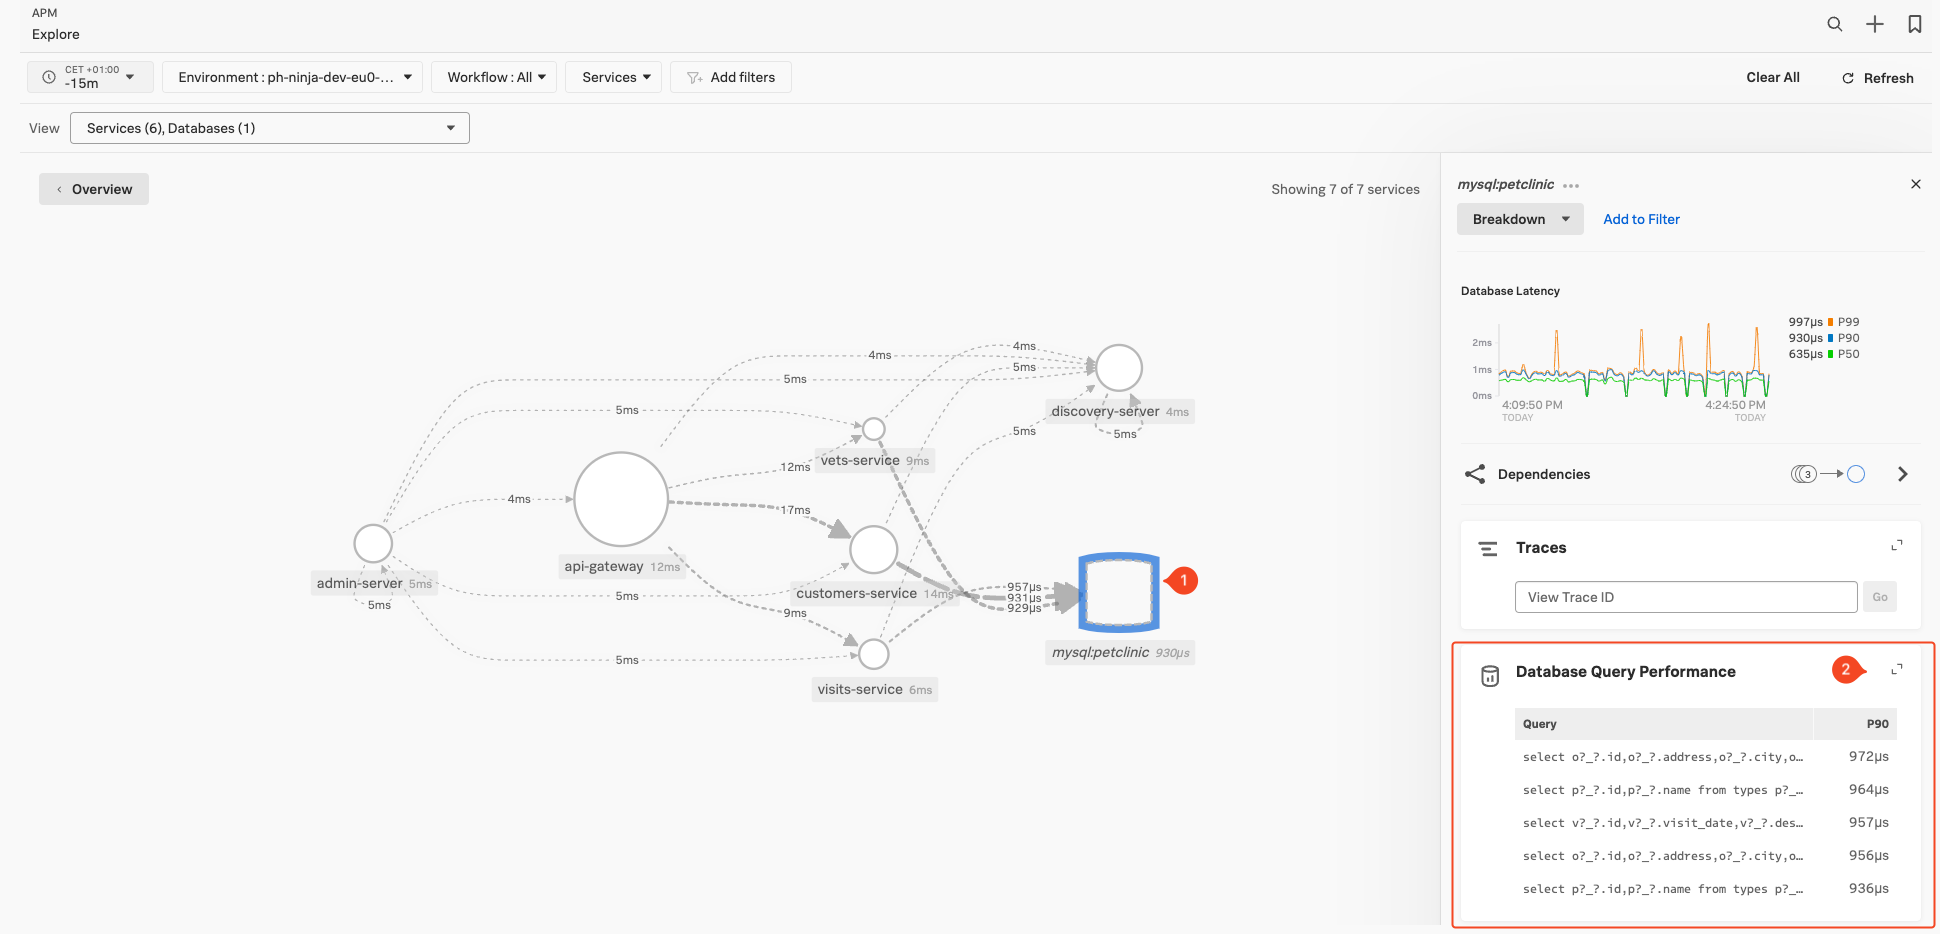
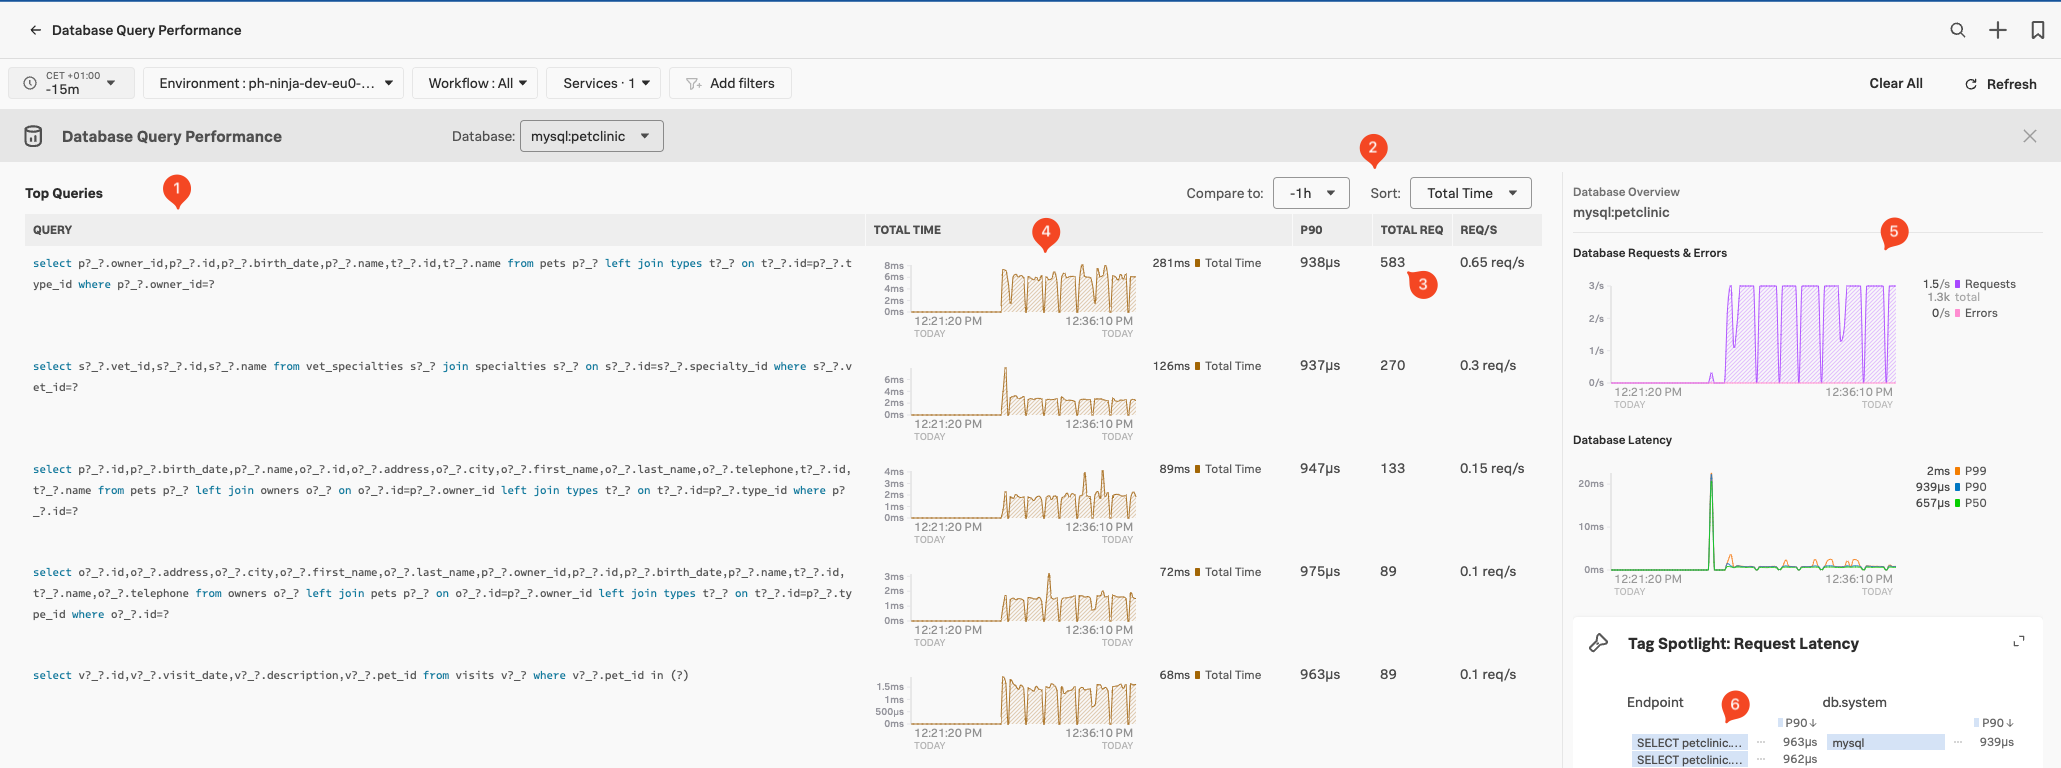
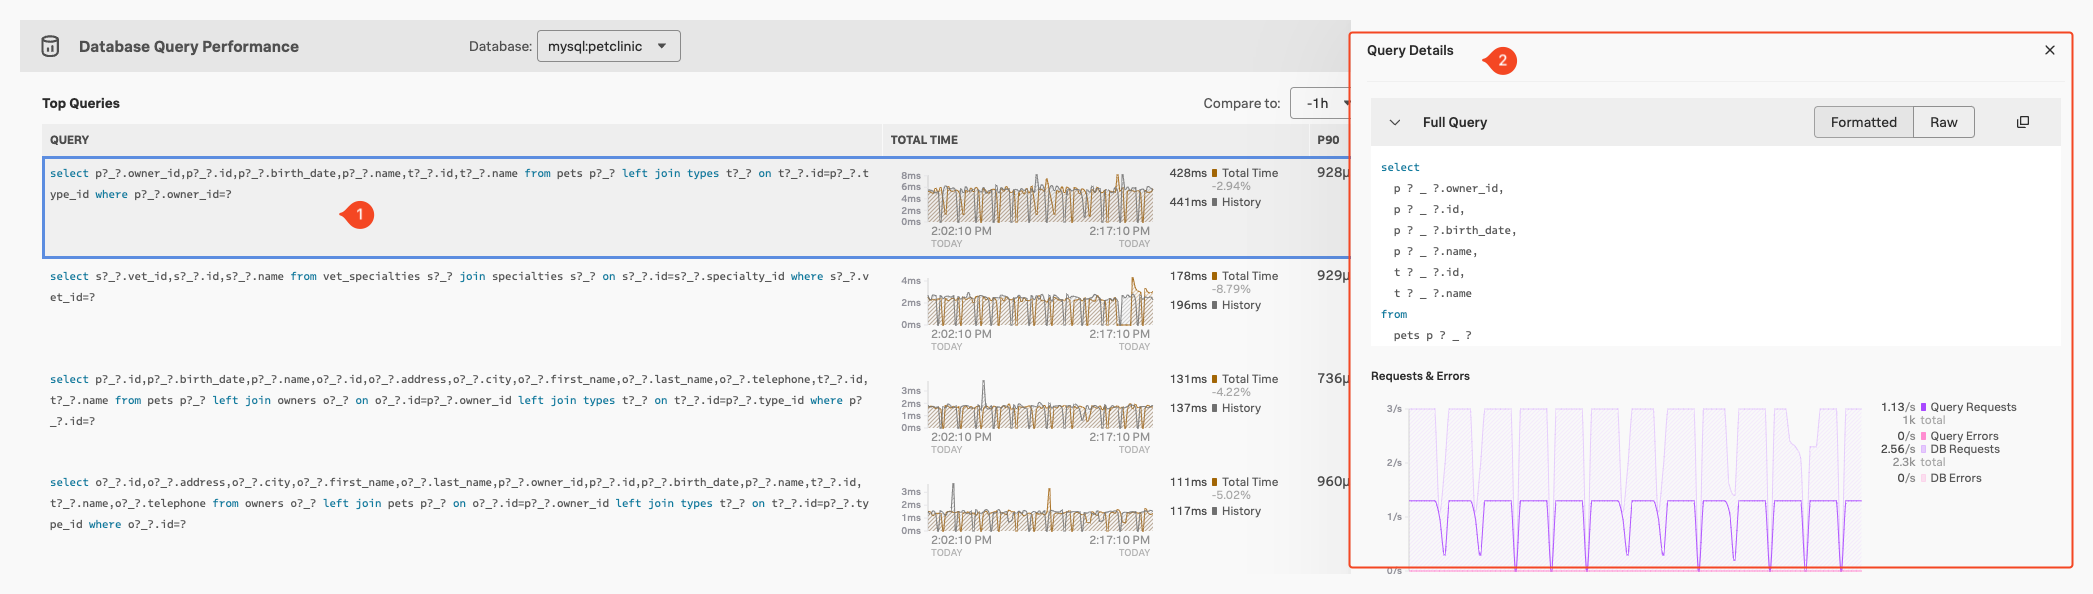
Database Query Performance
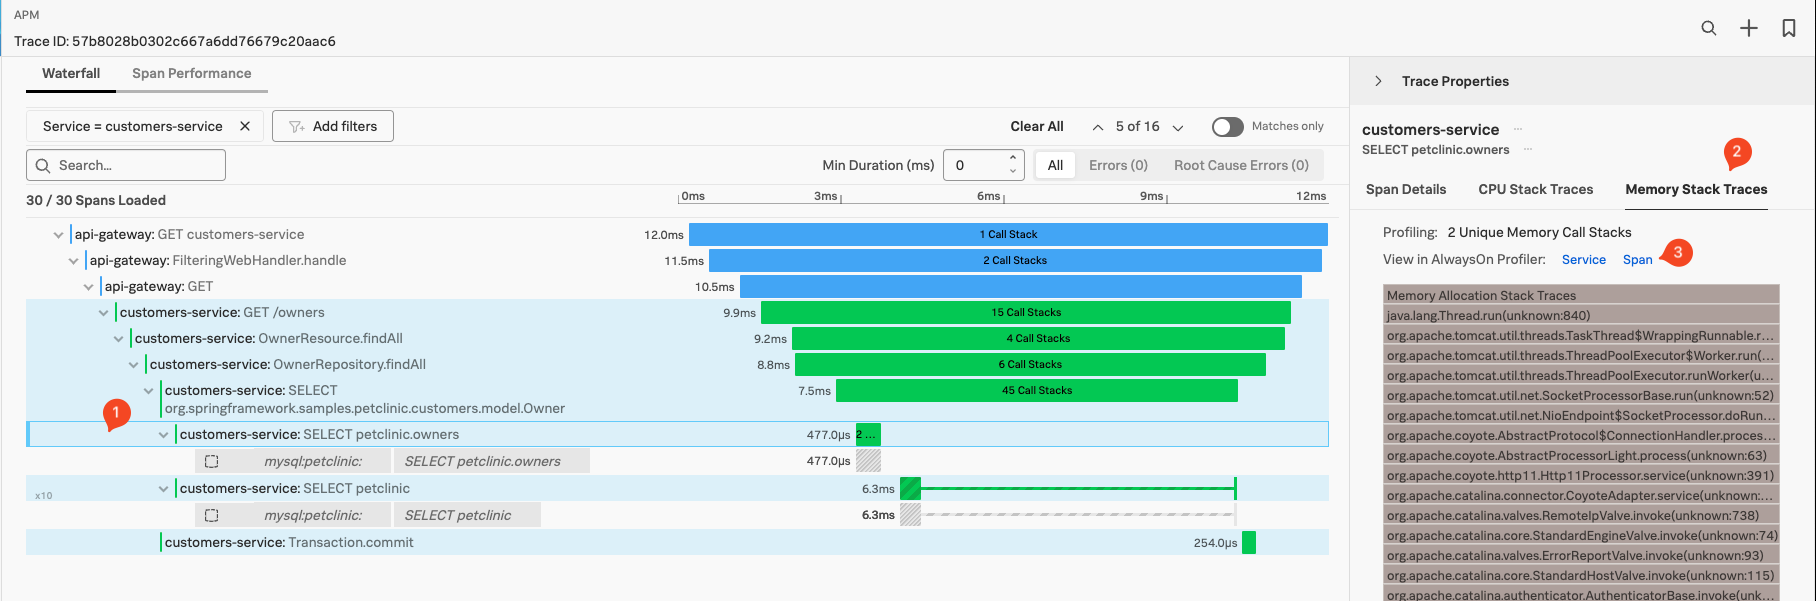
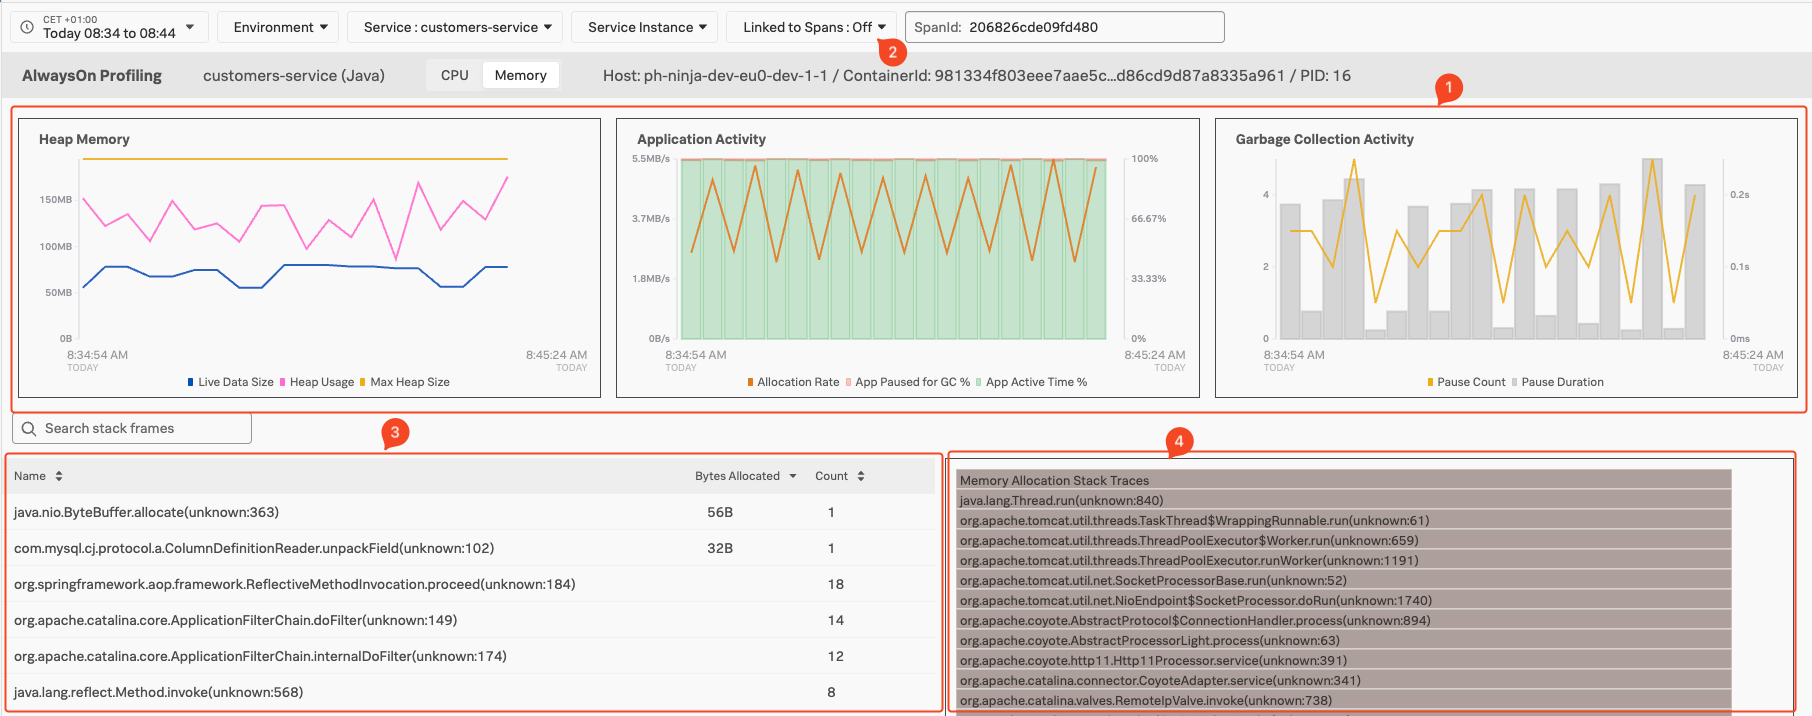
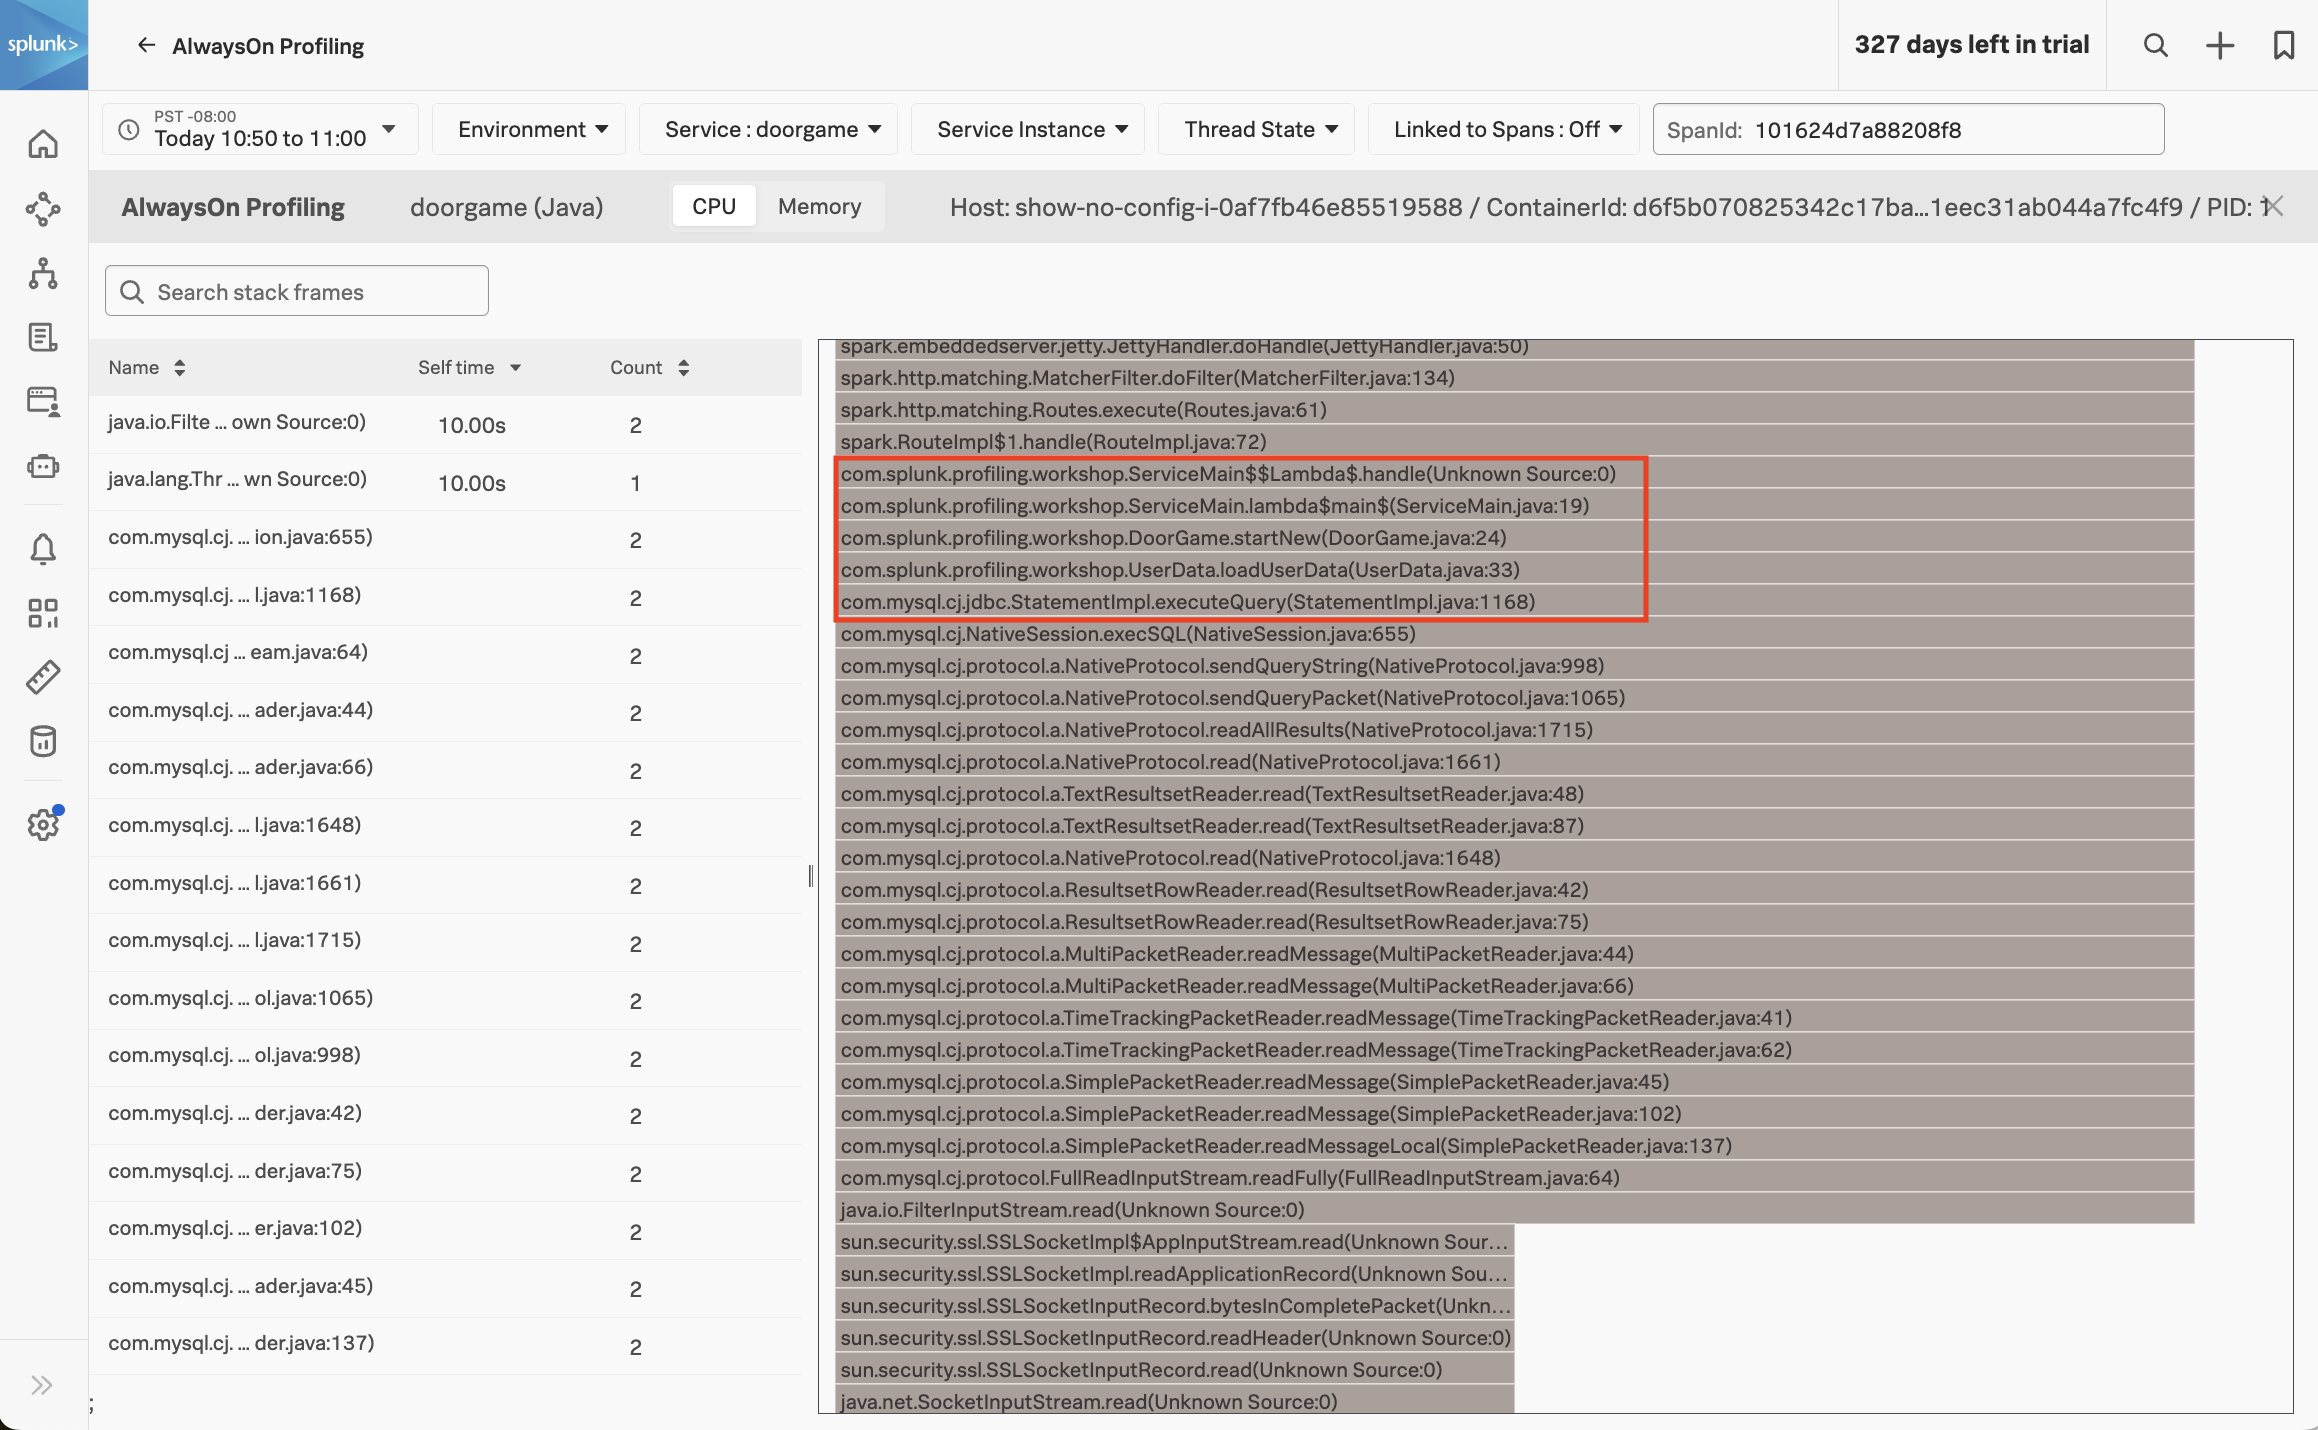
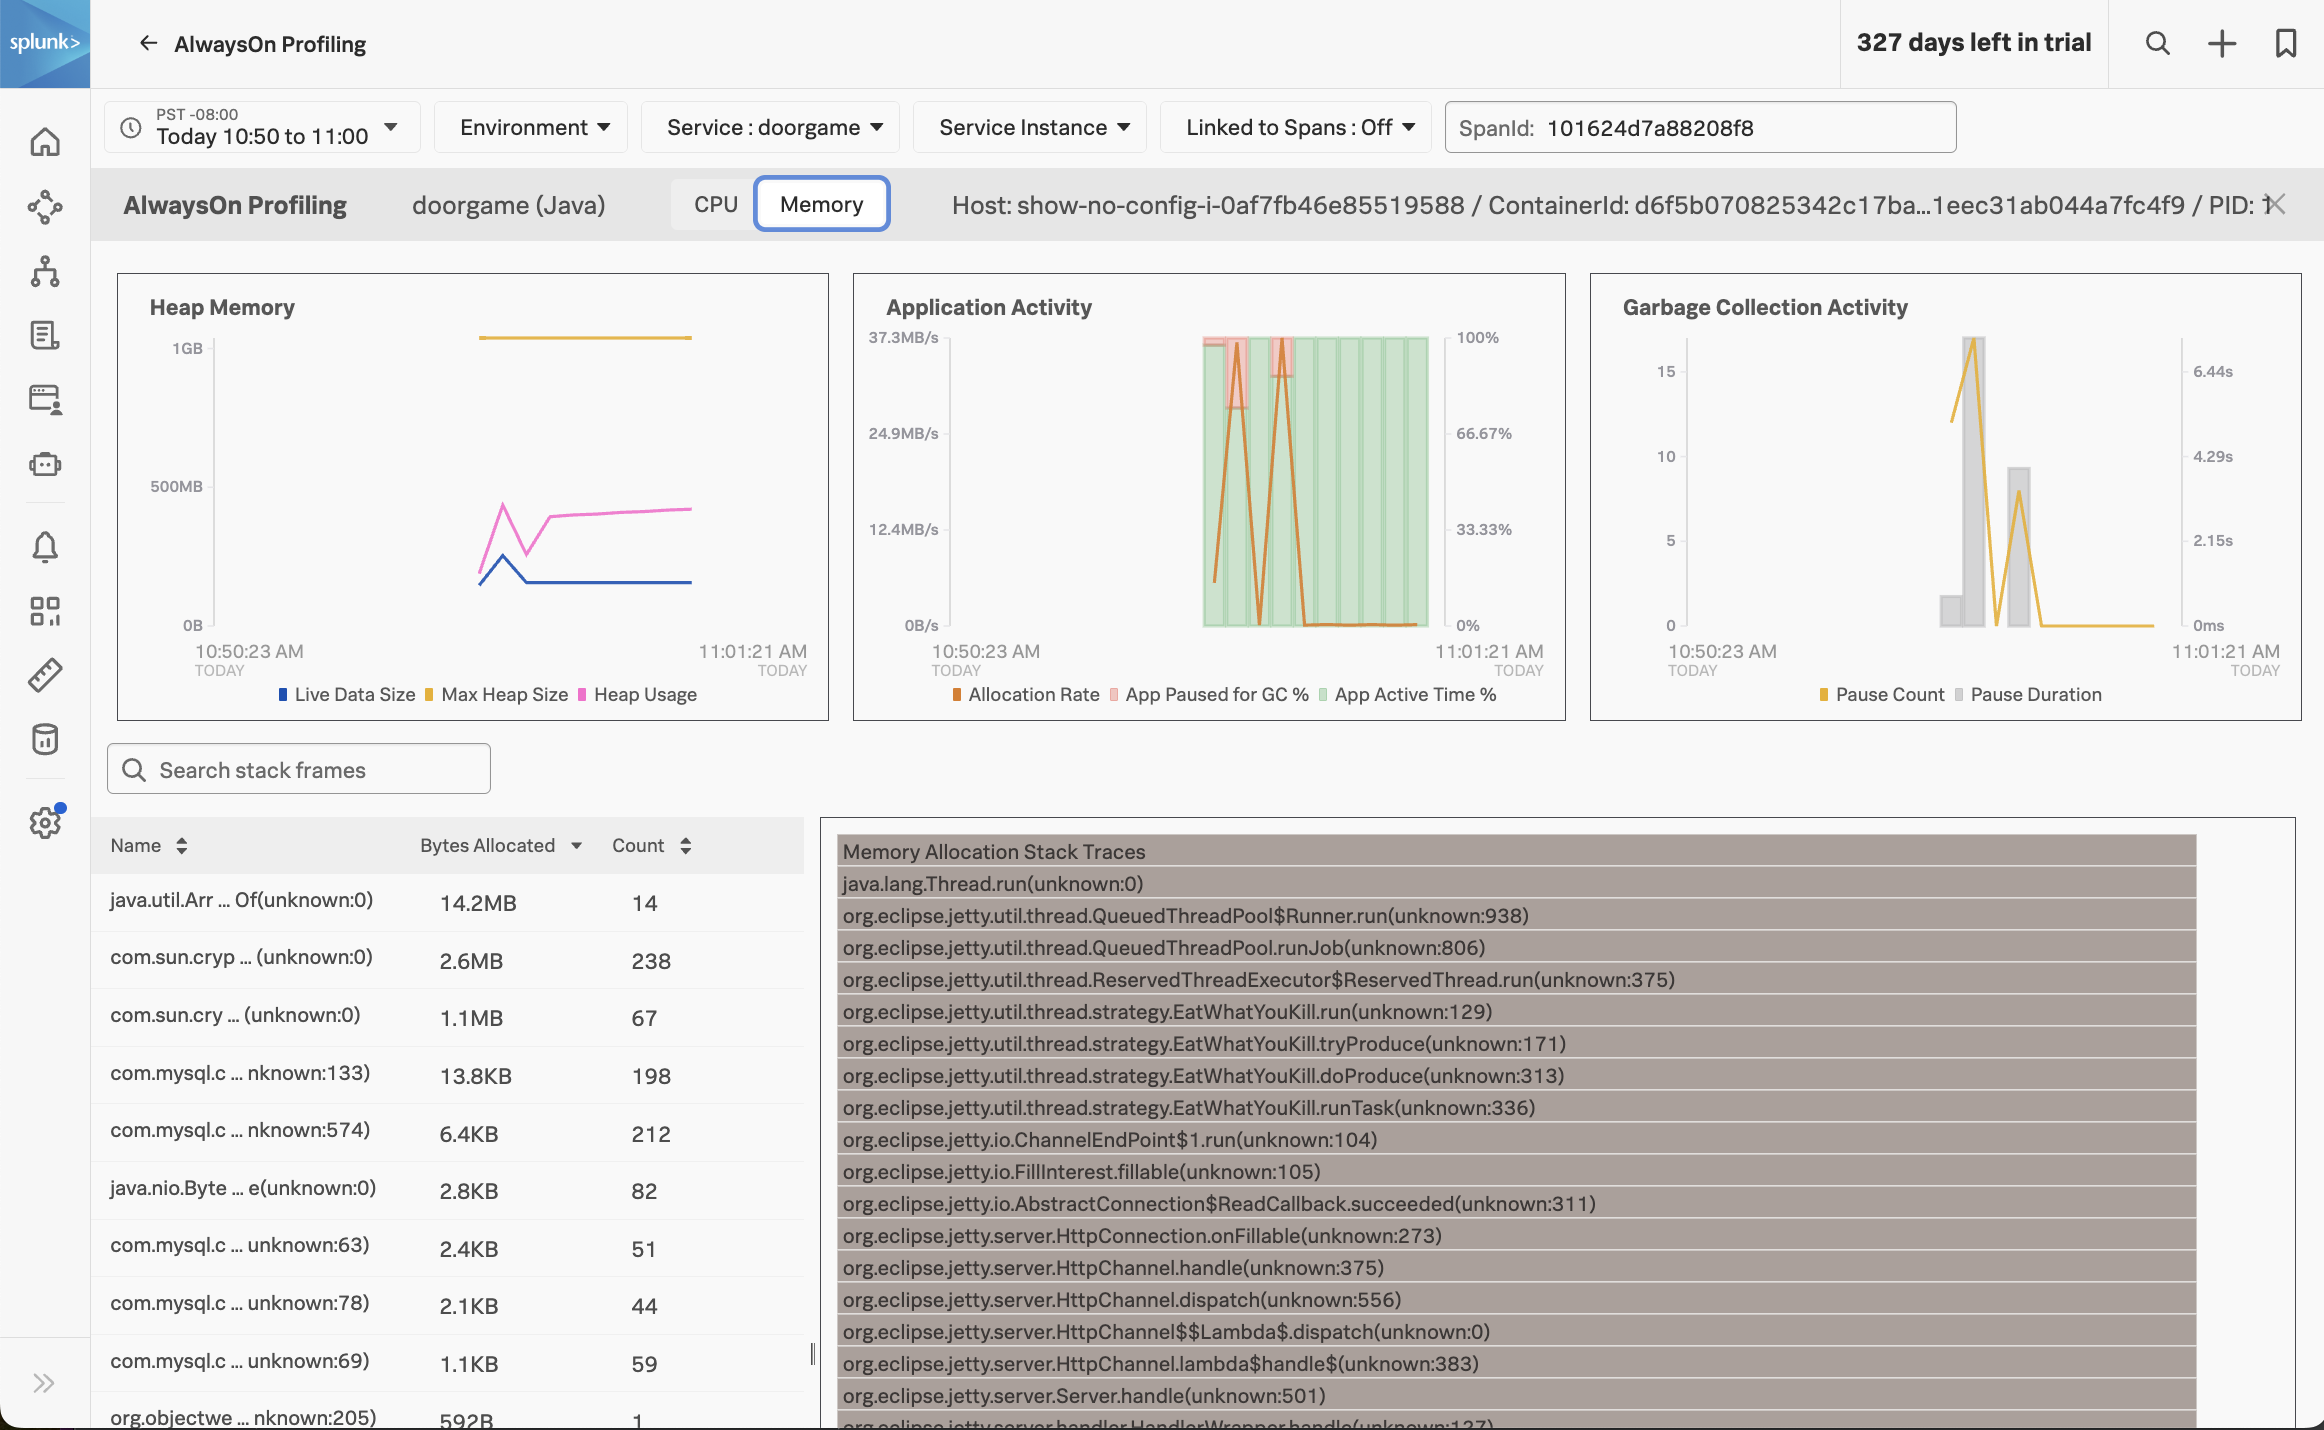
AlwaysOn Profiling
Splunk Real User Monitoring (RUM)
RUM to APM Correlation
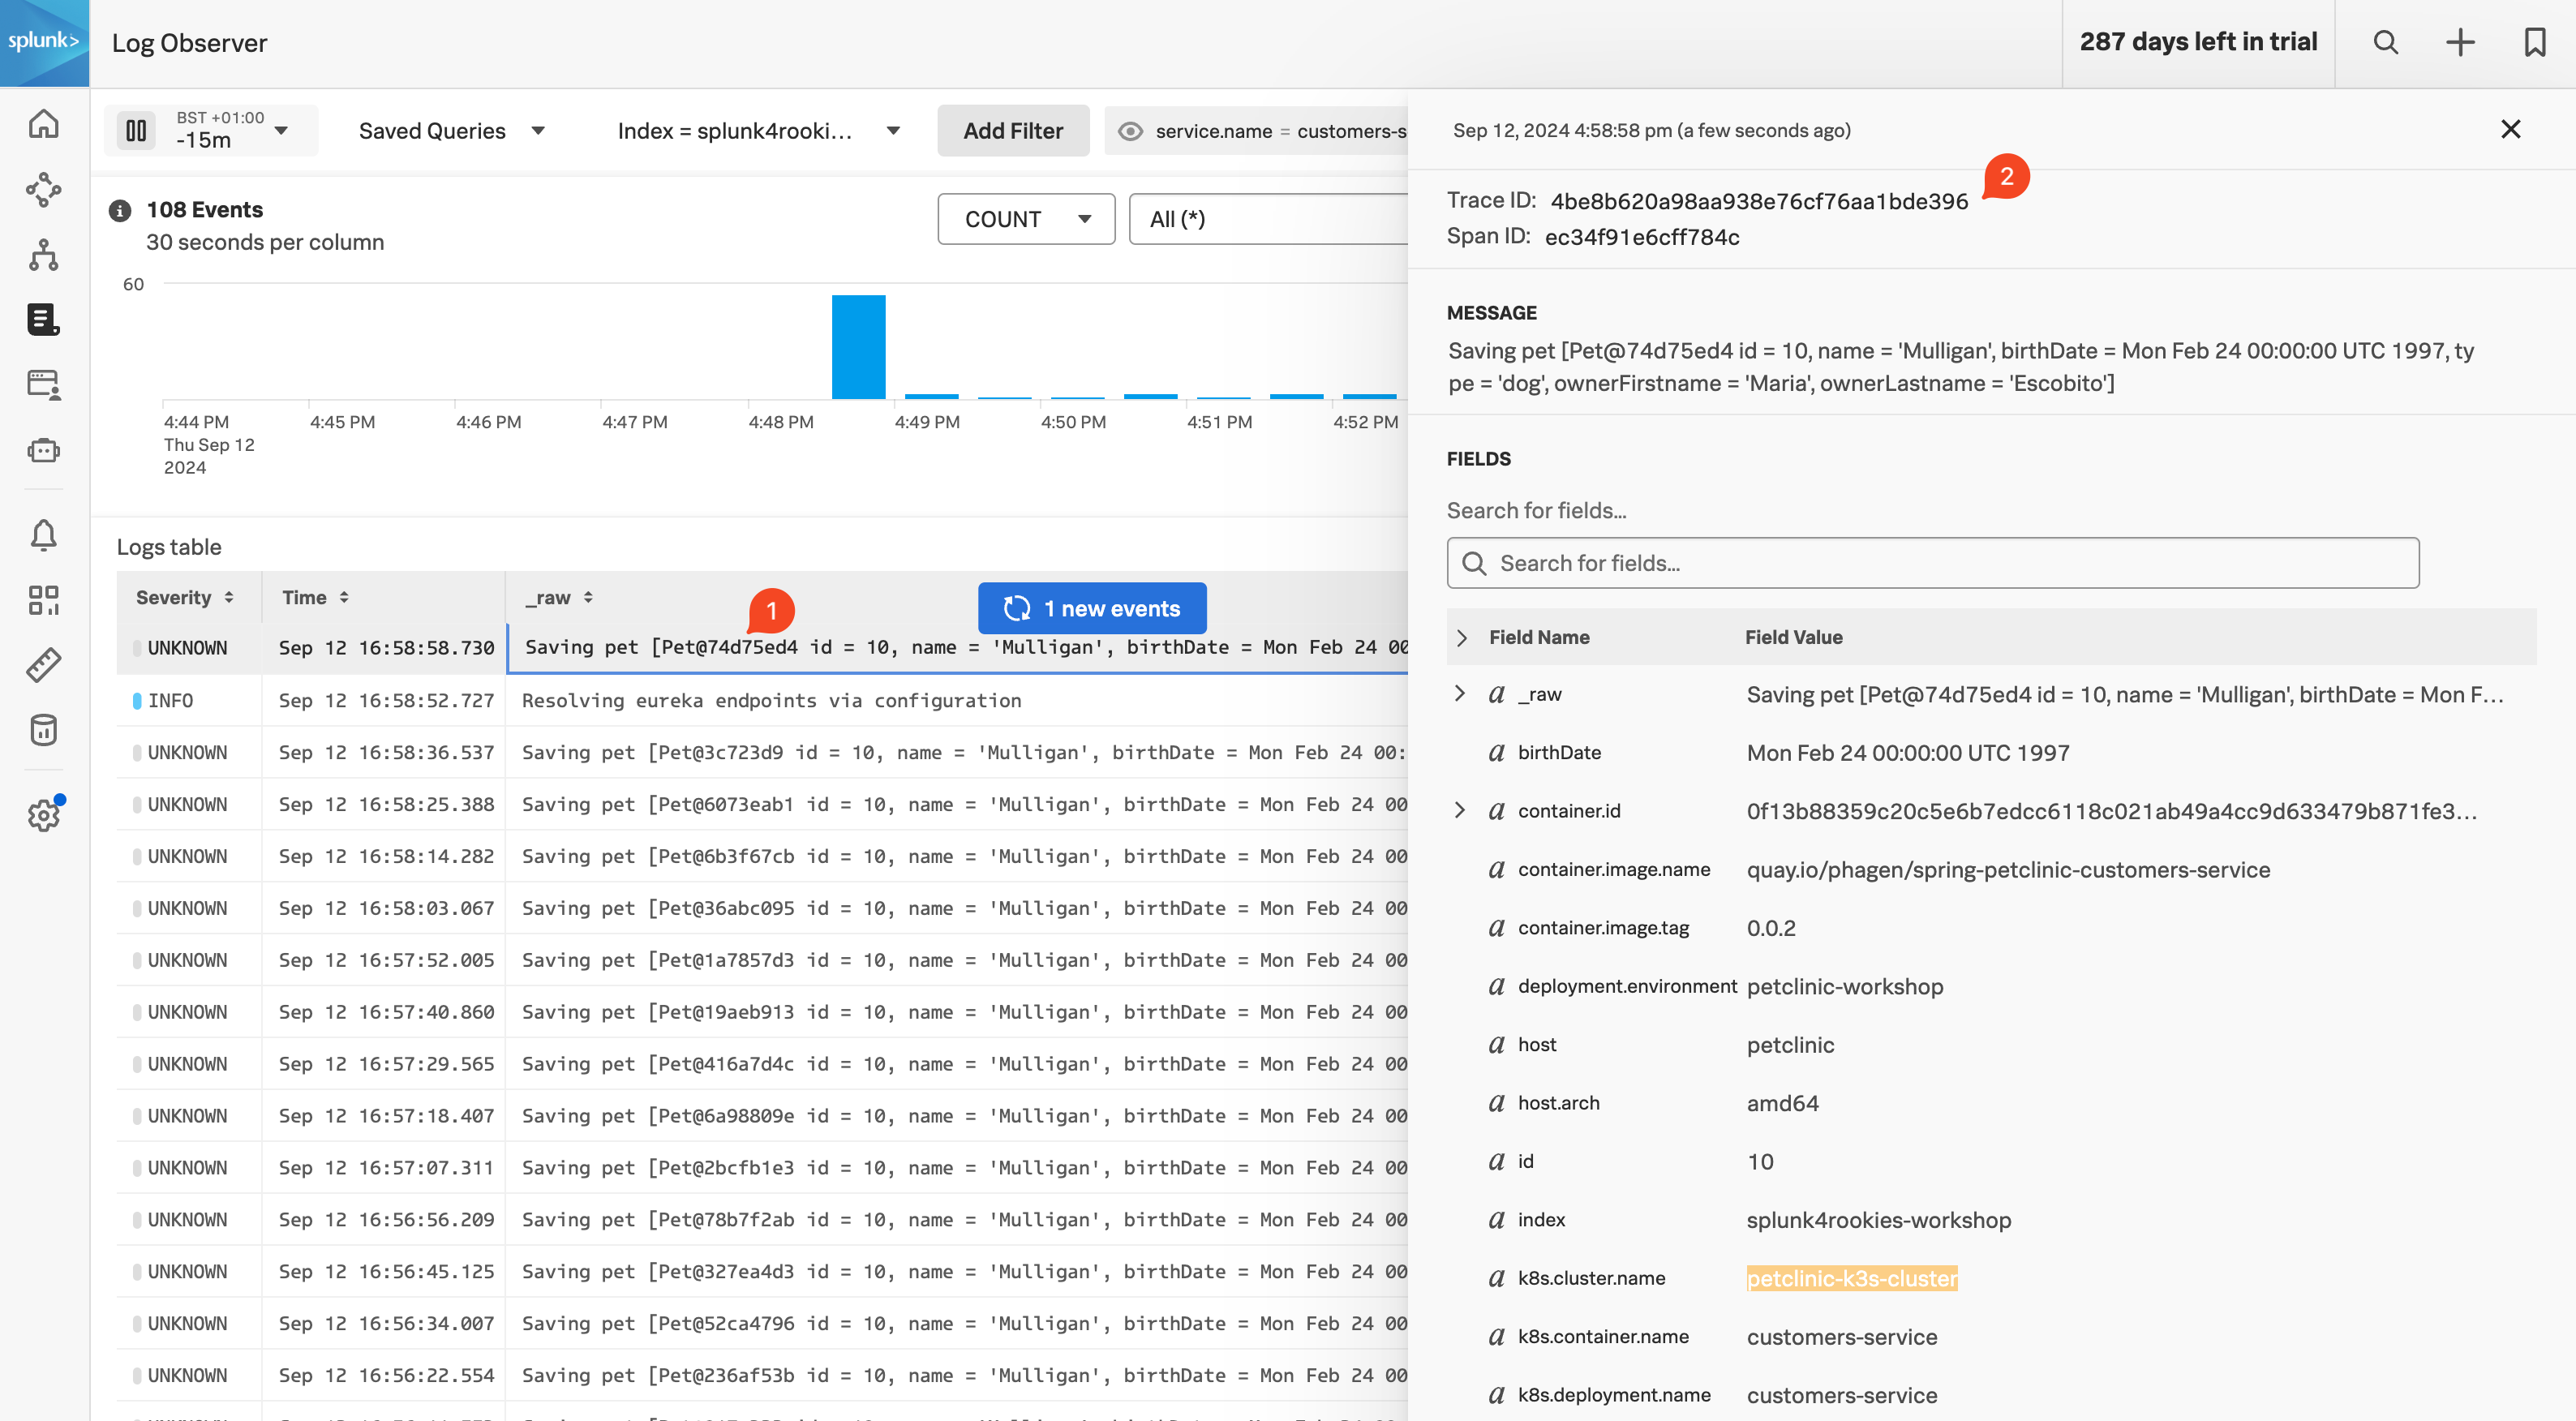
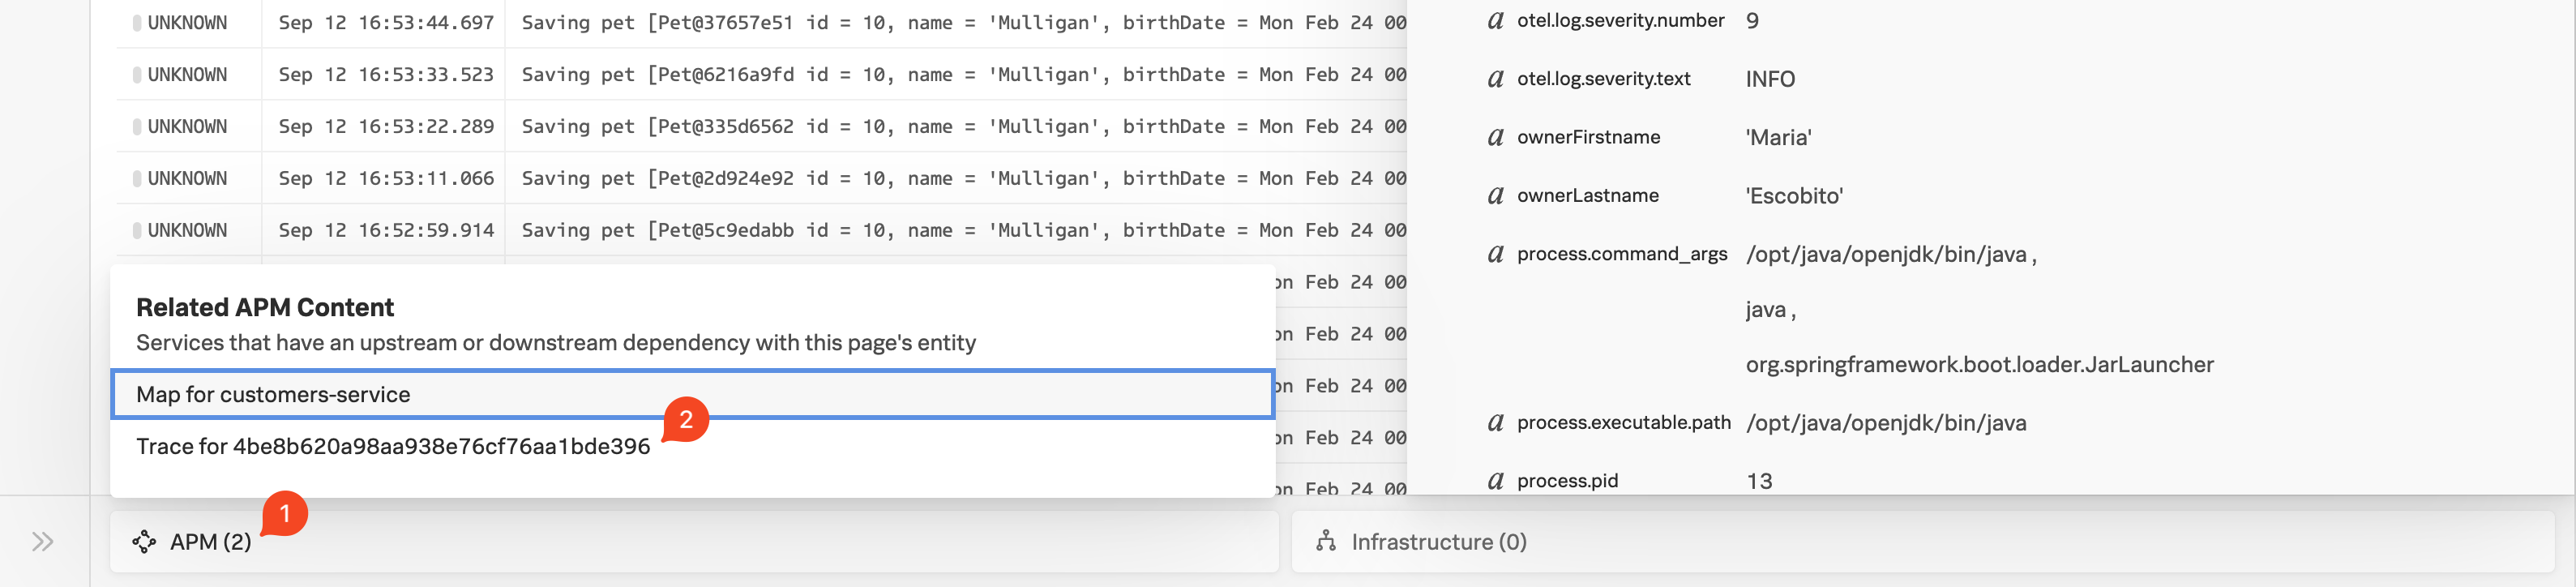
Splunk Log Observer (LO)
We will also show the steps about how to clone (download) a sample Java application (Spring PetClinic), as well as how to compile, package and run the application.
Once the application is up and running, we will instantly start seeing metrics, traces and logs via the automatic discovery and configuration for Java 2.x that will be used by the Splunk APM product.
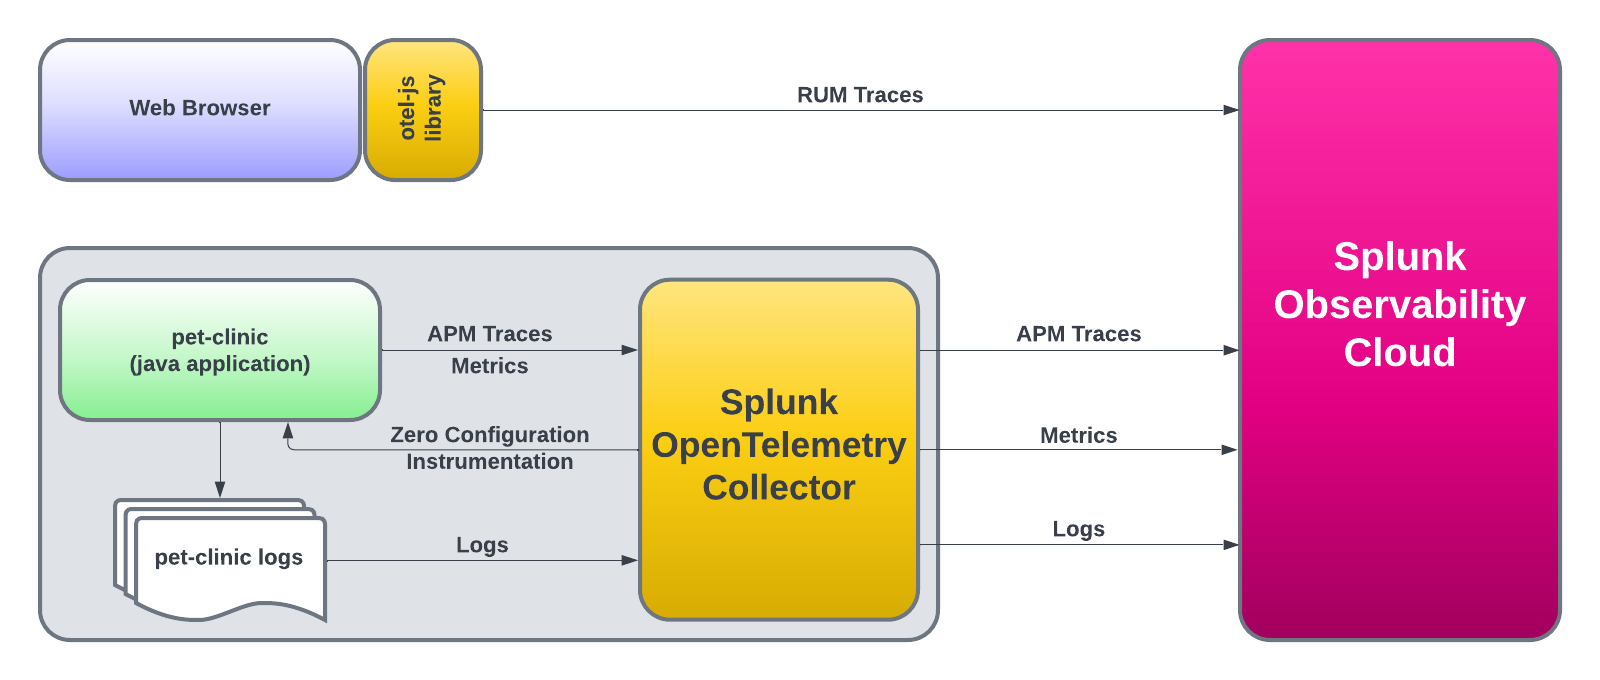
After that, we will instrument PetClinic’s end user interface (HTML pages rendered by the application) with the Splunk OpenTelemetry Javascript Libraries (RUM) that will generate RUM traces around all the individual clicks and page loads executed by an end user.
Lastly, we will view the logs generated by the automatic injection of trace metadata into the PetClinic application logs.
Prerequisites
Outbound SSH access to port 2222.
Outbound HTTP access to port 8083.
Familiarity with the bash shell and vi/vim editor.
Subsections of PetClinic Monolith Workshop
Installing the OpenTelemetry Collector
The Splunk OpenTelemetry Collector is the core component of instrumenting infrastructure and applications. Its role is to collect and send:
Infrastructure metrics (disk, CPU, memory, etc)
Application Performance Monitoring (APM) traces
Profiling data
Host and application logs
Remove any existing OpenTelemetry Collectors
If you have completed the Splunk IM workshop, please ensure you have deleted the collector running in Kubernetes before continuing. This can be done by running the following command:
helm delete splunk-otel-collector
To ensure your instance is configured correctly, we need to confirm that the required environment variables for this workshop are set correctly. In your terminal run the following command:
. ~/workshop/scripts/check_env.sh
In the output check that all of the following environment variables are present and have values set. If any are missing, please contact your instructor:
We can then go ahead and install the Collector. Some additional parameters are passed to the install script, they are:
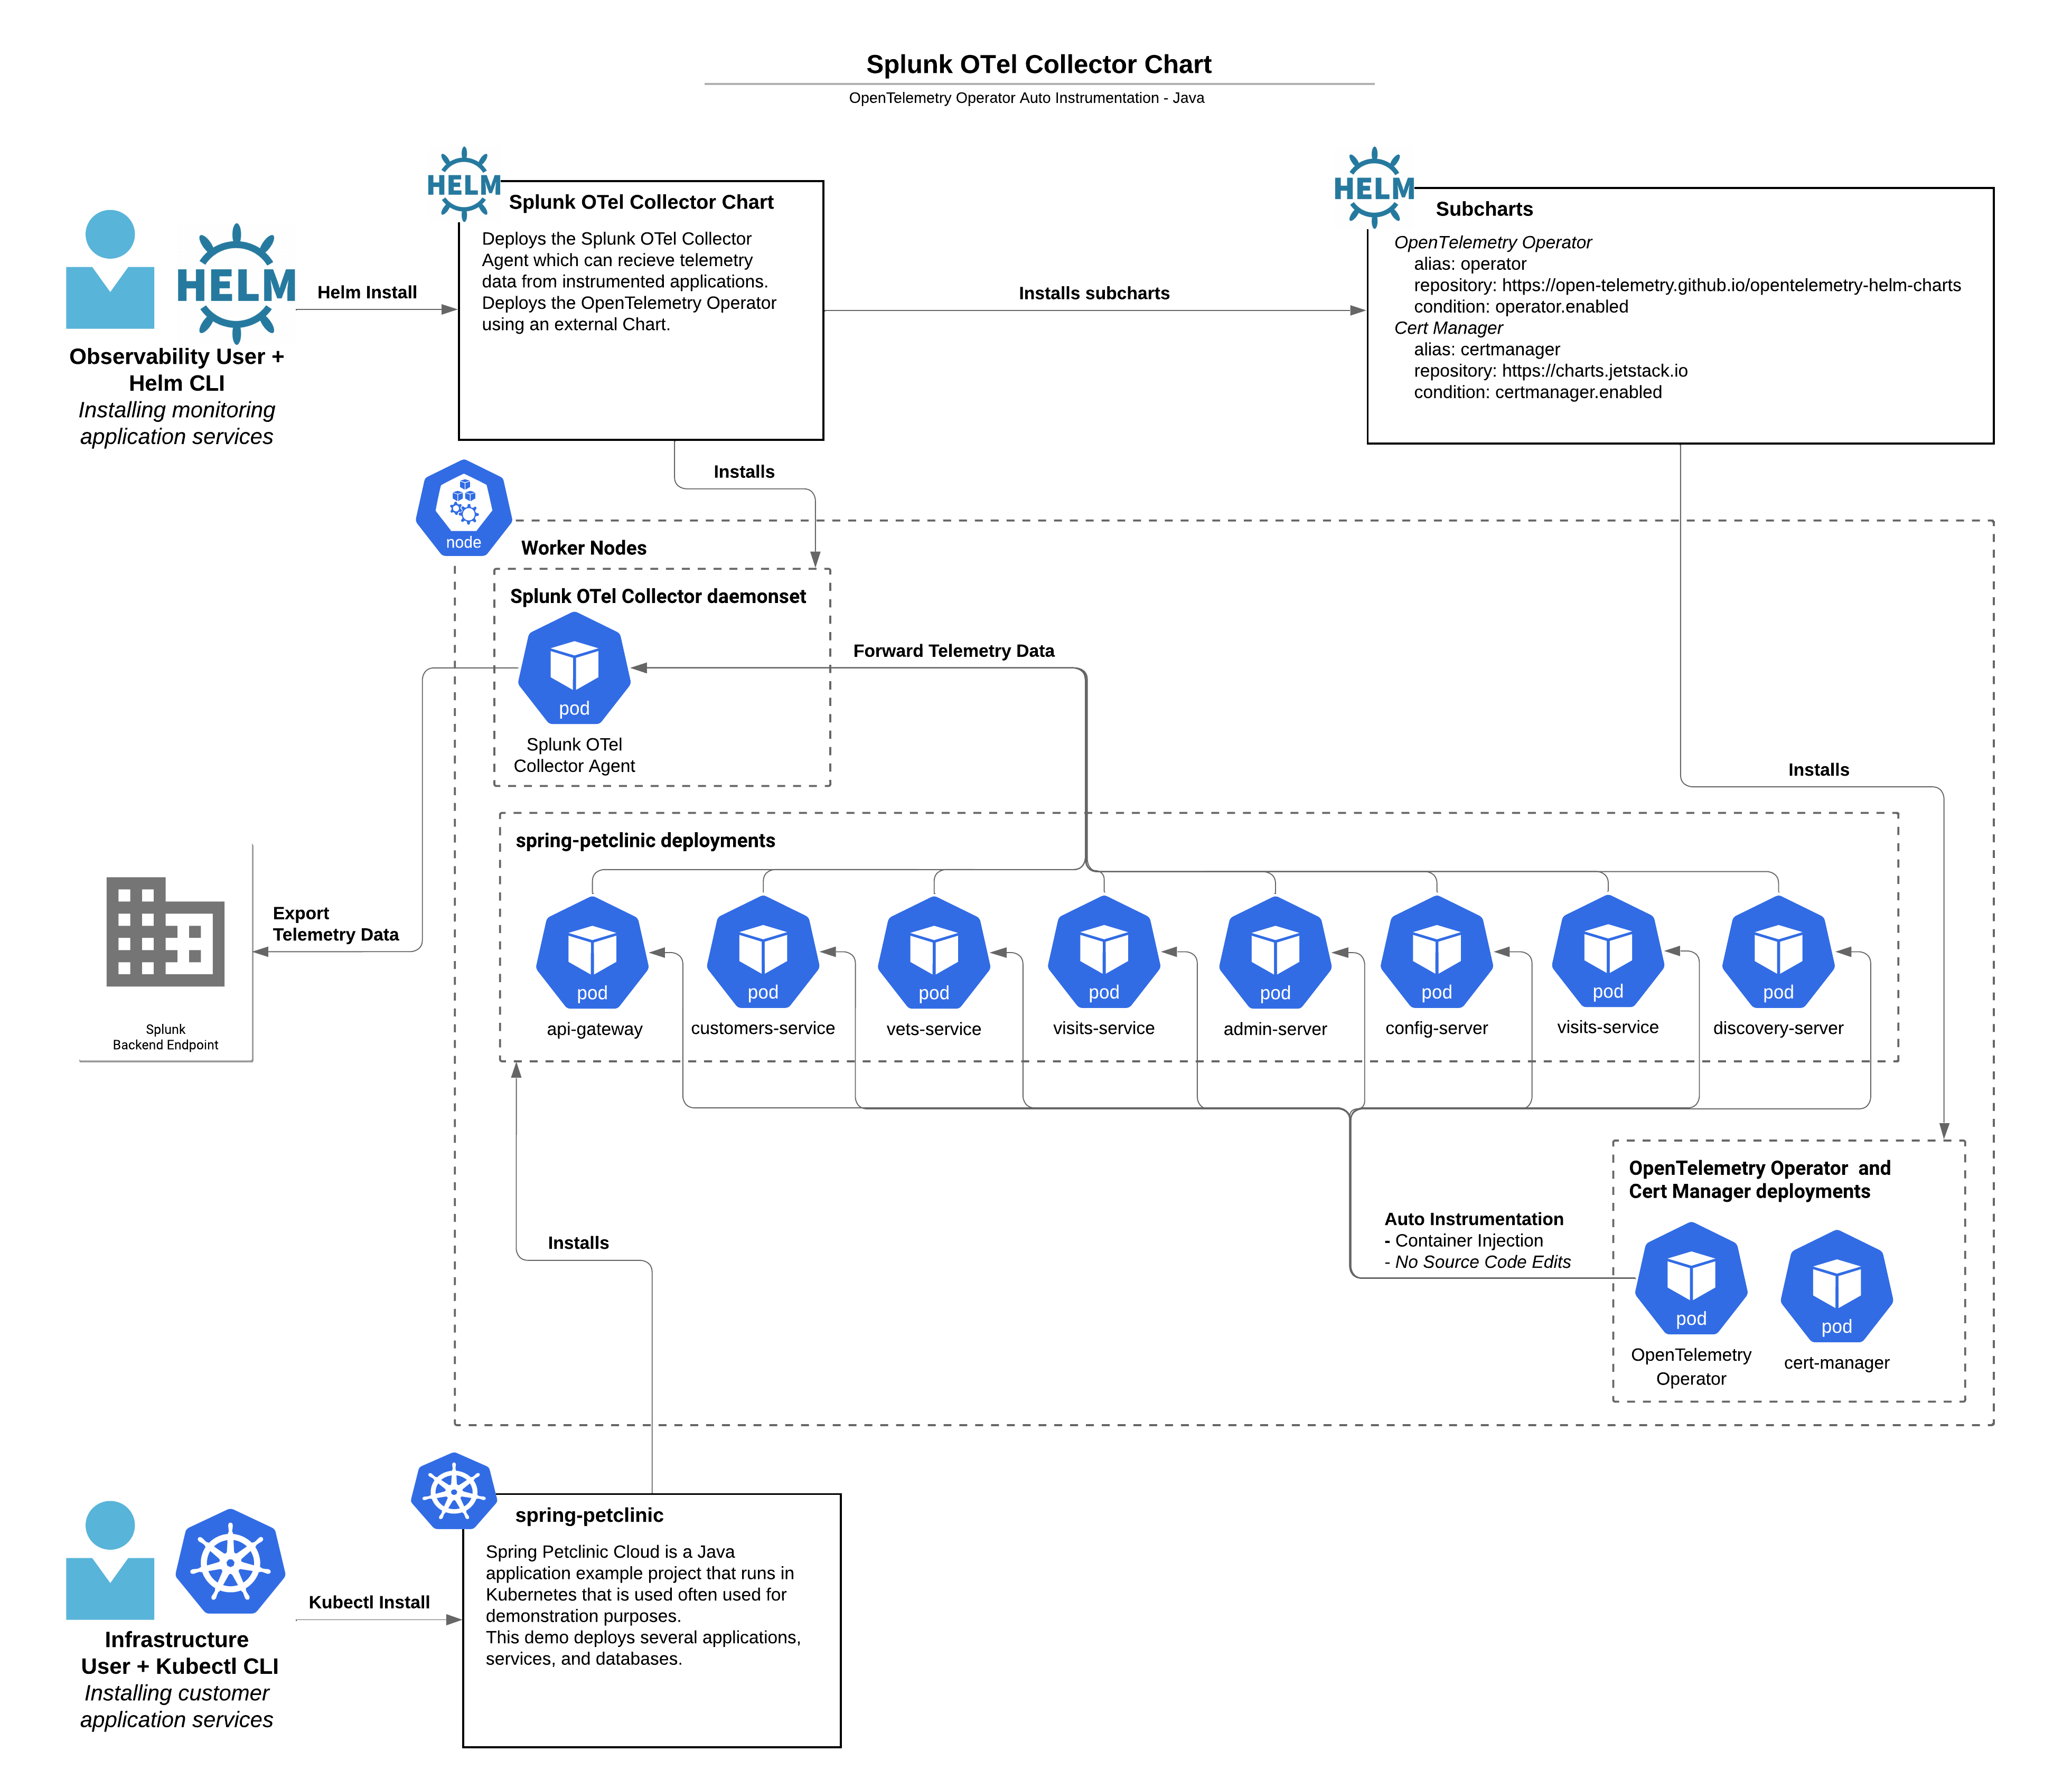
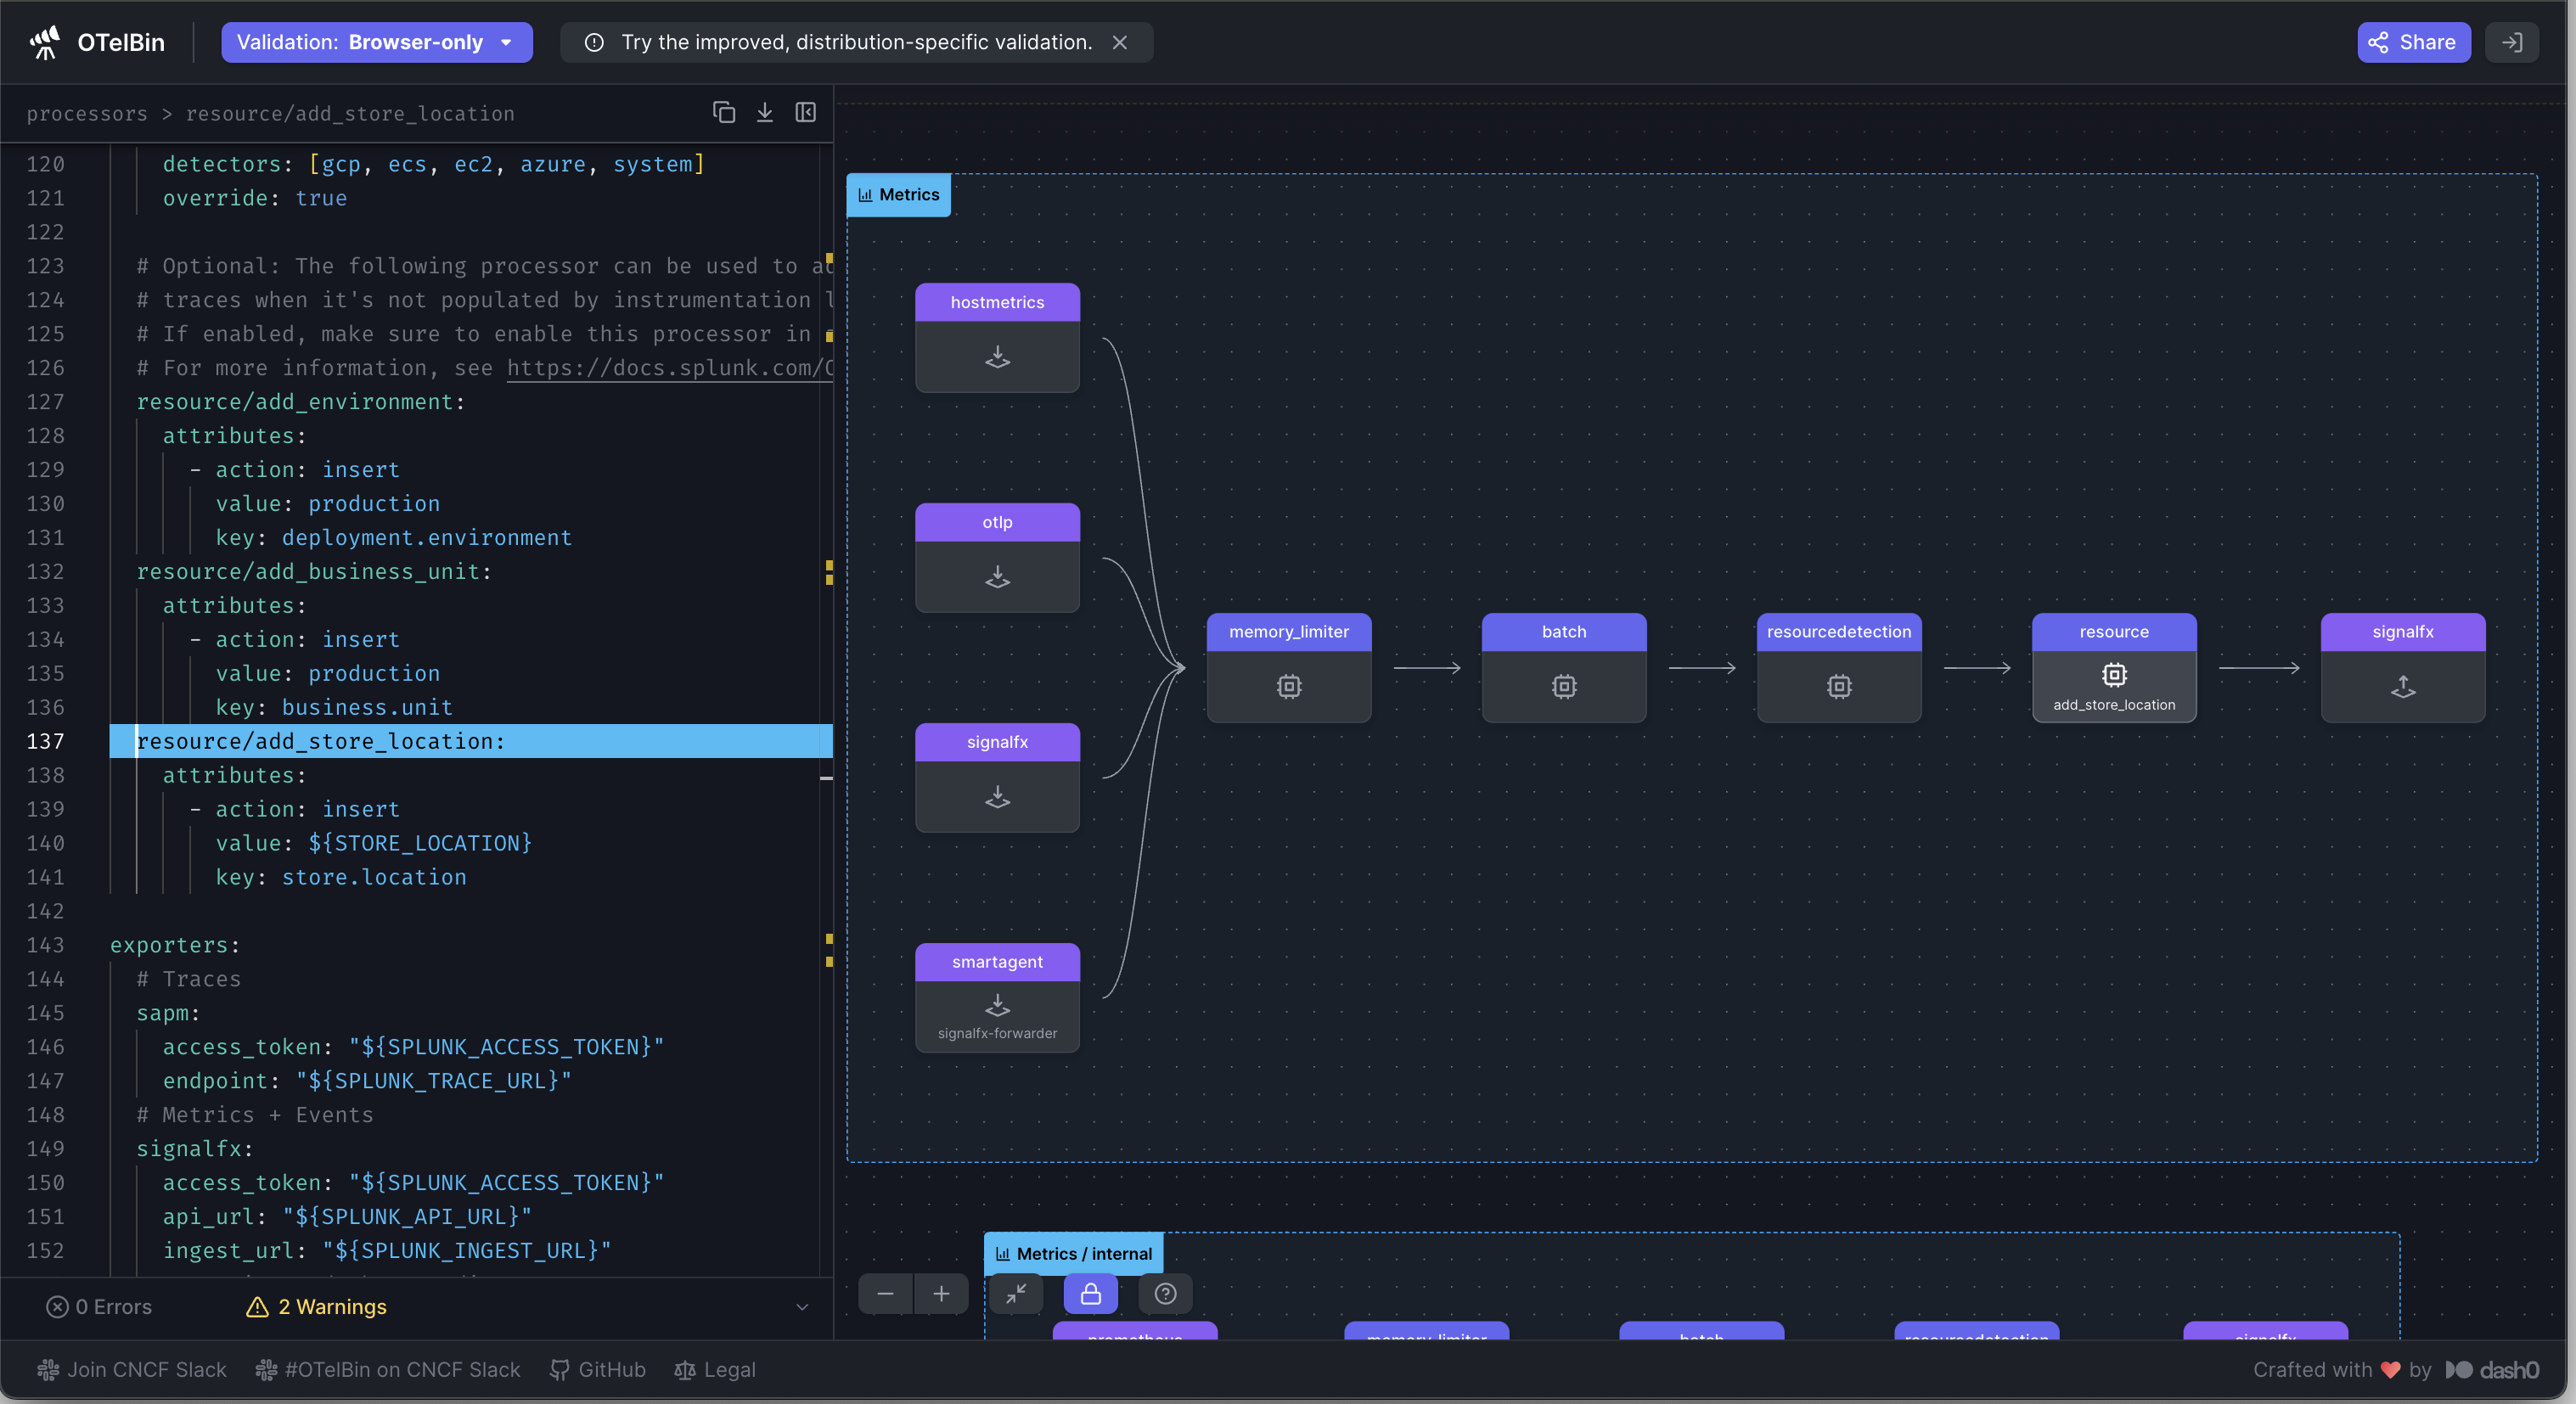
--with-instrumentation - This will install the agent from the Splunk distribution of OpenTelemetry Java, which is then loaded automatically when the PetClinic Java application starts up. No configuration is required!
--deployment-environment - Sets the resource attribute deployment.environment to the value passed. This is used to filter views in the UI.
--enable-profiler - Enables the profiler for the Java application. This will generate CPU profiles for the application.
--enable-profiler-memory - Enables the profiler for the Java application. This will generate memory profiles for the application.
--enable-metrics - Enables the exporting of Micrometer metrics
--hec-token - Sets the HEC token for the collector to use
--hec-url - Sets the HEC URL for the collector to use
Next, we will patch the collector to expose the hostname of the instance and not the AWS instance ID. This will make it easier to filter data in the UI:
Once the agent_config.yaml has been patched, you will need to restart the collector:
sudo systemctl restart splunk-otel-collector
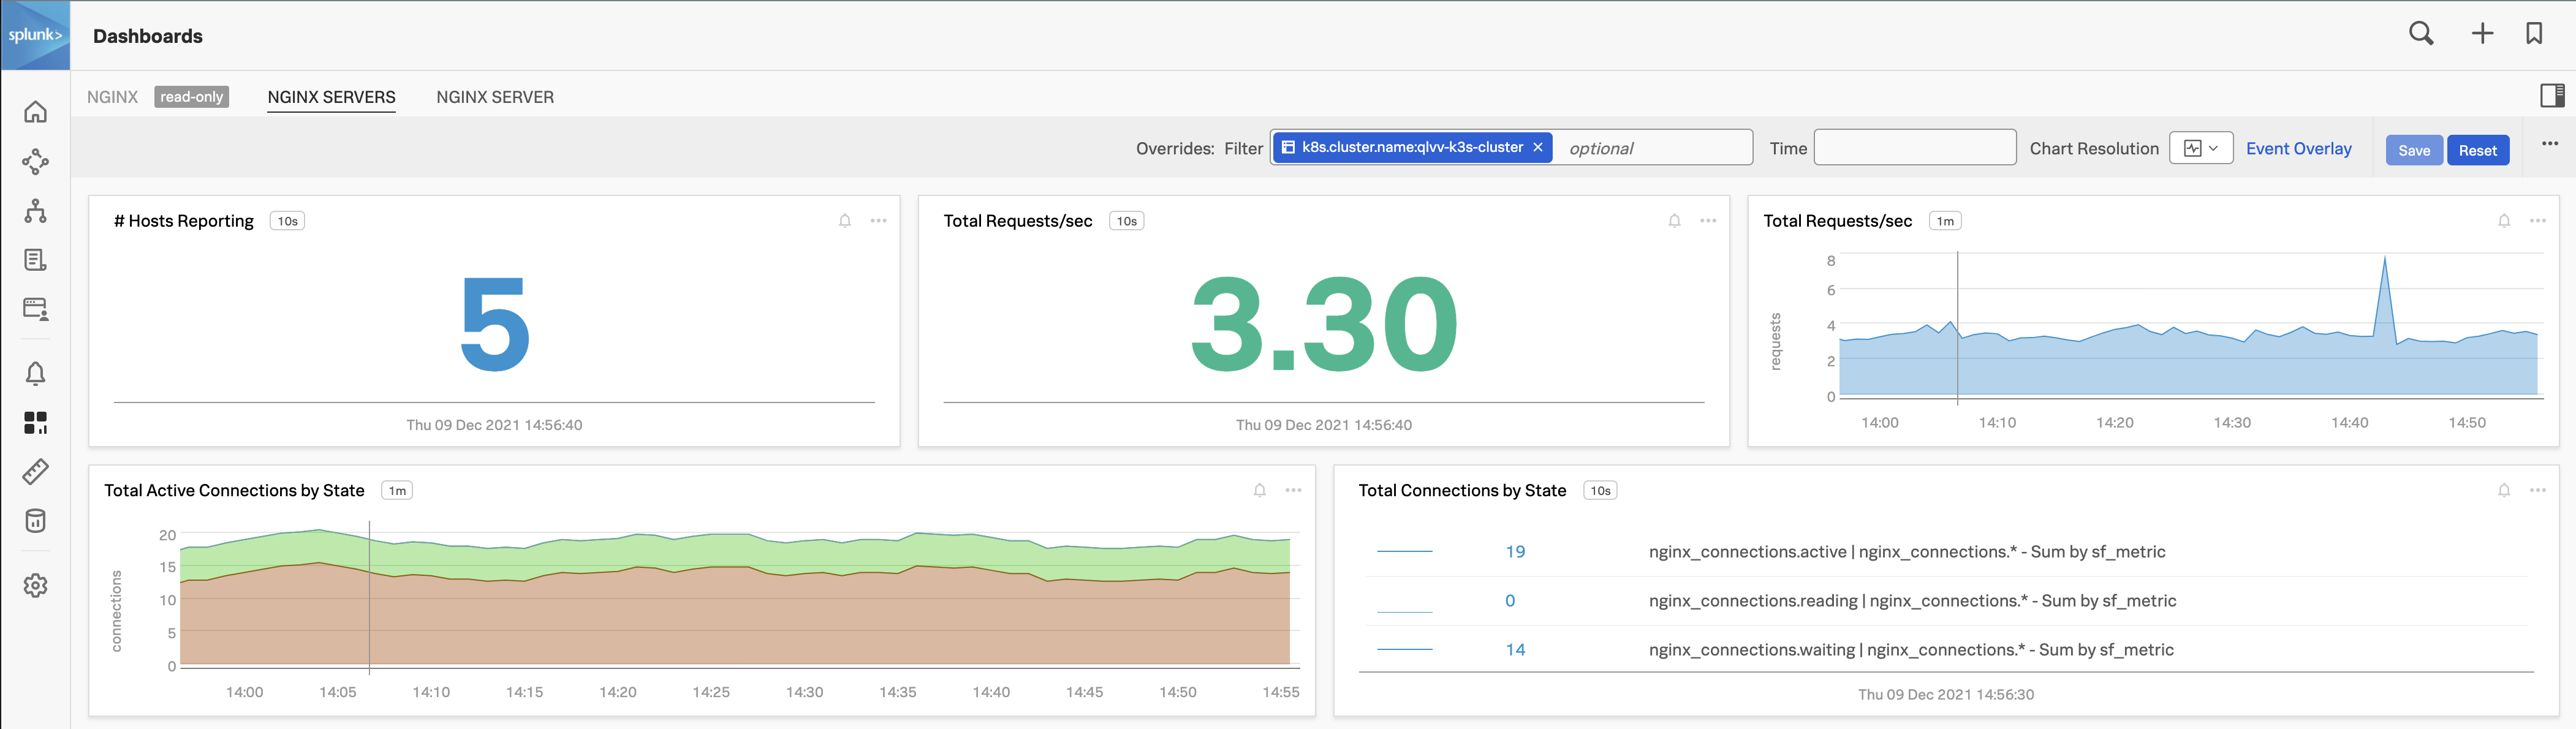
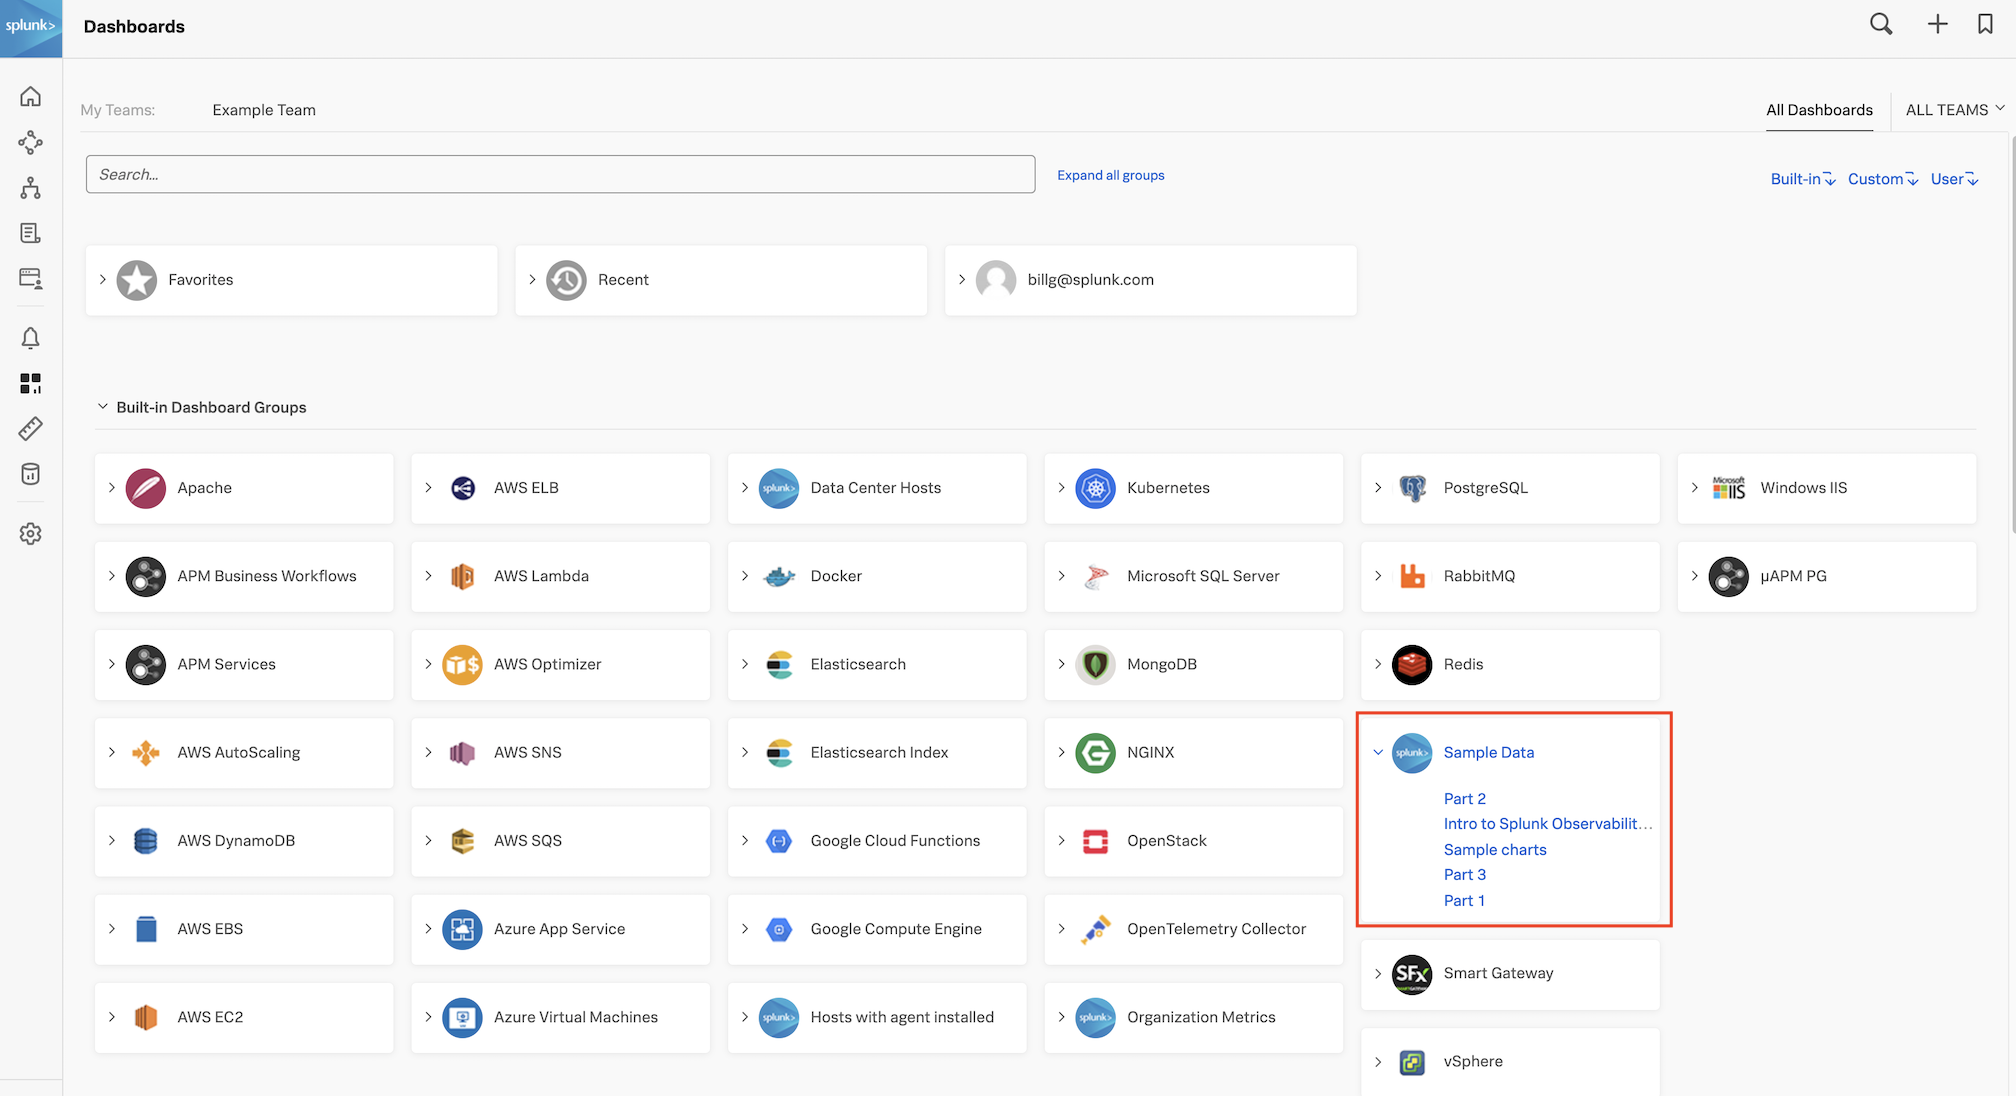
Once the installation is completed, you can navigate to the Hosts with agent installed dashboard to see the data from your host, Dashboards → Hosts with agent installed.
Use the dashboard filter and select host.name and type or select the hostname of your workshop instance (you can get this from the command prompt in your terminal session). Once you see data flowing for your host, we are then ready to get started with the APM component.
Building the Spring PetClinic Application
The first thing we need to set up APM is… well, an application. For this exercise, we will use the Spring PetClinic application. This is a very popular sample Java application built with the Spring framework (Springboot).
First, clone the PetClinic GitHub repository, and then we will compile, build, package and test the application:
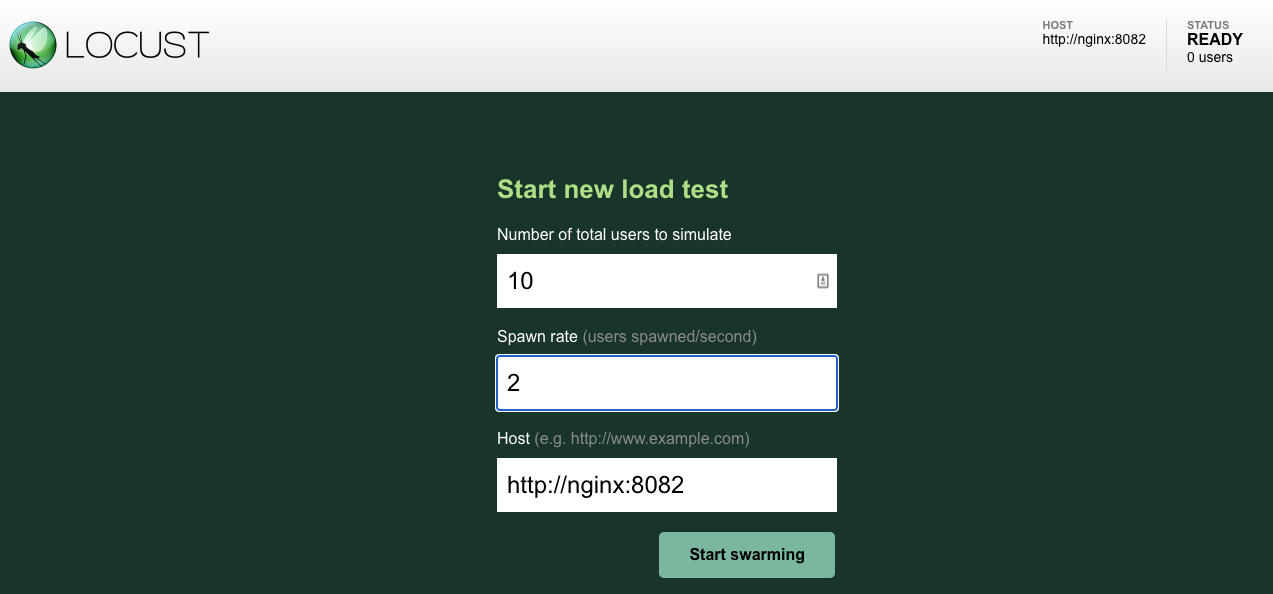
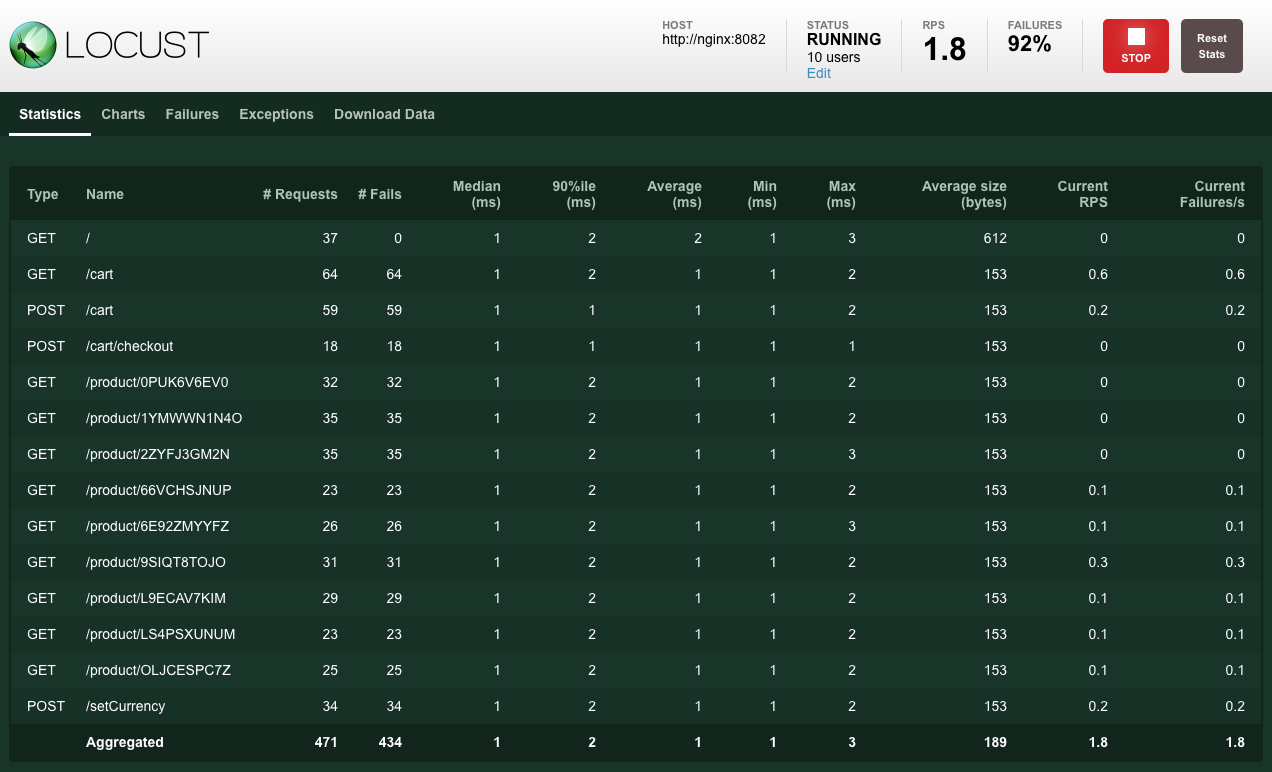
Next, we will start another container running Locust that will generate some simple traffic to the PetClinic application. Locust is a simple load-testing tool that can be used to generate traffic to a web application.
Next, compile, build and package PetClinic using maven:
./mvnw package -Dmaven.test.skip=true
[!INFO]
This will take a few minutes the first time you run and will download a lot of dependencies before it compiles the application. Future builds will be a lot quicker.
Once the build completes, you need to obtain the public IP address of the instance you are running on. You can do this by running the following command:
curl http://ifconfig.me
You will see an IP address returned, make a note of this as we will need it to validate that the application is running.
Automatic discovery and configuration for Java
You can now start the application with the following command. Notice that we are passing the mysql profile to the application, this will tell the application to use the MySQL database we started earlier. We are also setting the otel.service.name and otel.resource.attributes to a logical names using the instance name. These will also be used in the UI for filtering:
You can validate the application is running by visiting http://<IP_ADDRESS>:8083 (replace <IP_ADDRESS> with the IP address you obtained earlier).
When we installed the collector we configured it to enable AlwaysOn Profiling and Metrics. This means that the collector will automatically generate CPU and Memory profiles for the application and send them to Splunk Observability Cloud.
When you start the PetClinic application you will see the collector automatically detect the application and instrument it for traces and profiling.
Picked up JAVA_TOOL_OPTIONS: -javaagent:/usr/lib/splunk-instrumentation/splunk-otel-javaagent.jar
OpenJDK 64-Bit Server VM warning: Sharing is only supported for boot loader classes because bootstrap classpath has been appended
[otel.javaagent 2024-08-20 11:35:58:970 +0000] [main] INFO io.opentelemetry.javaagent.tooling.VersionLogger - opentelemetry-javaagent - version: splunk-2.6.0-otel-2.6.0
[otel.javaagent 2024-08-20 11:35:59:730 +0000] [main] INFO com.splunk.opentelemetry.profiler.ConfigurationLogger - -----------------------
[otel.javaagent 2024-08-20 11:35:59:730 +0000] [main] INFO com.splunk.opentelemetry.profiler.ConfigurationLogger - Profiler configuration:
[otel.javaagent 2024-08-20 11:35:59:730 +0000] [main] INFO com.splunk.opentelemetry.profiler.ConfigurationLogger -                  splunk.profiler.enabled : true
[otel.javaagent 2024-08-20 11:35:59:731 +0000] [main] INFO com.splunk.opentelemetry.profiler.ConfigurationLogger -                splunk.profiler.directory : /tmp
[otel.javaagent 2024-08-20 11:35:59:731 +0000] [main] INFO com.splunk.opentelemetry.profiler.ConfigurationLogger -       splunk.profiler.recording.duration : 20s
[otel.javaagent 2024-08-20 11:35:59:731 +0000] [main] INFO com.splunk.opentelemetry.profiler.ConfigurationLogger -               splunk.profiler.keep-files : false
[otel.javaagent 2024-08-20 11:35:59:732 +0000] [main] INFO com.splunk.opentelemetry.profiler.ConfigurationLogger -            splunk.profiler.logs-endpoint : null
[otel.javaagent 2024-08-20 11:35:59:732 +0000] [main] INFO com.splunk.opentelemetry.profiler.ConfigurationLogger -              otel.exporter.otlp.endpoint : null
[otel.javaagent 2024-08-20 11:35:59:732 +0000] [main] INFO com.splunk.opentelemetry.profiler.ConfigurationLogger -           splunk.profiler.memory.enabled : true
[otel.javaagent 2024-08-20 11:35:59:732 +0000] [main] INFO com.splunk.opentelemetry.profiler.ConfigurationLogger -        splunk.profiler.memory.event.rate : 150/s
[otel.javaagent 2024-08-20 11:35:59:732 +0000] [main] INFO com.splunk.opentelemetry.profiler.ConfigurationLogger -      splunk.profiler.call.stack.interval : PT10S
[otel.javaagent 2024-08-20 11:35:59:733 +0000] [main] INFO com.splunk.opentelemetry.profiler.ConfigurationLogger -  splunk.profiler.include.internal.stacks : false
[otel.javaagent 2024-08-20 11:35:59:733 +0000] [main] INFO com.splunk.opentelemetry.profiler.ConfigurationLogger -      splunk.profiler.tracing.stacks.only : false
[otel.javaagent 2024-08-20 11:35:59:733 +0000] [main] INFO com.splunk.opentelemetry.profiler.ConfigurationLogger - -----------------------
[otel.javaagent 2024-08-20 11:35:59:733 +0000] [main] INFO com.splunk.opentelemetry.profiler.JfrActivator - Profiler is active.
You can now visit the Splunk APM UI and examine the application components, traces, profiling, DB Query performance and metrics. From the left-hand menu APM → Explore, click the environment dropdown and select your environment e.g. <INSTANCE>-petclinic (where<INSTANCE> is replaced with the value you noted down earlier).
Once your validation is complete you can stop the application by pressing Ctrl-c.
Resource attributes can be added to every reported span. For example version=0.314. A comma-separated list of resource attributes can also be defined e.g. key1=val1,key2=val2.
Let’s launch the PetClinic again using new resource attributes. Note, that adding resource attributes to the run command will override what was defined when we installed the collector. Let’s add a new resource attribute version=0.314:
Back in the Splunk APM UI we can drill down on a recent trace and see the new version attribute in a span.
3. Real User Monitoring
For the Real User Monitoring (RUM) instrumentation, we will add the Open Telemetry Javascript https://github.com/signalfx/splunk-otel-js-web snippet in the pages, we will use the wizard again Data Management → Add Integration → RUM Instrumentation → Browser Instrumentation.
Your instructor will inform you which token to use from the dropdown, click Next. Enter App name and Environment using the following syntax:
<INSTANCE>-petclinic-service - replacing <INSTANCE> with the value you noted down earlier.
<INSTANCE>-petclinic-env - replacing <INSTANCE> with the value you noted down earlier.
The wizard will then show a snippet of HTML code that needs to be placed at the top of the pages in the <head> section. The following is an example of the (do not use this snippet, use the one generated by the wizard):
/*
IMPORTANT: Replace the <version> placeholder in the src URL with a
version from https://github.com/signalfx/splunk-otel-js-web/releases
*/
<scriptsrc="https://cdn.signalfx.com/o11y-gdi-rum/latest/splunk-otel-web.js"crossorigin="anonymous"></script><script>SplunkRum.init({realm:"eu0",rumAccessToken:"<redacted>",applicationName:"petclinic-1be0-petclinic-service",deploymentEnvironment:"petclinic-1be0-petclinic-env"});</script>
The Spring PetClinic application uses a single HTML page as the “layout” page, that is reused across all pages of the application. This is the perfect location to insert the Splunk RUM Instrumentation Library as it will be loaded in all pages automatically.
Let’s then edit the layout page:
vi src/main/resources/templates/fragments/layout.html
Next, insert the snippet we generated above in the <head> section of the page. Make sure you don’t include the comment and replace <version> in the source URL to latest e.g.
Then let’s visit the application using a browser to generate real-user traffic http://<IP_ADDRESS>:8083.
In RUM, filter down into the environment as defined in the RUM snippet above and click through to the dashboard.
When you drill down into a RUM trace you will see a link to APM in the spans. Clicking on the trace ID will take you to the corresponding APM trace for the current RUM trace.
4. Log Observer
For the Splunk Log Observer component, the Splunk OpenTelemetry Collector automatically collects logs from the Spring PetClinic application and sends them to Splunk Observability Cloud using the OTLP exporter, anotating the log events with trace_id, span_id and trace flags.
Log Observer provides a real-time view of logs from your applications and infrastructure. It allows you to search, filter, and analyze logs to troubleshoot issues and monitor your environment.
Go back to the PetClinic web application and click on the Error link several times. This will generate some log messages in the PetClinic application logs.
From the left-hand menu click on Log Observer and ensure Index is set to splunk4rookies-workshop.
Next, click Add Filter search for the field service.name select the value <INSTANCE>-petclinic-service and click = (include). You should now see only the log messages from your PetClinic application.
Select one of the log entries that were generated by clicking on the Error link in the PetClinic application. You will see the log message and the trace metadata that was automatically injected into the log message. Also, you will notice that Related Content is available for APM and Infrastructure.
This is the end of the workshop and we have certainly covered a lot of ground. At this point, you should have metrics, traces (APM & RUM), logs, database query performance and code profiling being reported into Splunk Observability Cloud and all without having to modify the PetClinic application code (well except for RUM).
Congratulations!
Spring PetClinic SpringBoot Based Microservices On Kubernetes
90 minutesAuthor
Pieter Hagen
The goal of this workshop is to introduce the features of Splunk’s automatic discovery and configuration for Java.
The workshop scenario will be created by installing a simple (un-instrumented) Java microservices application in Kubernetes.
By following the simple steps to install the Splunk OpenTelemetry Collector and enabling automatic discovery and configuration for existing Java based deployments you will learn how easy it is to send metrics, traces and logs to Splunk Observability Cloud.
Prerequisites
Outbound SSH access to port 2222.
Outbound HTTP access to port 81.
Familiarity with the Linux command line.
During this workshop we will cover the following components:
Splunk Infrastructure Monitoring (IM)
Splunk automatic discovery and configuration for Java (APM)
Database Query Performance
AlwaysOn Profiling
Splunk Log Observer (LO)
Splunk Real User Monitoring (RUM)
Splunk Synthetics is feeling a little left out here, but we cover that in other workshops
Subsections of Spring PetClinic SpringBoot Based Microservices On Kubernetes
Architecture
5 minutes
The diagram below details the architecture of the Spring PetClinic Java application running in Kubernetes with the Splunk OpenTelemetry Operator and automatic discovery and configuration enabled.
The Spring PetClinic Java application is a simple microservices application that consists of a frontend and backend services. The frontend service is a Spring Boot application that serves a web interface to interact with the backend services. The backend services are Spring Boot applications that serve RESTful API’s to interact with a MySQL database.
By the end of this workshop, you will have a better understanding of how to enable automatic discovery and configuration for your Java-based applications running in Kubernetes.
The instructor will provide you with the login information for the instance that we will be using during the workshop.
When you first log into your instance, you will be greeted by the Splunk Logo as shown below. If you have any issues connecting to your workshop instance then please reach out to your Instructor.
$ ssh -p 2222 splunk@<ip-address>

███████╗██████╗ ██╗     ██╗   ██╗███╗   ██╗██╗  ██╗    ██╗
██╔════╝██╔══██╗██║     ██║   ██║████╗  ██║██║ ██╔╝    ╚██╗
███████╗██████╔╝██║     ██║   ██║██╔██╗ ██║█████╔╝      ╚██╗
╚════██║██╔═══╝ ██║     ██║   ██║██║╚██╗██║██╔═██╗      ██╔╝
███████║██║     ███████╗╚██████╔╝██║ ╚████║██║  ██╗    ██╔╝
╚══════╝╚═╝     ╚══════╝ ╚═════╝ ╚═╝  ╚═══╝╚═╝  ╚═╝    ╚═╝
Last login: Mon Feb  5 11:04:54 2024 from [Redacted]
Waiting for cloud-init status...
Your instance is ready!
splunk@show-no-config-i-0d1b29d967cb2e6ff:~$
To ensure your instance is configured correctly, we need to confirm that the required environment variables for this workshop are set correctly. In your terminal run the following script and check that the environment variables are present and set with actual valid values:
Please make a note of the INSTANCE environment variable value as this will used later to filter data in Splunk Observability Cloud.
For this workshop, all of the above are required. If any have values missing, please contact your Instructor.
Delete any existing OpenTelemetry Collectors
If you have previously completed a Splunk Observability workshop using this EC2 instance, you need to ensure that any existing installation of the Splunk OpenTelemetry Collector is deleted. This can be achieved by running the following command:
helm delete splunk-otel-collector
Subsections of Preparation of the Workshop instance
Deploy the Splunk OpenTelemetry Collector
To get Observability signals (metrics, traces and logs) into Splunk Observability Cloud the Splunk OpenTelemetry Collector needs to be deployed into the Kubernetes cluster.
For this workshop, we will be using the Splunk OpenTelemetry Collector Helm Chart. First we need to add the Helm chart repository to Helm and update to ensure the latest version:
Using ACCESS_TOKEN={REDACTED}
Using REALM=eu0
"splunk-otel-collector-chart" has been added to your repositories
Using ACCESS_TOKEN={REDACTED}
Using REALM=eu0
Hang tight while we grab the latest from your chart repositories...
...Successfully got an update from the "splunk-otel-collector-chart" chart repository
Update Complete. ⎈Happy Helming!⎈
Splunk Observability Cloud offers wizards in the UI to walk you through the setup of the OpenTelemetry Collector on Kubernetes, but in the interest of time, we will use the Helm install command below. Additional parameters are set to enable the operator and automatic discovery and configuration.
--set="operator.enabled=true" - this will install the Opentelemetry operator that will be used to handle automatic discovery and configuration.
--set="certmanager.enabled=true" - this will install the required certificate manager for the operator.
--set="splunkObservability.profilingEnabled=true" - this enables Code Profiling via the operator.
To install the collector run the following command, do NOT edit this:
LAST DEPLOYED: Fri Apr 19 09:39:54 2024
NAMESPACE: default
STATUS: deployed
REVISION: 1
NOTES:
Splunk OpenTelemetry Collector is installed and configured to send data to Splunk Platform endpoint "https://http-inputs-o11y-workshop-eu0.splunkcloud.com:443/services/collector/event".

Splunk OpenTelemetry Collector is installed and configured to send data to Splunk Observability realm eu0.

[INFO] You've enabled the operator's auto-instrumentation feature (operator.enabled=true), currently considered ALPHA.
  - Instrumentation library maturity varies (e.g., Java is more mature than Go). For library stability, visit: https://opentelemetry.io/docs/instrumentation/#status-and-releases
  - Some libraries may be enabled by default. For current status, see: https://github.com/open-telemetry/opentelemetry-operator#controlling-instrumentation-capabilities
  - Splunk provides best-effort support for native OpenTelemetry libraries, and full support for Splunk library distributions. For used libraries, refer to the values.yaml under "operator.instrumentation.spec".
Ensure the Pods are reported as Running before continuing (this typically takes around 30 seconds).
Ensure there are no errors reported by the Splunk OpenTelemetry Collector (press ctrl + c to exit) or use the installed awesomek9s terminal UI for bonus points!
2021-03-21T16:11:10.900Z        INFO    service/service.go:364  Starting receivers...
2021-03-21T16:11:10.900Z        INFO    builder/receivers_builder.go:70 Receiver is starting... {"component_kind": "receiver", "component_type": "prometheus", "component_name": "prometheus"}
2021-03-21T16:11:11.009Z        INFO    builder/receivers_builder.go:75 Receiver started.       {"component_kind": "receiver", "component_type": "prometheus", "component_name": "prometheus"}
2021-03-21T16:11:11.009Z        INFO    builder/receivers_builder.go:70 Receiver is starting... {"component_kind": "receiver", "component_type": "k8s_cluster", "component_name": "k8s_cluster"}
2021-03-21T16:11:11.009Z        INFO    k8sclusterreceiver@v0.21.0/watcher.go:195       Configured Kubernetes MetadataExporter  {"component_kind": "receiver", "component_type": "k8s_cluster", "component_name": "k8s_cluster", "exporter_name": "signalfx"}
2021-03-21T16:11:11.009Z        INFO    builder/receivers_builder.go:75 Receiver started.       {"component_kind": "receiver", "component_type": "k8s_cluster", "component_name": "k8s_cluster"}
2021-03-21T16:11:11.009Z        INFO    healthcheck/handler.go:128      Health Check state change       {"component_kind": "extension", "component_type": "health_check", "component_name": "health_check", "status": "ready"}
2021-03-21T16:11:11.009Z        INFO    service/service.go:267  Everything is ready. Begin running and processing data.
2021-03-21T16:11:11.009Z        INFO    k8sclusterreceiver@v0.21.0/receiver.go:59       Starting shared informers and wait for initial cache sync.      {"component_kind": "receiver", "component_type": "k8s_cluster", "component_name": "k8s_cluster"}
2021-03-21T16:11:11.281Z        INFO    k8sclusterreceiver@v0.21.0/receiver.go:75       Completed syncing shared informer caches.       {"component_kind": "receiver", "component_type": "k8s_cluster", "component_name": "k8s_cluster"}
Deleting a failed installation
If you make an error installing the OpenTelemetry Collector you can start over by deleting the installation with the following command:
helm delete splunk-otel-collector
Deploy the PetClinic Application
The first deployment of our application will be using prebuilt containers to give us the base scenario: a regular Java microservices-based application running in Kubernetes that we want to start observing. So let’s deploy our application:
deployment.apps/config-server created
service/config-server created
deployment.apps/discovery-server created
service/discovery-server created
deployment.apps/api-gateway created
service/api-gateway created
service/api-gateway-external created
deployment.apps/customers-service created
service/customers-service created
deployment.apps/vets-service created
service/vets-service created
deployment.apps/visits-service created
service/visits-service created
deployment.apps/admin-server created
service/admin-server created
service/petclinic-db created
deployment.apps/petclinic-db created
configmap/petclinic-db-initdb-config created
deployment.apps/petclinic-loadgen-deployment created
configmap/scriptfile created
At this point, we can verify the deployment by checking if the Pods are running. The containers need to be downloaded and started so this may take a couple of minutes.
Make sure the output of kubectl get pods matches the output as shown above. Ensure all the services are shown as Running (or use k9s to contuuously monitor the status).
Once they are running, the application will take a few minutes to fully start up, create the database and synchronize all the services, so let’s use the time to check the local private repository is active.
Verify the local Private Registry
Later on, when we test our automatic discovery and configuration we are going to build new containers to highlight some of the additional features of Splunk Observability Cloud.
As configuration files and source code will be changed, the containers will need to be built and stored in a local private registry (which has already been enabled for you).
To check if the private registry is avaiable, run the following command (this will return an empty list):
curl -X GET http://localhost:9999/v2/_catalog
**{"repositories":[]}**
Verify Kubernetes Cluster metrics
10 minutes
Once the installation has been completed, you can log in to Splunk Observability Cloud and verify that the metrics are flowing in from your Kubernetes cluster.
From the left-hand menu click on Infrastructure and select Kubernetes, then select the Kubernetes nodes pane. Once you are in the Kubernetes nodes view, change the Time filter from -4h to the last 15 minutes (-15m) to focus on the latest data.
Next, click Add filters (next to the Time filter) and add the filter k8s.cluster.name(1). Type or select the cluster name of your workshop instance (you can get the unique part from your cluster name by using the INSTANCE from the output from the shell script you ran earlier). You can also select your cluster by clicking on its image in the cluster pane. You will now only have your cluster visible (2).
Scroll down the page to see the metrics coming in from your cluster. Locate the Node log events rate chart and click on a vertical bar to see the log entries coming in from your cluster.
Subsections of Verify Kubernetes Cluster metrics
Verify the PetClinic Website
To test the application you need to obtain the public IP address of the instance you are running on. You can do this by running the following command:
curl http://ifconfig.me
You can validate if the application is running by visiting http://<IP_ADDRESS>:81 (replace <IP_ADDRESS> with the IP address you obtained above). You should see the PetClinic application running.
Make sure the application is working correctly by visiting the All Owners(1) and Veterinarians(2) tabs, you should get a list of names in each case.
Note
As each service needs to start up and synchronize with the database, it may take a few minutes for the application to fully start up.
Setting up automatic discovery and configuration for APM
10 minutes
In this section we will enable automatic discovery and configuration for the Java services running in Kubernetes. This means that the OpenTelemetry Collector will look for Pod annotations that indicate that the Java application should be instrumented with the Splunk OpenTelemetry Java agent. This will allow us to get traces, spans, and profiling data from the Java services running on the cluster.
automatic discovery and configuration
It is important to understand that automatic discovery and configuration is designed to get trace, span & profiling data out of your application, without requiring code changes or recompilation.
This is a great way to get started with APM, but it is not a replacement for manual instrumentation. Manual instrumentation allows you to add custom spans, tags, and logs to your application, which can provide more context and detail to your traces.
For Java applications the OpenTelemetry Collector will look for the annotation instrumentation.opentelemetry.io/inject-java.
The annotation can have the value set true or to the namespace/daemonset of the OpenTelemetry Collector e.g. default/splunk-otel-collector. This allows working across namespaces and what we will use in this workshop.
Using the deployment.yaml
If you want your Pods to send traces automatically, you can add the annotation to the deployment.yaml as shown below. This will add the instrumentation library during the initial deployment. To speed things up we have done that for the following Pods:
Subsections of Setting up automatic discovery and configuration for APM
Patching the Deployment
To configure automatic discovery and configuration the deployments need to be patched to add the instrumentation annotation. Once patched, the OpenTelemetry Collector will inject the automatic discovery and configuration library and the Pods will be restarted in order to start sending traces and profiling data. First, confirm that the api-gateway does not have the splunk-otel-java image.
Next, enable the Java automatic discovery and configuration for all of the services by adding the annotation to the deployments. The following command will patch the all deployments. This will trigger the OpenTelemetry Operator to inject the splunk-otel-java image into the Pods:
kubectl get deployments -l app.kubernetes.io/part-of=spring-petclinic -o name | xargs -I % kubectl patch % -p "{\"spec\": {\"template\":{\"metadata\":{\"annotations\":{\"instrumentation.opentelemetry.io/inject-java\":\"default/splunk-otel-collector\"}}}}}"
deployment.apps/config-server patched (no change)
deployment.apps/admin-server patched (no change)
deployment.apps/customers-service patched
deployment.apps/visits-service patched
deployment.apps/discovery-server patched (no change)
deployment.apps/vets-service patched
deployment.apps/api-gateway patched
There will be no change for the config-server, discovery-server and admin-server as these have already been patched.
To check the container image(s) of the api-gateway pod again, run the following command:
A new image has been added to the api-gateway which will pull splunk-otel-java from ghcr.io (if you see two api-gateway containers, the original one is probably still terminating, so give it a few seconds).
Navigate back to the Kubernetes Navigator in Splunk Observability Cloud. After a couple of minutes you will see that the Pods are being restarted by the operator and the automatic discovery and configuration container will be added. This will look similar to the screenshot below:
Wait for the Pods to turn green in the Kubernetes Navigator, then go tho the next section.
Viewing the data in Splunk APM
Log in to Splunk Observability Cloud, from the left-hand menu click on APM to see the data generated by the traces from the newly instrumented services. Change the Environment filter (1) to the name of your workshop instance in the dropdown box (this will be <INSTANCE>-workshop where INSTANCE is the value from the shell script you ran earlier) and make sure it is the only one selected.
You will see the name (2) of the api-gateway service and metrics in the Latency and Request & Errors charts (you can ignore the Critical Alert, as it is caused by the sudden request increase generated by the load generator). You will also see the rest of the services appear.
Once you see the Customer service, Vets service and Visits services like show in the screenshot above, let’s click on the Service Map(3) pane to get ready for the next section.
APM Features
15 minutes
As we have seen in the previous section, once you enable automatic discovery and configuration on your services, traces are sent to Splunk Observability Cloud.
With these traces, Splunk will automatically generate Service Maps and RED Metrics. These are the first steps in understanding the behavior of your services and how they interact with each other.
In this next section, we are going to examine the traces themselves and what information they provide to help you understand the behavior of your services all without touching your code.
Subsections of APM Features
APM Service Map
The above map shows all the interactions between all of the services. The map may still be in an interim state as it will take the Petclinic Microservice application a few minutes to start up and fully synchronize. Reducing the time filter to a custom time of 2 minutes will help. The initial startup-related errors (red dots) will eventually disappear.
Next, let’s examine the metrics that are available for each service that is instrumented and visit the request, error, and duration (RED) metrics Dashboard
For this exercise we are going to use a common scenario you would use if the service operation was showing high latency, or errors for example.
Select (click) on the Customer Service in the Dependency map (1), then make sure the customers-service is selected in the Services dropdown box (2). Next, select GET /Owners from the Operations dropdown (3)**.
This should give you the workflow with a filter on GET /owners(1) as shown below.
APM Trace
To pick a trace, select a line in the Service Requests & Errors chart (2), when the dot appears click to get a list of sample traces:
Once you have the list of sample traces, click on the blue (3) Trace ID Link (make sure it has the same three services mentioned in the Service Column.)
This brings us the the Trace selected in the Waterfall view:
Here we find several sections:
The actual Waterfall Pane (1), where you see the trace and all the instrumented functions visible as spans, with their duration representation and order/relationship showing.
The Trace Info Pane (2), by default, shows the selected Span information (highlighted with a box around the Span in the Waterfall Pane).
The Span Pane (3), here you can find all the Tags that have been sent in the selected Span, You can scroll down to see all of them.
The process Pane, with tags related to the process that created the Span (scroll down to see as it is not in the screenshot).
The Trace Properties at the top of the right-hand pane by default is collapsed as shown.
APM Span
While we examine our spans, let’s look at several features that you get out of the box without code modifications when using automatic discovery and configuration on top of tracing:
Due to the fact there are several different routes
First, in the Waterfall Pane, make sure the customers-service:SELECT petclinic.owners or similar span is selected as shown in the screenshot below:
The basic latency information is shown as a bar for the instrumented function or call, in our example, it took 6.3 Milliseconds.
Several similar Spans (1), are only visible if the span is repeated multiple times. In this case, there are 10 repeats in our example. (You can show/hide them all by clicking on the 10x and all spans will show in order)
Inferred Services: Calls made to external systems that are not instrumented, show up as a grey ‘inferred’ span. The Inferred Service or span in our case here is a call to the Mysql Database mysql:petclinic SELECT petclinic(2) as shown above our selected span.
Span Tags: In the Tag Pane, standard tags produced by the automatic discovery and configuration. In this case, the span is calling a Database, so it includes the db.statement tag (3). This tag will hold the DB query statement and is used by the Database call performed during this span. This will be used by the DB-Query Performance feature. We look at DB-Query Performance in the next section.
Always-on Profiling: IF the system is configured to and has captured Profiling data during a Span life cycle, it will show the number of Call Stacks captured in the Spans timeline (15 Call Stacks for the customers-service:SELECT petclinic.owners Span shown above).
We will look at Profiling in the next section.
Service Centric View
Splunk APM provide Service Centric Views that provide engineers a deep understanding of service performance in one centralized view. Now, across every service, engineers can quickly identify errors or bottlenecks from a service’s underlying infrastructure, pinpoint performance degradations from new deployments, and visualize the health of every third party dependency.
To see this dashboard for the api-gateway, make sure you have the api-gateway service selected in the Service Map, then click on the *View Service button in the top of the right-hand pane. This will bring you to the Service Centric View dashboard:
This view, which is available for each of your instrumented services, offers an overview of Service metrics, Runtime metrics and Infrastructure metrics.
You can select the *Back function of you browser to go back to the previous view.
Always-On Profiling & DB Query Performance
15 minutes
As we have seen in the previous chapter, you can trace your interactions between the various services using APM without touching your code, which will allow you to identify issues faster.
However, besides tracing automatic discovery and configuration offers additional features out of the box that can help you find issues even faster. In this section we are going to look at two of them:
Always-on Profiling and Java Metrics
Database Query Performance
If you want to dive deeper into Always-on Profiling or DB-Query performance, we have a separate Ninja Workshop called Debug Problems in Microservices that you can follow.
Subsections of Always-On Profiling & DB Query Performance
Always-On Profiling & Metrics
When we installed the Splunk Distribution of the OpenTelemetry Collector using the Helm chart earlier, we configured it to enable AlwaysOn Profiling and Metrics. This means that the collector will automatically generate CPU and Memory profiles for the application and send them to Splunk Observability Cloud.
When you deploy the PetClinic application and set the annotation, the collector automatically detects the application and instruments it for traces and profiling. We can verify this by examining the startup logs of one of the Java containers we are instrumenting by running the following script:
The logs should show what flags were picked up by the Java automatic discovery and configuration:
. ~/workshop/petclinic/scripts/get_logs.sh
2024/02/15 09:42:00 Problem with dial: dial tcp 10.43.104.25:8761: connect: connection refused. Sleeping 1s
2024/02/15 09:42:01 Problem with dial: dial tcp 10.43.104.25:8761: connect: connection refused. Sleeping 1s
2024/02/15 09:42:02 Connected to tcp://discovery-server:8761
Picked up JAVA_TOOL_OPTIONS:  -javaagent:/otel-auto-instrumentation-java/javaagent.jar
Picked up _JAVA_OPTIONS: -Dspring.profiles.active=docker,mysql -Dsplunk.profiler.call.stack.interval=150
OpenJDK 64-Bit Server VM warning: Sharing is only supported for boot loader classes because bootstrap classpath has been appended
[otel.javaagent 2024-02-15 09:42:03:056 +0000] [main] INFO io.opentelemetry.javaagent.tooling.VersionLogger - opentelemetry-javaagent - version: splunk-1.30.1-otel-1.32.1
[otel.javaagent 2024-02-15 09:42:03:768 +0000] [main] INFO com.splunk.javaagent.shaded.io.micrometer.core.instrument.push.PushMeterRegistry - publishing metrics for SignalFxMeterRegistry every 30s
[otel.javaagent 2024-02-15 09:42:07:478 +0000] [main] INFO com.splunk.opentelemetry.profiler.ConfigurationLogger - -----------------------
[otel.javaagent 2024-02-15 09:42:07:478 +0000] [main] INFO com.splunk.opentelemetry.profiler.ConfigurationLogger - Profiler configuration:
[otel.javaagent 2024-02-15 09:42:07:480 +0000] [main] INFO com.splunk.opentelemetry.profiler.ConfigurationLogger -                  splunk.profiler.enabled : true
[otel.javaagent 2024-02-15 09:42:07:505 +0000] [main] INFO com.splunk.opentelemetry.profiler.ConfigurationLogger -                splunk.profiler.directory : /tmp
[otel.javaagent 2024-02-15 09:42:07:505 +0000] [main] INFO com.splunk.opentelemetry.profiler.ConfigurationLogger -       splunk.profiler.recording.duration : 20s
[otel.javaagent 2024-02-15 09:42:07:506 +0000] [main] INFO com.splunk.opentelemetry.profiler.ConfigurationLogger -               splunk.profiler.keep-files : false
[otel.javaagent 2024-02-15 09:42:07:510 +0000] [main] INFO com.splunk.opentelemetry.profiler.ConfigurationLogger -            splunk.profiler.logs-endpoint : http://10.13.2.38:4317
[otel.javaagent 2024-02-15 09:42:07:513 +0000] [main] INFO com.splunk.opentelemetry.profiler.ConfigurationLogger -              otel.exporter.otlp.endpoint : http://10.13.2.38:4317
[otel.javaagent 2024-02-15 09:42:07:513 +0000] [main] INFO com.splunk.opentelemetry.profiler.ConfigurationLogger -           splunk.profiler.memory.enabled : true
[otel.javaagent 2024-02-15 09:42:07:515 +0000] [main] INFO com.splunk.opentelemetry.profiler.ConfigurationLogger -             splunk.profiler.tlab.enabled : true
[otel.javaagent 2024-02-15 09:42:07:516 +0000] [main] INFO com.splunk.opentelemetry.profiler.ConfigurationLogger -        splunk.profiler.memory.event.rate : 150/s
[otel.javaagent 2024-02-15 09:42:07:516 +0000] [main] INFO com.splunk.opentelemetry.profiler.ConfigurationLogger -      splunk.profiler.call.stack.interval : PT0.15S
[otel.javaagent 2024-02-15 09:42:07:517 +0000] [main] INFO com.splunk.opentelemetry.profiler.ConfigurationLogger -  splunk.profiler.include.internal.stacks : false
[otel.javaagent 2024-02-15 09:42:07:517 +0000] [main] INFO com.splunk.opentelemetry.profiler.ConfigurationLogger -      splunk.profiler.tracing.stacks.only : false
[otel.javaagent 2024-02-15 09:42:07:517 +0000] [main] INFO com.splunk.opentelemetry.profiler.ConfigurationLogger - -----------------------
[otel.javaagent 2024-02-15 09:42:07:518 +0000] [main] INFO com.splunk.opentelemetry.profiler.JfrActivator - Profiler is active.
We are interested in the section written by the com.splunk.opentelemetry.profiler.ConfigurationLogger or the Profiling Configuration.
We can see the various settings you can control, some that are useful depending on your use case like the splunk.profiler.directory - The location where the agent writes the call stacks before sending them to Splunk. This may be different depending on how you configure your containers.
Another parameter you may want to change is splunk.profiler.call.stack.interval This is how often the system takes a CPU Stack trace. You may want to reduce this if you have short spans like we have in our application. (we kept the default as the spans in this demo application are extremely short, so Span may not always have a CPU Call Stack related to it.)
You can find how to set these parameters here. Below, is how you set a higher collection rate for call stack in your deployment.yaml, exactly how to pass any JAVA option to the Java application running in your container:
If you don’t see those lines as a result of the script, the startup may have taken too long and generated too many connection errors, try looking at the logs directly with kubectl or the k9s utility that is installed.
Always-On Profiling in the Trace Waterfall
Make sure you have your original (or similar) Trace & Span (1) selected in the APM Waterfall view and select Memory Stack Traces (2) from the right-hand pane:
The pane should show you the Memory Stack Trace Flame Graph (3), you can scroll down and/or make the pane for a better view by dragging the right side of the pane.
As AlwaysOn Profiling is constantly taking snapshots, or stack traces, of your application’s code and reading through thousands of stack traces is not practical, AlwaysOn Profiling aggregates and summarizes profiling data, providing a convenient way to explore Call Stacks in a view called the Flame Graph. It represents a summary of all stack traces captured from your application. You can use the Flame Graph to discover which lines of code might be causing performance issues and to confirm whether the changes you make to the code have the intended effect.
To dive deeper into the Always-on Profiling, select Span (3) in the Profiling Pane under Memory Stack Traces
This will bring you to the Always-on Profiling main screen, with the Memory view pre-selected:
Java Memory Metric Charts (1), Allow you to Monitor Heap Memory, Application Activity like Memory Allocation Rate and Garbage Collecting Metrics.
Ability to focus/see metrics and Stack Traces only related to the Span (2), This will filter out background activities running in the Java application if required.
Java Function calls identified. (3), allowing you to drill down into the Methods called from that function.
The Flame Graph (4), with the visualization of hierarchy based on the stack traces of the profiled service.
For further investigation the UI let’s you grab the actual stack trace, so you can use in your coding platform to go to the actual lines of code used at this point (depending of course on your preferred Coding platform)
Database Query Performance
With Database Query Performance, you can monitor the impact of your database queries on service availability directly in Splunk APM. This way, you can quickly identify long-running, unoptimized, or heavy queries and mitigate issues they might be causing, without having to instrument your databases.
To look at the performance of your database queries, make sure you are on the APM Explore page either by going back in the browser or navigating to the APM section in the Menu bar, then click on the Explore tile.
Select the inferred database service mysql:petclinic Inferred Database server in the Dependency map (1), then scroll the right-hand pane to find the Database Query Performance Pane (2).
If the service you have selected in the map is indeed an (inferred) database server, this pane will populate with the top 90% (P90) database calls based on duration. To dive deeper into the db-query performance function click somewhere on the word Database Query Performance at the top of the pane.
This will bring us to the DB-query Performance overview screen:
Database Query Normalization
By default, Splunk APM instrumentation sanitizes database queries to remove or mask sensible data, such as secrets or personally identifiable information (PII) from the db.statements. You can find how to turn off database query normalization here.
This screen will show us all the Database queries (1) done towards our database from your application, based on the Traces & Spans sent to the Splunk Observability Cloud. Note that you can compare them across a time block or sort them on Total Time, P90 Latency & Requests (2).
For each Database query in the list, we see the highest latency, the total number of calls during the time window and the number of requests per second (3). This allows you to identify places where you might optimize your queries.
You can select traces containing Database Calls via the two charts in the right-hand pane (5). Use the Tag Spotlight pane (6) to drill down what tags are related to the database calls, based on endpoints or tags.
If you click on a specific Query (1) you get a detailed query Details pane appears (2), which you can use for more detailed investigations:
Log Observer
10 minutes
Up until this point, there have been no code changes, yet tracing, profiling and Database Query Performance data is being sent to Splunk Observability Cloud.
Next we will work with the Splunk Log Observer to the mix to obtain log data from the Spring PetClinic application.
The Splunk OpenTelemetry Collector automatically collects logs from the Spring PetClinic application and sends them to Splunk Observability Cloud using the OTLP exporter, annotating the log events with trace_id, span_id and trace flags.
The Splunk Log Observer is then used to view the logs and with the changes to the log format the platform can automatically correlate log information with services and traces.
In order to see logs click on the Log Observer in the left-hand menu. Once in Log Observer please ensure Index on the filter bar is set to splunk4rookies-workshop.
Next, click Add Filter and search for the field deployment.environment, select your workshop instance and click = (to include). You will now see only the log messages from your PetClinic application.
Next search for the field service.name, select the value customers-service and click = (to include). Now the log entries will be reduced to show the entries from your customers-service only.
Click on an entry with an injected trace_id (1). A side pane will open where you can see the detailed information, including the relevant trace and span IDs (2).
Related Content
In the bottom pane is where any related content will be reported. In the screenshot below you can see that APM has found a trace that is related to this log line (1):
By clicking on Trace for 4be8b620a98aa938e76cf76aa1bde396(2) will take us to the waterfall in APM for this specific trace that this log line was generated from:
Note that you now have Related Content pane for Logs appear (1). Clicking on this will take you back to Log Observer and will display all the log lines that are part of this trace.
Real User Monitoring
10 minutes
To enable Real User Monitoring (RUM) instrumentation for your application, you need to add the Open Telemetry Javascript https://github.com/signalfx/splunk-otel-js-web snippet to your code.
The Spring PetClinic application uses a single HTML page as the “index” page, that is reused across all pages of the application. This is the perfect location to insert the Splunk RUM Instrumentation Library as it will be loaded for all pages automatically.
The following snippet is inserted into the section of the index.html page:
<scriptsrc="/static/env.js"></script><scriptsrc="https://cdn.signalfx.com/o11y-gdi-rum/latest/splunk-otel-web.js"crossorigin="anonymous"></script><scriptsrc="https://cdn.signalfx.com/o11y-gdi-rum/latest/splunk-otel-web-session-recorder.js"crossorigin="anonymous"></script><script>varrealm=env.RUM_REALM;console.log('Realm:',realm);varauth=env.RUM_AUTH;varappName=env.RUM_APP_NAME;varenvironmentName=env.RUM_ENVIRONMENTif(realm&&auth){SplunkRum.init({realm:realm,rumAccessToken:auth,applicationName:appName,deploymentEnvironment:environmentName,version:'1.0.0',});SplunkSessionRecorder.init({app:appName,realm:realm,rumAccessToken:auth});constProvider=SplunkRum.provider;vartracer=Provider.getTracer('appModuleLoader');}else{// Realm or auth is empty, provide default values or skip initialization
console.log("Realm or auth is empty. Skipping Splunk Rum initialization.");}</script>
The above snippet of code has already been added to index.html in the repository you cloned earlier, but it is not yet activated, we will do that in the next section.
If you want you can verify the snippet, we added to the index.html by viewing the file:
more ~/spring-petclinic-microservices/spring-petclinic-api-gateway/src/main/resources/static/index.html
<!DOCTYPE html>

<html ng-app="petClinicApp" lang="en">

<head>
    <meta http-equiv="Content-Type" content="text/html; charset=UTF-8"/>
    <meta charset="utf-8"/>
    <meta http-equiv="X-UA-Compatible" content="IE=edge"/>
    <meta name="viewport" content="width=device-width, initial-scale=1, user-scalable=0, minimal-ui"/>
    <!-- The above 4 meta tags *must* come first in the head; any other head content must come *after* these tags -->

    <link rel="shortcut icon" type="image/x-icon" href="/images/favicon.png"/>

    <title>PetClinic :: a Spring Framework demonstration</title>
    <link rel="stylesheet" href="/webjars/bootstrap/css/bootstrap.min.css"/>
    <link rel="stylesheet" href="/css/petclinic.css"/>

    <script src="/webjars/jquery/jquery.min.js"></script>
    <script src="/webjars/bootstrap/js/bootstrap.min.js"></script>

    <script src="/webjars/angularjs/angular.min.js"></script>
    <script src="/webjars/angular-ui-router/angular-ui-router.min.js"></script>
    <!-- Section added for  RUM -->
    <script src="/scripts/env.js"></script>
    <script src="https://cdn.signalfx.com/o11y-gdi-rum/latest/splunk-otel-web.js" crossorigin="anonymous"></script>
    <script src="https://cdn.signalfx.com/o11y-gdi-rum/latest/splunk-otel-web-session-recorder.js" crossorigin="anonymous"></script>
    <script>
        var realm = env.RUM_REALM;
        console.log('Realm:', realm);
        var auth = env.RUM_AUTH;
        var appName = env.RUM_APP_NAME;
        var environmentName = env.RUM_ENVIRONMENT
        if (realm && auth) {
            SplunkRum.init({
                realm: realm,
                rumAccessToken: auth,
                applicationName: appName,
                deploymentEnvironment: environmentName,
                version: '1.0.0',
            });

            SplunkSessionRecorder.init({
                app: appName,
                realm: realm,
                rumAccessToken: auth
            });
            const Provider = SplunkRum.provider;
            var tracer=Provider.getTracer('appModuleLoader');
        } else {
        // Realm or auth is empty, provide default values or skip initialization
        console.log("Realm or auth is empty. Skipping Splunk Rum initialization.");
        }
    </script>
     <!-- Section added for  RUM -->
    <script src="/scripts/app.js"></script>
Subsections of Real User Monitoring
Rebuild PetClinic with RUM enabled
At the top of the previous code snippet, there is a reference to the file /static/env.js, which contains/sets the variables used by RUM, currently these are not configured and therefore no RUM traces are currently being sent.
Run the script that will update variables to enable RUM traces so they are viewable in Splunk Observability Cloud. Note, that the env.js script contains a deliberate JavaScript error, that will be picked up in RUM:
As soon as the container is pushed into the repository, just restart the api-gateway to apply the changes:
kubectl rollout restart deployment api-gateway
deployment.apps/api-gateway restarted
Validate that the application is running by visiting http://<IP_ADDRESS>:81 (replace <IP_ADDRESS> with the IP address you obtained above). Make sure the application is working correctly by visiting the All Owners(1) and select an owner, then add a visit(2). We will use this action when checking RUM
If you want, you can access this website on your phone/tablet as well as this data will also show up in RUM.
Select the RUM view for the Petclinic App
Once RUM has been configured and you have added a visit for a pet, you can log in to Splunk Observability Cloud and verify that RUM traces are flowing in.
Lets start a quick high level tour into RUM by clicking RUM in the left-hand menu. Then change the Environment filter (1) to the name of your workshop instance from the dropdown box, it will be <INSTANCE>-workshop(1) (where INSTANCE is the value from the shell script you ran earlier). Make sure it is the only one selected.
Then change the App(2) dropdown box to the name of your app, it will be <INSTANCE>-store
Once you have selected your Environment and App, you will see an overview page showing the RUM status of your App (if your Summary Dashboard is just a single row of numbers, you are looking at the condensed view. You can expand it by clicking on the > in front of the Application name). If any JavaScript error occurred they will show up as shown below:
To continue, click on the blue link (with your workshop name) to get to the details page, this will bring up a new dashboard view breaking down the interactions by UX Metrics, Front-end Health, Back-end Health and Custom Events and comparing them to historic metrics (1 hour by default).
Normally you have only one line inside the first chart, Click on the link that relates to your Petclinic shop,
http://198.19.249.62 in our example:
This will bring us to the Tag Spotlight page:
RUM trace Waterfall view & linking to APM
In the TAG Spotlight view, you are presented with all the tags associated with the RUM data. Tags are key-value pairs that are used to identify the data. In this case, the tags are automatically generated by the OpenTelemetry instrumentation. The tags are used to filter the data and to create the charts and tables. The Tag Spotlight view allows you detect trends in behavior and to drill down into a user session.
Click on User Sessions (1), this will show you the list of user session that occurred during the time window.
We want to look at one of the session , so click on Duration(2) to sort on duration, and make sure you click on the link of one of the longer ones (3):
RUM trace Waterfall view & linking to APM
We are now looking at the RUM Trace waterfall, this will tell you what happened during the session on the user device as they visited the page of our petclinic application.
If you scroll down the waterfall find click on the Vets segment on the right (1), you see a list of action that occurred during the handling of the Vets request. Note, that the HTTP request have a blue APM link before the return code. Pick one, and click on the APM link. This will show you the APM info for this Ser vice call to our Microservices in Kubernetes.
Note , that there give you the information what happened during action in the Microservices, and if you want to drill down to verify what happened with the request, click on the Trace ID url.
This will show you the trace related to your request from RUM:
You can see that the entry point into your service now has a RUM (1) related content link added, allowing you to return back to your RUM session after you validated what happened in your Microservices.
Workshop Wrap-up 🎁
Congratulations, you have completed the Get the Most Out of Your Existing Kubernetes Java Applications Using Automatic Discovery and Configuration With OpenTelemetry workshop.
Today, you have learnt how easy it is to add Tracing, Code Profiling and Database Query Performance to your existing Java application in Kubernetes.
You immediately improved the observability of the application and infrastructure with out touching a line of code or configuration using Automatic Discovery and Configuration.
You also learnt that with simple configuration changes you can add even more observability (logging and RUM) to the application in order to provide end-to-end observability.
NodeJS Zero-Config Workshop
30 minutesAuthor
Robert Castley
The goal is to walk through the basic steps to configure the following components of the Splunk Observability Cloud platform:
Splunk Infrastructure Monitoring (IM)
Splunk Zero Configuration Auto Instrumentation for NodeJS (APM)
AlwaysOn Profiling
Splunk Log Observer (LO)
We will deploy the OpenTelemetry Astronomy Shop application in Kubernetes, which contains two NodeJS services (Frontend & Payment Service). Once the application and the OpenTelemetry Connector are up and running, we will start seeing metrics, traces and logs via the Zero Configuration Auto Instrumentation for NodeJS that will be used by the Splunk Observability Cloud platform to provide insights into the application.
Prerequisites
Outbound SSH access to port 2222.
Outbound HTTP access to port 8083.
Familiarity with the bash shell and vi/vim editor.
To not conflict with other workshops, we will deploy the OpenTelemetry Demo in a separate namespace called otel-demo. To create the namespace, run the following command:
kubectl create namespace otel-demo
2. Deploy the OpenTelemetry Demo
Next, change to the directory containing the OpenTelemetry Demo application:
cd ~/workshop/apm
Deploy the OpenTelemetry Demo application:
kubectl apply -n otel-demo -f otel-demo.yaml
serviceaccount/opentelemetry-demo created
service/opentelemetry-demo-adservice created
service/opentelemetry-demo-cartservice created
service/opentelemetry-demo-checkoutservice created
service/opentelemetry-demo-currencyservice created
service/opentelemetry-demo-emailservice created
service/opentelemetry-demo-featureflagservice created
service/opentelemetry-demo-ffspostgres created
service/opentelemetry-demo-frontend created
service/opentelemetry-demo-kafka created
service/opentelemetry-demo-loadgenerator created
service/opentelemetry-demo-paymentservice created
service/opentelemetry-demo-productcatalogservice created
service/opentelemetry-demo-quoteservice created
service/opentelemetry-demo-recommendationservice created
service/opentelemetry-demo-redis created
service/opentelemetry-demo-shippingservice created
deployment.apps/opentelemetry-demo-accountingservice created
deployment.apps/opentelemetry-demo-adservice created
deployment.apps/opentelemetry-demo-cartservice created
deployment.apps/opentelemetry-demo-checkoutservice created
deployment.apps/opentelemetry-demo-currencyservice created
deployment.apps/opentelemetry-demo-emailservice created
deployment.apps/opentelemetry-demo-featureflagservice created
deployment.apps/opentelemetry-demo-ffspostgres created
deployment.apps/opentelemetry-demo-frauddetectionservice created
deployment.apps/opentelemetry-demo-frontend created
deployment.apps/opentelemetry-demo-kafka created
deployment.apps/opentelemetry-demo-loadgenerator created
deployment.apps/opentelemetry-demo-paymentservice created
deployment.apps/opentelemetry-demo-productcatalogservice created
deployment.apps/opentelemetry-demo-quoteservice created
deployment.apps/opentelemetry-demo-recommendationservice created
deployment.apps/opentelemetry-demo-redis created
deployment.apps/opentelemetry-demo-shippingservice created
Once the application is deployed, we need to wait for the pods to be in a Running state. To check the status of the pods, run the following command:
Obtain the public IP address of the instance you are running on. You can do this by running the following command:
curl ifconfig.me
Once the port-forward is running, you can access the application by opening a browser and navigating to http://<public IP address>:8083. You should see the following:
Once you have confirmed the application is running, you can close the port-forward by pressing ctrl + c.
Next, we will deploy the OpenTelemetry Collector.
Installing the OpenTelemetry Collector
1. Introduction
Delete any existing OpenTelemetry Collectors
If you have completed any other Observability workshops, please ensure you delete the collector running in Kubernetes before continuing. This can be done by running the following command:
helm delete splunk-otel-collector
2. Confirm environment variables
To ensure your instance is configured correctly, we need to confirm that the required environment variables for this workshop are set correctly. In your terminal run the following command:
env
In the output check the following environment variables are present and have values set:
ACCESS_TOKEN
REALM
RUM_TOKEN
HEC_TOKEN
HEC_URL
For this workshop, all of the above are required. If any are missing, please contact your instructor.
3. Install the OpenTelemetry Collector
We can then go ahead and install the Collector. Some additional parameters are passed to the helm install command, they are:
--set="operator.enabled=true" - Enabled the Splunk OpenTelemetry Collector Operator for Kubernetes.
--set="certmanager.enabled=true" - The cert-manager adds certificates and certificate issuers as resource types in Kubernetes clusters and simplifies the process of obtaining, renewing and using those certificates.
--set="splunkObservability.profilingEnabled=true" - Enables CPU/Memory profiling for supported languages.
Once the installation is completed, you can navigate to the Kubernetes Navigator to see the data from your host.
Click on Add filters select k8s.cluster.name and select the cluster of your workshop instance.
You can determine your instance name from the command prompt in your terminal session:
echo$INSTANCE
Once you see data flowing for your host, we are then ready to get started with the APM component.
Zero Configuration - Frontend Service
1. Patching the Frontend service
First, confirm that you can see your environment in APM. There should be a service called loadgenerator displayed in the Service map.
Next, we will patch the frontend deployment with an annotation to inject the NodeJS auto instrumentation. This will allow us to see the frontend service in APM. Note, that at this point we have not edited any code.
This will cause the opentelemetry-demo-frontend pod to restart.
The annotation value default/splunk-otel-collector refers to the instrumentation configuration named splunk-otel-collector in the default namespace.
If the chart is not installed in the default namespace, modify the annotation value to be {chart_namespace}/splunk-otel-collector.
After a few minutes, you should see the frontend service in APM.
With the frontend service highlighted, click on the Traces tab to see the traces for the service. Select one of the traces and confirm that the trace contains metadata confirming that the Splunk Zero-Configuration Auto-Instrumentation for NodeJS is being used.
Zero Configuration - Payment Service
1. Patching the Payment Service
Finally, we will patch the paymentservice deployment with an annotation to inject the NodeJS auto instrumentation. This will allow us to see the paymentservice service in APM.
This will cause the opentelemetry-demo-paymentservice pod to restart and after a few minutes, you should see the paymentservice service in APM.
Code Profiling - Payment Service
1. AlwaysOn Profiling for the Payment Service
AlwaysOn Profiling is a feature of the Splunk Distribution of OpenTelemetry Collector that allows you to collect CPU and Memory profiling data for your services without having to modify your code. This is useful for troubleshooting performance issues in your services. Here are some of the benefits of AlwaysOn Profiling:
Perform continuous profiling of your applications. The profiler is always on once you activate it.
Collect code performance context and link it to trace data.
Explore memory usage and garbage collection of your application.
Analyze code bottlenecks that impact service performance.
Identify inefficiencies that increase the need for scaling up cloud resources.
With the opentelemetry-demo-paymentservice selected, click on AlwaysOn Profiling to view the code profiling data for the service.
Here you can see the CPU and Memory profiling data for the paymentservice service. You can also see the CPU and Memory profiling data for the frontend service by selecting the opentelemetry-demofrontend service from the Service dropdown.
Logs - Payment Service
1. Viewing the logs for the Payment Service
Navigate back to APM from the main menu and under Services click on opentelemetry-demo-paymentservice. This will open up the Service map for the paymentservice service only.
At the bottom of the page, click on the Logs(1) tab to view the logs for the paymentservice service.
Once in Log Observer select one of the log entries to view the metadata for the log entry.
Monitoring Horizontal Pod Autoscaling in Kubernetes
45 minutesAuthor
Robert Castley
This workshop will equip you with a basic understanding of monitoring Kubernetes using the Splunk OpenTelemetry Collector. During the workshop, you will deploy PHP/Apache and a load generator.
You will learn about OpenTelemetry Receivers, Kubernetes Namespaces, ReplicaSets, Kubernetes Horizontal Pod AutoScaling and how to monitor all this using the Splunk Observability Cloud. The main learnings from the workshop will be a better understanding of the Kubernetes Navigator (and Dashboards) in Splunk Observability Cloud as well as seeing Kubernetes metrics, events and Detectors.
For this workshop, Splunk has prepared an Ubuntu Linux instance in AWS/EC2 all pre-configured for you.
To get access to the instance that you will be using in the workshop, please visit the URL provided by the workshop leader.
Subsections of Monitoring Horizontal Pod Autoscaling in Kubernetes
Deploying the OpenTelemetry Collector in Kubernetes using a NameSpace
1. Kubernetes Navigator 2.0 UI
We will be starting this workshop using the new Kubernetes Navigator so please check that you are already using the new Navigator.
When you select Infrastructure from the main menu on the left, followed by selecting Kubernetes, you should see two service panes (K8s nodes and K8s workloads) for Kubernetes, similar to the ones below:
2. Connect to EC2 instance
You will be able to connect to the workshop instance by using SSH from your Mac, Linux or Windows device. Open the link to the sheet provided by your instructor. This sheet contains the IP addresses and the password for the workshop instances.
Info
Your workshop instance has been pre-configured with the correct Access Token and Realm for this workshop. There is no need for you to configure these.
3. Install Splunk OTel using Helm
Install the OpenTelemetry Collector using the Splunk Helm chart. First, add the Splunk Helm chart repository and update.
Using ACCESS_TOKEN=<REDACTED>
Using REALM=eu0
"splunk-otel-collector-chart" has been added to your repositories
Using ACCESS_TOKEN=<REDACTED>
Using REALM=eu0
Hang tight while we grab the latest from your chart repositories...
...Successfully got an update from the "splunk-otel-collector-chart" chart repository
Update Complete. ⎈Happy Helming!⎈
Install the OpenTelemetry Collector Helm with the following commands, do NOT edit this:
You can monitor the progress of the deployment by running kubectl get pods which should typically report that the new pods are up and running after about 30 seconds.
Ensure the status is reported as Running before continuing.
kubectl get pods
NAME                                                          READY   STATUS    RESTARTS   AGE
splunk-otel-collector-agent-pvstb                             2/2     Running   0          19s
splunk-otel-collector-k8s-cluster-receiver-6c454894f8-mqs8n   1/1     Running   0          19s
Use the label set by the helm install to tail logs (You will need to press ctrl + c to exit).
If you make an error installing the Splunk OpenTelemetry Collector you can start over by deleting the installation using:
helm delete splunk-otel-collector
Tour of the Kubernetes Navigator
1. Cluster vs Workload View
The Kubernetes Navigator offers you two separate use cases to view your Kubernetes data.
The K8s workloads are focusing on providing information in regards to workloads a.k.a. your deployments.
The K8s nodes are focusing on providing insight into the performance of clusters, nodes, pods and containers.
You will initially select either view depending on your need (you can switch between the view on the fly if required). The most common one we will use in this workshop is the workload view and we will focus on that specifically.
1.1 Finding your K8s Cluster Name
Your first task is to identify and find your cluster. The cluster will be named as determined by the preconfigured environment variable INSTANCE. To confirm the cluster name enter the following command in your terminal:
echo$INSTANCE-k3s-cluster
Please make a note of your cluster name as you will need this later in the workshop for filtering.
2. Workloads & Workload Details Pane
Go to the Infrastructure page in the Observability UI and select Kubernetes, this will offer you a set of Kubernetes services, one of them being the K8s workloads pane.
The pane will show a tiny graph giving you a bird’s eye view of the load being handled across those Workloads. Also, if there are any alerts for one of the workloads, you will see a small alert indicator as shown in the image below.
Click on the K8s workloads pane and you will be taken to the workload view.
Initially, you will see all the workloads for all clusters that are reported into your Observability Cloud Org. If an alert has fired for any of the workloads, it will be highlighted on the top right (as marked with a red stripe) in the image below. You can go directly to the alert by clicking it to expand it.
Now, let’s find your cluster by filtering on the field k8s.cluster.name in the filter toolbar (as marked with a blue stripe).
Note
You can enter a partial name into the search box, such as emea-ws-7*, to quickly find your Cluster.
Also, it’s a very good idea to switch the default time from the default -4h back to the last 15 minutes (-15m).
You should now just see information for your own cluster.
Workshop Question
How many workloads are running & how many namespaces are in your Cluster?
2.1 Using the Navigator Selection Chart
The K8s workloads table is a common feature used across most of the Navigators and will offer you a list view of the data you are viewing. In our case, it shows a list of Pods Failed grouped by k8s.namespace.name.
Now let’s change the list view to a heat map view by selecting either the Heat map icon or the List icon in the upper-right corner of the screen (as marked with the purple line).
Changing this option will result in the following visualization:
In this view, you will note that each workload is now a colored square. These squares will change color according to the Color by option you selected, as marked by the first green line in the image above. The colors give a visual indication of health and/or usage. You can check the meaning by hovering over the legend exclamation icon
bottom right of the heatmaps.
Another valuable option in this screen is Find Outliers which provides historical analytics of your clusters based on what is selected in the Color by dropdown.
Now, let’s select the File system usage (bytes) from the Color by drop-down box, then click on the Find outliers drop-down as marked by a yellow line in the above image and make sure you change the Scope in the dialog to Per k8s.namespace.name and Deviation from Median as below:
The Find Outliers view is very useful when you need to view a selection of your workloads (or any service depending on the Navigator used) and quickly need to figure out if something has changed.
It will give you fast insight into items (workloads in our case) that are performing differently (both increased or decreased) which helps to make it easier to spot problems.
2.2 The Deployment Overview pane
The Deployment Overview pane gives you a quick insight into the status of your deployments. You can see at once if the pods of your deployments are Pending, Running, Succeeded, Failed or in an Unknown state.
Running: Pod is deployed and in a running state
Pending: Waiting to be deployed
Succeeded: Pod has been deployed and completed its job and is finished
Failed: Containers in the pod have run and returned some kind of error
Unknown: Kubernetes isn’t reporting any of the known states. (This may be during the starting or stopping of pods, for example).
You can expand the Workload name by hovering your mouse on it, in case the name is longer than the chart allows.
To filter to a specific workload, you can click on three dots … next to the workload name in the k8s.workload.name column and choose Filter from the dropdown box.
This will add the selected workload to your filters. It would then list a single workload in the default namespace.
From the Heatmap above find the splunk-otel-collector-k8s-cluster-receiver in the default namespace and click on the square to see more information about the workload.
Workshop Question
What are the CPU request & CPU limit units for the otel-collector?
At this point, you can drill into the information of the pods, but that is outside the scope of this workshop.
3. Navigator Sidebar
Later in the workshop, you will deploy an Apache server into your cluster which will display an icon in the Navigator Sidebar.
In navigators for Kubernetes, you can track dependent services and containers in the navigator sidebar. To get the most out of the navigator sidebar you configure the services you want to track by configuring an extra dimension called service.name. For this workshop, we have already configured the extraDimensions in the collector configuration for monitoring Apache e.g.
extraDimensions:service.name:php-apache
The Navigator Sidebar will expand and a link to the discovered service will be added as seen in the image below:
This will allow for easy switching between Navigators. The same applies to your Apache server instance, it will have a Navigator Sidebar allowing you to quickly jump back to the Kubernetes Navigator.
Deploying PHP/Apache
1. Namespaces in Kubernetes
Most of our customers will make use of some kind of private or public cloud service to run Kubernetes. They often choose to have only a few large Kubernetes clusters as it is easier to manage centrally.
Namespaces are a way to organize these large Kubernetes clusters into virtual sub-clusters. This can be helpful when different teams or projects share a Kubernetes cluster as this will give them the easy ability to just see and work with their resources.
Any number of namespaces are supported within a cluster, each logically separated from others but with the ability to communicate with each other. Components are only visible when selecting a namespace or when adding the --all-namespaces flag to kubectl instead of allowing you to view just the components relevant to your project by selecting your namespace.
Most customers will want to install the applications into a separate namespace. This workshop will follow that best practice.
2. DNS and Services in Kubernetes
The Domain Name System (DNS) is a mechanism for linking various sorts of information with easy-to-remember names, such as IP addresses. Using a DNS system to translate request names into IP addresses makes it easy for end-users to reach their target domain name effortlessly.
Most Kubernetes clusters include an internal DNS service configured by default to offer a lightweight approach for service discovery. Even when Pods and Services are created, deleted, or shifted between nodes, built-in service discovery simplifies applications to identify and communicate with services on the Kubernetes clusters.
In short, the DNS system for Kubernetes will create a DNS entry for each Pod and Service. In general, a Pod has the following DNS resolution:
pod-name.my-namespace.pod.cluster-domain.example
For example, if a Pod in the default namespace has the Pod name my_pod, and the domain name for your cluster is cluster.local, then the Pod has a DNS name:
my_pod.default.pod.cluster.local
Any Pods exposed by a Service have the following DNS resolution available:
The above file contains an observation rule for Apache using the OTel receiver_creator. This receiver can instantiate other receivers at runtime based on whether observed endpoints match a configured rule.
The configured rules will be evaluated for each endpoint discovered. If the rule evaluates to true, then the receiver for that rule will be started as configured against the matched endpoint.
In the file above we tell the OpenTelemetry agent to look for Pods that match the name apache and have port 80 open. Once found, the agent will configure an Apache receiver to read Apache metrics from the configured URL. Note, the K8s DNS-based URL in the above YAML for the service.
To use the Apache configuration, you can upgrade the existing Splunk OpenTelemetry Collector Helm chart to use the otel-apache.yaml file with the following command:
The REVISION number of the deployment has changed, which is a helpful way to keep track of your changes.
Release "splunk-otel-collector" has been upgraded. Happy Helming!
NAME: splunk-otel-collector
LAST DEPLOYED: Tue Feb  6 11:17:15 2024
NAMESPACE: default
STATUS: deployed
REVISION: 2
TEST SUITE: None
5. Kubernetes ConfigMaps
A ConfigMap is an object in Kubernetes consisting of key-value pairs that can be injected into your application. With a ConfigMap, you can separate configuration from your Pods.
Using ConfigMap, you can prevent hardcoding configuration data. ConfigMaps are useful for storing and sharing non-sensitive, unencrypted configuration information.
The OpenTelemetry collector/agent uses ConfigMaps to store the configuration of the agent and the K8s Cluster receiver. You can/will always verify the current configuration of an agent after a change by running the following commands:
kubectl get cm
Workshop Question
How many ConfigMaps are used by the collector?
When you have a list of ConfigMaps from the namespace, select the one for the otel-agent and view it with the following command:
kubectl get cm splunk-otel-collector-otel-agent -o yaml
NOTE
The option -o yaml will output the content of the ConfigMap in a readable YAML format.
Workshop Question
Is the configuration from otel-apache.yaml visible in the ConfigMap for the collector agent?
6. Review PHP/Apache deployment YAML
Inspect the YAML file ~/workshop/k3s/php-apache.yaml and validate the contents using the following command:
cat ~/workshop/k3s/php-apache.yaml
This file contains the configuration for the PHP/Apache deployment and will create a new StatefulSet with a single replica of the PHP/Apache image.
A stateless application does not care which network it is using, and it does not need permanent storage. Examples of stateless apps may include web servers such as Apache, Nginx, or Tomcat.
What metrics for your Apache instance are being reported in the Apache Navigator?
Tip: Use the Navigator Sidebar and click on the service name.
Workshop Question
Using Log Observer what is the issue with the PHP/Apache deployment?
Tip: Adjust your filters to use: object = php-apache-svc and k8s.cluster.name = <your_cluster>.
Fix PHP/Apache Issue
1. Kubernetes Resources
Especially in Production Kubernetes Clusters, CPU and Memory are considered precious resources. Cluster Operators will normally require you to specify the amount of CPU and Memory your Pod or Service will require in the deployment, so they can have the Cluster automatically manage on which Node(s) your solution will be placed.
You do this by placing a Resource section in the deployment of your application/Pod
Example:
resources:limits:# Maximum amount of CPU & memory for peek usecpu:"8"# Maximum of 8 cores of CPU allowed at for peek usememory:"8Mi"# Maximum allowed 8Mb of memoryrequests:# Request are the expected amount of CPU & memory for normal usecpu:"6"# Requesting 4 cores of a CPUmemory:"4Mi"# Requesting 4Mb of memory
If your application or Pod will go over the limits set in your deployment, Kubernetes will kill and restart your Pod to protect the other applications on the Cluster.
Another scenario that you will run into is when there is not enough Memory or CPU on a Node. In that case, the Cluster will try to reschedule your Pod(s) on a different Node with more space.
If that fails, or if there is not enough space when you deploy your application, the Cluster will put your workload/deployment in schedule mode until there is enough room on any of the available Nodes to deploy the Pods according to their limits.
2. Fix PHP/Apache Deployment
Workshop Question
Before we start, let’s check the current status of the PHP/Apache deployment. Under Alerts & Detectors which detector has fired? Where else can you find this information?
To fix the PHP/Apache StatefulSet, edit ~/workshop/k3s/php-apache.yaml using the following commands to reduce the CPU resources:
vim ~/workshop/k3s/php-apache.yaml
Find the resources section and reduce the CPU limits to 1 and the CPU requests to 0.5:
Save the changes you have made. (Hint: Use Esc followed by :wq! to save your changes).
Now, we must delete the existing StatefulSet and re-create it. StatefulSets are immutable, so we must delete the existing one and re-create it with the new changes.
You can validate the changes have been applied by running the following command:
kubectl describe statefulset php-apache -n apache
Validate the Pod is now running in Splunk Observability Cloud.
Workshop Question
Is the Apache Web Servers dashboard showing any data now?
Tip: Don’t forget to use filters and time frames to narrow down your data.
Monitor the Apache web servers Navigator dashboard for a few minutes.
Workshop Question
What is happening with the # Hosts reporting chart?
4. Fix the memory issue
If you navigate back to the Apache dashboard, you will notice that metrics are no longer coming in. We have another resource issue and this time we are Out of Memory. Let’s edit the stateful set and increase the memory to what is shown in the image below:
kubectl edit will open the contents in the vi editor, use Esc followed by :wq! to save your changes.
Because StatefulSets are immutable, we must delete the existing Pod and let the StatefulSet re-create it with the new changes.
kubectl delete pod php-apache-0 -n apache
Validate the changes have been applied by running the following command:
kubectl describe statefulset php-apache -n apache
Deploy Load Generator
Now let’s apply some load against the php-apache pod. To do this, you will need to start a different Pod to act as a client. The container within the client Pod runs in an infinite loop, sending HTTP GETs to the php-apache service.
1. Review loadgen YAML
Inspect the YAML file ~/workshop/k3s/loadgen.yaml and validate the contents using the following command:
cat ~/workshop/k3s/loadgen.yaml
This file contains the configuration for the load generator and will create a new ReplicaSet with two replicas of the load generator image.
Once you have deployed the load generator, you can see the Pods running in the loadgen namespace. Use previous similar commands to check the status of the Pods from the command line.
Workshop Question
Which metrics in the Apache Navigator have now significantly increased?
4. Scale the load generator
A ReplicaSet is a process that runs multiple instances of a Pod and keeps the specified number of Pods constant. Its purpose is to maintain the specified number of Pod instances running in a cluster at any given time to prevent users from losing access to their application when a Pod fails or is inaccessible.
ReplicaSet helps bring up a new instance of a Pod when the existing one fails, scale it up when the running instances are not up to the specified number, and scale down or delete Pods if another instance with the same label is created. A ReplicaSet ensures that a specified number of Pod replicas are running continuously and helps with load-balancing in case of an increase in resource usage.
Let’s scale our ReplicaSet to 4 replicas using the following command:
Validate the replicas are running from both the command line and Splunk Observability Cloud:
kubectl get replicaset loadgen -n loadgen
Workshop Question
What impact can you see in the Apache Navigator?
Let the load generator run for around 2-3 minutes and keep observing the metrics in the Kubernetes Navigator and the Apache Navigator.
Setup Horizontal Pod Autoscaling (HPA)
In Kubernetes, a HorizontalPodAutoscaler automatically updates a workload resource (such as a Deployment or StatefulSet), to automatically scale the workload to match demand.
Horizontal scaling means that the response to increased load is to deploy more Pods. This is different from vertical scaling, which for Kubernetes would mean assigning more resources (for example: memory or CPU) to the Pods that are already running for the workload.
If the load decreases, and the number of Pods is above the configured minimum, the HorizontalPodAutoscaler instructs the workload resource (the Deployment, StatefulSet, or other similar resource) to scale back down.
1. Setup HPA
Inspect the ~/workshop/k3s/hpa.yaml file and validate the contents using the following command:
cat ~/workshop/k3s/hpa.yaml
This file contains the configuration for the Horizontal Pod Autoscaler and will create a new HPA for the php-apache deployment.
Once deployed, php-apache will autoscale when either the average CPU usage goes above 50% or the average memory usage for the deployment goes above 75%, with a minimum of 1 pod and a maximum of 4 pods.
kubectl apply -f ~/workshop/k3s/hpa.yaml
2. Validate HPA
kubectl get hpa -n apache
Go to the Workloads or Node Detail tab in Kubernetes and check the HPA deployment.
Workshop Question
How many additional php-apache-x pods have been created?
Workshop Question
Which metrics in the Apache Navigator have significantly increased again?
3. Increase the HPA replica count
Increase the maxReplicas to 8
kubectl edit hpa php-apache -n apache
Save the changes you have made. (Hint: Use Esc followed by :wq! to save your changes).
Workshop Questions
How many pods are now running?
How many are pending?
Why are they pending?
Congratulations! You have completed the workshop.
Making Your Observability Cloud Native With OpenTelemetry
1 hourAuthor
Robert Castley
Abstract
Organizations getting started with OpenTelemetry may begin by sending data directly to an observability backend. While this works well for initial testing, using the OpenTelemetry collector as part of your observability architecture provides numerous benefits and is recommended for any production deployment.
In this workshop, we will be focusing on using the OpenTelemetry collector and starting with the fundamentals of configuring the receivers, processors, and exporters ready to use with Splunk Observability Cloud. The journey will take attendees from novices to being able to start adding custom components to help solve for their business observability needs for their distributed platform.
Ninja Sections
Throughout the workshop there will be expandable Ninja Sections, these will be more hands on and go into further technical detail that you can explore within the workshop or in your own time.
Please note that the content in these sections may go out of date due to the frequent development being made to the OpenTelemetry project. Links will be provided in the event details are out of sync, please let us know if you spot something that needs updating.
By completing this workshop you will officially be an OpenTelemetry Collector Ninja!
Target Audience
This interactive workshop is for developers and system administrators who are interested in learning more about architecture and deployment of the OpenTelemetry Collector.
Prerequisites
Attendees should have a basic understanding of data collection
Command line and vim/vi experience.
A instance/host/VM running Ubuntu 20.04 LTS or 22.04 LTS.
Minimum requirements are an AWS/EC2 t2.micro (1 CPU, 1GB RAM, 8GB Storage)
Learning Objectives
By the end of this talk, attendees will be able to:
Understand the components of OpenTelemetry
Use receivers, processors, and exporters to collect and analyze data
Identify the benefits of using OpenTelemetry
Build a custom component to solve their business needs
Subsections of Making Your Observability Cloud Native With OpenTelemetry
Installing OpenTelemetry Collector Contrib
Download the OpenTelemetry Collector Contrib distribution
The first step in installing the Open Telemetry Collector is downloading it. For our lab, we will use the wget command to download the .deb package from the OpenTelemetry Github repository.
Selecting previously unselected package otelcol-contrib.
(Reading database ... 64218 files and directories currently installed.)
Preparing to unpack otelcol-contrib_0.96.0_linux_amd64.deb ...
Unpacking otelcol-contrib (0.96.0) ...
Setting up otelcol-contrib (0.96.0) ...
Created symlink /etc/systemd/system/multi-user.target.wants/otelcol-contrib.service → /lib/systemd/system/otelcol-contrib.service.
Subsections of Installing OpenTelemetry Collector Contrib
Installing OpenTelemetry Collector Contrib
Confirm the Collector is running
The collector should now be running. We will verify this as root using systemctl command. To exit the status just press q.
sudo systemctl status otelcol-contrib
● otelcol-contrib.service - OpenTelemetry Collector Contrib
     Loaded: loaded (/lib/systemd/system/otelcol-contrib.service; enabled; vendor preset: enabled)
     Active: active (running) since Tue 2023-05-16 08:23:23 UTC; 25s ago
   Main PID: 1415 (otelcol-contrib)
      Tasks: 5 (limit: 1141)
     Memory: 22.2M
        CPU: 125ms
     CGroup: /system.slice/otelcol-contrib.service
             └─1415 /usr/bin/otelcol-contrib --config=/etc/otelcol-contrib/config.yaml

May 16 08:23:39 ip-10-0-9-125 otelcol-contrib[1415]: NumberDataPoints #0
May 16 08:23:39 ip-10-0-9-125 otelcol-contrib[1415]: Data point attributes:
May 16 08:23:39 ip-10-0-9-125 otelcol-contrib[1415]:      -> exporter: Str(logging)
May 16 08:23:39 ip-10-0-9-125 otelcol-contrib[1415]:      -> service_instance_id: Str(df8a57f4-abdc-46b9-a847-acd62db1001f)
May 16 08:23:39 ip-10-0-9-125 otelcol-contrib[1415]:      -> service_name: Str(otelcol-contrib)
May 16 08:23:39 ip-10-0-9-125 otelcol-contrib[1415]:      -> service_version: Str(0.75.0)
May 16 08:23:39 ip-10-0-9-125 otelcol-contrib[1415]: StartTimestamp: 2023-05-16 08:23:39.006 +0000 UTC
May 16 08:23:39 ip-10-0-9-125 otelcol-contrib[1415]: Timestamp: 2023-05-16 08:23:39.006 +0000 UTC
May 16 08:23:39 ip-10-0-9-125 otelcol-contrib[1415]: Value: 0.000000
May 16 08:23:39 ip-10-0-9-125 otelcol-contrib[1415]:         {"kind": "exporter", "data_type": "metrics", "name": "logging"}
Because we will be making multiple configuration file changes, setting environment variables and restarting the collector, we need to stop the collector service and disable it from starting on boot.
An alternative approach would be to use the golang tool chain to build the binary locally by doing:
go install go.opentelemetry.io/collector/cmd/builder@v0.80.0
mv $(go env GOPATH)/bin/builder /usr/bin/ocb
(Optional) Docker
Why build your own collector?
The default distribution of the collector (core and contrib) either contains too much or too little in what they have to offer.
It is also not advised to run the contrib collector in your production environments due to the amount of components installed which more than likely are not needed by your deployment.
Benefits of building your own collector?
When creating your own collector binaries, (commonly referred to as distribution), means you build what you need.
The benefits of this are:
Smaller sized binaries
Can use existing go scanners for vulnerabilities
Include internal components that can tie in with your organization
Considerations for building your collector?
Now, this would not be a 🥷 Ninja zone if it didn’t come with some drawbacks:
Go experience is recommended if not required
No Splunk support
Responsibility for distribution and lifecycle management
It is important to note that the project is working towards stability but it does not mean changes made will not break your workflow. The team at Splunk provides increased support and a higher level of stability so they can provide a curated experience helping you with your deployment needs.
The Ninja Zone
Once you have all the required tools installed to get started, you will need to create a new file named otelcol-builder.yaml and we will follow this directory structure:
.
└── otelcol-builder.yaml
Once we have the file created, we need to add a list of components for it to install with some additional metadata.
For this example, we are going to create a builder manifest that will install only the components we need for the introduction config:
OpenTelemetry is configured through YAML files. These files have default configurations that we can modify to meet our needs. Let’s look at the default configuration that is supplied:
Congratulations! You have successfully downloaded and installed the OpenTelemetry Collector. You are well on your way to becoming an OTel Ninja. But first let’s walk through configuration files and different distributions of the OpenTelemetry Collector.
Note
Splunk does provide its own, fully supported, distribution of the OpenTelemetry Collector. This distribution is available to install from the Splunk GitHub Repository or via a wizard in Splunk Observability Cloud that will build out a simple installation script to copy and paste. This distribution includes many additional features and enhancements that are not available in the OpenTelemetry Collector Contrib distribution.
The Splunk Distribution of the OpenTelemetry Collector is production-tested; it is in use by the majority of customers in their production environments.
Customers that use our distribution can receive direct help from official Splunk support within SLAs.
Customers can use or migrate to the Splunk Distribution of the OpenTelemetry Collector without worrying about future breaking changes to its core configuration experience for metrics and traces collection (OpenTelemetry logs collection configuration is in beta). There may be breaking changes to the Collector’s metrics.
We will now walk through each section of the configuration file and modify it to send host metrics to Splunk Observability Cloud.
OpenTelemetry Collector Extensions
Now that we have the OpenTelemetry Collector installed, let’s take a look at extensions for the OpenTelemetry Collector. Extensions are optional and available primarily for tasks that do not involve processing telemetry data. Examples of extensions include health monitoring, service discovery, and data forwarding.
Extensions are configured in the same config.yaml file that we referenced in the installation step. Let’s edit the config.yaml file and configure the extensions. Note that the pprof and zpages extensions are already configured in the default config.yaml file. For the purpose of this workshop, we will only be updating the health_check extension to expose the port on all network interfaces on which we can access the health of the collector.
This extension enables an HTTP URL that can be probed to check the status of the OpenTelemetry Collector. This extension can be used as a liveness and/or readiness probe on Kubernetes. To learn more about the curl command, check out the curl man page.
Open a new terminal session and SSH into your instance to run the following command:
Performance Profiler extension enables the golang net/http/pprof endpoint. This is typically used by developers to collect performance profiles and investigate issues with the service. We will not be covering this in this workshop.
OpenTelemetry Collector Extensions
zPages
zPages are an in-process alternative to external exporters. When included, they collect and aggregate tracing and metrics information in the background; this data is served on web pages when requested. zPages are an extremely useful diagnostic feature to ensure the collector is running as expected.
ServiceZ gives an overview of the collector services and quick access to the pipelinez, extensionz, and featurez zPages. The page also provides build and runtime information.
PipelineZ provides insights on the running pipelines running in the collector. You can find information on type, if data is mutated, and you can also see information on the receivers, processors and exporters that are used for each pipeline.
For this, we will need to validate that our distribution has the file_storage extension installed. This can be done by running the command otelcol-contrib components which should show results like:
# ... truncated for clarityextensions:- file_storage
This extension provides exporters the ability to queue data to disk in the event that exporter is unable to send data to the configured endpoint.
In order to configure the extension, you will need to update your config to include the information below. First, be sure to create a /tmp/otel-data directory and give it read/write permissions:
extensions:...file_storage:directory:/tmp/otel-datatimeout:10scompaction:directory:/tmp/otel-dataon_start:trueon_rebound:truerebound_needed_threshold_mib:5rebound_trigger_threshold_mib:3# ... truncated for clarityservice:extensions:[health_check, pprof, zpages, file_storage]
Why queue data to disk?
This allows the collector to weather network interruptions (and even collector restarts) to ensure data is sent to the upstream provider.
Considerations for queuing data to disk?
There is a potential that this could impact data throughput performance due to disk performance.
Now that we have reviewed extensions, let’s dive into the data pipeline portion of the workshop. A pipeline defines a path the data follows in the Collector starting from reception, moving to further processing or modification, and finally exiting the Collector via exporters.
The data pipeline in the OpenTelemetry Collector is made up of receivers, processors, and exporters. We will first start with receivers.
OpenTelemetry Collector Receivers
Welcome to the receiver portion of the workshop! This is the starting point of the data pipeline of the OpenTelemetry Collector. Let’s dive in.
A receiver, which can be push or pull based, is how data gets into the Collector. Receivers may support one or more data sources. Generally, a receiver accepts data in a specified format, translates it into the internal format and passes it to processors and exporters defined in the applicable pipelines.
The Host Metrics Receiver generates metrics about the host system scraped from various sources. This is intended to be used when the collector is deployed as an agent which is what we will be doing in this workshop.
Let’s update the /etc/otel-contrib/config.yaml file and configure the hostmetrics receiver. Insert the following YAML under the receivers section, taking care to indent by two spaces.
sudo vi /etc/otelcol-contrib/config.yaml
receivers:hostmetrics:collection_interval:10sscrapers:# CPU utilization metricscpu:# Disk I/O metricsdisk:# File System utilization metricsfilesystem:# Memory utilization metricsmemory:# Network interface I/O metrics & TCP connection metricsnetwork:# CPU load metricsload:# Paging/Swap space utilization and I/O metricspaging:# Process count metricsprocesses:# Per process CPU, Memory and Disk I/O metrics. Disabled by default.# process:
OpenTelemetry Collector Receivers
Prometheus Receiver
You will also notice another receiver called prometheus. Prometheus is an open-source toolkit used by the OpenTelemetry Collector. This receiver is used to scrape metrics from the OpenTelemetry Collector itself. These metrics can then be used to monitor the health of the collector.
Let’s modify the prometheus receiver to clearly show that it is for collecting metrics from the collector itself. By changing the name of the receiver from prometheus to prometheus/internal, it is now much clearer as to what that receiver is doing. Update the configuration file to look like this:
The following screenshot shows an example dashboard of spme of the metrics the Prometheus internal receiver collects from the OpenTelemetry Collector. Here, we can see accepted and sent spans, metrics and log records.
Note
The following screenshot is an out-of-the-box (OOTB) dashboard from Splunk Observability Cloud that allows you to easily monitor your Splunk OpenTelemetry Collector install base.
OpenTelemetry Collector Receivers
Other Receivers
You will notice in the default configuration there are other receivers: otlp, opencensus, jaeger and zipkin. These are used to receive telemetry data from other sources. We will not be covering these receivers in this workshop and they can be left as they are.
To help observe short lived tasks like docker containers, kubernetes pods, or ssh sessions, we can use the receiver creator with observer extensions to create a new receiver as these services start up.
What do we need?
In order to start using the receiver creator and its associated observer extensions, they will need to be part of your collector build manifest.
Some short lived tasks may require additional configuration such as username, and password.
These values can be referenced via environment variables,
or use a scheme expand syntax such as ${file:./path/to/database/password}.
Please adhere to your organisation’s secret practices when taking this route.
The Ninja Zone
There are only two things needed for this ninja zone:
Make sure you have added receiver creater and observer extensions to the builder manifest.
Create the config that can be used to match against discovered endpoints.
To create the templated configurations, you can do the following:
receiver_creator:watch_observers:[host_observer]receivers:redis:rule:type == "port" && port == 6379config:password:${env:HOST_REDIS_PASSWORD}
extensions:health_check:endpoint:0.0.0.0:13133pprof:endpoint:0.0.0.0:1777zpages:endpoint:0.0.0.0:55679receivers:hostmetrics:collection_interval:10sscrapers:# CPU utilization metricscpu:# Disk I/O metricsdisk:# File System utilization metricsfilesystem:# Memory utilization metricsmemory:# Network interface I/O metrics & TCP connection metricsnetwork:# CPU load metricsload:# Paging/Swap space utilization and I/O metricspaging:# Process count metricsprocesses:# Per process CPU, Memory and Disk I/O metrics. Disabled by default.# process:otlp:protocols:grpc:http:opencensus:# Collect own metricsprometheus/internal:config:scrape_configs:- job_name:'otel-collector'scrape_interval:10sstatic_configs:- targets:['0.0.0.0:8888']jaeger:protocols:grpc:thrift_binary:thrift_compact:thrift_http:zipkin:processors:batch:exporters:logging:verbosity:detailedservice:pipelines:traces:receivers:[otlp, opencensus, jaeger, zipkin]processors:[batch]exporters:[logging]metrics:receivers:[otlp, opencensus, prometheus/internal]processors:[batch]exporters:[logging]extensions:[health_check, pprof, zpages]
Now that we have reviewed how data gets into the OpenTelemetry Collector through receivers, let’s now take a look at how the Collector processes the received data.
Warning
As the /etc/otelcol-contrib/config.yaml is not complete, please do not attempt to restart the collector at this point.
OpenTelemetry Collector Processors
Processors are run on data between being received and being exported. Processors are optional though some are recommended. There are a large number of processors included in the OpenTelemetry contrib Collector.
By default, only the batch processor is enabled. This processor is used to batch up data before it is exported. This is useful for reducing the number of network calls made to exporters. For this workshop, we will inherit the following defaults which are hard-coded into the Collector:
send_batch_size (default = 8192): Number of spans, metric data points, or log records after which a batch will be sent regardless of the timeout. send_batch_size acts as a trigger and does not affect the size of the batch. If you need to enforce batch size limits sent to the next component in the pipeline see send_batch_max_size.
timeout (default = 200ms): Time duration after which a batch will be sent regardless of size. If set to zero, send_batch_size is ignored as data will be sent immediately, subject to only send_batch_max_size.
send_batch_max_size (default = 0): The upper limit of the batch size. 0 means no upper limit on the batch size. This property ensures that larger batches are split into smaller units. It must be greater than or equal to send_batch_size.
The resourcedetection processor can be used to detect resource information from the host and append or override the resource value in telemetry data with this information.
By default, the hostname is set to the FQDN if possible, otherwise, the hostname provided by the OS is used as a fallback. This logic can be changed from using using the hostname_sources configuration option. To avoid getting the FQDN and use the hostname provided by the OS, we will set the hostname_sources to os.
If the workshop instance is running on an AWS/EC2 instance we can gather the following tags from the EC2 metadata API (this is not available on other platforms).
cloud.provider ("aws")
cloud.platform ("aws_ec2")
cloud.account.id
cloud.region
cloud.availability_zone
host.id
host.image.id
host.name
host.type
We will create another processor to append these tags to our metrics.
The attributes processor modifies attributes of a span, log, or metric. This processor also supports the ability to filter and match input data to determine if they should be included or excluded for specified actions.
It takes a list of actions that are performed in the order specified in the config. The supported actions are:
insert: Inserts a new attribute in input data where the key does not already exist.
update: Updates an attribute in input data where the key does exist.
upsert: Performs insert or update. Inserts a new attribute in input data where the key does not already exist and updates an attribute in input data where the key does exist.
delete: Deletes an attribute from the input data.
hash: Hashes (SHA1) an existing attribute value.
extract: Extracts values using a regular expression rule from the input key to target keys specified in the rule. If a target key already exists, it will be overridden.
We are going to create an attributes processor to insert a new attribute to all our host metrics called participant.name with a value of your name e.g. marge_simpson.
Warning
Ensure you replace INSERT_YOUR_NAME_HERE with your name and also ensure you do not use spaces in your name.
Later on in the workshop, we will use this attribute to filter our metrics in Splunk Observability Cloud.
One of the most recent additions to the collector was the notion of a connector, which allows you to join the output of one pipeline to the input of another pipeline.
An example of how this is beneficial is that some services emit metrics based on the amount of datapoints being exported, the number of logs containing an error status,
or the amount of data being sent from one deployment environment. The count connector helps address this for you out of the box.
Why a connector instead of a processor?
A processor is limited in what additional data it can produce considering it has to pass on the data it has processed making it hard to expose additional information. Connectors do not have to emit the data they receive which means they provide an opportunity to create the insights we are after.
For example, a connector could be made to count the number of logs, metrics, and traces that do not have the deployment environment attribute.
A very simple example with the output of being able to break down data usage by deployment environment.
Considerations with connectors
A connector only accepts data exported from one pipeline and receiver by another pipeline, this means you may have to consider how you construct your collector config to take advantage of it.
extensions:health_check:endpoint:0.0.0.0:13133pprof:endpoint:0.0.0.0:1777zpages:endpoint:0.0.0.0:55679receivers:hostmetrics:collection_interval:10sscrapers:# CPU utilization metricscpu:# Disk I/O metricsdisk:# File System utilization metricsfilesystem:# Memory utilization metricsmemory:# Network interface I/O metrics & TCP connection metricsnetwork:# CPU load metricsload:# Paging/Swap space utilization and I/O metricspaging:# Process count metricsprocesses:# Per process CPU, Memory and Disk I/O metrics. Disabled by default.# process:otlp:protocols:grpc:http:opencensus:# Collect own metricsprometheus/internal:config:scrape_configs:- job_name:'otel-collector'scrape_interval:10sstatic_configs:- targets:['0.0.0.0:8888']jaeger:protocols:grpc:thrift_binary:thrift_compact:thrift_http:zipkin:processors:batch:resourcedetection/system:detectors:[system]system:hostname_sources:[os]resourcedetection/ec2:detectors:[ec2]attributes/conf:actions:- key:participant.nameaction:insertvalue:"INSERT_YOUR_NAME_HERE"exporters:logging:verbosity:detailedservice:pipelines:traces:receivers:[otlp, opencensus, jaeger, zipkin]processors:[batch]exporters:[logging]metrics:receivers:[otlp, opencensus, prometheus]processors:[batch]exporters:[logging]extensions:[health_check, pprof, zpages]
OpenTelemetry Collector Exporters
An exporter, which can be push or pull-based, is how you send data to one or more backends/destinations. Exporters may support one or more data sources.
For this workshop, we will be using the otlphttp exporter. The OpenTelemetry Protocol (OTLP) is a vendor-neutral, standardised protocol for transmitting telemetry data. The OTLP exporter sends data to a server that implements the OTLP protocol. The OTLP exporter supports both gRPC and HTTP/JSON protocols.
To send metrics over HTTP to Splunk Observability Cloud, we will need to configure the otlphttp exporter.
Let’s edit our /etc/otelcol-contrib/config.yaml file and configure the otlphttp exporter. Insert the following YAML under the exporters section, taking care to indent by two spaces e.g.
We will also change the verbosity of the logging exporter to prevent the disk from filling up. The default of detailed is very noisy.
Next, we need to define the metrics_endpoint and configure the target URL.
Note
If you are an attendee at a Splunk-hosted workshop, the instance you are using has already been configured with a Realm environment variable. We will reference that environment variable in our configuration file. Otherwise, you will need to create a new environment variable and set the Realm e.g.
exportREALM="us1"
The URL to use is https://ingest.${env:REALM}.signalfx.com/v2/datapoint/otlp. (Splunk has Realms in key geographical locations around the world for data residency).
The otlphttp exporter can also be configured to send traces and logs by defining a target URL for traces_endpoint and logs_endpoint respectively. Configuring these is outside the scope of this workshop.
By default, gzip compression is enabled for all endpoints. This can be disabled by setting compression: none in the exporter configuration. We will leave compression enabled for this workshop and accept the default as this is the most efficient way to send data.
To send metrics to Splunk Observability Cloud, we need to use an Access Token. This can be done by creating a new token in the Splunk Observability Cloud UI. For more information on how to create a token, see Create a token. The token needs to be of type INGEST.
Note
If you are an attendee at a Splunk-hosted workshop, the instance you are using has already been configured with an Access Token (which has been set as an environment variable). We will reference that environment variable in our configuration file. Otherwise, you will need to create a new token and set it as an environment variable e.g.
exportACCESS_TOKEN=<replace-with-your-token>
The token is defined in the configuration file by inserting X-SF-TOKEN: ${env:ACCESS_TOKEN} under a headers: section:
extensions:health_check:endpoint:0.0.0.0:13133pprof:endpoint:0.0.0.0:1777zpages:endpoint:0.0.0.0:55679receivers:hostmetrics:collection_interval:10sscrapers:# CPU utilization metricscpu:# Disk I/O metricsdisk:# File System utilization metricsfilesystem:# Memory utilization metricsmemory:# Network interface I/O metrics & TCP connection metricsnetwork:# CPU load metricsload:# Paging/Swap space utilization and I/O metricspaging:# Process count metricsprocesses:# Per process CPU, Memory and Disk I/O metrics. Disabled by default.# process:otlp:protocols:grpc:http:opencensus:# Collect own metricsprometheus/internal:config:scrape_configs:- job_name:'otel-collector'scrape_interval:10sstatic_configs:- targets:['0.0.0.0:8888']jaeger:protocols:grpc:thrift_binary:thrift_compact:thrift_http:zipkin:processors:batch:resourcedetection/system:detectors:[system]system:hostname_sources:[os]resourcedetection/ec2:detectors:[ec2]attributes/conf:actions:- key:participant.nameaction:insertvalue:"INSERT_YOUR_NAME_HERE"exporters:logging:verbosity:normalotlphttp/splunk:metrics_endpoint:https://ingest.${env:REALM}.signalfx.com/v2/datapoint/otlpheaders:X-SF-TOKEN:${env:ACCESS_TOKEN}service:pipelines:traces:receivers:[otlp, opencensus, jaeger, zipkin]processors:[batch]exporters:[logging]metrics:receivers:[otlp, opencensus, prometheus]processors:[batch]exporters:[logging]extensions:[health_check, pprof, zpages]
Of course, you can easily configure the metrics_endpoint to point to any other solution that supports the OTLP protocol.
Next, we need to enable the receivers, processors and exporters we have just configured in the service section of the config.yaml.
OpenTelemetry Collector Service
The Service section is used to configure what components are enabled in the Collector based on the configuration found in the receivers, processors, exporters, and extensions sections.
Info
If a component is configured, but not defined within the Service section then it is not enabled.
The service section consists of three sub-sections:
extensions
pipelines
telemetry
In the default configuration, the extension section has been configured to enable health_check, pprof and zpages, which we configured in the Extensions module earlier.
service:extensions:[health_check, pprof, zpages]
So lets configure our Metric Pipeline!
Subsections of OpenTelemetry Collector Service
OpenTelemetry Collector Service
Hostmetrics Receiver
If you recall from the Receivers portion of the workshop, we defined the Host Metrics Receiver to generate metrics about the host system, which are scraped from various sources. To enable the receiver, we must include the hostmetrics receiver in the metrics pipeline.
In the metrics pipeline, add hostmetrics to the metrics receivers section.
Earlier in the workshop, we also renamed the prometheus receiver to reflect that is was collecting metrics internal to the collector, renaming it to prometheus/internal.
We now need to enable the prometheus/internal receiver under the metrics pipeline. Update the receivers section to include prometheus/internal under the metrics pipeline:
We also added resourcedetection/system and resourcedetection/ec2 processors so that the collector can capture the instance hostname and AWS/EC2 metadata. We now need to enable these two processors under the metrics pipeline.
Update the processors section to include resourcedetection/system and resourcedetection/ec2 under the metrics pipeline:
Also in the Processors section of this workshop, we added the attributes/conf processor so that the collector will insert a new attribute called participant.name to all the metrics. We now need to enable this under the metrics pipeline.
Update the processors section to include attributes/conf under the metrics pipeline:
In the Exporters section of the workshop, we configured the otlphttp exporter to send metrics to Splunk Observability Cloud. We now need to enable this under the metrics pipeline.
Update the exporters section to include otlphttp/splunk under the metrics pipeline:
The collector captures internal signals about its behavior this also includes additional signals from running components.
The reason for this is that components that make decisions about the flow of data need a way to surface that information
as metrics or traces.
Why monitor the collector?
This is somewhat of a chicken and egg problem of, “Who is watching the watcher?”, but it is important that we can surface this information. Another interesting part of the collector’s history is that it existed before the Go metrics’ SDK was considered stable so the collector exposes a Prometheus endpoint to provide this functionality for the time being.
Considerations
Monitoring the internal usage of each running collector in your organization can contribute a significant amount of new Metric Time Series (MTS). The Splunk distribution has curated these metrics for you and would be able to help forecast the expected increases.
The Ninja Zone
To expose the internal observability of the collector, some additional settings can be adjusted:
service:telemetry:logs:level:<info|warn|error>development:<true|false>encoding:<console|json>disable_caller:<true|false>disable_stacktrace:<true|false>output_paths:[<stdout|stderr>, paths...]error_output_paths:[<stdout|stderr>, paths...]initial_fields:key:valuemetrics:level:<none|basic|normal|detailed># Address binds the promethues endpoint to scrapeaddress:<hostname:port>
extensions:health_check:endpoint:0.0.0.0:13133pprof:endpoint:0.0.0.0:1777zpages:endpoint:0.0.0.0:55679receivers:hostmetrics:collection_interval:10sscrapers:# CPU utilization metricscpu:# Disk I/O metricsdisk:# File System utilization metricsfilesystem:# Memory utilization metricsmemory:# Network interface I/O metrics & TCP connection metricsnetwork:# CPU load metricsload:# Paging/Swap space utilization and I/O metricspaging:# Process count metricsprocesses:# Per process CPU, Memory and Disk I/O metrics. Disabled by default.# process:otlp:protocols:grpc:http:opencensus:# Collect own metricsprometheus/internal:config:scrape_configs:- job_name:'otel-collector'scrape_interval:10sstatic_configs:- targets:['0.0.0.0:8888']jaeger:protocols:grpc:thrift_binary:thrift_compact:thrift_http:zipkin:processors:batch:resourcedetection/system:detectors:[system]system:hostname_sources:[os]resourcedetection/ec2:detectors:[ec2]attributes/conf:actions:- key:participant.nameaction:insertvalue:"INSERT_YOUR_NAME_HERE"exporters:logging:verbosity:normalotlphttp/splunk:metrics_endpoint:https://ingest.${env:REALM}.signalfx.com/v2/datapoint/otlpheaders:X-SF-TOKEN:${env:ACCESS_TOKEN}service:pipelines:traces:receivers:[otlp, opencensus, jaeger, zipkin]processors:[batch]exporters:[logging]metrics:receivers:[hostmetrics, otlp, opencensus, prometheus/internal]processors:[batch, resourcedetection/system, resourcedetection/ec2, attributes/conf] exporters:[logging, otlphttp/splunk]extensions:[health_check, pprof, zpages]
Tip
It is recommended that you validate your configuration file before restarting the collector. You can do this by using the built-in validate command:
Now that we have configured the OpenTelemetry Collector to send metrics to Splunk Observability Cloud, let’s take a look at the data in Splunk Observability Cloud. If you have not received an invite to Splunk Observability Cloud, your instructor will provide you with login credentials.
Before that, let’s make things a little more interesting and run a stress test on the instance. This in turn will light up the dashboards.
Once you are logged into Splunk Observability Cloud, using the left-hand navigation, navigate to Dashboards from the main menu. This will take you to the Teams view. At the top of this view click on All Dashboards :
In the search box, search for OTel Contrib:
Info
If the dashboard does not exist, then your instructor will be able to quickly add it. If you are not attending a Splunk hosted version of this workshop then the Dashboard Group to import can be found at the bottom of this page.
Click on the OTel Contrib Dashboard dashboard to open it:
Click in the Participant Name box, at the top of the dashboard, and select the name you configured for participant.name in the config.yaml in the drop-down list or start typing the name to search for it:
You can now see the host metrics for the host upon which you configured the OpenTelemetry Collector.
Building a component for the Open Telemetry Collector requires three key parts:
The Configuration - What values are exposed to the user to configure
The Factory - Make the component using the provided values
The Business Logic - What the component needs to do
For this, we will use the example of building a component that works with Jenkins so that we can track important DevOps metrics of our project(s).
The metrics we are looking to measure are:
Lead time for changes - “How long it takes for a commit to get into production”
Change failure rate - “The percentage of deployments causing a failure in production”
Deployment frequency - “How often a [team] successfully releases to production”
Mean time to recover - “How long does it take for a [team] to recover from a failure in production”
These indicators were identified Google’s DevOps Research and Assesment (DORA)[^1] team to help
show performance of a software development team. The reason for choosing Jenkins CI is that we remain in the same Open Source Software ecosystem which we can serve as the example for the vendor managed CI tools to adopt in future.
Instrument Vs Component
There is something to consider when improving level of Observability within your organisation
since there are some trade offs that get made.
Pros
Cons
(Auto) Instrumented
Does not require an external API to be monitored in order to observe the system.
Changing instrumentation requires changes to the project.
Gives system owners/developers to make changes in their observability.
Requires additional runtime dependancies.
Understands system context and can corrolate captured data with Exemplars.
Can impact performance of the system.
Component
- Changes to data names or semantics can be rolled out independently of the system’s release cycle.
Breaking API changes require a coordinated release between system and collector.
Updating/extending data collected is a seemless user facing change.
Captured data semantics can unexpectedly break that does not align with a new system release.
Does not require the supporting teams to have a deep understanding of observability practice.
Strictly external / exposed information can be surfaced from the system.
Subsections of OpenTelemetry Collector Development
OpenTelemetry Collector Development
Project Setup Ninja
Note
The time to finish this section of the workshop can vary depending on experience.
A complete solution can be found here in case you’re stuck or want to follow
along with the instructor.
To get started developing the new Jenkins CI receiver, we first need to set up a Golang project.
The steps to create your new Golang project is:
Create a new directory named ${HOME}/go/src/jenkinscireceiver and change into it
The actual directory name or location is not strict, you can choose your own development directory to make it in.
Initialize the golang module by going go mod init splunk.conf/workshop/example/jenkinscireceiver
This will create a file named go.mod which is used to track our direct and indirect dependencies
Eventually, there will be a go.sum which is the checksum value of the dependencies being imported.
module splunk.conf/workshop/example/jenkinscireceiver

go 1.20
OpenTelemetry Collector Development
Building The Configuration
The configuration portion of the component is how the user is able to have their inputs over the component,
so the values that is used for the configuration need to be:
Intuitive for users to understand what that field controls
Be explicit in what is required and what is optional
The bad configuration highlights how doing the opposite of the recommendations of configuration practices impacts the usability
of the component. It doesn’t make it clear what field values should be, it includes features that can be pushed to existing processors,
and the field naming is not consistent with other components that exist in the collector.
The good configuration keeps the required values simple, reuses field names from other components, and ensures the component focuses on
just the interaction between Jenkins and the collector.
The code tab shows how much is required to be added by us and what is already provided for us by shared libraries within the collector.
These will be explained in more detail once we get to the business logic. The configuration should start off small and will change
once the business logic has started to include additional features that is needed.
Write the code
In order to implement the code needed for the configuration, we are going to create a new file named config.go with the following content:
packagejenkinscireceiverimport("go.opentelemetry.io/collector/config/confighttp""go.opentelemetry.io/collector/receiver/scraperhelper""splunk.conf/workshop/example/jenkinscireceiver/internal/metadata")typeConfigstruct{// HTTPClientSettings contains all the values
// that are commonly shared across all HTTP interactions
// performed by the collector.
confighttp.HTTPClientSettings`mapstructure:",squash"`// ScraperControllerSettings will allow us to schedule
// how often to check for updates to builds.
scraperhelper.ScraperControllerSettings`mapstructure:",squash"`// MetricsBuilderConfig contains all the metrics
// that can be configured.
metadata.MetricsBuilderConfig`mapstructure:",squash"`}
OpenTelemetry Collector Development
Component Review
To recap the type of component we will need to capture metrics from Jenkins:
The business use case an extension helps solves for are:
Having shared functionality that requires runtime configuration
Indirectly helps with observing the runtime of the collector
This is commonly referred to pull vs push based data collection, and you read more about the details in the Receiver Overview.
The business use case a processor solves for is:
Adding or removing data, fields, or values
Observing and making decisions on the data
Buffering, queueing, and reordering
The thing to keep in mind is the data type flowing through a processor needs to forward
the same data type to its downstream components. Read through Processor Overview for the details.
The business use case an exporter solves for:
Send the data to a tool, service, or storage
The OpenTelemetry collector does not want to be “backend”, an all-in-one observability suite, but rather
keep to the principles that founded OpenTelemetry to begin with; A vendor agnostic Observability for all.
To help revisit the details, please read through Exporter Overview.
This is a component type that was missed in the workshop since it is a relatively new addition to the collector, but the best way to think about a connector is that it is like a processor that allows it to be used across different telemetry types and pipelines. Meaning that a connector can accept data as logs, and output metrics, or accept metrics from one pipeline and provide metrics on the data it has observed.
The business case that a connector solves for:
Converting from different telemetry types
logs to metrics
traces to metrics
metrics to logs
Observing incoming data and producing its own data
Accepting metrics and generating analytical metrics of the data.
There was a brief overview within the Ninja section as part of the Processor Overview,
and be sure what the project for updates for new connector components.
From the component overviews, it is clear that developing a pull-based receiver for Jenkins.
OpenTelemetry Collector Development
Designing The Metrics
To help define and export the metrics captured by our receiver, we will be using, mdatagen, a tool developed for the collector that turns YAML defined metrics into code.
---# Type defines the name to reference the component# in the configuration filetype:jenkins# Status defines the component type and the stability levelstatus:class:receiverstability:development:[metrics]# Attributes are the expected fields reported# with the exported values.attributes:job.name:description:The name of the associated Jenkins jobtype:stringjob.status:description:Shows if the job had passed, or failedtype:stringenum:- failed- success- unknown# Metrics defines all the pontentially exported values from this receiver. metrics:jenkins.jobs.count:enabled:truedescription:Provides a count of the total number of configured jobsunit:"{Count}"gauge:value_type:intjenkins.job.duration:enabled:truedescription:Show the duration of the jobunit:"s"gauge:value_type:intattributes:- job.name- job.statusjenkins.job.commit_delta:enabled:truedescription:The calculation difference of the time job was finished minus commit timestampunit:"s"gauge:value_type:intattributes:- job.name- job.status
// To generate the additional code needed to capture metrics,
// the following command to be run from the shell:
// go generate -x ./...
//go:generate go run github.com/open-telemetry/opentelemetry-collector-contrib/cmd/mdatagen@v0.80.0 metadata.yaml
packagejenkinscireceiver// There is no code defined within this file.
Create these files within the project folder before continuing onto the next section.
Building The Factory
The Factory is a software design pattern that effectively allows for an object, in this case a jenkinscireceiver, to be created dynamically with the provided configuration. To use a more real-world example, it would be going to a phone store, asking for a phone
that matches your exact description, and then providing it to you.
Run the following command go generate -x ./... , it will create a new folder, jenkinscireceiver/internal/metadata, that contains all code required to export the defined metrics. The required code is:
packagejenkinscireceiverimport("errors""go.opentelemetry.io/collector/component""go.opentelemetry.io/collector/config/confighttp""go.opentelemetry.io/collector/receiver""go.opentelemetry.io/collector/receiver/scraperhelper""splunk.conf/workshop/example/jenkinscireceiver/internal/metadata")funcNewFactory()receiver.Factory{returnreceiver.NewFactory(metadata.Type,newDefaultConfig,receiver.WithMetrics(newMetricsReceiver,metadata.MetricsStability),)}funcnewMetricsReceiver(_context.Context,setreceiver.CreateSettings,cfgcomponent.Config,consumerconsumer.Metrics)(receiver.Metrics,error){// Convert the configuration into the expected type
conf,ok:=cfg.(*Config)if!ok{returnnil,errors.New("can not convert config")}sc,err:=newScraper(conf,set)iferr!=nil{returnnil,err}returnscraperhelper.NewScraperControllerReceiver(&conf.ScraperControllerSettings,set,consumer,scraperhelper.AddScraper(sc),)}
packagejenkinscireceiverimport("go.opentelemetry.io/collector/config/confighttp""go.opentelemetry.io/collector/receiver/scraperhelper""splunk.conf/workshop/example/jenkinscireceiver/internal/metadata")typeConfigstruct{// HTTPClientSettings contains all the values
// that are commonly shared across all HTTP interactions
// performed by the collector.
confighttp.HTTPClientSettings`mapstructure:",squash"`// ScraperControllerSettings will allow us to schedule
// how often to check for updates to builds.
scraperhelper.ScraperControllerSettings`mapstructure:",squash"`// MetricsBuilderConfig contains all the metrics
// that can be configured.
metadata.MetricsBuilderConfig`mapstructure:",squash"`}funcnewDefaultConfig()component.Config{return&Config{ScraperControllerSettings:scraperhelper.NewDefaultScraperControllerSettings(metadata.Type),HTTPClientSettings:confighttp.NewDefaultHTTPClientSettings(),MetricsBuilderConfig:metadata.DefaultMetricsBuilderConfig(),}}
packagejenkinscireceivertypescraperstruct{}funcnewScraper(cfg*Config,setreceiver.CreateSettings)(scraperhelper.Scraper,error){// Create a our scraper with our values
s:=scraper{// To be filled in later
}returnscraperhelper.NewScraper(metadata.Type,s.scrape)}func(scraper)scrape(ctxcontext.Context)(pmetric.Metrics,error){// To be filled in
returnpmetrics.NewMetrics(),nil}
---dist:name:otelcoldescription:"Conf workshop collector"output_path:./distversion:v0.0.0-experimentalextensions:- gomod:github.com/open-telemetry/opentelemetry-collector-contrib/extension/basicauthextension v0.80.0- gomod:github.com/open-telemetry/opentelemetry-collector-contrib/extension/healthcheckextension v0.80.0receivers:- gomod:go.opentelemetry.io/collector/receiver/otlpreceiver v0.80.0- gomod:github.com/open-telemetry/opentelemetry-collector-contrib/receiver/jaegerreceiver v0.80.0- gomod:github.com/open-telemetry/opentelemetry-collector-contrib/receiver/prometheusreceiver v0.80.0- gomod:splunk.conf/workshop/example/jenkinscireceiver v0.0.0path:./jenkinscireceiverprocessors:- gomod:go.opentelemetry.io/collector/processor/batchprocessor v0.80.0exporters:- gomod:go.opentelemetry.io/collector/exporter/loggingexporter v0.80.0- gomod:go.opentelemetry.io/collector/exporter/otlpexporter v0.80.0- gomod:go.opentelemetry.io/collector/exporter/otlphttpexporter v0.80.0# This replace is a go directive that allows for redefine# where to fetch the code to use since the default would be from a remote project.replaces:- splunk.conf/workshop/example/jenkinscireceiver => ./jenkinscireceiver
Once you have written these files into the project with the expected contents run, go mod tidy, which will fetch all the remote dependencies and update go.mod and generate the go.sum files.
OpenTelemetry Collector Development
Building The Business Logic
At this point, we have a custom component that currently does nothing so we need to add in the required
logic to capture this data from Jenkins.
From this point, the steps that we need to take are:
Create a client that connect to Jenkins
Capture all the configured jobs
Report the status of the last build for the configured job
Calculate the time difference between commit timestamp and job completion.
The changes will be made to scraper.go.
To be able to connect to the Jenkins server, we will be using the package,
“github.com/yosida95/golang-jenkins”,
which provides the functionality required to read data from the jenkins server.
Then we are going to utilise some of the helper functions from the,
“go.opentelemetry.io/collector/receiver/scraperhelper” ,
library to create a start function so that we can connect to the Jenkins server once component has finished starting.
packagejenkinscireceiverimport("context"jenkins"github.com/yosida95/golang-jenkins""go.opentelemetry.io/collector/component""go.opentelemetry.io/collector/pdata/pmetric""go.opentelemetry.io/collector/receiver""go.opentelemetry.io/collector/receiver/scraperhelper""splunk.conf/workshop/example/jenkinscireceiver/internal/metadata")typescraperstruct{mb*metadata.MetricsBuilderclient*jenkins.Jenkins}funcnewScraper(cfg*Config,setreceiver.CreateSettings)(scraperhelper.Scraper,error){s:=&scraper{mb:metadata.NewMetricsBuilder(cfg.MetricsBuilderConfig,set),}returnscraperhelper.NewScraper(metadata.Type,s.scrape,scraperhelper.WithStart(func(ctxcontext.Context,hcomponent.Host)error{client,err:=cfg.ToClient(h,set.TelemetrySettings)iferr!=nil{returnerr}// The collector provides a means of injecting authentication
// on our behalf, so this will ignore the libraries approach
// and use the configured http client with authentication.
s.client=jenkins.NewJenkins(nil,cfg.Endpoint)s.client.SetHTTPClient(client)returnnil}),)}func(sscraper)scrape(ctxcontext.Context)(pmetric.Metrics,error){// To be filled in
returnpmetric.NewMetrics(),nil}
This finishes all the setup code that is required in order to initialise a Jenkins receiver.
From this point on, we will be focuses on the scrape method that has been waiting to be filled in.
This method will be run on each interval that is configured within the configuration (by default, every minute).
The reason we want to capture the number of jobs configured so we can see the growth of our Jenkins server,
and measure of many projects have onboarded. To do this we will call the jenkins client to list all jobs,
and if it reports an error, return that with no metrics, otherwise, emit the data from the metric builder.
func(sscraper)scrape(ctxcontext.Context)(pmetric.Metrics,error){jobs,err:=s.client.GetJobs()iferr!=nil{returnpmetric.Metrics{},err}// Recording the timestamp to ensure
// all captured data points within this scrape have the same value.
now:=pcommon.NewTimestampFromTime(time.Now())// Casting to an int64 to match the expected type
s.mb.RecordJenkinsJobsCountDataPoint(now,int64(len(jobs)))// To be filled in
returns.mb.Emit(),nil}
In the last step, we were able to capture all jobs ands report the number of jobs
there was. Within this step, we are going to examine each job and use the report values
to capture metrics.
func(sscraper)scrape(ctxcontext.Context)(pmetric.Metrics,error){jobs,err:=s.client.GetJobs()iferr!=nil{returnpmetric.Metrics{},err}// Recording the timestamp to ensure
// all captured data points within this scrape have the same value.
now:=pcommon.NewTimestampFromTime(time.Now())// Casting to an int64 to match the expected type
s.mb.RecordJenkinsJobsCountDataPoint(now,int64(len(jobs)))for_,job:=rangejobs{// Ensure we have valid results to start off with
var(build=job.LastCompletedBuildstatus=metadata.AttributeJobStatusUnknown)// This will check the result of the job, however,
// since the only defined attributes are
// `success`, `failure`, and `unknown`.
// it is assume that anything did not finish
// with a success or failure to be an unknown status.
switchbuild.Result{case"aborted","not_built","unstable":status=metadata.AttributeJobStatusUnknowncase"success":status=metadata.AttributeJobStatusSuccesscase"failure":status=metadata.AttributeJobStatusFailed}s.mb.RecordJenkinsJobDurationDataPoint(now,int64(job.LastCompletedBuild.Duration),job.Name,status,)}returns.mb.Emit(),nil}
The final step is to calculate how long it took from
commit to job completion to help infer our DORA metrics.
func(sscraper)scrape(ctxcontext.Context)(pmetric.Metrics,error){jobs,err:=s.client.GetJobs()iferr!=nil{returnpmetric.Metrics{},err}// Recording the timestamp to ensure
// all captured data points within this scrape have the same value.
now:=pcommon.NewTimestampFromTime(time.Now())// Casting to an int64 to match the expected type
s.mb.RecordJenkinsJobsCountDataPoint(now,int64(len(jobs)))for_,job:=rangejobs{// Ensure we have valid results to start off with
var(build=job.LastCompletedBuildstatus=metadata.AttributeJobStatusUnknown)// Previous step here
// Ensure that the `ChangeSet` has values
// set so there is a valid value for us to reference
iflen(build.ChangeSet.Items)==0{continue}// Making the assumption that the first changeset
// item is the most recent change.
change:=build.ChangeSet.Items[0]// Record the difference from the build time
// compared against the change timestamp.
s.mb.RecordJenkinsJobCommitDeltaDataPoint(now,int64(build.Timestamp-change.Timestamp),job.Name,status,)}returns.mb.Emit(),nil}
Once all of these steps have been completed, you now have built a custom Jenkins CI receiver!
Whats next?
There are more than likely features that would be desired from component that you can think of, like:
Can I include the branch name that the job used?
Can I include the project name for the job?
How I calculate the collective job durations for project?
How do I validate the changes work?
Please take this time to play around, break it, change things around, or even try to capture logs from the builds.
Splunk Synthetic Scripting
45 minutesAuthor
Robert Castley
Proactively monitor the performance of your web app before problems affect your users. With Splunk Synthetic Monitoring, technical and business teams create detailed tests to proactively monitor the speed and reliability of websites, web apps, and resources over time, at any stage in the development cycle.
Splunk Synthetic Monitoring offers the most comprehensive and in-depth capabilities for uptime and web performance optimization as part of the only complete observability suite, Splunk Observability Cloud.
Easily set up monitoring for APIs, service endpoints and end-user experience. With Splunk Synthetic Monitoring, go beyond basic uptime and performance monitoring and focus on proactively finding and fixing issues, optimizing web performance, and ensuring customers get the best user experience.
With Splunk Synthetic Monitoring you can:
Detect and resolve issues fast across critical user flows, business transactions and API endpoints
Prevent web performance issues from affecting customers with an intelligent web optimization engine
And improve the performance of all page resources and third-party dependencies
Subsections of Splunk Synthetic Scripting
1. Real Browser Test
Introduction
This workshop walks you through using the Chrome DevTools Recorder to create a synthetic transaction against a Splunk demonstration instance.
The exported JSON from the Chrome DevTools Recorder will then be used to create a Splunk Synthetic Monitoring Real Browser Test.
In addition, you will also get to learn other Splunk Synthetic Monitoring checks like API Test and Uptime Test.
Pre-requisites
Google Chrome Browser installed
Access to Splunk Observability Cloud
Subsections of 1. Real Browser Test
1.1 Recording a test
Open the starting URL
Open the starting URL for the workshop in Chrome. Click on the appropriate link below to open the site in a new tab.
Note
The starting URL for the workshop is different for EMEA and AMER/APAC. Please use the correct URL for your region.
Next, open the Developer Tools (in the new tab that was opened above) by pressing Ctrl + Shift + I on Windows or Cmd + Option + I on a Mac, then select Recorder from the top-level menu or the More tools flyout menu.
Note
Site elements might change depending on viewport width. Before recording, set your browser window to the correct width for the test you want to create (Desktop, Tablet, or Mobile). Change the DevTools “dock side” to pop out as a separate window if it helps.
Create a new recording
With the Recorder panel open in the DevTools window. Click on the Create a new recording button to start.
For the Recording Name use your initials to prefix the name of the recording e.g. <your initials> - Online Boutique. Click on Start Recording to start recording your actions.
Now that we are recording, complete the following actions on the site:
Click on Vintage Camera Lens
Click on Add to Cart
Click on Place Order
Click on End recording in the Recorder panel.
Exporting the recording
Click on the Export button:
Select JSON as the format, then click on Save
Congratulations! You have successfully created a recording using the Chrome DevTools Recorder. Next, we will use this recording to create a Real Browser Test in Splunk Synthetic Monitoring.
{"title":"RWC - Online Boutique","steps":[{"type":"setViewport","width":1430,"height":1016,"deviceScaleFactor":1,"isMobile":false,"hasTouch":false,"isLandscape":false},{"type":"navigate","url":"https://online-boutique-eu.splunko11y.com/","assertedEvents":[{"type":"navigation","url":"https://online-boutique-eu.splunko11y.com/","title":"Online Boutique"}]},{"type":"click","target":"main","selectors":[["div:nth-of-type(2) > div:nth-of-type(2) a > div"],["xpath//html/body/main/div/div/div[2]/div[2]/div/a/div"],["pierce/div:nth-of-type(2) > div:nth-of-type(2) a > div"]],"offsetY":170,"offsetX":180,"assertedEvents":[{"type":"navigation","url":"https://online-boutique-eu.splunko11y.com/product/66VCHSJNUP","title":""}]},{"type":"click","target":"main","selectors":[["aria/ADD TO CART"],["button"],["xpath//html/body/main/div[1]/div/div[2]/div/form/div/button"],["pierce/button"],["text/Add to Cart"]],"offsetY":35.0078125,"offsetX":46.4140625,"assertedEvents":[{"type":"navigation","url":"https://online-boutique-eu.splunko11y.com/cart","title":""}]},{"type":"click","target":"main","selectors":[["aria/PLACE ORDER"],["div > div > div.py-3 button"],["xpath//html/body/main/div/div/div[4]/div/form/div[4]/button"],["pierce/div > div > div.py-3 button"],["text/Place order"]],"offsetY":29.8125,"offsetX":66.8203125,"assertedEvents":[{"type":"navigation","url":"https://online-boutique-eu.splunko11y.com/cart/checkout","title":""}]}]}
1.2 Create Real Browser Test
In Splunk Observability Cloud, navigate to Synthetics and click on Add new test.
From the dropdown select Browser test.
You will then be presented with the Browser test content configuration page.
1.3 Import JSON
To begin configuring our test, we need to import the JSON that we exported from the Chrome DevTools Recorder. To enable the Import button, we must first give our test a name e.g. <your initials> - Online Boutique.
Once the Import button is enabled, click on it and either drop the JSON file that you exported from the Chrome DevTools Recorder or upload the file.
Once the JSON file has been uploaded, click on Continue to edit steps
Before we make any edits to the test, let’s first configure the settings, click on < Return to test
1.4 Settings
The simple settings allow you to configure the basics of the test:
Name: The name of the test (e.g. RWC - Online Boutique).
Details:
Locations: The locations where the test will run from.
Device: Emulate different devices and connection speeds. Also, the viewport will be adjusted to match the chosen device.
Frequency: How often the test will run.
Round-robin: If multiple locations are selected, the test will run from one location at a time, rather than all locations at once.
Active: Set the test to active or inactive.
![Return to Test]For this workshop, we will configure the locations that we wish to monitor from. Click in the Locations field and you will be presented with a list of global locations (over 50 in total).
Select the following locations:
AWS - N. Virginia
AWS - London
AWS - Melbourne
Once complete, scroll down and click on Click on Submit to save the test.
The test will now be scheduled to run every 5 minutes from the 3 locations that we have selected. This does take a few minutes for the schedule to be created.
So whilst we wait for the test to be scheduled, click on Edit test so we can go through the Advanced settings.
1.5 Advanced Settings
Click on Advanced, these settings are optional and can be used to further configure the test.
Note
In the case of this workshop, we will not be using any of these settings as this is for informational purposes only.
Security:
TLS/SSL validation: When activated, this feature is used to enforce the validation of expired, invalid hostname, or untrusted issuer on SSL/TLS certificates.
Authentication: Add credentials to authenticate with sites that require additional security protocols, for example from within a corporate network. By using concealed global variables in the Authentication field, you create an additional layer of security for your credentials and simplify the ability to share credentials across checks.
Custom Content:
Custom headers: Specify custom headers to send with each request. For example, you can add a header in your request to filter out requests from analytics on the back end by sending a specific header in the requests. You can also use custom headers to set cookies.
Cookies: Set cookies in the browser before the test starts. For example, to prevent a popup modal from randomly appearing and interfering with your test, you can set cookies. Any cookies that are set will apply to the domain of the starting URL of the check. Splunk Synthetics Monitoring uses the public suffix list to determine the domain.
Host overrides: Add host override rules to reroute requests from one host to another. For example, you can create a host override to test an existing production site against page resources loaded from a development site or a specific CDN edge node.
Next, we will edit the test steps to provide more meaningful names for each step.
1.6 Edit test steps
To edit the steps click on the + Edit steps or synthetic transactions button. From here, we are going to give meaningful names to each step.
For each of the four steps, we are going to give them a meaningful name.
Step 1 replace the text Go to URL with HomePage - Online Boutique
Step 2 enter the text Select Vintage Camera Lens.
Step 3 enter Add to Cart.
Step 4 enter Place Order.
Click < Return to test to return to the test configuration page and click Save to save the test.
You will be returned to the test dashboard where you will see test results start to appear.
Congratulations! You have successfully created a Real Browser Test in Splunk Synthetic Monitoring. Next, we will look into a test result in more detail.
1.7 View test results
In the Scatterplot from the previous step, click on one of the dots to drill into the test run data. Preferably, select the most recent test run (farthest to the right).
API Test
The API Test provides a flexible way to check the functionality and performance of API endpoints. The shift toward API-first development has magnified the necessity to monitor the back-end services that provide your core front-end functionality.
Whether you’re interested in testing the multi-step API interactions or you want to gain visibility into the performance of your endpoints, the API Test can help you accomplish your goals.
Subsections of API Test
Global Variables
Global Variables
View the global variable that we’ll use to perform our API test. Click on Global Variables under the cog. The global variable named env.encoded_auth will be the one that we’ll use to build the spotify API transaction.
Create new API test
Create a new API test
Create a new API test by clicking on the Add new test button and select API test from the dropdown. Name the test using your initials followed by Spotify API e.g. RWC - Spotify API
Authentication Request
Add Authentication Request
Click on + Add requests and enter the request step name e.g. Authenticate with Spotify API.
Expand the Request section, from the drop-down change the request method to POST and enter the following URL:
https://accounts.spotify.com/api/token
In the Payload body section enter the following:
grant_type=client_credentials
Next, add two request headers with the following key/value pairings:
CONTENT-TYPE: application/x-www-form-urlencoded
AUTHORIZATION: Basic {{env.encoded_auth}}
Expand the Validation section and add the following extraction:
Extract from Response bodyJSON$.access_tokenasaccess_token.
This will parse the JSON payload that is received from the Spotify API, extract the access token and store it as a custom variable.
Search Request
Add Search Request
Click on + Add Request to add the next step. Name the step Search for Tracks named “Up around the bend”.
Expand the Request section and change the request method to GET and enter the following URL:
This scenario is for ITOps teams managing a hybrid infrastructure that need to troubleshoot cloud-native performance issues, by correlating real-time metrics with logs to troubleshoot faster, improve MTTD/MTTR, and optimize costs.
Use Splunk Real User Monitoring (RUM) and Synthetics to get insight into end user experience, and proactively test scenarios to improve that experience.
This scenario helps platform engineering (or central tools) teams enable engineers with self-service observability tooling at scale, so developers and SREs can spend less time managing their toolchain and more time building and delivering cool software.
Subsections of Scenarios
Optimize Cloud Monitoring
3 minutesAuthor
Tim Hard
The elasticity of cloud architectures means that monitoring artifacts must scale elastically as well, breaking the paradigm of purpose-built monitoring assets. As a result, administrative overhead, visibility gaps, and tech debt skyrocket while MTTR slows. This typically happens for three reasons:
Complex and Inefficient Data Management: Infrastructure data is scattered across multiple tools with inconsistent naming conventions, leading to fragmented views and poor metadata and labelling. Managing multiple agents and data flows adds to the complexity.
Inadequate Monitoring and Troubleshooting Experience: Slow data visualization and troubleshooting, cluttered with bespoke dashboards and manual correlations, are hindered further by the lack of monitoring tools for ephemeral technologies like Kubernetes and serverless functions.
Operational and Scaling Challenges: Manual onboarding, user management, and chargeback processes, along with the need for extensive data summarization, slow down operations and inflate administrative tasks, complicating data collection and scalability.
To address these challenges you need a way to:
Standardize Data Collection and Tags: Centralized monitoring with a single, open-source agent to apply uniform naming standards and ensure metadata for visibility. Optimize data collection and use a monitoring-as-code approach for consistent collection and tagging.
Reuse Content Across Teams: Streamline new IT infrastructure onboarding and user management with templates and automation. Utilize out-of-the-box dashboards, alerts, and self-service tools to enable content reuse, ensuring uniform monitoring and reducing manual effort.
Improve Timeliness of Alerts: Utilize highly performant open source data collection, combined with real-time streaming-based data analytics and alerting, to enhance the timeliness of notifications. Automatically configured alerts for common problem patterns (AutoDetect) and minimal yet effective monitoring dashboards and alerts will ensure rapid response to emerging issues, minimizing potential disruptions.
Correlate Infrastructure Metrics and Logs: Achieve full monitoring coverage of all IT infrastructure by enabling seamless correlation between infrastructure metrics and logs. High-performing data visualization and a single source of truth for data, dashboards, and alerts will simplify the correlation process, allowing for more effective troubleshooting and analysis of the IT environment.
In this workshop, we’ll explore:
How to standardize data collection and tags using OpenTelemetry.
How to reuse content across teams.
How to improve timelines of alerts.
How to correlate infrastructure metrics and logs.
Tip
The easiest way to navigate through this workshop is by using:
the left/right arrows (< | >) on the top right of this page
the left (◀️) and right (▶️) cursor keys on your keyboard
Subsections of Optimize Cloud Monitoring
Getting Started
3 minutesAuthor
Tim Hard
During this technical Optimize Cloud Monitoring Workshop, you will build out an environment based on a lightweight Kubernetes1 cluster.
To simplify the workshop modules, a pre-configured AWS/EC2 instance is provided.
The instance is pre-configured with all the software required to deploy the Splunk OpenTelemetry Connector2 and the microservices-based OpenTelemetry Demo Application3 in Kubernetes which has been instrumented using OpenTelemetry to send metrics, traces, spans and logs.
This workshop will introduce you to the benefits of standardized data collection, how content can be re-used across teams, correlating metrics and logs, and creating detectors to fire alerts. By the end of these technical workshops, you will have a good understanding of some of the key features and capabilities of the Splunk Observability Cloud.
Here are the instructions on how to access your pre-configured AWS/EC2 instance
Kubernetes is a portable, extensible, open-source platform for managing containerized workloads and services, that facilitates both declarative configuration and automation. ↩︎
OpenTelemetry Collector offers a vendor-agnostic implementation on how to receive, process and export telemetry data. In addition, it removes the need to run, operate and maintain multiple agents/collectors to support open-source telemetry data formats (e.g. Jaeger, Prometheus, etc.) sending to multiple open-source or commercial back-ends. ↩︎
The OpenTelemetry Demo Application is a microservice-based distributed system intended to illustrate the implementation of OpenTelemetry in a near real-world environment. ↩︎
Subsections of Getting Started
How to connect to your workshop environment
5 minutesAuthor
Tim Hard
How to retrieve the IP address of the AWS/EC2 instance assigned to you.
Connect to your instance using SSH, Putty1 or your web browser.
Verify your connection to your AWS/EC2 cloud instance.
Using Putty (Optional)
Using Multipass (Optional)
1. AWS/EC2 IP Address
In preparation for the workshop, Splunk has prepared an Ubuntu Linux instance in AWS/EC2.
To get access to the instance that you will be using in the workshop please visit the URL to access the Google Sheet provided by the workshop leader.
Search for your AWS/EC2 instance by looking for your first and last name, as provided during registration for this workshop.
Find your allocated IP address, SSH command (for Mac OS, Linux and the latest Windows versions) and password to enable you to connect to your workshop instance.
It also has the Browser Access URL that you can use in case you cannot connect via SSH or Putty - see EC2 access via Web browser
Important
Please use SSH or Putty to gain access to your EC2 instance if possible and
make a note of the IP address as you will need this during the workshop.
2. SSH (Mac OS/Linux)
Most attendees will be able to connect to the workshop by using SSH from their Mac or Linux device, or on Windows 10 and above.
To use SSH, open a terminal on your system and type ssh splunk@x.x.x.x (replacing x.x.x.x with the IP address found in Step #1).
When prompted Are you sure you want to continue connecting (yes/no/[fingerprint])? please type yes.
Enter the password provided in the Google Sheet from Step #1.
Upon successful login, you will be presented with the Splunk logo and the Linux prompt.
3. SSH (Windows 10 and above)
The procedure described above is the same on Windows 10, and the commands can be executed either in the Windows Command Prompt or PowerShell.
However, Windows regards its SSH Client as an “optional feature”, which might need to be enabled.
You can verify if SSH is enabled by simply executing ssh
If you are shown a help text on how to use the SSH command (like shown in the screenshot below), you are all set.
If the result of executing the command looks something like the screenshot below, you want to enable the “OpenSSH Client” feature manually.
To do that, open the “Settings” menu, and click on “Apps”. While in the “Apps & features” section, click on “Optional features”.
Here, you are presented with a list of installed features. On the top, you see a button with a plus icon to “Add a feature”. Click it.
In the search input field, type “OpenSSH”, and find a feature called “OpenSSH Client”, or respectively, “OpenSSH Client (Beta)”, click on it, and click the “Install”-button.
Now you are set! In case you are not able to access the provided instance despite enabling the OpenSSH feature, please do not shy away from reaching
out to the course instructor, either via chat or directly.
If you are blocked from using SSH (Port 22) or unable to install Putty you may be able to connect to the workshop instance by using a web browser.
Note
This assumes that access to port 6501 is not restricted by your company’s firewall.
Open your web browser and type http://x.x.x.x:6501 (where X.X.X.X is the IP address from the Google Sheet).
Once connected, login in as splunk and the password is the one provided in the Google Sheet.
Once you are connected successfully you should see a screen similar to the one below:
Unlike when you are using regular SSH, copy and paste does require a few extra steps to complete when using a browser session. This is due to cross browser restrictions.
When the workshop asks you to copy instructions into your terminal, please do the following:
Copy the instruction as normal, but when ready to paste it in the web terminal, choose Paste from the browser as show below:
This will open a dialogue box asking for the text to be pasted into the web terminal:
Paste the text in the text box as shown, then press OK to complete the copy and paste process.
Note
Unlike regular SSH connection, the web browser has a 60-second time out, and you will be disconnected, and a Connect button will be shown in the center of the web terminal.
Simply click the Connect button and you will be reconnected and will be able to continue.
For this workshop, we’ll be using the OpenTelemetry Demo Application running in Kubernetes. This application is for an online retailer and includes more than a dozen services written in many different languages. While metrics, traces, and logs are being collected from this application, this workshop is primarily focused on how Splunk Observability Cloud can be used to more efficiently monitor infrastructure.
The initial setup can be completed by executing the following steps on the command line of your EC2 instance.
cd ~/workshop/optimize-cloud-monitoring &&\
./deploy-application.sh
You’ll be asked to enter your favorite city. This will be used in the OpenTelemetry Collector configuration as a custom tag to show how easy it is to add additional context to your observability data.
Your application should now be running and sending data to Splunk Observability Cloud. You’ll dig into the data in the next section.
Standardize Data Collection
2 minutesAuthor
Tim Hard
Why Standards Matter
As cloud adoption grows, we often face requests to support new technologies within a diverse landscape, posing challenges in delivering timely content. Take, for instance, a team containerizing five workloads on AWS requiring EKS visibility. Usually, this involves assisting with integration setup, configuring metadata, and creating dashboards and alerts—a process that’s both time-consuming and increases administrative overhead and technical debt.
Splunk Observability Cloud was designed to handle customers with a diverse set of technical requirements and stacks – from monolithic to microservices architectures, from homegrown applications to Software-as-a-Service.
Splunk offers a native experience for OpenTelemetry, which means OTel is the preferred way to get data into Splunk.
Between Splunk’s integrations and the OpenTelemetry community, there are a number of integrations available to easily collect from diverse infrastructure and applications. This includes both on-prem systems like VMWare and as well as guided integrations with cloud vendors, centralizing these hybrid environments.
For someone like a Splunk admin, the OpenTelemetry Collector can additionally be deployed to a Splunk Universal Forwarder as a Technical Add-on. This enables fast roll-out and centralized configuration management using the Splunk Deployment Server.
Let’s assume that the same team adopting Kubernetes is going to deploy a cluster for each one of our B2B customers. I’ll show you how to make a simple modification to the OpenTelemetry collector to add the customerID, and then use mirrored dashboards to allow any of our SRE teams to easily see the customer they care about.
Subsections of Standardize Data Collection
What Are Tags?
3 minutesAuthor
Tim Hard
Tags are key-value pairs that provide additional metadata about metrics, spans in a trace, or logs allowing you to enrich the context of the data you send to Splunk Observability Cloud. Many tags are collected by default such as hostname or OS type. Custom tags can be used to provide environment or application-specific context. Examples of custom tags include:
Infrastructure specific attributes
What data center a host is in
What services are hosted on an instance
What team is responsible for a set of hosts
Application specific attributes
What Application Version is running
Feature flags or experimental identifiers
Tenant ID in multi-tenant applications
User related attributes
User ID
User role (e.g. admin, guest, subscriber)
User geographical location (e.g. country, city, region)
There are two ways to add tags to your data
Add tags as OpenTelemetry attributes to metrics, traces, and logs when you send data to the Splunk Distribution of OpenTelemetry Collector. This option lets you add spans in bulk.
Instrument your application to create span tags. This option gives you the most flexibility at the per-application level.
Why are tags so important?
Tags are essential for an application to be truly observable. Tags add context to the traces to help us understand why some users get a great experience and others don’t. Powerful features in Splunk Observability Cloud utilize tags to help you jump quickly to the root cause.
Contextual Information: Tags provide additional context to the metrics, traces, and logs allowing developers and operators to understand the behavior and characteristics of infrastructure and traced operations.
Filtering and Aggregation: Tags enable filtering and aggregation of collected data. By attaching tags, users can filter and aggregate data based on specific criteria. This filtering and aggregation help in identifying patterns, diagnosing issues, and gaining insights into system behavior.
Correlation and Analysis: Tags facilitate correlation between metrics and other telemetry data, such as traces and logs. By including common identifiers or contextual information as tags, users can correlate metrics, traces, and logs enabling comprehensive analysis and troubleshooting of distributed systems.
Customization and Flexibility: OpenTelemetry allows developers to define custom tags based on their application requirements. This flexibility enables developers to capture domain-specific metadata or contextual information that is crucial for understanding the behavior of their applications.
Attributes vs. Tags
A note about terminology before we proceed. While this workshop is about tags, and this is the terminology we use in Splunk Observability Cloud, OpenTelemetry uses the term attributes instead. So when you see tags mentioned throughout this workshop, you can treat them as synonymous with attributes.
For this workshop, the OpenTelemetry collector is pre-configured to use the city you provided as a custom tag called store.location which will be used to emulate Kubernetes Clusters running in different geographic locations. We’ll use this tag as a filter to show how you can use Out-of-the-Box integration dashboards to quickly create views for specific teams, applications, or other attributes about your environment. Efficiently enabling content to be reused across teams without increasing technical debt.
Here is the OpenTelemetry Collector configuration used to add the store.location tag to all of the data sent to this collector. This means any metrics, traces, or logs will contain the store.location tag which can then be used to search, filter, or correlate this value.
Tip
If you’re interested in a deeper dive on the OpenTelemetry Collector, head over to the Self Service Observability workshop where you can get hands-on with configuring the collector or the OpenTelemetry Collector Ninja Workshop where you’ll dissect the inner workings of each collector component.
While this example uses a hard-coded value for the tag, parameterized values can also be used, allowing you to customize the tags dynamically based on the context of each host, application, or operation. This flexibility enables you to capture relevant metadata, user-specific details, or system parameters, providing a rich context for metrics, tracing, and log data while enhancing the observability of your distributed systems.
Now that you have the appropriate context, which as we’ve established is critical to Observability, let’s head over to Splunk Observability Cloud and see how we can use the data we’ve just configured.
Reuse Content Across Teams
3 minutesAuthor
Tim Hard
In today’s rapidly evolving technological landscape, where hybrid and cloud environments are becoming the norm, the need for effective monitoring and troubleshooting solutions has never been more critical. However, managing the elasticity and complexity of these modern infrastructures poses a significant challenge for teams across various industries. One of the primary pain points encountered in this endeavor is the inadequacy of existing monitoring and troubleshooting experiences.
Traditional monitoring approaches often fall short in addressing the intricacies of hybrid and cloud environments. Teams frequently encounter slow data visualization and troubleshooting processes, compounded by the clutter of bespoke yet similar dashboards and the manual correlation of data from disparate sources. This cumbersome workflow is made worse by the absence of monitoring tools tailored to ephemeral technologies such as containers, orchestrators like Kubernetes, and serverless functions.
In this section, we’ll cover how Splunk Observability Cloud provides out-of-the-box content for every integration. Not only do the out-of-the-box dashboards provide rich visibility into the infrastructure that is being monitored they can also be mirrored. This is important because it enables you to create standard dashboards for use by teams throughout your organization. This allows all teams to see any changes to the charts in the dashboard, and members of each team can set dashboard variables and filter customizations relevant to their requirements.
Subsections of Reuse Content Across Teams
Infrastrcuture Navigators
5 minutesAuthor
Tim Hard
Splunk Infrastructure Monitoring (IM) is a market-leading monitoring and observability service for hybrid cloud environments. Built on a patented streaming architecture, it provides a real-time solution for engineering teams to visualize and analyze performance across infrastructure, services, and applications in a fraction of the time and with greater accuracy than traditional solutions.
300+ Easy-to-use OOTB content: Pre-built navigators and dashboards, deliver immediate visualizations of your entire environment so that you can interact with all your data in real time. Kubernetes navigator: Provides an instant, comprehensive out-of-the-box hierarchical view of nodes, pods, and containers. Ramp up even the most novice Kubernetes user with easy-to-understand interactive cluster maps. AutoDetect alerts and detectors: Automatically identify the most important metrics, out-of-the-box, to create alert conditions for detectors that accurately alert from the moment telemetry data is ingested and use real-time alerting capabilities for important notifications in seconds. Log views in dashboards: Combine log messages and real-time metrics on one page with common filters and time controls for faster in-context troubleshooting. Metrics pipeline management: Control metrics volume at the point of ingest without re-instrumentation with a set of aggregation and data-dropping rules to store and analyze only the needed data. Reduce metrics volume and optimize observability spend.
Exercise: Find your Kubernetes Cluster
From the Splunk Observability Cloud homepage, click the button -> Kubernetes -> K8s nodes
First, use the option to pick your cluster.
From the filter drop-down box, use the store.location value you entered when deploying the application.
You then can start typing the city you used which should also appear in the drop-down values. Select yours and make sure just the one for your workshop is highlighted with a .
Click the Apply Filter button to focus on our Cluster.
You should now have your Kubernetes Cluster visible
Here we can see all of the different components of the cluster (Nodes, Pods, etc), each of which has relevant metrics associated with it. On the right side, you can also see what services are running in the cluster.
Before moving to the next section, take some time to explore the Kubernetes Navigator to see the data that is available Out of the Box.
Dashboard Cloning
5 minutesAuthor
Tim Hard
ITOps teams responsible for monitoring fleets of infrastructure frequently find themselves manually creating dashboards to visualize and analyze metrics, traces, and log data emanating from rapidly changing cloud-native workloads hosted in Kubernetes and serverless architectures, alongside existing on-premises systems. Moreover, due to the absence of a standardized troubleshooting workflow, teams often resort to creating numerous custom dashboards, each resembling the other in structure and content. As a result, administrative overhead skyrockets and MTTR slows.
To address this, you can use the out-of-the-box dashboards available in Splunk Observability Cloud for each and every integration. These dashboards are filterable and can be used for ad hoc troubleshooting or as a templated approach to getting users the information they need without having to start from scratch. Not only do the out-of-the-box dashboards provide rich visibility into the infrastructure that is being monitored they can also be cloned.
Exercise: Create a Mirrored Dashboard
In Splunk Observability Cloud, click the Global Search button. (Global Search can be used to quickly find content)
Search for Pods and select K8s pods (Kubernetes)
This will take you to the out-of-the-box Kubernetes Pods dashboard which we will use as a template for mirroring dashboards.
In the upper right corner of the dashboard click the Dashboard actions button (3 horizontal dots) -> Click Save As…
Enter a dashboard name (i.e. Kubernetes Pods Dashboard)
Under Dashboard group search for your e-mail address and select it.
Click Save
Note: Every Observability Cloud user who has set a password and logged in at least once, gets a user dashboard group and user dashboard. Your user dashboard group is your individual workspace within Observability Cloud.
After saving, you will be taken to the newly created dashboard in the Dashboard Group for your user. This is an example of cloning an out-of-the-box dashboard which can be further customized and enables users to quickly build role, application, or environment relevant views.
Custom dashboards are meant to be used by multiple people and usually represent a curated set of charts that you want to make accessible to a broad cross-section of your organization. They are typically organized by service, team, or environment.
Dashboard Mirroring
5 minutesAuthor
Tim Hard
Not only do the out-of-the-box dashboards provide rich visibility into the infrastructure that is being monitored they can also be mirrored. This is important because it enables you to create standard dashboards for use by teams throughout your organization. This allows all teams to see any changes to the charts in the dashboard, and members of each team can set dashboard variables and filter customizations relevant to their requirements.
Exercise: Create a Mirrored Dashboard
While on the Kubernetes Pods dashboard, you created in the previous step, In the upper right corner of the dashboard click the Dashboard actions button (3 horizontal dots) -> Click Add a mirror…. A configuration modal for the Dashboard Mirror will open.
Under My dashboard group search for your e-mail address and select it.
(Optional) Modify the dashboard in Dashboard name override name.
(Optional) Add a dashboard description in Dashboard description override.
Under Default filter overrides search for k8s.cluster.name and select the name of your Kubernetes cluster.
Under Default filter overrides search for store.location and select the city you entered during the workshop setup.
Click Save
You will now be taken to the newly created dashboard which is a mirror of the Kubernetes Pods dashboard you created in the previous section. Any changes to the original dashboard will be reflected in this dashboard as well. This allows teams to have a consistent yet specific view of the systems they care about and any modifications or updates can be applied in a single location, significantly minimizing the effort needed when compared to updating each individual dashboard.
In the next section, you’ll add a new logs-based chart to the original dashboard and see how the dashboard mirror is automatically updated as well.
Correlate Metrics and Logs
1 minuteAuthor
Tim Hard
Correlating infrastructure metrics and logs is often a challenging task, primarily due to inconsistencies in naming conventions across various data sources, including hosts operating on different systems. However, leveraging the capabilities of OpenTelemetry can significantly simplify this process. With OpenTelemetry’s robust framework, which offers rich metadata and attribution, metrics, traces, and logs can seamlessly correlate using standardized field names. This automated correlation not only alleviates the burden of manual effort but also enhances the overall observability of the system.
By aligning metrics and logs based on common field names, teams gain deeper insights into system performance, enabling more efficient troubleshooting, proactive monitoring, and optimization of resources. In this workshop section, we’ll explore the importance of correlating metrics with logs and demonstrate how Splunk Observability Cloud empowers teams to unlock additional value from their observability data.
Subsections of Correlate Metrics and Logs
Correlate Metrics and Logs
5 minutesAuthor
Tim Hard
In this section, we’ll dive into the seamless correlation of metrics and logs facilitated by the robust naming standards offered by OpenTelemetry. By harnessing the power of OpenTelemetry within Splunk Observability Cloud, we’ll demonstrate how troubleshooting issues becomes significantly more efficient for Site Reliability Engineers (SREs) and operators. With this integration, contextualizing data across various telemetry sources no longer demands manual effort to correlate information. Instead, SREs and operators gain immediate access to the pertinent context they need, allowing them to swiftly pinpoint and resolve issues, improving system reliability and performance.
Exercise: View pod logs
The Kubernetes Pods Dashboard you created in the previous section already includes a chart that contains all of the pod logs for your Kubernetes Cluster. The log entries are split by container in this stacked bar chart. To view specific log entries perform the following steps:
On the **Kubernetes Pods Dashboard click on one of the bar charts. A modal will open with the most recent log entries for the container you’ve selected.
Click one of the log entries.
Here we can see the entire log event with all of the fields and values. You can search for specific field names or values within the event itself using the Search for fields bar in the event.
Enter the city you configured during the application deployment
The event will now be filtered to the store.location field. This feature is great for exploring large log entries for specific fields and values unique to your environment or to search for keywords like Error or Failure.
Close the event using the X in the upper right corner.
Click the Chart actions (three horizontal dots) on the Pod log event rate chart
Click View in Log Observer
This will take us to Log Observer. In the next section, you’ll create a chart based on log events and add it to the K8s Pod Dashboard you cloned in section 3.2 Dashboard Cloning. You’ll also see how this new chart is automatically added to the mirrored dashboard you created in section 3.3 Dashboard Mirroring.
Create Log-based Chart
5 minutesAuthor
Tim Hard
In Log Observer, you can perform codeless queries on logs to detect the source of problems in your systems. You can also extract fields from logs to set up log processing rules and transform your data as it arrives or send data to Infinite Logging S3 buckets for future use. See What can I do with Log Observer? to learn more about Log Observer capabilities.
In this section, you’ll create a chart filtered to logs that include errors which will be added to the K8s Pod Dashboard you cloned in section 3.2 Dashboard Cloning.
Exercise: Create Log-based Chart
Because you drilled into Log Observer from the K8s Pod Dashboard in the previous section, the dashboard will already be filtered to your cluster and store location using the k8s.cluster.name and store.location fields and the bar chart is split by k8s.pod.name. To filter the dashboard to only logs that contain errors complete the following steps:
Log Observer can be filtered using Keywords or specific key-value pairs.
In Log Observer click Add Filter along the top.
Make sure you’ve selected Fields as the filter type and enter severity in the Find a field… search bar.
Select severity from the fields list.
You should now see a list of severities and the number of log entries for each.
Under Top values, hover over Error and click the = button to apply the filter.
The dashboard will now be filtered to only log entries with a severity of Error and the bar chart will be split by the Kubernetes Pod that contains the errors. Next, you’ll save the chart on your Kubernetes Pods Dashboard.
In the upper right corner of the Log Observer dashboard click Save.
Select Save to Dashboard.
In the Chart name field enter a name for your chart.
(Optional) In the Chart description field enter a description for your chart.
Click Select Dashboard and search for the name of the Dashboard you cloned in section 3.2 Dashboard Cloning.
Select the dashboard in the Dashboard Group for your email address.
Click OK
For the Chart type select Log timeline
Click Save and go to the dashboard
You will now be taken to your Kubernetes Pods Dashboard where you should see the chart you just created for pod errors.
Because you updated the original Kubernetes Pods Dashboard, your mirrored dashboard will also include this chart as well! You can see this by clicking the mirrored version of your dashboard along the top of the Dashboard Group for your user.
Now that you’ve seen how data can be reused across teams by cloning the dashboard, creating dashboard mirrors and how metrics can easily be correlated with logs, let’s take a look at how to create alerts so your teams can be notified when there is an issue with their infrastructure, services, or applications.
Improve Timeliness of Alerts
1 minutesAuthor
Tim Hard
When monitoring hybrid and cloud environments, ensuring timely alerts for critical infrastructure and applications poses a significant challenge. Typically, this involves crafting intricate queries, meticulously scheduling searches, and managing alerts across various monitoring solutions. Moreover, the proliferation of disparate alerts generated from identical data sources often results in unnecessary duplication, contributing to alert fatigue and noise within the monitoring ecosystem.
In this section, we’ll explore how Splunk Observability Cloud addresses these challenges by enabling the effortless creation of alert criteria. Leveraging its 10-second default data collection capability, alerts can be triggered swiftly, surpassing the timeliness achieved by traditional monitoring tools. This enhanced responsiveness not only reduces Mean Time to Detect (MTTD) but also accelerates Mean Time to Resolve (MTTR), ensuring that critical issues are promptly identified and remediated.
Subsections of Improve Timeliness of Alerts
Create Custom Detector
10 minutesAuthor
Tim Hard
Splunk Observability Cloud provides detectors, events, alerts, and notifications to keep you informed when certain criteria are met. There are a number of pre-built AutoDetect Detectors that automatically surface when common problem patterns occur, such as when an EC2 instance’s CPU utilization is expected to reach its limit. Additionally, you can also create custom detectors if you want something more optimized or specific. For example, you want a message sent to a Slack channel or to an email address for the Ops team that manages this Kubernetes cluster when Memory Utilization on their pods has reached 85%.
Exercise: Create Custom Detector
In this section you’ll create a detector on Pod Memory Utilization which will trigger if utilization surpasses 85%
On the Kubernetes Pods Dashboard you cloned in section 3.2 Dashboard Cloning, click the Get Alerts button (bell icon) for the Memory usage (%) chart -> Click New detector from chart.
In the Create detector add your initials to the detector name.
Click Create alert rule.
These conditions are expressed as one or more rules that trigger an alert when the conditions in the rules are met. Importantly, multiple rules can be included in the same detector configuration which minimizes the total number of alerts that need to be created and maintained. You can see which signal this detector will alert on by the bell icon in the Alert On column. In this case, this detector will alert on the Memory Utilization for the pods running in this Kubernetes cluster.
Click Proceed To Alert Conditions.
Many pre-built alert conditions can be applied to the metric you want to alert on. This could be as simple as a static threshold or something more complex, for example, is memory usage deviating from the historical baseline across any of your 50,000 containers?
Select Static Threshold.
Click Proceed To Alert Settings.
In this case, you want the alert to trigger if any pods exceed 85% memory utilization. Once you’ve set the alert condition, the configuration is back-tested against the historical data so you can confirm that the alert configuration is accurate, meaning will the alert trigger on the criteria you’ve defined? This is also a great way to confirm if the alert generates too much noise.
Enter 85 in the Threshold field.
Click Proceed To Alert Message.
Next, you can set the severity for this alert, you can include links to runbooks and short tips on how to respond, and you can customize the message that is included in the alert details. The message can include parameterized fields from the actual data, for example, in this case, you may want to include which Kubernetes node the pod is running on, or the store.location configured when you deployed the application, to provide additional context.
Click Proceed To Alert Recipients.
You can choose where you want this alert to be sent when it triggers. This could be to a team, specific email addresses, or to other systems such as ServiceNow, Slack, Splunk On-Call or Splunk ITSI. You can also have the alert execute a webhook which enables me to leverage automation or to integrate with many other systems such as homegrown ticketing tools. For the purpose of this workshop do not include a recipient
Click Proceed To Alert Activation.
Click Activate Alert.
You will receive a warning because no recipients were included in the Notification Policy for this detector. This can be warning can be dismissed.
Click Save.
You will be taken to your newly created detector where you can see any triggered alerts.
In the upper right corner, Click Close to close the Detector.
The detector status and any triggered alerts will automatically be included in the chart because this detector was configured for this chart.
Congratulations! You’ve successfully created a detector that will trigger if pod memory utilization exceeds 85%. After a few minutes, the detector should trigger some alerts. You can click the detector name in the chart to view the triggered alerts.
Conclusion
1 minute
Today you’ve seen how Splunk Observability Cloud can help you overcome many of the challenges you face monitoring hybrid and cloud environments. You’ve demonstrated how Splunk Observability Cloud streamlines operations with standardized data collection and tags, ensuring consistency across all IT infrastructure. The Unified Service Telemetry has been a game-changer, providing in-context metrics, logs, and trace data that make troubleshooting swift and efficient. By enabling the reuse of content across teams, you’re minimizing technical debt and bolstering the performance of our monitoring systems.
This workshop shows how tags can be used to reduce the time required for SREs to isolate issues across services, so they know which team to engage to troubleshoot the issue further, and can provide context to help engineering get a head start on debugging.
This workshop shows how Database Query Performance and AlwaysOn Profiling can be used to reduce the time required for engineers to debug problems in microservices.
Subsections of Debug Problems in Microservices
Tagging Workshop
2 minutesAuthor
Derek Mitchell
Splunk Observability Cloud includes powerful features that dramatically reduce the time required for SREs to isolate issues across services, so they know which team to engage to troubleshoot the issue further, and can provide context to help engineering get a head start on debugging.
Unlocking these features requires tags to be included with your application traces. But how do you know which tags are the most valuable and how do you capture them?
In this workshop, we’ll explore:
What are tags and why are they such a critical part of making an application observable.
How to use OpenTelemetry to capture tags of interest from your application.
How to index tags in Splunk Observability Cloud and the differences between Troubleshooting MetricSets and Monitoring MetricSets.
How to utilize tags in Splunk Observability Cloud to find “unknown unknowns” using the Tag Spotlight and Dynamic Service Map features.
How to utilize tags for alerting and dashboards.
The workshop uses a simple microservices-based application to illustrate these concepts. Let’s get started!
Tip
The easiest way to navigate through this workshop is by using:
the left/right arrows (< | >) on the top right of this page
the left (◀️) and right (▶️) cursor keys on your keyboard
Subsections of Tagging Workshop
Build the Sample Application
10 minutes
Introduction
For this workshop, we’ll be using a microservices-based application. This application is for an online retailer and normally includes more than a dozen services. However, to keep the workshop simple, we’ll be focusing on two services used by the retailer as part of their payment processing workflow: the credit check service and the credit processor service.
Pre-requisites
You will start with an EC2 instance and perform some initial steps in order to get to the following state:
Deploy the Splunk distribution of the OpenTelemetry Collector
Build and deploy creditcheckservice and creditprocessorservice
Deploy a load generator to send traffic to the services
Initial Steps
The initial setup can be completed by executing the following steps on the command line of your EC2 instance:
cd workshop/tagging
./0-deploy-collector-with-services.sh
Java
There are implementations in multiple languages available for creditcheckservice.
Run
./0-deploy-collector-with-services.sh java
to pick Java over Python.
View your application in Splunk Observability Cloud
Now that the setup is complete, let’s confirm that it’s sending data to Splunk Observability Cloud. Note that when the application is deployed for the first time, it may take a few minutes for the data to appear.
Navigate to APM, then use the Environment dropdown to select your environment (i.e. tagging-workshop-instancename).
If everything was deployed correctly, you should see creditprocessorservice and creditcheckservice displayed in the list of services:
Click on Explore on the right-hand side to view the service map. We can see that the creditcheckservice makes calls to the creditprocessorservice, with an average response time of at least 3 seconds:
Next, click on Traces on the right-hand side to see the traces captured for this application. You’ll see that some traces run relatively fast (i.e. just a few milliseconds), whereas others take a few seconds.
If you toggle Errors only to on, you’ll also notice that some traces have errors:
Toggle Errors only back to off and sort the traces by duration, then click on one of the longer running traces. In this example, the trace took five seconds, and we can see that most of the time was spent calling the /runCreditCheck operation, which is part of the creditprocessorservice.
Currently, we don’t have enough details in our traces to understand why some requests finish in a few milliseconds, and others take several seconds. To provide the best possible customer experience, this will be critical for us to understand.
We also don’t have enough information to understand why some requests result in errors, and others don’t. For example, if we look at one of the error traces, we can see that the error occurs when the creditprocessorservice attempts to call another service named otherservice. But why do some requests results in a call to otherservice, and others don’t?
We’ll explore these questions and more in the workshop.
What are Tags?
3 minutes
To understand why some requests have errors or slow performance, we’ll need to add context to our traces. We’ll do this by adding tags. But first, let’s take a moment to discuss what tags are, and why they’re so important for observability.
What are tags?
Tags are key-value pairs that provide additional metadata about spans in a trace, allowing you to enrich the context of the spans you send to Splunk APM.
For example, a payment processing application would find it helpful to track:
The payment type used (i.e. credit card, gift card, etc.)
The ID of the customer that requested the payment
This way, if errors or performance issues occur while processing the payment, we have the context we need for troubleshooting.
While some tags can be added with the OpenTelemetry collector, the ones we’ll be working with in this workshop are more granular, and are added by application developers using the OpenTelemetry API.
Attributes vs. Tags
A note about terminology before we proceed. While this workshop is about tags, and this is the terminology we use in Splunk Observability Cloud, OpenTelemetry uses the term attributes instead. So when you see tags mentioned throughout this workshop, you can treat them as synonymous with attributes.
Why are tags so important?
Tags are essential for an application to be truly observable. As we saw with our credit check service, some users are having a great experience: fast with no errors. But other users get a slow experience or encounter errors.
Tags add the context to the traces to help us understand why some users get a great experience and others don’t. And powerful features in Splunk Observability Cloud utilize tags to help you jump quickly to root cause.
Sneak Peak: Tag Spotlight
Tag Spotlight uses tags to discover trends that contribute to high latency or error rates:
The screenshot above provides an example of Tag Spotlight from another application.
Splunk has analyzed all of the tags included as part of traces that involve the payment service.
It tells us very quickly whether some tag values have more errors than others.
If we look at the version tag, we can see that version 350.10 of the service has a 100% error rate, whereas version 350.9 of the service has no errors at all:
We’ll be using Tag Spotlight with the credit check service later on in the workshop, once we’ve captured some tags of our own.
Capture Tags with OpenTelemetry
15 minutes
Please proceed to one of the subsections for Java or Python. Ask your instructor for the one used during the workshop!
Subsections of Capture Tags with OpenTelemetry
1. Capture Tags - Java
15 minutes
Let’s add some tags to our traces, so we can find out why some customers receive a poor experience from our application.
Identify Useful Tags
We’ll start by reviewing the code for the creditCheck function of creditcheckservice (which can be found in the file /home/splunk/workshop/tagging/creditcheckservice-java/src/main/java/com/example/creditcheckservice/CreditCheckController.java):
@GetMapping("/check")publicResponseEntity<String>creditCheck(@RequestParam("customernum")StringcustomerNum){// Get Credit ScoreintcreditScore;try{StringcreditScoreUrl="http://creditprocessorservice:8899/getScore?customernum="+customerNum;creditScore=Integer.parseInt(restTemplate.getForObject(creditScoreUrl,String.class));}catch(HttpClientErrorExceptione){returnResponseEntity.status(HttpStatus.INTERNAL_SERVER_ERROR).body("Error getting credit score");}StringcreditScoreCategory=getCreditCategoryFromScore(creditScore);// Run Credit CheckStringcreditCheckUrl="http://creditprocessorservice:8899/runCreditCheck?customernum="+customerNum+"&score="+creditScore;StringcheckResult;try{checkResult=restTemplate.getForObject(creditCheckUrl,String.class);}catch(HttpClientErrorExceptione){returnResponseEntity.status(HttpStatus.INTERNAL_SERVER_ERROR).body("Error running credit check");}returnResponseEntity.ok(checkResult);}
We can see that this function accepts a customer number as an input. This would be helpful to capture as part of a trace. What else would be helpful?
Well, the credit score returned for this customer by the creditprocessorservice may be interesting (we want to ensure we don’t capture any PII data though). It would also be helpful to capture the credit score category, and the credit check result.
Great, we’ve identified four tags to capture from this service that could help with our investigation. But how do we capture these?
Capture Tags
We start by adding OpenTelemetry imports to the top of the CreditCheckController.java file:
That was pretty easy, right? Let’s capture some more, with the final result looking like this:
@GetMapping("/check")@WithSpan(kind=SpanKind.SERVER)publicResponseEntity<String>creditCheck(@RequestParam("customernum")@SpanAttribute("customer.num")StringcustomerNum){// Get Credit ScoreintcreditScore;try{StringcreditScoreUrl="http://creditprocessorservice:8899/getScore?customernum="+customerNum;creditScore=Integer.parseInt(restTemplate.getForObject(creditScoreUrl,String.class));}catch(HttpClientErrorExceptione){returnResponseEntity.status(HttpStatus.INTERNAL_SERVER_ERROR).body("Error getting credit score");}SpancurrentSpan=Span.current();currentSpan.setAttribute("credit.score",creditScore);StringcreditScoreCategory=getCreditCategoryFromScore(creditScore);currentSpan.setAttribute("credit.score.category",creditScoreCategory);// Run Credit CheckStringcreditCheckUrl="http://creditprocessorservice:8899/runCreditCheck?customernum="+customerNum+"&score="+creditScore;StringcheckResult;try{checkResult=restTemplate.getForObject(creditCheckUrl,String.class);}catch(HttpClientErrorExceptione){returnResponseEntity.status(HttpStatus.INTERNAL_SERVER_ERROR).body("Error running credit check");}currentSpan.setAttribute("credit.check.result",checkResult);returnResponseEntity.ok(checkResult);}
Redeploy Service
Once these changes are made, let’s run the following script to rebuild the Docker image used for creditcheckservice and redeploy it to our Kubernetes cluster:
./5-redeploy-creditcheckservice.sh java
Confirm Tag is Captured Successfully
After a few minutes, return to Splunk Observability Cloud and load one of the latest traces to confirm that the tags were captured successfully (hint: sort by the timestamp to find the latest traces):
Well done, you’ve leveled up your OpenTelemetry game and have added context to traces using tags.
Next, we’re ready to see how you can use these tags with Splunk Observability Cloud!
2. Capture Tags - Python
15 minutes
Let’s add some tags to our traces, so we can find out why some customers receive a poor experience from our application.
Identify Useful Tags
We’ll start by reviewing the code for the credit_check function of creditcheckservice (which can be found in the /home/splunk/workshop/tagging/creditcheckservice/main.py file):
@app.route('/check')defcredit_check():customerNum=request.args.get('customernum')# Get Credit ScorecreditScoreReq=requests.get("http://creditprocessorservice:8899/getScore?customernum="+customerNum)creditScoreReq.raise_for_status()creditScore=int(creditScoreReq.text)creditScoreCategory=getCreditCategoryFromScore(creditScore)# Run Credit CheckcreditCheckReq=requests.get("http://creditprocessorservice:8899/runCreditCheck?customernum="+str(customerNum)+"&score="+str(creditScore))creditCheckReq.raise_for_status()checkResult=str(creditCheckReq.text)returncheckResult
We can see that this function accepts a customer number as an input. This would be helpful to capture as part of a trace. What else would be helpful?
Well, the credit score returned for this customer by the creditprocessorservice may be interesting (we want to ensure we don’t capture any PII data though). It would also be helpful to capture the credit score category, and the credit check result.
Great, we’ve identified four tags to capture from this service that could help with our investigation. But how do we capture these?
Capture Tags
We start by adding importing the trace module by adding an import statement to the top of the creditcheckservice/main.py file:
importrequestsfromflaskimportFlask,requestfromwaitressimportservefromopentelemetryimporttrace# <--- ADDED BY WORKSHOP...
Next, we need to get a reference to the current span so we can add an attribute (aka tag) to it:
defcredit_check():current_span=trace.get_current_span()# <--- ADDED BY WORKSHOPcustomerNum=request.args.get('customernum')current_span.set_attribute("customer.num",customerNum)# <--- ADDED BY WORKSHOP...
That was pretty easy, right? Let’s capture some more, with the final result looking like this:
defcredit_check():current_span=trace.get_current_span()# <--- ADDED BY WORKSHOPcustomerNum=request.args.get('customernum')current_span.set_attribute("customer.num",customerNum)# <--- ADDED BY WORKSHOP# Get Credit ScorecreditScoreReq=requests.get("http://creditprocessorservice:8899/getScore?customernum="+customerNum)creditScoreReq.raise_for_status()creditScore=int(creditScoreReq.text)current_span.set_attribute("credit.score",creditScore)# <--- ADDED BY WORKSHOPcreditScoreCategory=getCreditCategoryFromScore(creditScore)current_span.set_attribute("credit.score.category",creditScoreCategory)# <--- ADDED BY WORKSHOP# Run Credit CheckcreditCheckReq=requests.get("http://creditprocessorservice:8899/runCreditCheck?customernum="+str(customerNum)+"&score="+str(creditScore))creditCheckReq.raise_for_status()checkResult=str(creditCheckReq.text)current_span.set_attribute("credit.check.result",checkResult)# <--- ADDED BY WORKSHOPreturncheckResult
Redeploy Service
Once these changes are made, let’s run the following script to rebuild the Docker image used for creditcheckservice and redeploy it to our Kubernetes cluster:
./5-redeploy-creditcheckservice.sh
Confirm Tag is Captured Successfully
After a few minutes, return to Splunk Observability Cloud and load one of the latest traces to confirm that the tags were captured successfully (hint: sort by the timestamp to find the latest traces):
Well done, you’ve leveled up your OpenTelemetry game and have added context to traces using tags.
Next, we’re ready to see how you can use these tags with Splunk Observability Cloud!
Explore Trace Data
5 minutes
Now that we’ve captured several tags from our application, let’s explore some of the trace data we’ve captured that include this additional context, and see if we can identify what’s causing a poor user experience in some cases.
Use Trace Analyzer
Navigate to APM, then select Traces. This takes us to the Trace Analyzer, where we can add filters to search for traces of interest. For example, we can filter on traces where the credit score starts with 7:
If you load one of these traces, you’ll see that the credit score indeed starts with seven.
We can apply similar filters for the customer number, credit score category, and credit score result.
Explore Traces With Errors
Let’s remove the credit score filter and toggle Errors only to on, which results in a list of only those traces where an error occurred:
Click on a few of these traces, and look at the tags we captured. Do you notice any patterns?
Next, toggle Errors only to off, and sort traces by duration. Look at a few of the slowest running traces, and compare them to the fastest running traces. Do you notice any patterns?
If you found a pattern that explains the slow performance and errors - great job! But keep in mind that this is a difficult way to troubleshoot, as it requires you to look through many traces and mentally keep track of what you saw, so you can identify a pattern.
Thankfully, Splunk Observability Cloud provides a more efficient way to do this, which we’ll explore next.
Index Tags
5 minutes
Index Tags
To use advanced features in Splunk Observability Cloud such as Tag Spotlight, we’ll need to first index one or more tags.
To do this, navigate to Settings -> APM MetricSets. Then click the + New MetricSet button.
Let’s index the credit.score.category tag by entering the following details (note: since everyone in the workshop is using the same organization, the instructor will do this step on your behalf):
Click Start Analysis to proceed.
The tag will appear in the list of Pending MetricSets while analysis is performed.
Once analysis is complete, click on the checkmark in the Actions column.
How to choose tags for indexing
Why did we choose to index the credit.score.category tag and not the others?
To understand this, let’s review the primary use cases for tags:
Filtering
Grouping
Filtering
With the filtering use case, we can use the Trace Analyzer capability of Splunk Observability Cloud to filter on traces that match a particular tag value.
We saw an example of this earlier, when we filtered on traces where the credit score started with 7.
Or if a customer calls in to complain about slow service, we could use Trace Analyzer to locate all traces with that particular customer number.
Tags used for filtering use cases are generally high-cardinality, meaning that there could be thousands or even hundreds of thousands of unique values. In fact, Splunk Observability Cloud can handle an effectively infinite number of unique tag values! Filtering using these tags allows us to rapidly locate the traces of interest.
Note that we aren’t required to index tags to use them for filtering with Trace Analyzer.
Grouping
With the grouping use case, we can use Trace Analyzer to group traces by a particular tag.
But we can also go beyond this and surface trends for tags that we collect using the powerful Tag Spotlight feature in Splunk Observability Cloud, which we’ll see in action shortly.
Tags used for grouping use cases should be low to medium-cardinality, with hundreds of unique values.
For custom tags to be used with Tag Spotlight, they first need to be indexed.
We decided to index the credit.score.category tag because it has a few distinct values that would be useful for grouping. In contrast, the customer number and credit score tags have hundreds or thousands of unique values, and are more valuable for filtering use cases rather than grouping.
Troubleshooting vs. Monitoring MetricSets
You may have noticed that, to index this tag, we created something called a Troubleshooting MetricSet. It’s named this way because a Troubleshooting MetricSet, or TMS, allows us to troubleshoot issues with this tag using features such as Tag Spotlight.
You may have also noticed that there’s another option which we didn’t choose called a Monitoring MetricSet (or MMS). Monitoring MetricSets go beyond troubleshooting and allow us to use tags for alerting and dashboards. We’ll explore this concept later in the workshop.
Use Tags for Troubleshooting
5 minutes
Using Tag Spotlight
Now that we’ve indexed the credit.score.category tag, we can use it with Tag Spotlight to troubleshoot our application.
Navigate to APM then click on Tag Spotlight on the right-hand side. Ensure the creditcheckservice service is selected from the Service drop-down (if not already selected).
With Tag Spotlight, we can see 100% of credit score requests that result in a score of impossible have an error, yet requests for all other credit score types have no errors at all!
This illustrates the power of Tag Spotlight! Finding this pattern would be time-consuming without it, as we’d have to manually look through hundreds of traces to identify the pattern (and even then, there’s no guarantee we’d find it).
We’ve looked at errors, but what about latency? Let’s click on Latency near the top of the screen to find out.
Here, we can see that the requests with a poor credit score request are running slowly, with P50, P90, and P99 times of around 3 seconds, which is too long for our users to wait, and much slower than other requests.
We can also see that some requests with an exceptional credit score request are running slowly, with P99 times of around 5 seconds, though the P50 response time is relatively quick.
Using Dynamic Service Maps
Now that we know the credit score category associated with the request can impact performance and error rates, let’s explore another feature that utilizes indexed tags: Dynamic Service Maps.
With Dynamic Service Maps, we can breakdown a particular service by a tag. For example, let’s click on APM, then click Explore to view the service map.
Click on creditcheckservice. Then, on the right-hand menu, click on the drop-down that says Breakdown, and select the credit.score.category tag.
At this point, the service map is updated dynamically, and we can see the performance of requests hitting creditcheckservice broken down by the credit score category:
This view makes it clear that performance for good and fair credit scores is excellent, while poor and exceptional scores are much slower, and impossible scores result in errors.
Summary
Tag Spotlight has uncovered several interesting patterns for the engineers that own this service to explore further:
Why are all the impossible credit score requests resulting in error?
Why are all the poor credit score requests running slowly?
Why do some of the exceptional requests run slowly?
As an SRE, passing this context to the engineering team would be extremely helpful for their investigation, as it would allow them to track down the issue much more quickly than if we simply told them that the service was “sometimes slow”.
If you’re curious, have a look at the source code for the creditprocessorservice. You’ll see that requests with impossible, poor, and exceptional credit scores are handled differently, thus resulting in the differences in error rates and latency that we uncovered.
The behavior we saw with our application is typical for modern cloud-native applications, where different inputs passed to a service lead to different code paths, some of which result in slower performance or errors. For example, in a real credit check service, requests resulting in low credit scores may be sent to another downstream service to further evaluate risk, and may perform more slowly than requests resulting in higher scores, or encounter higher error rates.
Use Tags for Monitoring
15 minutes
Earlier, we created a Troubleshooting Metric Set on the credit.score.category tag, which allowed us to use Tag Spotlight with that tag and identify a pattern to explain why some users received a poor experience.
In this section of the workshop, we’ll explore a related concept: Monitoring MetricSets.
What are Monitoring MetricSets?
Monitoring MetricSets go beyond troubleshooting and allow us to use tags for alerting, dashboards and SLOs.
Create a Monitoring MetricSet
(note: your workshop instructor will do the following for you, but observe the steps)
Let’s navigate to Settings -> APM MetricSets, and click the edit button (i.e. the little pencil) beside the MetricSet for credit.score.category.
Check the box beside Also create Monitoring MetricSet then click Start Analysis
The credit.score.category tag appears again as a Pending MetricSet. After a few moments, a checkmark should appear. Click this checkmark to enable the Pending MetricSet.
Using Monitoring MetricSets
This mechanism creates a new dimension from the tag on a bunch of metrics that can be used to filter these metrics based on the values of that new dimension. Important: To differentiate between the original and the copy, the dots in the tag name are replaced by underscores for the new dimension. With that the metrics become a dimension named credit_score_category and not credit.score.category.
Next, let’s explore how we can use this Monitoring MetricSet.
Subsections of Use Tags for Monitoring
Use Tags with Dashboards
5 minutes
Dashboards
Navigate to Metric Finder, then type in the name of the tag, which is credit_score_category (remember that the dots in the tag name were replaced by underscores when the Monitoring MetricSet was created). You’ll see that multiple metrics include this tag as a dimension:
By default, Splunk Observability Cloud calculates several metrics using the trace data it receives. See Learn about MetricSets in APM for more details.
By creating an MMS, credit_score_category was added as a dimension to these metrics, which means that this dimension can now be used for alerting and dashboards.
To see how, let’s click on the metric named service.request.duration.ns.p99, which brings up the following chart:
Add filters for sf_environment, sf_service, and sf_dimensionalized. Then set the Extrapolation policy to Last value and the Display units to Nanosecond:
With these settings, the chart allows us to visualize the service request duration by credit score category:
Now we can see the duration by credit score category. In my example, the red line represents the exceptional category, and we can see that the duration for these requests sometimes goes all the way up to 5 seconds.
The orange represents the very good category, and has very fast response times.
The green line represents the poor category, and has response times between 2-3 seconds.
It may be useful to save this chart on a dashboard for future reference. To do this, click on the Save as… button and provide a name for the chart:
When asked which dashboard to save the chart to, let’s create a new one named Credit Check Service - Your Name (substituting your actual name):
Now we can see the chart on our dashboard, and can add more charts as needed to monitor our credit check service:
Use Tags with Alerting
3 minutes
Alerts
It’s great that we have a dashboard to monitor the response times of the credit check service by credit score, but we don’t want to stare at a dashboard all day.
Let’s create an alert so we can be notified proactively if customers with exceptional credit scores encounter slow requests.
To create this alert, click on the little bell on the top right-hand corner of the chart, then select New detector from chart:
Let’s call the detector Latency by Credit Score Category. Set the environment to your environment name (i.e. tagging-workshop-yourname) then select creditcheckservice as the service. Since we only want to look at performance for customers with exceptional credit scores, add a filter using the credit_score_category dimension and select exceptional:
As an alert condition instead of “Static threshold” we want to select “Sudden Change” to make the example more vivid.
We can then set the remainder of the alert details as we normally would. The key thing to remember here is that without capturing a tag with the credit score category and indexing it, we wouldn’t be able to alert at this granular level, but would instead be forced to bucket all customers together, regardless of their importance to the business.
Unless you want to get notified, we do not need to finish this wizard. You can just close the wizard by clicking the X on the top right corner of the wizard pop-up.
Use Tags with Service Level Objectives
10 minutes
We can now use the created Monitoring MetricSet together with Service Level Objectives a similar way we used them with dashboards and detectors/alerts before. For that we want to be clear about some key concepts:
An SLI is a quantitative measurement showing some health of a service, expressed as a metric or combination of metrics.
Availability SLI: Proportion of requests that resulted in a successful response Performance SLI: Proportion of requests that loaded in < 100 ms
Service level objective (SLO)
An SLO defines a target for an SLI and a compliance period over which that target must be met. An SLO contains 3 elements: an SLI, a target, and a compliance period. Compliance periods can be calendar, such as monthly, or rolling, such as past 30 days.
Availability SLI over a calendar period: Our service must respond successfully to 95% of requests in a month Performance SLI over a rolling period: Our service must respond to 99% of requests in < 100 ms over a 7-day period
Service level agreement (SLA)
An SLA is a contractual agreement that indicates service levels your users can expect from your organization. If an SLA is not met, there can be financial consequences.
A customer service SLA indicates that 90% of support requests received on a normal support day must have a response within 6 hours.
Error budget
A measurement of how your SLI performs relative to your SLO over a period of time. Error budget measures the difference between actual and desired performance. It determines how unreliable your service might be during this period and serves as a signal when you need to take corrective action.
Our service can respond to 1% of requests in >100 ms over a 7 day period.
Burn rate
A unitless measurement of how quickly a service consumes the error budget during the compliance window of the SLO. Burn rate makes the SLO and error budget actionable, showing service owners when a current incident is serious enough to page an on-call responder.
For an SLO with a 30-day compliance window, a constant burn rate of 1 means your error budget is used up in exactly 30 days.
Creating a new Service Level Objective
There is an easy to follow wizard to create a new Service Level Objective (SLO). In the left navigation just follow the link “Detectors & SLOs”. From there select the third tab “SLOs” and click the blue button to the right that says “Create SLO”.
The wizard guides you through some easy steps. And if everything during the previous steps worked out, you will have no problems here. ;)
In our case we want to use Service & endpoint as our Metric type instead of Custom metric. We filter the Environment down to the environment that we are using during this workshop (i.e. tagging-workshop-yourname) and select the creditcheckservice from the Service and endpoint list. Our Indicator type for this workshop will be Request latency and not Request success.
Now we can select our Filters. Since we are using the Request latency as the Indicator type and that is a metric of the APM Service, we can filter on credit.score.category. Feel free to try out what happens, when you set the Indicator type to Request success.
Today we are only interested in our exceptional credit scores. So please select that as the filter.
In the next step we define the objective we want to reach. For the Request latency type, we define the Target (%), the Latency (ms) and the Compliance Window. Please set these to 99, 100 and Last 7 days. This will give us a good idea what we are achieving already.
Here we will already be in shock or play around with the numbers to make it not so scary. Feel free to play around with the numbers to see how well we achieve the objective and how much we have left to burn.
The third step gives us the chance to alert (aka annoy) people who should be aware about these SLOs to initiate countermeasures. These “people” can also be mechanism like ITSM systems or webhooks to initiate automatic remediation steps.
Activate all categories you want to alert on and add recipients to the different alerts.
The next step is only the naming for this SLO. Have your own naming convention ready for this. In our case we would just name it creditchceckservice:score:exceptional:YOURNAME and click the Create-button BUT you can also just cancel the wizard by clicking anything in the left navigation and confirming to Discard changes.
And with that we have (nearly) successfully created an SLO including the alerting in case we might miss or goals.
Summary
2 minutes
In this workshop, we learned the following:
What are tags and why are they such a critical part of making an application observable?
How to use OpenTelemetry to capture tags of interest from your application.
How to index tags in Splunk Observability Cloud and the differences between Troubleshooting MetricSets and Monitoring MetricSets.
How to utilize tags in Splunk Observability Cloud to find “unknown unknowns” using the Tag Spotlight and Dynamic Service Map features.
How to utilize tags for dashboards, alerting and service level objectives.
Collecting tags aligned with the best practices shared in this workshop will let you get even more value from the data you’re sending to Splunk Observability Cloud. Now that you’ve completed this workshop, you have the knowledge you need to start collecting tags from your own applications!
Once the workshop is complete, remember to delete the APM MetricSet you created earlier for the credit.score.category tag.
Profiling Workshop
2 minutesAuthor
Derek Mitchell
Service Maps and Traces are extremely valuable in determining what service an issue resides in. And related log data helps provide detail on why issues are occurring in that service.
But engineers sometimes need to go even deeper to debug a problem that’s occurring in one of their services.
This is where features such as Splunk’s AlwaysOn Profiling and Database Query Performance come in.
AlwaysOn Profiling continuously collects stack traces so that you can discover which lines in your code are consuming the most CPU and memory.
And Database Query Performance can quickly identify long-running, unoptimized, or heavy queries and mitigate issues they might be causing.
In this workshop, we’ll explore:
How to debug an application with several performance issues.
How to use Database Query Performance to find slow-running queries that impact application performance.
How to enable AlwaysOn Profiling and use it to find the code that consumes the most CPU and memory.
How to apply fixes based on findings from Splunk Observability Cloud and verify the result.
The workshop uses a Java-based application called The Door Game hosted in Kubernetes. Let’s get started!
Tip
The easiest way to navigate through this workshop is by using:
the left/right arrows (< | >) on the top right of this page
the left (◀️) and right (▶️) cursor keys on your keyboard
Subsections of Profiling Workshop
Build the Sample Application
10 minutes
Introduction
For this workshop, we’ll be using a Java-based application called The Door Game. It will be hosted in Kubernetes.
Pre-requisites
You will start with an EC2 instance and perform some initial steps in order to get to the following state:
Deploy the Splunk distribution of the OpenTelemetry Collector
Deploy the MySQL database container and populate data
Build and deploy the doorgame application container
Initial Steps
The initial setup can be completed by executing the following steps on the command line of your EC2 instance.
You’ll be asked to enter a name for your environment. Please use profiling-workshop-yourname (where yourname is replaced by your actual name).
cd workshop/profiling
./1-deploy-otel-collector.sh
./2-deploy-mysql.sh
./3-deploy-doorgame.sh
Let’s Play The Door Game
Now that the application is deployed, let’s play with it and generate some observability data.
Get the external IP address for your application instance using the following command:
You should be able to access The Door Game application by pointing your browser to port 81 of the provided IP address. For example:
http://52.23.184.60:81
You should be met with The Door Game intro screen:
Click Let's Play to start the game:
Did you notice that it took a long time after clicking Let's Play before we could actually start playing the game?
Let’s use Splunk Observability Cloud to determine why the application startup is so slow.
Troubleshoot Game Startup
10 minutes
Let’s use Splunk Observability Cloud to determine why the game started so slowly.
View your application in Splunk Observability Cloud
Note: when the application is deployed for the first time, it may take a few minutes for the data to appear.
Navigate to APM, then use the Environment dropdown to select your environment (i.e. profiling-workshop-name).
If everything was deployed correctly, you should see doorgame displayed in the list of services:
Click on Explore on the right-hand side to view the service map. We should the doorgame application on the service map:
Notice how the majority of the time is being spent in the MySQL database. We can get more details by clicking on Database Query Performance on the right-hand side.
This view shows the SQL queries that took the most amount of time. Ensure that the Compare to dropdown is set to None, so we can focus on current performance.
We can see that one query in particular is taking a long time:
select * from doorgamedb.users, doorgamedb.organizations
(do you notice anything unusual about this query?)
Let’s troubleshoot further by clicking on one of the spikes in the latency graph. This brings up a list of example traces that include this slow query:
Click on one of the traces to see the details:
In the trace, we can see that the DoorGame.startNew operation took 25.8 seconds, and 17.6 seconds of this was associated with the slow SQL query we found earlier.
What did we accomplish?
To recap what we’ve done so far:
We’ve deployed our application and are able to access it successfully.
The application is sending traces to Splunk Observability Cloud successfully.
We started troubleshooting the slow application startup time, and found a slow SQL query that seems to be the root cause.
To troubleshoot further, it would be helpful to get deeper diagnostic data that tells us what’s happening inside our JVM, from both a memory (i.e. JVM heap) and CPU perspective. We’ll tackle that in the next section of the workshop.
Enable AlwaysOn Profiling
20 minutes
Let’s learn how to enable the memory and CPU profilers, verify their operation,
and use the results in Splunk Observability Cloud to find out why our application startup is slow.
Update the application configuration
We will need to pass additional configuration arguments to the Splunk OpenTelemetry Java agent in order to
enable both profilers. The configuration is documented here
in detail, but for now we just need the following settings:
Since our application is deployed in Kubernetes, we can update the Kubernetes manifest file to set these environment variables. Open the doorgame/doorgame.yaml file for editing, and ensure the values of the following environment variables are set to “true”:
You should see a line in the application log output that shows the profiler is active:
[otel.javaagent 2024-02-05 19:01:12:416 +0000] [main] INFO com.splunk.opentelemetry.profiler.JfrActivator - Profiler is active.```
This confirms that the profiler is enabled and sending data to the OpenTelemetry collector deployed in our Kubernetes cluster, which in turn sends profiling data to Splunk Observability Cloud.
Profiling in APM
Visit http://<your IP address>:81 and play a few more rounds of The Door Game.
Then head back to Splunk Observability Cloud, click on APM, and click on the doorgame service at the bottom of the screen.
Click on “Traces” on the right-hand side to load traces for this service. Filter on traces involving the doorgame service and the GET new-game operation (since we’re troubleshooting the game startup sequence):
Selecting one of these traces brings up the following screen:
You can see that the spans now include “Call Stacks”, which is a result of us enabling CPU and memory profiling earlier.
Click on the span named doorgame: SELECT doorgamedb, then click on CPU stack traces on the right-hand side:
This brings up the CPU call stacks captured by the profiler.
Let’s open the AlwaysOn Profiler to review the CPU stack trace in more detail. We can do this by clicking on the Span link beside View in AlwaysOn Profiler:
The AlwaysOn Profiler includes both a table and a flamegraph. Take some time to explore this view by doing some of the following:
click a table item and notice the change in flamegraph
navigate the flamegraph by clicking on a stack frame to zoom in, and a parent frame to zoom out
add a search term like splunk or jetty to highlight some matching stack frames
Let’s have a closer look at the stack trace, starting with the DoorGame.startNew method (since we already know that it’s the slowest part of the request)
When starting a new Door Game, a call is made to load user data.
This results in executing a SQL query to load the user data (which is related to the slow SQL query we saw earlier).
We then see calls to read data in from the database.
So, what does this all mean? It means that our application startup is slow since it’s spending time loading user data. In fact, the profiler has told us the exact line of code where this happens:
Let’s open the corresponding source file (./doorgame/src/main/java/com/splunk/profiling/workshop/UserData.java) and look at this code in more detail:
public class UserData {

    static final String DB_URL = "jdbc:mysql://mysql/DoorGameDB";
    static final String USER = "root";
    static final String PASS = System.getenv("MYSQL_ROOT_PASSWORD");
    static final String SELECT_QUERY = "select * FROM DoorGameDB.Users, DoorGameDB.Organizations";

    HashMap<String, User> users;

    public UserData() {
        users = new HashMap<String, User>();
    }

    public void loadUserData() {

        // Load user data from the database and store it in a map
        Connection conn = null;
        Statement stmt = null;
        ResultSet rs = null;

        try{
            conn = DriverManager.getConnection(DB_URL, USER, PASS);
            stmt = conn.createStatement();
            rs = stmt.executeQuery(SELECT_QUERY);
            while (rs.next()) {
                User user = new User(rs.getString("UserId"), rs.getString("FirstName"), rs.getString("LastName"));
                users.put(rs.getString("UserId"), user);
            }
Here we can see the application logic in action. It establishes a connection to the database, then executes the SQL query we saw earlier:
select * FROM DoorGameDB.Users, DoorGameDB.Organizations
It then loops through each of the results, and loads each user into a HashMap object, which is a collection of User objects.
We have a good understanding of why the game startup sequence is so slow, but how do we fix it?
For more clues, let’s have a look at the other part of AlwaysOn Profiling: memory profiling. To do this, click on the Memory tab in AlwaysOn profiling:
At the top of this view, we can see how much heap memory our application is using, the heap memory allocation rate, and garbage collection activity.
We can see that our application is using about 400 MB out of the max 1 GB heap size, which seems excessive for such a simple application. We can also see that some garbage collection occurred, which caused our application to pause (and probably annoyed those wanting to play the Game Door).
At the bottom of the screen, which can see which methods in our Java application code are associated with the most heap memory usage. Click on the first item in the list to show the Memory Allocation Stack Traces associated with the java.util.Arrays.copyOf method specifically:
With help from the profiler, we can see that the loadUserData method not only consumes excessive CPU time, but it also consumes excessive memory when storing the user data in the HashMap collection object.
What did we accomplish?
We’ve come a long way already!
We learned how to enable the profiler in the Splunk OpenTelemetry Java instrumentation agent.
We learned how to verify in the agent output that the profiler is enabled.
We have explored several profiling related workflows in APM:
How to navigate to AlwaysOn Profiling from the troubleshooting view
How to explore the flamegraph and method call duration table through navigation and filtering
How to identify when a span has sampled call stacks associated with it
How to explore heap utilization and garbage collection activity
How to view memory allocation stack traces for a particular method
In the next section, we’ll apply a fix to our application to resolve the slow startup performance.
Fix Application Startup Slowness
10 minutes
In this section, we’ll use what we learned from the profiling data in Splunk Observability Cloud to resolve the slowness we saw when starting our application.
Examining the Source Code
Open the corresponding source file once again (./doorgame/src/main/java/com/splunk/profiling/workshop/UserData.java) and focus on the following code:
public class UserData {

    static final String DB_URL = "jdbc:mysql://mysql/DoorGameDB";
    static final String USER = "root";
    static final String PASS = System.getenv("MYSQL_ROOT_PASSWORD");
    static final String SELECT_QUERY = "select * FROM DoorGameDB.Users, DoorGameDB.Organizations";

    HashMap<String, User> users;

    public UserData() {
        users = new HashMap<String, User>();
    }

    public void loadUserData() {

        // Load user data from the database and store it in a map
        Connection conn = null;
        Statement stmt = null;
        ResultSet rs = null;

        try{
            conn = DriverManager.getConnection(DB_URL, USER, PASS);
            stmt = conn.createStatement();
            rs = stmt.executeQuery(SELECT_QUERY);
            while (rs.next()) {
                User user = new User(rs.getString("UserId"), rs.getString("FirstName"), rs.getString("LastName"));
                users.put(rs.getString("UserId"), user);
            }
After speaking with a database engineer, you discover that the SQL query being executed includes a cartesian join:
select * FROM DoorGameDB.Users, DoorGameDB.Organizations
Cartesian joins are notoriously slow, and shouldn’t be used, in general.
Upon further investigation, you discover that there are 10,000 rows in the user table, and 1,000 rows in the organization table. When we execute a cartesian join using both of these tables, we end up with 10,000 x 1,000 rows being returned, which is 10,000,000 rows!
Furthermore, the query ends up returning duplicate user data, since each record in the user table is repeated for each organization.
So when our code executes this query, it tries to load 10,000,000 user objects into the HashMap, which explains why it takes so long to execute, and why it consumes so much heap memory.
Let’s Fix That Bug
After consulting the engineer that originally wrote this code, we determined that the join with the Organizations table was inadvertent.
So when loading the users into the HashMap, we simply need to remove this table from the query.
Open the corresponding source file once again (./doorgame/src/main/java/com/splunk/profiling/workshop/UserData.java) and change the following line of code:
staticfinalStringSELECT_QUERY="select * FROM DoorGameDB.Users, DoorGameDB.Organizations";
to:
staticfinalStringSELECT_QUERY="select * FROM DoorGameDB.Users";
Now the method should perform much more quickly, and less memory should be used, as it’s loading the correct number of users into the HashMap (10,000 instead of 10,000,000).
Rebuild and Redeploy Application
Let’s test our changes by using the following commands to re-build and re-deploy the Door Game application:
cd workshop/profiling
./5-redeploy-doorgame.sh
Once the application has been redeployed successfully, visit The Door Game again to confirm that your fix is in place:
http://<your IP address>:81
Clicking Let's Play should take us to the game more quickly now (though performance could still be improved):
Start the game a few more times, then return to Splunk Observability Cloud to confirm that the latency of the GET new-game operation has decreased.
What did we accomplish?
We discovered why our SQL query was so slow.
We applied a fix, then rebuilt and redeployed our application.
We confirmed that the application starts a new game more quickly.
In the next section, we’ll explore continue playing the game and fix any remaining performance issues that we find.
Fix In Game Slowness
10 minutes
Now that our game startup slowness has been resolved, let’s play several rounds of the Door Game and ensure the rest of the game performs quickly.
As you play the game, do you notice any other slowness? Let’s look at the data in Splunk Observability Cloud to put some numbers on what we’re seeing.
Review Game Performance in Splunk Observability Cloud
Navigate to APM then click on Traces on the right-hand side of the screen. Sort the traces by Duration in descending order:
We can see that a few of the traces with an operation of GET /game/:uid/picked/:picked/outcome have a duration of just over five seconds. This explains why we’re still seeing some slowness when we play the app (note that the slowness is no longer on the game startup operation, GET /new-game, but rather a different operation used while actually playing the game).
Let’s click on one of the slow traces and take a closer look. Since profiling is still enabled, call stacks have been captured as part of this trace. Click on the child span in the waterfall view, then click CPU Stack Traces:
At the bottom of the call stack, we can see that the thread was busy sleeping:
The call stack tells us a story – reading from the bottom up, it lets us describe
what is happening inside the service code. A developer, even one unfamiliar with the
source code, should be able to look at this call stack to craft a narrative like:
We are getting the outcome of a game. We leverage the DoorChecker to
see if something is the winner, but the check for door two somehow issues
a precheck() that, for some reason, is deciding to sleep for a long time.
Our workshop application is left intentionally simple – a real-world service might see the
thread being sampled during a database call or calling into an un-traced external service.
It is also possible that a slow span is executing a complicated business process,
in which case maybe none of the stack traces relate to each other at all.
The longer a method or process is, the greater chance we will have call stacks
sampled during its execution.
Let’s Fix That Bug
By using the profiling tool, we were able to determine that our application is slow
when issuing the DoorChecker.precheck() method from inside DoorChecker.checkDoorTwo().
Let’s open the doorgame/src/main/java/com/splunk/profiling/workshop/DoorChecker.java source file in our editor.
By quickly glancing through the file, we see that there are methods for checking
each door, and all of them call precheck(). In a real service, we might be uncomfortable
simply removing the precheck() call because there could be unseen/unaccounted side
effects.
With our developer hat on, we notice that the door number is zero based, so
the first door is 0, the second is 1, and the 3rd is 2 (this is conventional).
The extra value is used as extra/additional sleep time, and it is computed by taking
70^doorNum (Math.pow performs an exponent calculation). That’s odd, because this means:
door 0 => 70^0 => 1ms
door 1 => 70^1 => 70ms
door 2 => 70^2 => 4900ms
We’ve found the root cause of our slow bug! This also explains why the first two doors
weren’t ever very slow.
We have a quick chat with our product manager and team lead, and we agree that the precheck()
method must stay but that the extra padding isn’t required. Let’s remove the extra variable
and make precheck now read like this:
privatevoidprecheck(intdoorNum){sleep(300);}
Now all doors will have a consistent behavior. Save your work and then rebuild and redeploy the application using the following command:
cd workshop/profiling
./5-redeploy-doorgame.sh
Once the application has been redeployed successfully, visit The Door Game again to confirm that your fix is in place:
http://<your IP address>:81
What did we accomplish?
We found another performance issue with our application that impacts game play.
We used the CPU call stacks included in the trace to understand application behavior.
We learned how the call stack can tell us a story and point us to suspect lines of code.
We identified the slow code and fixed it to make it faster.
Summary
3 minutes
In this workshop, we accomplished the following:
We deployed our application and captured traces with Splunk Observability Cloud.
We used Database Query Performance to find a slow-running query that impacted the game startup time.
We enabled AlwaysOn Profiling and used it to confirm which line of code was causing the increased startup time and memory usage.
We found another application performance issue and used AlwaysOn Profiling again to find the problematic line of code.
We applied fixes for both of these issues and verified the result using Splunk Observability Cloud.
Enabling AlwaysOn Profiling and utilizing Database Query Performance for your applications will let you get even more value from the data you’re sending to Splunk Observability Cloud.
Now that you’ve completed this workshop, you have the knowledge you need to start collecting deeper diagnostic data from your own applications!
Keep in mind throughout the workshop: how can I prioritize activities strategically to get the fastest time to value for my end users and for myself/ my developers?
Context
As a reminder, we need frontend performance monitoring to capture everything that goes into our end user experience. If we’re just monitoring the backend, we’re missing all of the other resources that are critical to our users’ success. Read What the Fastly Outage Can Teach Us About Observability for a real world example. Click the image below to zoom in.
References
Throughout this workshop, we will see references to resources to help further understand end user experience and how to optimize it. In addition to Splunk Docs for supported features and Lantern for tips and tricks, Google’s web.dev and Mozilla are great resources.
Remember that the specific libraries, platforms, and CDNs you use often also have their own specific resources. For example React, Wordpress, and Cloudflare all have their own tips to improve performance.
Subsections of Optimize End User Experiences
Synthetics
Let’s quickly set up some tests in Synthetics to immediately start understanding our end user experience, without waiting for real users to interact with our app.
We can capture not only the performance and availability of our own apps and endpoints, but also those third parties we rely on any time of the day or night.
The simplest way to keep an eye on endpoint availability is with an Uptime test. This lightweight test can run internally or externally around the world, as frequently as every minute. Because this is the easiest (and cheapest!) test to set up, and because this is ideal for monitoring availability of your most critical enpoints and ports, let’s start here.
Pre-requisites
Publicly accessible HTTP(S) endpoint(s) to test
Access to Splunk Observability Cloud
Subsections of Uptime Test
Creating a test
Open Synthetics
Click the Add new test button on the right side of the screen, then select Uptime and HTTP test.
Name your test with your team name (provided by your workshop instructor), your initials, and any other details you’d like to include, like geographic region.
Click Try now to validate that the endpoint is accessible before the selected location before saving the test. Try now does not count against your subscription usage, so this is a good practice to make sure you’re not wasting real test runs on a misconfigured test.
Tip
A common reason for Try now to fail is that there is a non-2xx response code. If that is expected, add a Validation for the correct response code.
Add any additional validations needed, for example: response code, response header, and response size.
Add and remove any locations you’d like. Keep in mind where you expect your endpoint to be available.
Change the frequency to test your more critical endpoints more often, up to one minute.
Make sure “Round-robin” is on so the test will run from one location at a time, rather than from all locations at once.
If an endpoint is highly critical, think about if it is worth it to have all locations tested at the same time every single minute. If you have automations built in with a webhook from a detector, or if you have strict SLAs you need to track, this could be worth it to have as much coverage as possible. But if you are doing more manual investigation, or if this is a less critical endpoint, you could be wasting test runs that are executing while an issue is being investigated.
Remember that your license is based on the number of test runs per month. Turning Round-robin off will multiply the number of test runs by the number of locations you have selected.
When you are ready for the test to start running, make sure “Active” is on, then scroll down and click Submit to save the test configuration.
Now the test will start running with your saved configuration. Take a water break, then we’ll look at the results!
Understanding results
Click into a test summary view and play with the Performance KPIs chart filters to see how you can slice and dice your data. This is a good place to get started understanding trends. Later, we will see what custom charts look like, so you can tailor dashboards to the KPIs you care about most.
Workshop Question: Using the Performance KPIs chart
What metrics are available? Is your data consistent across time and locations? Do certain locations run slower than others? Are there any spikes or failures?
Click into a recent run either in the chart or in the table below.
If there are failures, look at the response to see if you need to add a response code assertion (302 is a common one), if there is some authorization needed, or different request headers added. Here we have information about this particular test run including if it succeeded or failed, the location, timestamp, and duration in addition to the other Uptime test metrics. Click through to see the response, request, and connection info as well.
If you need to edit the test for it to run successfully, click the test name in the top left breadcrumb on this run result page, then click Edit test on the top right of the test overview page. Remember to scroll down and click Submit to save your changes after editing the test configuration.
In addition to the test running successfully, there are other metrics to measure the health of your endpoints. For example, Time to First Byte(TTFB) is a great indicator of performance, and you can optimize TTFB to improve end user experience.
Go back to the test overview page and change the Performance KPIs chart to display First Byte time, and change the interval if needed to better see trends in the data.
In the example above, we can see that TTFB varies consistently between locations. Knowing this, we can keep location in mind when reporting on metrics. We could also improve the experience, for example by serving users in those locations an endpoint hosted closer to them, which should reduce network latency. We can also see some slight variations in the results over time, but overall we already have a good idea of our baseline for this endpoint’s KPIs. When we have a baseline, we can alert on worsening metrics as well as visualize improvements.
Tip
We are not setting a detector on this test yet, to make sure it is running consistently and successfully. If you are testing a highly critical endpoint and want to be alerted on it ASAP (and have tolerance for potential alert noise), jump to Single Test Detectors.
Once you have your Uptime test running successfully, let’s move on to the next test type.
API Test
5 minutes
The API test provides a flexible way to check the functionality and performance of API endpoints. The shift toward API-first development has magnified the necessity to monitor the back-end services that provide your core front-end functionality.
Whether you’re interested in testing multi-step API interactions or you want to gain visibility into the performance of your endpoints, the API Test can help you accomplish your goals.
This excercise will walk through a multi-step test on the Spotify API. You can also use it as a reference to build tests on your own APIs or on those of your critical third parties.
Subsections of API Test
Global Variables
Global variables allow us to use stored strings in multiple tests, so we only need to update them in one place.
View the global variable that we’ll use to perform our API test. Click on Global Variables under the cog icon. The global variable named env.encoded_auth will be the one that we’ll use to build the spotify API transaction.
Create new API test
Create a new API test by clicking on the Add new test button and select API test from the dropdown. Name the test using your team name, your initials, and Spotify API e.g. [Daisy] RWC - Spotify API
Authentication Request
Click on + Add requests and enter the request step name e.g. Authenticate with Spotify API.
Expand the Request section, from the drop-down change the request method to POST and enter the following URL:
https://accounts.spotify.com/api/token
In the Payload body section enter the following:
grant_type=client_credentials
Next, add two + Request headers with the following key/value pairings:
CONTENT-TYPE: application/x-www-form-urlencoded
AUTHORIZATION: Basic {{env.encoded_auth}}
Expand the Validation section and add the following extraction:
Extract from Response bodyJSON$.access_token as access_token
This will parse the JSON payload that is received from the Spotify API, extract the access token and store it as a custom variable.
Search Request
Click on + Add Request to add the next step. Name the step Search for Tracks named “Up around the bend”.
Expand the Request section and change the request method to GET and enter the following URL:
Next, add two request headers with the following key/value pairings:
CONTENT-TYPE: application/json
AUTHORIZATION: Bearer {{custom.access_token}}
This uses the custom variable we created in the previous step!
Expand the Validation section and add the following extraction:
Extract from Response bodyJSON$.tracks.items[0].id as track.id
To validate the test before saving, change the location as needed and click Try now. See the docs for more information on the try now feature.
When the validation is successful, click on < Return to test to return to the test configuration page. And then click Save to save the API test.
Extra credit
Have more time to work on this test? Take a look at the Response Body in one of your run results. What additional steps would make this test more thorough? Edit the test, and use the Try now feature to validate any changes you make before you save the test.
View results
Wait for a few minutes for the test to provision and run. Once you see the test has run successfully, click on the run to view the results:
We have started testing our endpoints, now let’s test the front end browser experience.
Starting with a single page browser test will let us capture how first- and third-party resources impact how our end users experience our browser-based site. It also allows us to start to understand our user experience metrics before introducing the complexity of multiple steps in one test.
A page where your users commonly “land” is a good choice to start with a single page test. This could be your site homepage, a section main page, or any other high-traffic URL that is important to you and your end users.
Click Add new test and select Browser test
Include your team name and initials in the test name. Add to the Name and Custom properties to describe the scope of the test (like Desktop for device type). Then click + Edit steps
Change the transaction label (top left) and step name (on the right) to something readable that describes the step. Add the URL you’d like to test. Your workshop instructor can provide you with a URL as well. In the below example, the transaction is “Home” and the step name is “Go to homepage”.
To validate the test, change the location as needed and click Try now. See the docs for more information on the try now feature.
Wait for the test validation to complete. If the test validation failed, double check your URL and test location and try again. With Try now you can see what the result of the test will be if it were saved and run as-is.
Click < Return to test to continue the configuration.
Edit the locations you want to use, keeping in mind any regional rules you have for your site.
You can edit the Device and Frequency or leave them at their default values for now. Click Submit to save the test and start running it.
Bonus Exercise
Have a few spare seconds? Copy this test and change just the title and device type, and save. Now you have visibility into the end user experience on another device and connection speed!
While our Synthetic tests are running, let’s see how RUM is instrumented to start getting data from our real users.
RUM
15 minutes
With RUM instrumented, we will be able to better understand our end users, what they are doing, and what issues they are encountering.
This workshop walks through how our demo site is instrumented and how to interpret the data. If you already have a RUM license, this will help you understand how RUM works and how you can use it to optimize your end user experience.
The aim of this Splunk Real User Monitoring (RUM) workshop is to let you:
Shop for items on the Online Boutique to create traffic, and create RUM User Sessions1 that you can view in the Splunk Observability Suite.
See an overview of the performance of all your application(s) in the Application Summary Dashboard
Examine the performance of a specific website with RUM metrics.
In order to reach this goal, we will use an online boutique to order various products. While shopping on the online boutique you will create what is called a User Session.
You may encounter some issues with this web site, and you will use Splunk RUM to identify the issues, so they can be resolved by the developers.
The workshop host will provide you with a URL for an online boutique store that has RUM enabled.
Each of these Online Boutiques are also being visited by a few synthetic users; this will allow us to generate more live data to be analyzed later.
A RUM User session is a “recording” of a collection of user interactions on an application, basically collecting a website or app’s performance measured straight from the browser or Mobile App of the end user. To do this a small amount of JavaScript is embedded in each page. This script then collects data from each user as he or she explores the page, and transfers that data back for analysis. ↩︎
RUM instrumentation in a browser app
Check the HEAD section of the Online-boutique webpage in your browser
Find the code that instruments RUM
1. Browse to the Online Boutique
Your workshop instructor will provide you with the Online Boutique URL that has RUM installed so that you can complete the next steps.
2. Inspecting the HTML source
The changes needed for RUM are placed in the <head> section of the hosts Web page. Right click to view the page source or to inspect the code. Below is an example of the <head> section with RUM:
This code enables RUM Tracing, Session Replay, and Custom Events to better understand performance in the context of user workflows:
The first part is to indicate where to download the Splunk Open Telemetry Javascript file from: https://cdn.signalfx.com/o11y-gdi-rum/latest/splunk-otel-web.js (this can also be hosted locally if so required).
The next section defines the location where to send the traces to in the beacon url: {beaconUrl: "https://rum-ingest.eu0.signalfx.com/v1/rum"
The RUM Access Token: rumAuth: "<redacted>".
Identification tags app and environment to indentify in the SPLUNK RUM UI e.g. app: "online-boutique-us-store", environment: "online-boutique-us"} (these values will be different in your workshop)
The above lines 21 and 23-30 are all that is required to enable RUM on your website!
Lines 22 and 31-34 are optional if you want Session Replay instrumented.
Line 36-39 var tracer=Provider.getTracer('appModuleLoader'); will add a Custom Event for every page change, allowing you to better track your website conversions and usage. This may or may not be instrumented for this workshop.
Exercise
Time to shop! Take a minute to open the workshop store URL in as many browsers and devices as you’d like, shop around, add items to cart, checkout, and feel free to close the shopping browsers when you’re finished. Keep in mind this is a lightweight demo shop site, so don’t be alarmed if the cart doesn’t match the item you picked!
RUM Landing Page
Visit the RUM landing page and and check the overview of the performance of all your RUM enabled applications with the Application Summary Dashboard (Both Mobile and Web based)
1. Visit the RUM Landing Page
Login into Splunk Observability. From the left side menu bar select RUM. This will bring you to your the RUM Landing Page.
The goal of this page is to give you in a single page, a clear indication of the health, performance and potential errors found in your application(s) and allow you to dive deeper into the information about your User Sessions collected from your web page/App. You will have a pane for each of your active RUM applications. (The view below is the default expanded view)
If you have multiple applications, (which will be the case when every attendee is using their own ec2 instance for the RUM workshop), the pane view may be automatically reduced by collapsing the panes as shown below:
You can expanded a condensed RUM Application Summary View to the full dashboard by clicking on the small browser or Mobile icon. (Depending on the type of application: Mobile or Browser based) on the left in front of the applications name, highlighted by the red arrow.
First find the right application to use for the workshop:
If you are participating in a stand alone RUM workshop, the workshop leader will tell you the name of the application to use, in the case of a combined workshop, it will follow the naming convention we used for IM and APM and use the ec2 node name as a unique id like jmcj-store as shown as the last app in the screenshot above.
2. Configure the RUM Application Summary Dashboard Header Section
RUM Application Summary Dashboard consists of 6 major sections. The first is the selection header, where you can set/filter a number of options:
A drop down for the Time Window you’re reviewing (You are looking at the past 15 minutes by default)
A drop down to select the Environment1 you want to look at. This allows you to focus on just the subset of applications belonging to that environment, or Select all to view all available.
A drop down list with the various Apps being monitored. You can use the one provided by the workshop host or select your own. This will focus you on just one application.
A drop down to select the Source, Browser or Mobile applications to view. For the Workshop leave All selected.
A hamburger menu located at the right of the header allowing you to configure some settings of your Splunk RUM application. (We will visit this in a later section).
For the workshop lets do a deeper dive into the Application Summary screen in the next section: Check Health Browser Application
A common application deployment pattern is to have multiple, distinct application environments that don’t interact directly with each other but that are all being monitored by Splunk APM or RUM: for instance, quality assurance (QA) and production environments, or multiple distinct deployments in different datacenters, regions or cloud providers.
A deployment environment is a distinct deployment of your system or application that allows you to set up configurations that don’t overlap with configurations in other deployments of the same application. Separate deployment environments are often used for different stages of the development process, such as development, staging, and production. ↩︎
Check Browser Applications health at a glance
Get familiar with the UI and options available from this landing page
Identify Page Views/JavaScript Errors and Request/Errors in a single viewCheck the Web Vitals metrics and any Detector that has fired for in relation to your Browser Application
Application Summary Dashboard
1.Header Bar
As seen in the previous section the RUM Application Summary Dashboard consists of 5 major sections.The first section is the selection header, where you can collapse the Pane via the Browser icon or the > in front of the application name, which is jmcj-store in the example below. It also provides access to the Application Overview page if you click the link with your application name which is jmcj-store in the example below.
Further, you can also open the Application Overview or App Health Dashboard via the triple dot menu on the right.
For now, let’s look at the high level information we get on the application summary dashboard.
The RUM Application Summary Dashboard is focused on providing you with at a glance highlights of the status of your application.
The first section shows Page Views / JavaScript Errors, & Network Requests and Errors charts show the quantity and trend of these issues in your application. This could be Javascript errors, or failed network calls to back end services.
In the example above you can see that there are no failed network calls in the Network chart, but in the Page View chart you can see that a number of pages do experience some errors. These are often not visible for regular users, but can seriously impact the performance of your web site.
You can see the count of the Page Views / Network Requests / Errors by hovering over the charts.
3. JavaScript Errors
With the second section of the RUM Application Summary Dashboard we are showing you an overview of the JavaScript errors occurring in your application, along with a count of each error.
In the example above you can see there are three JavaScript errors, one that appears 29 times in the selected time slot, and the other two each appear 12 times.
If you click on one of the errors a pop-out opens that will show a summary (below) of the errors over time, along with a Stack Trace of the JavaScript error, giving you an indication of where the problems occurred. (We will see this in more detail in one of the following sections)
4. Web Vitals
The next section of the RUM Application Summary Dashboard is showing you Google’s Core Web Vitals, three metrics that are not only used by Google in its search ranking system, but also quantify end user experience in terms of loading, interactivity, and visual stability.
As you can see our site is well behaved and scores Good for all three Metrics. These metrics can be used to identify the effect changes to your application have, and help you improve the performance of your site.
If you click on any of the Metrics shown in the Web Vitals pane you will be taken to the corresponding Tag Spotlight Dashboard. e.g. clicking on the Largest Contentful Paint (LCP) chartlet, you will be taken to a dashboard similar to the screen shot below, that gives you timeline and table views for how this metric has performed. This should allow you to spot trends and identify where the problem may be more common, such as an operating system, geolocation, or browser version.
5. Most Recent Detectors
The final section of the RUM Application Summary Dashboard is focused on providing you an overview of recent detectors that have triggered for your application. We have created a detector for this screen shot but your pane will be empty for now. We will add some detectors to your site and make sure they are triggered in one of the next sections.
In the screen shot you can see we have a critical alert for the RUM Aggregated View Detector, and a Count, how often this alert has triggered in the selected time window. If you happen to have an alert listed, you can click on the name of the Alert (that is shown as a blue link) and you will be taken to the Alert Overview page showing the details of the alert (Note: this will move you away from the current page, Please use the Back option of your browser to return to the overview page).
Exercise
Please take a few minutes to experiment with the RUM Application Summary Dashboard and the underlying chart and dashboards before going on to the next section.
Analyzing RUM Metrics
See RUM Metrics and Session information in the RUM UI
See correlated APM traces in the RUM & APM UI
1. RUM Overview Pages
From your RUM Application Summary Dashboard you can see detailed information by opening the Application Overview Page via the tripple dot menu on the right by selecting Open Application Overview or by clicking the link with your application name which is jmcj-rum-app in the example below.
This will take you to the RUM Application Overview Page screen as shown below.
2. RUM Browser Overview
2.1. Header
The RUM UI consists of five major sections. The first is the selection header, where you can set/filter a number of options:
A drop down for the time window you’re reviewing (You are looking at the past 15 minutes in this case)
A drop down to select the Comparison window (You are comparing current performance on a rolling window - in this case compared to 1 hour ago)
A drop down with the available Environments to view
A drop down list with the Various Web apps
Optionally a drop down to select Browser or Mobile metrics (Might not be available in your workshop)
2.2. UX Metrics
By default, RUM prioritizes the metrics that most directly reflect the experience of the end user.
Additional Tags
All of the dashboard charts allow us to compare trends over time, create detectors, and click through to further diagnose issues.
First, we see page load and route change information, which can help us understand if something unexpected is impacting user traffic trends.
Next, Google has defined Core Web Vitals to quantify the user experience as measured by loading, interactivity, and visual stability. Splunk RUM builds in Google’s thresholds into the UI, so you can easily see if your metrics are in an acceptable range.
Largest Contentful Paint (LCP), measures loading performance. How long does it take for the largest block of content in the viewport to load? To provide a good user experience, LCP should occur within 2.5 seconds of when the page first starts loading.
First Input Delay (FID), measures interactivity. How long does it take to be able to interact with the app? To provide a good user experience, pages should have a FID of 100 milliseconds or less.
Cumulative Layout Shift (CLS), measures visual stability. How much does the content move around after the initial load? To provide a good user experience, pages should maintain a CLS of 0.1. or less.
Improving Web Vitals is a key component to optimizing your end user experience, so being able to quickly understand them and create detectors if they exceed a threshold is critical.
Common causes of frontend issues are javascript errors and long tasks, which can especially affect interactivity. Creating detectors on these indicators helps us investigate interactivity issues sooner than our users report it, allowing us to build workarounds or roll back related releases faster if needed. Learn more about optimizing long tasks for better end user experience!
2.4. Back-end health
Common back-end issues affecting user experience are network issues and resource requests. In this example, we clearly see a spike in Time To First Byte that lines up with a resource request spike, so we already have a good starting place to investigate.
Time To First Byte (TTFB), measures how long it takes for a client’s browser to receive the first byte of the response from the server. The longer it takes for the server to process the request and send a response, the slower your visitors’ browser is at displaying your page.
Analyzing RUM Tags in the Tag Spotlight view
Look into the Metrics views for the various endpoints and use the Tags sent via the Tag spotlight for deeper analysis
1. Find an url for the Cart endpoint
From the RUM Overview page, please select the url for the Cart endpoint to dive deeper into the information available for this endpoint.
Once you have selected and clicked on the blue url, you will find yourself in the Tag Spotlight overview
Here you will see all of the tags that have been sent to Splunk RUM as part of the RUM traces. The tags displayed will be relevant to the overview that you have selected. These are generic Tags created automatically when the Trace was sent, and additional Tags you have added to the trace as part of the configuration of your website.
Additional Tags
We are already sending two additional tags, you have seen them defined in the Beacon url that was added to your website: app: "[nodename]-store", environment: "[nodename]-workshop" in the first section of this workshop! You can add additional tags in a similar way.
In our example we have selected the Document Load Latency view as shown here:
You can select any of the following Tag views, each focused on a specific metric.
2. Explore the information in the Tag Spotlight view
The Tag spotlight is designed to help you identify problems, either through the chart view,, where you may quickly identify outliers or via the TAGs.
In the Document Load Latency view, if you look at the Browser, Browser Version & OS Name Tag views,you can see the various browser types and versions, as well as for the underlying OS.
This makes it easy to identify problems related to specific browser or OS versions, as they would be highlighted.
In the above example you can see that Firefox had the slowest response, various Browser versions ( Chrome) that have different response times and the slow response of the Android devices.
A further example are the regional Tags that you can use to identify problems related to ISP or locations etc. Here you should be able to find the location you have been using to access the Online Boutique. Drill down by selecting the town or country you are accessing the Online Boutique from by clicking on the name as shown below (City of Amsterdam):
This will select only the traces relevant to the city selected as shown below:
By selecting the various Tag you build up a filter, you can see the current selection below
To clear the filter and see every trace click on Clear All at the top right of the page.
If the overview page is empty or shows , no traces have been received in the selected timeslot.
You need to increase the time window at the top left. You can start with the Last 12 hours for example.
You can then use your mouse to select the time slot you want like show in the view below and activate that time filter by clicking on the little spyglass icon.
Analyzing RUM Sessions
Dive into RUM Session information in the RUM UI
Identify Javascript errors in the Span of an user interaction
1. Again select the cart URL
After you have focussed the time slot with the time selector, you need to reselect the cart url from Url Name view, as shown below:
In the example above we selected http://34.246.124.162:81/cart
2. Drill down in the Sessions
After you have analyzed the information and drilled down via the Tag Spotlight to a subset of the traces, you can view the actual session as it was run by the end-user’s browser.
You do this by clicking on the link Example Sessions as shown below:
This will give you a list of sessions that matched both the time filter and the subset selected in the Tag Profile.
Select one by clicking on the session ID, It is a good idea to select one that has the longest duration (preferably over 700 ms).
Once you have selected the session, you will be taken to the session details page. As you are selecting a specific action that is part of the session, you will likely arrive somewhere in the middle of the session, at the moment of the interaction.
You can see the URL http://34.246.124.162:81/cart, the one you selected earlier, is where we are focusing on in the session stream.
Scroll down a little bit on the page, so you see the end of the operation as shown below.
You can see that we have received a few Javascript Console errors that may not have been detected or visible to the end users. To examine these in more detail click on the middle one that says: *Cannot read properties of undefined (reading ‘Prcie’)
This will cause the page to expand and show the Span detail for this interaction, It will contain a detailed error.stack you can pass on the developer to solve the issue. You may have noticed when buying in the Online Boutique that the final total always was $0.00.
Advanced Synthetics
30 minutes
Introduction
This workshop walks you through using the Chrome DevTools Recorder to create a synthetic test on a Splunk demonstration environment or on your own public website.
The exported JSON from the Chrome DevTools Recorder will then be used to create a Splunk Synthetic Monitoring Real Browser Test.
Write down a short user journey you want to test. Remember: smaller bites are easier to chew! In other words, get started with just a few steps. This is easier not only to create and maintain the test, but also to understand and act on the results. Test the essential features to your users, like a support contact form, login widget, or date picker.
Note
Record the test in the same type of viewport that you want to run it. For example, if you want to run a test on a mobile viewport, narrow your browser width to mobile and refresh before starting the recording. This way you are capturing the correct elements that could change depending on responsive style rules.
Open your starting URL in Chrome Incognito. This is important so you’re not carrying cookies into the recording, which we won’t set up in the Synthetic test by default. If you workshop instructor does not have a custom URL, feel free to use https://online-boutique-eu.splunko11y.com or https://online-boutique-us.splunko11y.com, which are in the examples below.
Open the Chrome DevTools Recorder
Next, open the Developer Tools (in the new tab that was opened above) by pressing Ctrl + Shift + I on Windows or Cmd + Option + I on a Mac, then select Recorder from the top-level menu or the More tools flyout menu.
Note
Site elements might change depending on viewport width. Before recording, set your browser window to the correct width for the test you want to create (Desktop, Tablet, or Mobile). Change the DevTools “dock side” to pop out as a separate window if it helps.
Create a new recording
With the Recorder panel open in the DevTools window. Click on the Create a new recording button to start.
For the Recording Name use your initials to prefix the name of the recording e.g. <your initials> - <website name>. Click on Start Recording to start recording your actions.
Now that we are recording, complete a few actions on the site. An example for our demo site is:
Click on Vintage Camera Lens
Click on Add to Cart
Click on Place Order
Click on End recording in the Recorder panel.
Export the recording
Click on the Export button:
Select JSON as the format, then click on Save
Congratulations! You have successfully created a recording using the Chrome DevTools Recorder. Next, we will use this recording to create a Real Browser Test in Splunk Synthetic Monitoring.
{"title":"RWC - Online Boutique","steps":[{"type":"setViewport","width":1430,"height":1016,"deviceScaleFactor":1,"isMobile":false,"hasTouch":false,"isLandscape":false},{"type":"navigate","url":"https://online-boutique-eu.splunko11y.com/","assertedEvents":[{"type":"navigation","url":"https://online-boutique-eu.splunko11y.com/","title":"Online Boutique"}]},{"type":"click","target":"main","selectors":[["div:nth-of-type(2) > div:nth-of-type(2) a > div"],["xpath//html/body/main/div/div/div[2]/div[2]/div/a/div"],["pierce/div:nth-of-type(2) > div:nth-of-type(2) a > div"]],"offsetY":170,"offsetX":180,"assertedEvents":[{"type":"navigation","url":"https://online-boutique-eu.splunko11y.com/product/66VCHSJNUP","title":""}]},{"type":"click","target":"main","selectors":[["aria/ADD TO CART"],["button"],["xpath//html/body/main/div[1]/div/div[2]/div/form/div/button"],["pierce/button"],["text/Add to Cart"]],"offsetY":35.0078125,"offsetX":46.4140625,"assertedEvents":[{"type":"navigation","url":"https://online-boutique-eu.splunko11y.com/cart","title":""}]},{"type":"click","target":"main","selectors":[["aria/PLACE ORDER"],["div > div > div.py-3 button"],["xpath//html/body/main/div/div/div[4]/div/form/div[4]/button"],["pierce/div > div > div.py-3 button"],["text/Place order"]],"offsetY":29.8125,"offsetX":66.8203125,"assertedEvents":[{"type":"navigation","url":"https://online-boutique-eu.splunko11y.com/cart/checkout","title":""}]}]}
Create a Browser Test
In Splunk Observability Cloud, navigate to Synthetics and click on Add new test.
From the dropdown select Browser test.
You will then be presented with the Browser test content configuration page.
Import JSON
To begin configuring our test, we need to import the JSON that we exported from the Chrome DevTools Recorder. To enable the Import button, we must first give our test a name e.g. [<your team name>] <your initials> - Online Boutique.
Once the Import button is enabled, click on it and either drop the JSON file that you exported from the Chrome DevTools Recorder or upload the file.
Once the JSON file has been uploaded, click on Continue to edit steps
Before we make any edits to the test, let’s first configure the settings, click on < Return to test
Test settings
The simple settings allow you to configure the basics of the test:
Name: The name of the test (e.g. RWC - Online Boutique).
Details:
Locations: The locations where the test will run from.
Device: Emulate different devices and connection speeds. Also, the viewport will be adjusted to match the chosen device.
Frequency: How often the test will run.
Round-robin: If multiple locations are selected, the test will run from one location at a time, rather than all locations at once.
Active: Set the test to active or inactive.
![Return to Test]For this workshop, we will configure the locations that we wish to monitor from. Click in the Locations field and you will be presented with a list of global locations (over 50 in total).
Select the following locations:
AWS - N. Virginia
AWS - London
AWS - Melbourne
Once complete, scroll down and click on Click on Submit to save the test.
The test will now be scheduled to run every 5 minutes from the 3 locations that we have selected. This does take a few minutes for the schedule to be created.
So while we wait for the test to be scheduled, click on Edit test so we can go through the Advanced settings.
Advanced Test Settings
Click on Advanced, these settings are optional and can be used to further configure the test.
Note
In the case of this workshop, we will not be using any of these settings; this is for informational purposes only.
Security:
TLS/SSL validation: When activated, this feature is used to enforce the validation of expired, invalid hostname, or untrusted issuer on SSL/TLS certificates.
Authentication: Add credentials to authenticate with sites that require additional security protocols, for example from within a corporate network. By using concealed global variables in the Authentication field, you create an additional layer of security for your credentials and simplify the ability to share credentials across checks.
Custom Content:
Custom headers: Specify custom headers to send with each request. For example, you can add a header in your request to filter out requests from analytics on the back end by sending a specific header in the requests. You can also use custom headers to set cookies.
Cookies: Set cookies in the browser before the test starts. For example, to prevent a popup modal from randomly appearing and interfering with your test, you can set cookies. Any cookies that are set will apply to the domain of the starting URL of the check. Splunk Synthetics Monitoring uses the public suffix list to determine the domain.
Host overrides: Add host override rules to reroute requests from one host to another. For example, you can create a host override to test an existing production site against page resources loaded from a development site or a specific CDN edge node.
Next, we will edit the test steps to provide more meaningful names for each step.
Edit test steps
To edit the steps click on the + Edit steps or synthetic transactions button. From here, we are going to give meaningful names to each step.
For each step, we are going to give them a meaningful, readable name. That could look like:
Step 1 replace the text Go to URL with Go to Homepage
Step 2 enter the text Select Typewriter.
Step 3 enter Add to Cart.
Step 4 enter Place Order.
Note
If you’d like, group the test steps into Transactions and edit the transaction names. This is especially useful for Single Page Apps (SPAs), where the resource waterfall is not split by URL. We can also create charts and alerts based on transactions.
Click < Return to test to return to the test configuration page and click Save to save the test.
You will be returned to the test dashboard where you will see test results start to appear.
Congratulations! You have successfully created a Real Browser Test in Splunk Synthetic Monitoring. Next, we will look into a test result in more detail.
View test results
1. Click into a spike or failure in your test run results.
2. What can you learn about this test run? If it failed, use the error message, filmstrip, video replay, and waterfall to understand what happened.
3. What do you see in the resources? Make sure to click through all of the page (or transaction) tabs.
Workshop Question
Do you see anything interesting? Common issues to find and fix include: unexpected response codes, duplicate requests, forgotten third parties, large or slow files, and long gaps between requests.
Want to learn more about specific performance improvements? Google and Mozilla have great resources to help understand what goes into frontend performance as well as in-depth details of how to optimize it.
Frontend Dashboards
15 minutes
Go to Dashboards and find the End User Experiences dashboard group.
Click the three dots on the top right to open the dashboard menu, and select Save As, and include your team name and initials in the dashboard name.
Save to the dashboard group that matches your email address. Now you have your own copy of this dashboard to customize!
Subsections of Frontend Dashboards
Copying and editing charts
We have some good charts in our dashboard, but let’s add a few more.
Go to Dashboards by clicking the dasboard icon on the left side of the screen. Find the Browser app health dashboard and scroll to the Largest Contentful Paint (LCP) chart. Click the chart actions icon to open the flyout menu, and click “Copy” to add this chart to your clipboard.
Now you can continue to add any other charts to your clipboard by clicking the “add to clipboard” icon.
When you have collected the charts you want on your dashboard, click the “create” icon on the top right. You might need to reload the page if you were looking at charts in another browser tab.
Click the “Paste charts” menu option.
Now you are able to resize and edit the charts as you’d like!
Bonus: edit chart data
Click the chart actions icon and select Open to edit the chart.
Remove the existing Test signal.
Click Add filter and type test: *yourInitials*. This will use a wildcard match so that all of the tests you have created that contain your initials (or any string you decide) will be pulled into the chart.
Click into the functions to see how adding and removing dimensions changes how the data is displayed. For example, if you want all of your test location data rolled up, remove that dimension from the function.
Change the chart name and description as appropriate, and click “Save and close” to commit your changes or just “Close” to cancel your changes.
Events in context with chart data
Seeing the visualization of our KPIs is great. What’s better? KPIs in context with events! Overlaying events on a dashboard can help us more quickly understand if an event like a deployment caused a change in metrics, for better or worse.
Your instructor will push a condition change to the workshop application. Click the event marker on any of your dashboard charts to see more details.
In the dimensions, we can see more details about this specific event. If we click the event record, we can mark for deletion if needed.
We can also see a history of events in the event feed by clicking the icon on the top right of the screen, and selecting Event feed.
Again, we can see details about recent events in this feed.
We can also add new events in the GUI or via API. To add a new event in the GUI, click the New event button.
Name your event with your team name, initials, and what kind of event it is (deployment, campaign start, etc). Choose a timestamp, or leave as-is to use the current time, and click “Create”.
Now, we need to make sure our new event is overlaid in this dashboard. Wait a minute or so (refresh the page if needed) and then search for the event in the Event overlay field.
If your event is within the dashboard time window, you should now see it overlaid in your charts. Click “Save” to make sure your event overlay is saved to your dashboard!
Keep in mind
Want to add context to that bug ticket, or show your manager how your change improved app performance? Seeing observability data in context with events not only helps with troubleshooting, but also helps us communicate with other teams.
Detectors
20 minutes
After we have a good understanding of our performance baseline, we can start to create Detectors so that we receive alerts when our KPIs are unexpected. If we create detectors before understanding our baseline, we run the risk of generating unnecessary alert noise.
For RUM and Synthetics, we will explore how to create detectors:
on a single Synthetic test
on a single KPI in RUM
on a dashboard chart
For more Detector resources, please see our Observability docs, Lantern, and consider an Education course if you’d like to go more in depth with instructor guidance.
The endpoint, API transaction, or browser journey is highly critical
We have deployed code changes and want to know if the resulting KPI is or is not as we expect
We need to temporarily keep a close eye on a specific change we are testing and don’t want to create a lot of noise, and will disable the detector later
We want to know about unexpected issues before a real user encounters them
On the test overview page, click Create Detector on the top right.
Name the detector with your team name and your initials and LCP (the signal we will eventually use), so that the instructor can better keep track of everyone’s progress.
Change the signal to First byte time.
Change the alert details, and see how the chart to the right shows the amount of alert events under those conditions. This is where you can decide how much alert noise you want to generate, based on how much your team tolerates. Play with the settings to see how they affect estimated alert noise.
Now, change the signal to Largest contentful paint. This is a key web vital related to the user experience as it relates to loading time. Change the threshold to 2500ms. It’s okay if there is no sample alert event in the detector preview.
Scroll down in this window to see the notification options, including severity and recipients.
Click the notifications link to customize the alert subject, message, tip, and runbook link.
When you are happy with the amount of alert noise this detector would generate, click Activate.
RUM Detectors
Let’s say we want to know about an issue in production without waiting for a ticket from our support center. This is where creating detectors in RUM will be helpful for us.
Go to the RUM view of the Syncreator App. Scroll to the LCP chart, click the chart menu icon, and click Create Detector.
Rename the test to include your team name and initials, and change the scope of the detector to App so we are not limited to a single URL or page. Change the threshold and sensitivity until there is at least one alert event in the time frame.
Change the alert severity and add a recipient if you’d like, and click Activate to save the Detector.
Exercise
Now, your workshop instructor will change something on the website. How do you find out about the issue, and how do you investigate it?
Tip
Wait a few minutes, and take a look at the online store homepage in your browser. How is the experience in an incognito browser window? How is it different when you refresh the page?
Chart Detectors
With our custom dashboard charts, we can create detectors focussed directly on the data and conditions we care about. In building our charts, we also built signals that can trigger alerts.
Static detectors
For many KPIs, we have a static value in mind as a threshold.
In your custom End User Experience dashboard, go to the “LCP - all tests” chart.
Click the bell icon on the top right of the chart, and select “New detector from chart”
Change the detector name to include your team name and initials, and adjust the alert details. Change the threshold to 2500 or 4000 and see how the alert noise preview changes.
Change the severity, and add yourself as a recipient before you save this detector. Click Activate.
Advanced: Dynamic detectors
Sometimes we have metrics that vary naturally, so we want to create a more dynamic detector that isn’t limited by the static threshold we decide in the moment.
To create dynamic detectors on your chart, click the link to the “old” detector wizard.
Change the detector name to include your team name and initials, and Click Create alert rule
Confirm the signal looks correct and proceed to Alert condition.
Select the “Sudden Change” condition and proceed to Alert settings
Play with the settings and see how the estimated alert noise is previewed in the chart above. Tune the settings, and change the advanced settings if you’d like, before proceeding to the Alert message.
Customize the severity, runbook URL, any tips, and message payload before proceeding to add recipients.
For the sake of this workshop, only add your own email address as recipient. This is where you would add other options like webhooks, ticketing systems, and Slack channels if it’s in your real environment.
Finally, confirm the detector name before clicking Activate Alert Rule
Summary
2 minutes
In this workshop, we learned the following:
How to create simple synthetic tests so that we can quickly begin to understand the availability and performance of our application
How to understand what RUM shows us about the end user experience, including specific user sessions
How to write advanced synthetic browser tests to proactively test our most important user actions
How to visualize our frontend performance data in context with events on dashboards
How to set up detectors so we don’t have to wait to hear about issues from our end users
How all of the above, plus Splunk and Google’s resources, helps us optimize end user experience
There is a lot more we can do with front end performance monitoring. If you have extra time, be sure to play with the charts, detectors, and do some more synthetic testing. Remember our resources such as Lantern, Splunk Docs, and experiment with apps for Mobile RUM.
This is just the beginning! If you need more time to trial Splunk Observability, or have any other questions, reach out to a Splunk Expert.
Self-Service Observability
1 minuteAuthor
Bill Grant
Splunk Observability Cloud includes powerful features that help central platform teams that are responsible for creating consistency, standards and best practices in an organization.
This workshop will go through some of the ways to apply standardization in your Observability practice.
We will cover:
Collecting data with standards, and applying metadata at various points in the process
Managing costs, by reviewing metrics and applying metrics pipeline management to it
Configuring Observability-as-code, using terraform and api’s
We will use a variety of scripts to demonstrate these examples. Be sure to pick a unique name, so your data won’t cross over with anyone else taking the workshop at the same time.
Let’s get started!
Tip
The easiest way to navigate through this workshop is by using:
the left/right arrows (< | >) on the top right of this page
the left (◀️) and right (▶️) cursor keys on your keyboard
Subsections of Self-Service Observability
Background
3 minutes
Background
Let’s review a few background concepts on Open Telemetry before jumping into the details.
First we have the Open Telemetry Collector, which lives on hosts or kubernetes nodes. These collectors can collect local information (like cpu, disk, memory, etc.). They can also collect metrics from other sources like prometheus (push or pull) or databases and other middleware.
The final piece is applications which are instrumented; they will send traces (spans), metrics, and logs.
By default the instrumentation is designed to send data to the local collector (on the host or kubernetes node). This is desirable because we can then add metadata on it – like which pod or which node/host the application is running on.
Collect Data with Standards
10 minutes
Introduction
For this workshop, we’ll be doing things that only a central tools or administration would do.
The workshop uses scripts to help with steps that aren’t part of the focus of this workshop – like how to change a kubernetes app, or start an application from a host.
Tip
It can be useful to review what the scripts are doing.
So along the way it is advised to run cat <filename> from time to time to see what that step just did.
The workshop won’t call this out, so do it when you are curious.
We’ll also be running some scripts to simulate data that we want to deal with.
A simplified version of the architecture (leaving aside the specifics of kubernetes) will look something like the following:
The App sends metrics and traces to the Otel Collector
The Otel Collector also collects metrics of its own
The Otel Collector adds metadata to its own metrics and data that passes through it
The OTel Gateway offers another opportunity to add metadata
Let’s start by deploying the gateway.
Subsections of Collect Data with Standards
Deploy Gateway
5 minutes
Gateway
First we will deploy the OTel Gateway. The workshop instructor will deploy the gateway, but we will walk through the steps here if you wish to try this yourself on a second instance.
The steps:
Click the Data Management icon in the toolbar
Click the + Add integration button
Click Deploy the Splunk OpenTelemetry Collector button
Click Next
Select Linux
Change mode to Data forwarding (gateway)
Set the environment to prod
Choose the access token for this workshop
Click Next
Copy the installer script and run it in the provided linux environment.
Once our gateway is started we will notice… Nothing. The gateway, by default, doesn’t send any data. It can be configured to send data, but it doesn’t by default.
And see that the config being used is gateway_config.yaml.
Tip
Diagrams created with OTelBin.io. Click on them to see them in detail.
Diagram
What it Tells Us
Metrics: The gateway will receive metrics over otlp or signalfx protocols, and then send these metrics to Splunk Observability Cloud with the signalfx protocol.
There is also a pipeline for prometheus metrics to be sent to Splunk. That pipeline is labeled internal and is meant to be for the collector. (In other words if we want to receive prometheus directly we should add it to the main pipeline.)
Traces: The gateway will receive traces over jaeger, otlp, sapm, or zipkin and then send these traces to Splunk Observability Cloud with the sapm protocol.
Logs: The gateway will receive logs over otlp and then send these logs to 2 places: Splunk Enterprise (Cloud) (for logs) and Splunk Observability Cloud (for profiling data).
There is also a pipeline labeled signalfx that is sending signalfx to Splunk Observability Cloud; these are events that can be used to add events to charts, as well as the process list.
We’re not going to see any host metrics, and we aren’t send any other data through the gateway yet. But we do have the internal metrics being sent in.
You can find it by creating a new chart and adding a metric:
Click the + in the top-right
Click Chart
For the signal of Plot A, type otelcol_process_uptime
Add a filter with the + to the right, and type: host.id:<name of instance>
You should get a chart like the following:
You can look at the Metric Finder to find other internal metrics to explore.
Add Metadata
Before we deploy a collector (agent) let’s add some metada onto metrics and traces with the gateway. That’s how we will know data is passing through it.
We can make sure it is still running fine by checking the status:
sudo systemctl status splunk-otel-collector.service
Next
Next, let’s deploy a collector and then configure it to this gateway.
Deploy Collector (Agent)
10 minutes
Collector (Agent)
Now we will deploy a collector. At first this will be configured to go directly to the back-end, but we will change the configuration and restart the collector to use the gateway.
The steps:
Click the Data Management icon in the toolbar
Click the + Add integration button
Click Deploy the Splunk OpenTelemetry Collector button
Click Next
Select Linux
Leave the mode as Host monitoring (agent)
Set the environment to prod
Leave the rest as defaults
Choose the access token for this workshop
Click Next
Copy the installer script and run it in the provided linux environment.
This collector is sending host metrics, so you can find it in common navigators:
Click the Infrastructure icon in the toolbar
Click the EC2 panel under Amazon Web Services
The AWSUniqueId is the easiest thing to find; add a filter and look for it with a wildcard (i.e. i-0ba6575181cb05226*)
We can also simply look at the cpu.utilization metric. Create a new chart to display it, filtered on the AWSUniqueId:
The reason we wanted to do that is so we can easily see the new dimension added on once we send the collector through the gateway. You can click on the Data table to see the dimensions currently being sent:
Next
Next we’ll reconfigure the collector to send to the gateway.
Reconfigure Collector
10 minutes
Reconfigure Collector
To reconfigure the collector we need to make these changes:
In agent_config.yaml
We need to adjust the signalfx exporter to use the gateway
The otlp exporter is already there, so we leave it alone
We need to change the pipelines to use otlp
In splunk-otel-collector.conf
We need to set the SPLUNK_GATEWAY_URL to the url provided by the instructor
exporters:# Metrics + Eventssignalfx:access_token:"${SPLUNK_ACCESS_TOKEN}"#api_url: "${SPLUNK_API_URL}"#ingest_url: "${SPLUNK_INGEST_URL}"# Use instead when sending to gatewayapi_url:"http://${SPLUNK_GATEWAY_URL}:6060"ingest_url:"http://${SPLUNK_GATEWAY_URL}:9943"sync_host_metadata:truecorrelation:# Send to gatewayotlp:endpoint:"${SPLUNK_GATEWAY_URL}:4317"tls:insecure:true
The others you can leave as they are but they won’t be used, as you will see in the pipelines.
The pipeline changes (you can see the items commented out and uncommented out):
service:pipelines:traces:receivers:[jaeger, otlp, smartagent/signalfx-forwarder, zipkin]processors:- memory_limiter- batch- resourcedetection#- resource/add_environment#exporters: [sapm, signalfx]# Use instead when sending to gatewayexporters:[otlp, signalfx]metrics:receivers:[hostmetrics, otlp, signalfx, smartagent/signalfx-forwarder]processors:[memory_limiter, batch, resourcedetection]#exporters: [signalfx]# Use instead when sending to gatewayexporters:[otlp]metrics/internal:receivers:[prometheus/internal]processors:[memory_limiter, batch, resourcedetection]# When sending to gateway, at least one metrics pipeline needs# to use signalfx exporter so host metadata gets emittedexporters:[signalfx]logs/signalfx:receivers:[signalfx, smartagent/processlist]processors:[memory_limiter, batch, resourcedetection]exporters:[signalfx]logs:receivers:[fluentforward, otlp]processors:- memory_limiter- batch- resourcedetection#- resource/add_environment#exporters: [splunk_hec, splunk_hec/profiling]# Use instead when sending to gatewayexporters:[otlp]
And finally we can add the SPLUNK_GATEWAY_URL in splunk-otel-collector.conf, for example:
When deploying OpenTelemetry in a large organization, it’s critical to define a standardized naming convention for tagging, and a governance process to ensure the convention is adhered to.
Resources for setting up a locally hosted workshop environment.
Subsections of Resources
Frequently Asked Questions
A collection of the common questions and their answers associated with Observability, DevOps, Incident Response and Splunk On-Call.
Q: Alerts v. Incident Response v. Incident Management
A: Alerts, Incident Response and Incident Management are related functions. Together they comprise the incident response and resolution process.
Monitoring and Observability tools send alerts to incident response platforms. Those platforms take a collection of alerts and correlate them into incidents.
Those incidents are recorded into incident management (ITSM) platforms for record. Alerts are the trigger that something has happened, and provide context to an incident.
Incidents consist of the alert payload, all activity associated with the incident from the time it was created, and the on-call policies to be followed. ITSM is the system of record for incidents that are active and after they have been resolved.
All these components are necessary for successful incident response and management practices.
On-Call
Q: Is Observability Monitoring
A: The key difference between Monitoring and Observability is the difference between “known knowns” and “unknown knowns” respectively.
In monitoring the operator generally has prior knowledge of the architecture and elements in their system. They can reliably predict the relationship between elements, and their associated metadata. Monitoring is good for stateful infrastructure that is not frequently changed.
Observability is for systems where the operators ability to predict and trace all elements in the system and their relationships is limited.
Observability is a set of practices and technology, which include traditional monitoring metrics.
These practices and technologies combined give the operator the ability to understand ephemeral and highly complex environments without prior knowledge of all elements of a system. Observability technology can also account for fluctuations in the environment, and variation in metadata (cardinality) better than traditional monitoring which is more static.
Observability
Q: What are Traces and Spans
A: Traces and spans, combined with metrics and logs, make up the core types of data that feed modern Observability tools. They all have specific elements and functions, but work well together.
Because microservices based architectures are distributed, transactions in the system touch multiple services before completing. This makes accurately pinpointing the location of an issue difficult. Traces are a method for tracking the full path of a request through all the services in a distributed system. Spans are the timed operations in each service. Traces are the connective tissue for the spans and together they give more detail on individual service processes. While metrics give a good snapshot of the health of a system, and logs give depth when investigating issues, traces and spans help navigate operators to the source of issues with greater context. This saves time when investigating incidents, and supports the increasing complexity of modern architectures.
APM
Q: What is the Sidecar Pattern?
A: The sidecar pattern is a design pattern for having related services connected directly by infrastructure. Related services can be adding functionality or supporting the application logic they are connected to. It is used heavily as a method for deploying agents associated with the management plan along with the application service they support.
In Observability the sidecar services are the application logic, and the agent collecting data from that service. The setup requires two containers one with the application service, and one running the agent. The containers share a pod, and resources such as disk, network, and namespace. They are also deployed together and share the same lifecycle.
Observability
Dimension, Properties and Tags
Applying context to your metrics
One conversation that frequently comes up is Dimensions vs Properties and when you should use one verus the other. Instead of starting off with their descriptions it makes sense to understand how we use them and how they are similar, before diving into their differences and examples of why you would use one or the other.
How are Dimensions and Properties similar?
The simplest answer is that they are both metadata key:value pairs that add context to our metrics. Metrics themselves are what we actually want to measure, whether it’s a standard infrastructure metric like cpu.utilization or a custom metric like number of API calls received.
If we receive a value of 50% for the cpu.utilization metric without knowing where it came from or any other context it is just a number and not useful to us. We would need at least to know what host it comes from.
These days it is likely we care more about the performance or utilization of a cluster or data center as a whole then that of an individual host and therefore more interested in things like the average cpu.utilization across a cluster of hosts, when a host’s cpu.utilization is a outlier when compared to other hosts running the same service or maybe compare the average cpu.utilization of one environment to another.
To be able to slice, aggregate or group our cpu.utilization metrics in this way we will need additional metadata for the cpu.utilization metrics we receive to include what cluster a host belongs to, what service is running on the host and what environment it is a part of. This metadata can be in the form of either dimension or property key:value pairs.
For example, if I go to apply a filter to a dashboard or use the Group by function when running analytics, I can use a property or a dimension.
So how are Dimensions and Properties different?
Dimensions are sent in with metrics at the time of ingest while properties are applied to metrics or dimensions after ingest. This means that any metadata you need to make a datapoint (a single reported value of a metric) unique, like what host a value of cpu.utilization is coming from needs to be a dimension. Metric names + dimensions uniquely define an MTS (metric time series).
Example: the cpu.utilization metric sent by a particular host (server1) with a dimension host:server1 would be considered a unique time series. If you have 10 servers, each sending that metric, then you would have 10 time series, with each time series sharing the metric name cpu.utilization and uniquely identified by the dimension key-value pair (host:server1, host:server2…host:server10).
However, if your server names are only unique within a datacenter vs your whole environment you would need to add a 2nd dimension dc for the datacenter location. You could now have double the number of possible MTSs. cpu.utilization metrics received would now be uniquely identified by 2 sets of dimension key-value pairs.
cpu.utilization plus dc:east & host:server1 would create a different time series then cpu.utilization plus dc:west & host:server1.
Dimensions are immutable while properties are mutable
As we mentioned above, Metric name + dimensions make a unique MTS. Therefore, if the dimension value changes we will have a new unique combination of metric name + dimension value and create a new MTS.
Properties on the other hand are applied to metrics (or dimensions) after they are ingested. If you apply a property to a metric, it propagates and applies to all MTS that the metric is a part of. Or if you apply a property to a dimension, say host:server1 then all metrics from that host will have those properties attached. If you change the value of a property it will propagate and update the value of the property to all MTSs with that property attached. Why is this important? It means that if you care about the historical value of a property you need to make it a dimension.
Example: We are collecting custom metrics on our application. One metric is latency which counts the latency of requests made to our application. We have a dimension customer, so we can sort and compare latency by customer. We decide we want to track the application version as well so we can sort and compare our application latency by the version customers are using. We create a property version that we attach to the customer dimension. Initially all customers are using application version 1, so version:1.
We now have some customers using version 2 of our application, for those customers we update the property to version:2. When we update the value of the version property for those customers it will propagate down to all MTS for that customer. We lose the history that those customers at some point used version 1, so if we wanted to compare latency of version 1 and version 2 over a historical period we would not get accurate data. In this case even though we don’t need application version to make out metric time series unique we need to make version a dimension, because we care about the historical value.
So when should something be a Property instead of a dimension?
The first reason would be if there is any metadata you want attached to metrics, but you don’t know it at the time of ingest.
The second reason is best practice is if it doesn’t need to be a dimension, make it a property. Why?
One reason is that today there is a limit of 5K MTSs per analytics job or chart rendering and the more dimensions you have the more MTS you will create. Properties are completely free-form and let you add as much information as you want or need to metrics or dimensions without adding to MTS counts.
As dimensions are sent in with every datapoint, the more dimensions you have the more data you send to us, which could mean higher costs to you if your cloud provider charges for data transfer.
A good example of some things that should be properties would be additional host information. You want to be able to see things like machine_type, processor, or os, but instead of making these things dimensions and sending them with every metric from a host you could make them properties and attach the properties to the host dimension.
Example where host:server1 you would set properties machine_type:ucs, processor:xeon-5560, os:rhel71. Anytime a metric comes in with the dimension host:server1 all the above properties will be applied to it automatically.
Some other examples of use cases for properties would be if you want to know who is the escalation contact for each service or SLA level for every customer. You do not need these items to make metrics uniquely identifiable and you don’t care about the historical values, so they can be properties. The properties could be added to the service dimension and customer dimensions and would then apply to all metrics and MTSs with those dimensions.
What about Tags?
Tags are the 3rd type of metadata that can be used to give context to or help organize your metrics. Unlike dimensions and properties, tags are NOT key:value pairs. Tags can be thought of as labels or keywords. Similar to Properties, Tags are applied to your data after ingest via the Catalog in the UI or programmatically via the API. Tags can be applied to Metrics, Dimensions or other objects such as Detectors.
Where would I use Tags?
Tags are used when there is a need for a many-to-one relationship of tags to an object or a one-to-many relationship between the tag and the objects you are applying them to. They are useful for grouping together metrics that may not be intrinsically associated.
One example is you have hosts that run multiple applications. You can create tags (labels) for each application and then apply multiple tags to each host to label the applications that are running on it.
Example: Server1 runs 3 applications. You create tags app1, app2 and app3 and apply all 3 tags to the dimension host:server1
To expand on the example above let us say you also collect metrics from your applications. You could apply the tags you created to any metrics coming in from the applications themselves. You can filter based on a tag allowing you to filter based on an application, but get the full picture including both application and the relevant host metrics.
Example: App1 sends in metrics with the dimension service:application1. You would apply tag app1 to the dimension service:application1. You can then filter on the tag app1 in charts and dashboards.
Another use case for tags for binary states where there is just one possible value. An example is you do canary testing and when you do a canary deployment you want to be able to mark the hosts that received the new code, so you can easily identify their metrics and compare their performance to those hosts that did not receive the new code. There is no need for a key:value pair as there is just a single value “canary”.
Be aware that while you can filter on tags you cannot use the groupBy function on them. The groupBy function is run by supplying the key part of a key:value pair and the results are then grouped by values of that key pair.
Additional information
For information on sending dimensions for custom metrics please review the Client Libraries documentation for your library of choice.
For information on how to apply properties & tags to metrics or dimensions via the API please see the API documentation for /metric/:name /dimension/:key/:value
For information on how to add or edit properties and tags via the Metadata Catalog in the UI please reference the section Add or edit metadata in Search the Metric Finder and Metadata catalog.
Naming Conventions for Tagging with OpenTelemetry and Splunk
Introduction
When deploying OpenTelemetry in a large organization, it’s critical to define a standardized naming convention for tagging, and a governance process to ensure the convention is adhered to.
This ensures that MELT data collected via OpenTelemetry can be efficiently utilized for alerting, dashboarding, and troubleshooting purposes. It also ensures that users of Splunk Observability Cloud can quickly find the data they’re looking for.
Naming conventions also ensure that data can be aggregated effectively. For example, if we wanted to count the number of unique hosts by environment, then we must use a standardized convention for capturing the host and environment names.
Attributes vs. Tags
Before we go further, let’s make a note regarding terminology. Tags in OpenTelemetry are called “attributes”. Attributes can be attached to metrics, logs, and traces, either via manual instrumentation or automated instrumentation.
Attributes can also be attached to metrics, logs, and traces at the OpenTelemetry collector level, using various processors such as the Resource Detection processor.
Once traces with attributes are ingested into Splunk Observability Cloud, they are available as “tags”. Optionally, attributes collected as part of traces can be used to create Troubleshooting Metric Sets, which can in turn be used with various features such as Tag Spotlight.
Alternatively, attributes can be used to create Monitoring Metric Sets, which can be used to drive alerting.
Resource Semantic Conventions
OpenTelemetry resource semantic conventions should be used as a starting point when determining which attributes an organization should standardize on. In the following sections, we’ll review some of the more commonly used attributes.
Service Attributes
A number of attributes are used to describe the service being monitored.
service.name is a required attribute that defines the logical name of the service. It’s added automatically by the OpenTelemetry SDK but can be customized. It’s best to keep this simple (i.e. inventoryservice would be better than inventoryservice-prod-hostxyz, as other attributes can be utilized to capture other aspects of the service instead).
The following service attributes are recommended:
service.namespace this attribute could be utilized to identify the team that owns the service
service.instance.id is used to identify a unique instance of the service
service.version is used to identify the version of the service
Telemetry SDK
These attributes are set automatically by the SDK, to record information about the instrumentation libraries being used:
telemetry.sdk.name is typically set to opentelemetry
telemetry.sdk.language is the language of the SDK, such as java
telemetry.sdk.version identifies which version of the SDK is utilized
Containers
For services running in containers, there are numerous attributes used to describe the container runtime, such as container.id, container.name, and container.image.name. The full list can be found here.
Hosts
These attributes describe the host where the service is running, and include attributes such as host.id, host.name, and host.arch. The full list can be found here.
Deployment Environment
The deployment.environment attribute is used to identify the environment where the service is deployed, such as staging or production.
Splunk Observability Cloud uses this attribute to enable related content (as described here), so it’s important to include it.
Cloud
There are also attributes to capture information for services running in public cloud environments, such as AWS. Attributes include cloud.provider, cloud.account.id, and cloud.region.
Some cloud providers, such as GCP, define semantic conventions specific to their offering.
Kubernetes
There are a number of standardized attributes for applications running in Kubernetes as well. Many of these are added automatically by Splunk’s distribution of the OpenTelemetry collector, as described here.
These attributes include k8s.cluster.name, k8s.node.name, k8s.pod.name, k8s.namespace.name, and kubernetes.workload.name.
Best Practices for Creating Custom Attributes
Many organizations require attributes that go beyond what’s defined in OpenTelemetry’s resource semantic conventions.
In this case, it’s important to avoid naming conflicts with attribute names already included in the semantic conventions. So it’s a good idea to check the semantic conventions before deciding on a particular attribute name for your naming convention.
In addition to a naming convention for attribute names, you also need to consider attribute values. For example, if you’d like to capture the particular business unit with which an application belongs, then you’ll also want to have a standardized list of business unit values to choose from, to facilitate effective filtering.
The OpenTelemetry community provides guidelines that should be followed when naming attributes as well, which can be found here.
Prefixing the attribute name with your company’s domain name, e.g. com.acme.shopname (if the attribute may be used outside your company as well as inside).
Prefixing the attribute name with the application name, if the attribute is unique to a particular application and is only used within your organization.
Not using existing OpenTelemetry semantic convention names as a prefix for your attribute name.
Consider submitting a proposal to add your attribute name to the OpenTelemetry specification, if there’s a general need for it across different organizations and industries.
Avoid having attribute names start with otel.*, as this is reserved for OpenTelemetry specification usage.
Metric Cardinality Considerations
One final thing to keep in mind when deciding on naming standards for attribute names and values is related to metric cardinality.
Metric cardinality is defined as **the number of unique metric time series (MTS) produced by a combination of metric names and their associated dimensions.
A metric has high cardinality when it has a high number of dimension keys and a high number of possible unique values for those dimension keys.
For example, suppose your application sends in data for a metric named custom.metric. In the absence of any attributes, custom.metric would generate a single metric time series (MTS).
On the other hand, if custom.metric includes an attribute named customer.id, and there are thousands of customer ID values, this would generate thousands of metric time series, which may impact costs and query performance.
Splunk Observability Cloud provides a report that allows for the management of metrics usage. And rules can be created to drop undesirable dimensions. However, the first line of defence is understanding how attribute name and value combinations can drive increased metric cardinality.
Summary
In this document, we highlighted the importance of defining naming conventions for OpenTelemetry tags, preferably before starting a large rollout of OpenTelemetry instrumentation.
We discussed how OpenTelemetry’s resource semantic conventions define the naming conventions for several attributes, many of which are automatically collected via the OpenTelemetry SDKs, as well as processors that run within the OpenTelemetry collector.
Finally, we shared some best practices for creating your attribute names, for situations where the resource semantic conventions are not sufficient for your organization’s needs.
Local Hosting
Info
Please disable any VPNs or proxies before setting up an instance e.g:
ZScaler
Cisco AnyConnect
These tools will prevent the instance from being created properly.
If you plan to use your own Splunk Observability Cloud Suite Org and or Splunk instance, you may need to create a new Log Observer Connect connection:
Follow the instructions found in the documentation for Splunk Cloud or Splunk Enterprize.
Additional requirements for running your own Log Observer Connect connection are:
Create an index called splunk4rookies-workshop
Make sure the Service account user used in the Log observer Connect Connection has access to the splunk4rookies-workshop index. (You can remove all other indexes, as all workshop log data should go to this index)
Initialise Terraform:
terraform init -upgrade
```text
Initializing the backend...
Initializing provider plugins...
- Finding latest version of hashicorp/random...
- Finding latest version of hashicorp/local...
- Finding larstobi/multipass versions matching "~> 1.4.1"...
- Installing hashicorp/random v3.5.1...
- Installed hashicorp/random v3.5.1 (signed by HashiCorp)
- Installing hashicorp/local v2.4.0...
- Installed hashicorp/local v2.4.0 (signed by HashiCorp)
- Installing larstobi/multipass v1.4.2...
- Installed larstobi/multipass v1.4.2 (self-signed, key ID 797707331BF3549C)
```
Create Terraform variables file. Variables are kept in file terrform.tfvars and we provide a template, terraform.tfvars.template, to copy and edit:
cp terraform.tfvars.template terraform.tfvars
The following Terraform variables are required:
splunk_access_token: Observability Access Token
splunk_api_token: Observability API Token
splunk_rum_token: Observability RUM Token
splunk_realm: Observability Realm e.g. eu0
splunk_hec_url: Splunk HEC URL
splunk_hec_token: Splunk HEC Token
Instance type variables:
splunk_hec_url: Do not use a Raw Endpoint, but use an Event Endpoint as this will process the logs correctly
splunk_presetup: Provide a preconfigured instance (OTel Collector and Online Boutique deployed with RUM enabled). The default is false.
splunk_diab: Install and run Demo-in-a-Box. The default is false.
tagging_workshop: Install and configure the Tagging Workshop. The default is false.
otel_demo : Install and configure the OpenTelemetry Astronomy Shop Demo. This requires that splunk_presetup is set to false. The default is false
Optional advanced variables:
wsversion: Set this to main if working on the development of the workshop, otherwise this can be omitted.
Run terraform plan to check that all configuration is OK. Once happy run terraform apply to create the instance.
Once the instance has been successfully created (this can take several minutes), shell into it using the name from the output above e.g.
multipass shell cynu
███████╗██████╗ ██╗     ██╗   ██╗███╗   ██╗██╗  ██╗    ██╗
██╔════╝██╔══██╗██║     ██║   ██║████╗  ██║██║ ██╔╝    ╚██╗
███████╗██████╔╝██║     ██║   ██║██╔██╗ ██║█████╔╝      ╚██╗
╚════██║██╔═══╝ ██║     ██║   ██║██║╚██╗██║██╔═██╗      ██╔╝
███████║██║     ███████╗╚██████╔╝██║ ╚████║██║  ██╗    ██╔╝
╚══════╝╚═╝     ╚══════╝ ╚═════╝ ╚═╝  ╚═══╝╚═╝  ╚═╝    ╚═╝

To run a command as administrator (user "root"), use "sudo <command>".
See "man sudo_root" for details

Waiting for cloud-init status...
Your instance is ready!

ubuntu@cynu ~ $
Change user to splunk (the password is Splunk123!):
su -l splunk
Validate the instance:
kubectl version --output=yaml
To delete the instance, run the following command:
terraform destroy
Local Hosting with OrbStack
Install Orbstack:
brew install orbstack
Log Observer Connect:
If you plan to use your own Splunk Observability Cloud Suite Org and or Splunk instance, you may need to create a new Log Observer Connect connection:
Follow the instructions found in the documentation for Splunk Cloud or Splunk Enterprize.
Additional requirements for running your own Log Observer Connect connection are:
Create an index called splunk4rookies-workshop
Make sure the Service account user used in the Log observer Connect Connection has access to the splunk4rookies-workshop index. (You can remove all other indexes, as all workshop log data should go to this index)
Copy the start.sh.example to start.sh and edit the file to set the following required variables
Make sure that you do not use a Raw Endpoint, but use an Event Endpoint instead as this will process the logs correctly
ACCESS_TOKEN
REALM
API_TOKEN
RUM_TOKEN
HEC_TOKEN
HEC_URL
Run the script and provide and instance name e.g.:
./start.sh my-instance
Once the instance has been successfully created (this can take several minutes), you will automatically be logged into the instance. If you exit you can SSH back in using the following command (replace <my_instance> with the name of your instance):
ssh splunk@<my_instance>@orb
Once in the shell, you can validate that the instance is ready by running the following command:
kubectl version --output=yaml
To get the IP address of the instance, run the following command:
ifconfig eth0
To delete the instance, run the following command:
orb delete my-instance
Running Demo-in-a-Box
Demo-in-a-box is a method for running demo apps easily using a web interface.
It provides:
A quick way to deploy demo apps and states
A way to easily change configuration of your otel collector and see logs
This workshop will equip you with how a distributed trace is constructed for a small serverless application that runs on AWS Lambda, producing and consuming a message via AWS Kinesis
Make expensive service outages a thing of the past. Remediate issues faster, reduce on-call burnout and keep your services up and running.
Subsections of Unsupported Field Workshops
Splunk IM
During this technical Splunk Observability Cloud Infrastructure Monitoring and APM Workshop, you will build out an environment based on a lightweight Kubernetes1 cluster.
To simplify the workshop modules, a pre-configured AWS/EC2 instance is provided.
The instance is pre-configured with all the software required to deploy the Splunk OpenTelemetry Connector2 in Kubernetes, deploy an NGINX^3 ReplicaSet^4 and finally deploy a microservices-based application which has been instrumented using OpenTelemetry to send metrics, traces, spans and logs3.
The workshops also introduce you to dashboards, editing and creating charts, creating detectors to fire alerts, Monitoring as Code and the Service Bureau4
By the end of these technical workshops, you will have a good understanding of some of the key features and capabilities of the Splunk Observability Cloud.
Here are the instructions on how to access your pre-configured AWS/EC2 instance
Kubernetes is a portable, extensible, open-source platform for managing containerized workloads and services, that facilitates both declarative configuration and automation. ↩︎
OpenTelemetry Collector offers a vendor-agnostic implementation on how to receive, process and export telemetry data. In addition, it removes the need to run, operate and maintain multiple agents/collectors to support open-source telemetry data formats (e.g. Jaeger, Prometheus, etc.) sending to multiple open-source or commercial back-ends. ↩︎
Jaeger, inspired by Dapper and OpenZipkin, is a distributed tracing system released as open source by Uber Technologies. It is used for monitoring and troubleshooting microservices-based distributed systems ↩︎
How to retrieve the IP address of the AWS/EC2 instance assigned to you.
Connect to your instance using SSH, Putty1 or your web browser.
Verify your connection to your AWS/EC2 cloud instance.
Using Putty (Optional)
Using Multipass (Optional)
1. AWS/EC2 IP Address
In preparation for the workshop, Splunk has prepared an Ubuntu Linux instance in AWS/EC2.
To get access to the instance that you will be using in the workshop please visit the URL to access the Google Sheet provided by the workshop leader.
Search for your AWS/EC2 instance by looking for your first and last name, as provided during registration for this workshop.
Find your allocated IP address, SSH command (for Mac OS, Linux and the latest Windows versions) and password to enable you to connect to your workshop instance.
It also has the Browser Access URL that you can use in case you cannot connect via ssh or Putty - see EC2 access via Web browser
Important
Please use SSH or Putty to gain access to your EC2 instance if possible and
make a note of the IP address as you will need this during the workshop.
2. SSH (Mac OS/Linux)
Most attendees will be able to connect to the workshop by using SSH from their Mac or Linux device, or on Windows 10 and above.
To use SSH, open a terminal on your system and type ssh splunk@x.x.x.x (replacing x.x.x.x with the IP address found in Step #1).
When prompted Are you sure you want to continue connecting (yes/no/[fingerprint])? please type yes.
Enter the password provided in the Google Sheet from Step #1.
Upon successful login, you will be presented with the Splunk logo and the Linux prompt.
3. SSH (Windows 10 and above)
The procedure described above is the same on Windows 10, and the commands can be executed either in the Windows Command Prompt or PowerShell.
However, Windows regards its SSH Client as an “optional feature”, which might need to be enabled.
You can verify if SSH is enabled by simply executing ssh
If you are shown a help text on how to use the ssh-command (like shown on the screenshot below), you are all set.
If the result of executing the command looks something like the screenshot below, you want to enable the “OpenSSH Client” feature manually.
To do that, open the “Settings” menu, and click on “Apps”. While in the “Apps & features” section, click on “Optional features”.
Here, you are presented with a list of installed features. On the top, you see a button with a plus icon to “Add a feature”. Click it.
In the search input field, type “OpenSSH”, and find a feature called “OpenSSH Client”, or respectively, “OpenSSH Client (Beta)”, click on it, and click the “Install”-button.
Now you are set! In case you are not able to access the provided instance despite enabling the OpenSSH feature, please do not shy away from reaching
out to the course instructor, either via chat or directly.
If you are blocked from using SSH (Port 22) or unable to install Putty you may be able to connect to the workshop instance by using a web browser.
Note
This assumes that access to port 6501 is not restricted by your company’s firewall.
Open your web browser and type http://x.x.x.x:6501 (where X.X.X.X is the IP address from the Google Sheet).
Once connected, login in as splunk and the password is the one provided in the Google Sheet.
Once you are connected successfully you should see a screen similar to the one below:
Unlike when you are using regular SSH, copy and paste does require a few extra steps to complete when using a browser session. This is due to cross browser restrictions.
When the workshop asks you to copy instructions into your terminal, please do the following:
Copy the instruction as normal, but when ready to paste it in the web terminal, choose Paste from browser as show below:
This will open a dialogue box asking for the text to be pasted into the web terminal:
Paste the text in the text box as shown, then press OK to complete the copy and paste process.
Note
Unlike regular SSH connection, the web browser has a 60-second time out, and you will be disconnected, and a Connect button will be shown in the center of the web terminal.
Simply click the Connect button and you will be reconnected and will be able to continue.
Using ACCESS_TOKEN={REDACTED}
Using REALM=eu0
“splunk-otel-collector-chart” has been added to your repositories
Using ACCESS_TOKEN={REDACTED}
Using REALM=eu0
Hang tight while we grab the latest from your chart repositories…
…Successfully got an update from the “splunk-otel-collector-chart” chart repository
Update Complete. ⎈Happy Helming!⎈
Install the OpenTelemetry Collector Helm chart with the following commands, do NOT edit this:
Using ACCESS_TOKEN={REDACTED}
Using REALM=eu0
NAME: splunk-otel-collector
LAST DEPLOYED: Fri May  7 11:19:01 2021
NAMESPACE: default
STATUS: deployed
REVISION: 1
TEST SUITE: None
You can monitor the progress of the deployment by running kubectl get pods which should typically report a new pod is up and running after about 30 seconds.
Ensure the status is reported as Running before continuing.
kubectl get pods
NAME                                                          READY   STATUS    RESTARTS   AGE
splunk-otel-collector-agent-2sk6k                             0/1     Running   0          10s
splunk-otel-collector-k8s-cluster-receiver-6956d4446f-gwnd7   0/1     Running   0          10s
Ensure there are no errors by tailing the logs from the OpenTelemetry Collector pod. The output should look similar to the log output shown in the Output tab below.
Use the label set by the helm install to tail logs (You will need to press ctrl+c to exit). Or use the installed k9s terminal UI for bonus points!
2021-03-21T16:11:10.900Z INFO service/service.go:364 Starting receivers…
2021-03-21T16:11:10.900Z INFO builder/receivers_builder.go:70 Receiver is starting… {“component_kind”: “receiver”, “component_type”: “prometheus”, “component_name”: “prometheus”}
2021-03-21T16:11:11.009Z INFO builder/receivers_builder.go:75 Receiver started. {“component_kind”: “receiver”, “component_type”: “prometheus”, “component_name”: “prometheus”}
2021-03-21T16:11:11.009Z INFO builder/receivers_builder.go:70 Receiver is starting… {“component_kind”: “receiver”, “component_type”: “k8s_cluster”, “component_name”: “k8s_cluster”}
2021-03-21T16:11:11.009Z INFO k8sclusterreceiver@v0.21.0/watcher.go:195 Configured Kubernetes MetadataExporter {“component_kind”: “receiver”, “component_type”: “k8s_cluster”, “component_name”: “k8s_cluster”, “exporter_name”: “signalfx”}
2021-03-21T16:11:11.009Z INFO builder/receivers_builder.go:75 Receiver started. {“component_kind”: “receiver”, “component_type”: “k8s_cluster”, “component_name”: “k8s_cluster”}
2021-03-21T16:11:11.009Z INFO healthcheck/handler.go:128 Health Check state change {“component_kind”: “extension”, “component_type”: “health_check”, “component_name”: “health_check”, “status”: “ready”}
2021-03-21T16:11:11.009Z INFO service/service.go:267 Everything is ready. Begin running and processing data.
2021-03-21T16:11:11.009Z INFO k8sclusterreceiver@v0.21.0/receiver.go:59 Starting shared informers and wait for initial cache sync. {“component_kind”: “receiver”, “component_type”: “k8s_cluster”, “component_name”: “k8s_cluster”}
2021-03-21T16:11:11.281Z INFO k8sclusterreceiver@v0.21.0/receiver.go:75 Completed syncing shared informer caches. {“component_kind”: “receiver”, “component_type”: “k8s_cluster”, “component_name”: “k8s_cluster”}
Deleting a failed installation
If you make an error installing the OpenTelemetry Collector you can start over by deleting the installation using:
helm delete splunk-otel-collector
2. Validate metrics in the UI
In the Splunk UI, click the » bottom left and click on Infrastructure.
Under Containers click on Kubernetes to open the Kubernetes Navigator Cluster Map to ensure metrics are being sent in.
Validate that your cluster is discovered and reported by finding your cluster (in the workshop you will see many other clusters). To find your cluster name run the following command and copy the output to your clipboard:
echo$INSTANCE-k3s-cluster
Then in the UI, click on the “Cluster: - " menu just below the Splunk Logo, paste the Cluster name you just copied into the search box, click the box to select your cluster, and finally click off the menu into white space to apply the filter.
To examine the health of your node, hover over the pale blue background of your cluster, then click on the blue magnifying glass that appears in the top left-hand corner.
This will drill down to the node level. Next, open the Metrics sidebar by clicking on the sidebar button.
Once it is open, you can use the slider on the side to explore the various charts relevant to your cluster/node: CPU, Memory, Network, Events etc.
Subsections of Deploying the OpenTelemetry Collector in Kubernetes
Deploying NGINX in K3s
Deploy a NGINX ReplicaSet into your K3s cluster and confirm the discovery of your NGINX deployment.
Run a load test to create metrics and confirm them streaming into Splunk Observability Cloud!
1. Start your NGINX
Verify the number of pods running in the Splunk UI by selecting the WORKLOADS tab. This should give you an overview of the workloads on your cluster.
Note the single agent container running per node among the default Kubernetes pods. This single container will monitor all the pods and services being deployed on this node!
Now switch back to the default cluster node view by selecting the MAP tab and selecting your cluster again.
In your AWS/EC2 or Multipass shell session change into the nginx directory:
cd ~/workshop/k3s/nginx
2. Create NGINX deployment
Create the NGINX ConfigMap1 using the nginx.conf file:
deployment.apps/nginx created
service/nginx created
Next, we will deploy Locust2 which is an open-source tool used for creating a load test against NGINX:
kubectl create -f locust-deployment.yaml
deployment.apps/nginx-loadgenerator created
service/nginx-loadgenerator created
Validate the deployment has been successful and that the Locust and NGINX pods are running.
If you have the Splunk UI open you should see new Pods being started and containers being deployed.
It should only take around 20 seconds for the pods to transition into a Running state. In the Splunk UI you will have a cluster that looks like the screenshot below:
If you select the WORKLOADS tab again you will now see that there is a new ReplicaSet and a deployment added for NGINX:
Locust, an open-source load generator, is available on port 8083 of the EC2 instance’s IP address. Open a new tab in your web browser and go to http://{==EC2-IP==}:8083/, you will then be able to see the Locust running.
Set the Spawn rate to 2 and click Start Swarming.
This will start a gentle continuous load on the application.
As you can see from the above screenshot, most of the calls will report a fail, this is expected, as we have not yet deployed the application behind it, however, NGINX is reporting on your attempts and you should be able to see those metrics.
Validate you are seeing those metrics in the UI by selecting Dashboards → Built-in Dashboard Groups → NGINX → NGINX Servers. Using the Overrides filter on k8s.cluster.name:, find the name of your cluster as returned by echo $INSTANCE-k3s-cluster in the terminal.
A ConfigMap is an API object used to store non-confidential data in key-value pairs. Pods can consume ConfigMaps as environment variables, command-line arguments, or configuration files in a volume. A ConfigMap allows you to decouple environment-specific configuration from your container images so that your applications are easily portable. ↩︎
Dashboards are groupings of charts and visualizations of metrics. Well-designed dashboards can provide useful and actionable insight into your system at a glance. Dashboards can be complex or contain just a few charts that drill down only into the data you want to see.
During this module, we are going to create the following charts and dashboard and connect them to your Team page.
2. Your Teams’ Page
Click on the from the navbar. As you have already been assigned to a team, you will land on the team dashboard. We use the Example Team as an example here. The one in your workshop will be different!
This page shows the total number of team members, how many active alerts for your team and all dashboards that are assigned to your team. Right now there are no dashboards assigned but as stated before, we will add the new dashboard that you will create to your Teams page later.
3. Sample Charts
To continue, click on All Dashboards in the top right corner of the screen. This brings you to the view that shows all the available dashboards, including the pre-built ones.
If you are already receiving metrics from a Cloud API integration or another service through the Splunk Agent you will see relevant dashboards for these services.
4. Inspecting the Sample Data
Among the dashboards, you will see a Dashboard group called Sample Data. Expand the Sample Data dashboard group by clicking on it, and then click on the Sample Charts dashboard.
In the Sample Charts dashboard, you can see a selection of charts that show a sample of the various styles, colors and formats you can apply to your charts in the dashboards.
Have a look through all the dashboards in this dashboard group (PART 1, PART 2, PART 3 and INTRO TO SPLUNK OBSERVABILITY CLOUD)
Subsections of Working with Dashboards
Editing charts
1. Editing a chart
Select the SAMPLE CHARTS dashboard and then click on the three dots ... on the Latency histogram chart, then on Open (or you can click on the name of the chart which here is Latency histogram).
You will see the plot options, current plot and signal (metric) for the Latency histogram chart in the chart editor UI.
In the Plot Editor tab under Signal you see the metric demo.trans.latency we are currently plotting.
You will see a number of Line plots. The number 18 ts indicates that we are plotting 18 metric time series in the chart.
Click on the different chart type icons to explore each of the visualizations. Notice their name while you swipe over them. For example, click on the Heat Map icon:
See how the chart changes to a heat map.
Note
You can use different charts to visualize your metrics - you choose which chart type fits best for the visualization you want to have.
Click on the Line chart type and you will see the line plot.
2. Changing the time window
You can also increase the time window of the chart by changing the time to Past 15 minutes by selecting from the Time dropdown.
3. Viewing the Data Table
Click on the Data Table tab.
You now see 18 rows, each representing a metric time series with a number of columns. These columns represent the dimensions of the metric. The dimensions for demo.trans.latency are:
demo_datacenter
demo_customer
demo_host
In the demo_datacenter column you see that there are two data centers, Paris and Tokyo, for which we are getting metrics.
If you move your cursor over the lines in the chart horizontally you will see the data table update accordingly. If you click on one of the lines in the chart you will see a pinned value appear in the data table.
Now click on Plot editor again to close the Data Table and let’s save this chart into a dashboard for later use!
Saving charts
1. Saving a chart
To start saving your chart, lets give it a name and description. Click the name of the chart Copy of Latency Histogram and rename it to “Active Latency”.
To change the description click on Spread of latency values across time. and change this to Overview of latency values in real-time.
Click the Save As button. Make sure your chart has a name, it will use the name Active Latency the you defined in the previous step, but you can edit it here if needed.
Press the Ok
button to continue.
2. Creating a dashboard
In the Choose dashboard dialog, we need to create a new dashboard, click on the New Dashboard
button.
You will now see the New Dashboard Dialog. In here you can give you dashboard a name and description, and set Read and Write Permissions.
Please use your own name in the following format to give your dashboard a name e.g. YOUR_NAME-Dashboard.
Please replace YOUR_NAME with your own name, change the dashboard permissions to Restricted Read and Write access, and verify your user can read/write.
You should see you own login information displayed, meaning you are now the only one who can edit this dashboard. Of course you have the option to add other users or teams from the drop box below that may edit your dashboard and charts, but for now make sure you change it back to Everyone can Read or Write to remove any restrictions and press the Save
Button to continue.
Your new dashboard is now available and selected so you can save your chart in your new dashboard.
Make sure you have your dashboard selected and press the Ok button.
You will now be taken to your dashboard like below. You can see at the top left that your YOUR_NAME-DASHBOARD is part of a Dashboard Group YOUR_NAME-Dashboard. You can add other dashboards to this dashboard group.
3. Add to Team page
It is common practice to link dashboards that are relevant to a Team to a teams page. So let’s add your dashboard to the team page for easy access later. Use the from the navbar again.
This will bring you to your teams dashboard, We use the team Example Team as an example here, the workshop one will be different.
Press the +Add Dashboard Group button to add you dashboard to the team page.
This will bring you to the Select a dashboard group to link to this team dialog.
Type your name (that you used above) in the search box to find your Dashboard. Select it so its highlighted and click the Ok button to add your dashboard.
Your dashboard group will appear as part of the team page. Please note during the course of the workshop many more will appear here.
Now click on the link for your Dashboard to add more charts!
3.3 Using Filters & Formulas
1 Creating a new chart
Let’s now create a new chart and save it in our dashboard!
Select the plus icon (top right of the UI) and from the drop down, choose the option Chart.
Or click on the + New Chart Button to create a new chart.
You will now see a chart template like the following.
Let’s enter a metric to plot. We are still going to use the metric demo.trans.latency.
In the Plot Editor tab under Signal enter demo.trans.latency.
You should now have a familiar line chart. Please switch the time to 15 mins.
2. Filtering and Analytics
Let’s now select the Paris datacenter to do some analytics - for that we will use a filter.
Let’s go back to the Plot Editor tab and click on Add Filter
, wait until it automatically populates, choose demo_datacenter, and then Paris.
In the F(x) column, add the analytic function Percentile:Aggregation, and leave the value to 95 (click outside to confirm).
For info on the Percentile function and the other functions see Chart Analytics.
3. Using Timeshift analytical function
Let’s now compare with older metrics. Click on ... and then on Clone in the dropdown to clone Signal A.
You will see a new row identical to A, called B, both visible and plotted.
For Signal B, in the F(x) column add the analytic function Timeshift and enter 1w (or 7d for 7 days), and click outside to confirm.
Click on the cog on the far right, and choose a Plot Color e.g. pink, to change color for the plot of B.
Click on Close.
We now see plots for Signal A (the past 15 minutes) as a blue plot, and the plots from a week ago in pink.
In order to make this clearer we can click on the Area chart icon to change the visualization.
We now can see when last weeks latency was higher!
Next, click into the field next to Time on the Override bar and choose Past Hour from the dropdown.
4. Using Formulas
Let’s now plot the difference of all metric values for a day with 7 days in between.
Click on Enter Formula
then enter A-B (A minus B) and hide (deselect) all Signals using the eye, except C.
We now see only the difference of all metric values of A and B being plotted. We see that we have some negative values on the plot because a metric value of B has some times larger value than the metric value of A at that time.
Lets look at the Signalflow that drives our Charts and Detectors!
3.4 SignalFlow
1. Introduction
Let’s take a look at SignalFlow - the analytics language of Observability Cloud that can be used to setup monitoring as code.
The heart of Splunk Infrastructure Monitoring is the SignalFlow analytics engine that runs computations written in a Python-like language. SignalFlow programs accept streaming input and produce output in real time. SignalFlow provides built-in analytical functions that take metric time series (MTS) as input, perform computations, and output a resulting MTS.
Comparisons with historical norms, e.g. on a week-over-week basis
Population overviews using a distributed percentile chart
Detecting if the rate of change (or other metric expressed as a ratio, such as a service level objective) has exceeded a critical threshold
Finding correlated dimensions, e.g. to determine which service is most correlated with alerts for low disk space
Infrastructure Monitoring creates these computations in the Chart Builder user interface, which lets you specify the input MTS to use and the analytical functions you want to apply to them. You can also run SignalFlow programs directly by using the SignalFlow API.
SignalFlow includes a large library of built-in analytical functions that take a metric time series as an input, performs computations on its datapoints, and outputs time series that are the result of the computation.
You will see the SignalFlow code that composes the chart we were working on. You can now edit the SignalFlow directly within the UI. Our documentation has the full list of SignalFlow functions and methods.
Also, you can copy the SignalFlow and use it when interacting with the API or with Terraform to enable Monitoring as Code.
Click on View Builder to go back to the Chart Builder UI.
Let’s save this new chart to our Dashboard!
Adding charts to dashboards
1. Save to existing dashboard
Check that you have YOUR_NAME-Dashboard: YOUR_NAME-Dashboard in the top left corner. This means you chart will be saved in this Dashboard.
Name the Chart Latency History and add a Chart Description if you wish.
Click on Save And Close. This returns you to your dashboard that now has two charts!
Now let’s quickly add another Chart based on the previous one.
2. Copy and Paste a chart
Click on the three dots ... on the Latency History chart in your dashboard and then on Copy.
You see the chart being copied, and you should now have a red circle with a white 1 next to the + on the top left of the page.
Click on the plus icon the top of the page, and then in the menu on Paste Charts (There should also be a red dot with a 1 visible at the end of the line).
This will place a copy of the previous chart in your dashboard.
3. Edit the pasted chart
Click on the three dots ... on one of the Latency History charts in your dashboard and then on Open (or you can click on the name of the chart which here is Latency History).
This will bring you to the editor environment again.
First set the time for the chart to -1 hour in the Time box at the top right of the chart. Then to make this a different chart, click on the eye icon in front of signal “A” to make it visible again, and then hide signal “C” via the eye icon and change the name for Latency history to Latency vs Load.
Click on the Add Metric Or Event button. This will bring up the box for a new signal. Type and select demo.trans.count for Signal D.
This will add a new Signal D to your chart, It shows the number of active requests. Add the filter for the demo_datacenter:Paris, then change the Rollup type by clicking on the Configure Plot button and changing the roll-up from Auto (Delta) to Rate/sec. Change the name from demo.trans.count to Latency vs Load.
Finally press the Save And Close button. This returns you to your dashboard that now has three different charts!
Let’s add an “instruction” note and arrange the charts!
Adding Notes and Dashboard Layout
1. Adding Notes
Often on dashboards it makes sense to place a short “instruction” pane that helps users of a dashboard. Lets add one now by clicking on the New Text Note
Button.
This will open the notes editor.
To allow you to add more then just text to you notes, Splunk is allowing you to use Markdown in these notes/panes.
Markdown is a lightweight markup language for creating formatted text using plain-text often used in Webpages.
This includes (but not limited to):
Headers. (in various sizes)
Emphasis styles.
Lists and Tables.
Links. These can be external webpages (for documentation for example) or directly to other Splunk IM Dashboards
Below is an example of above Markdown options you can use in your note.
# h1 Big headings
###### h6 To small headings
##### Emphasis
**This is bold text**, *This is italic text* , ~~Strikethrough~~##### Lists
Unordered
+ Create a list by starting a line with `+`, `-`, or `*`- Sub-lists are made by indenting 2 spaces:
- Marker character change forces new list start:
* Ac tristique libero volutpat at
+ Facilisis in pretium nisl aliquet
* Very easy!
Ordered
1. Lorem ipsum dolor sit amet
2. Consectetur adipiscing elit
3. Integer molestie lorem at massa
##### Tables
| Option | Description |
| ------ | ----------- |
| chart | path to data files to supply the data that will be passed into templates. |
| engine | engine to be used for processing templates. Handlebars is the default. |
| ext | extension to be used for dest files. |
#### Links
[link to webpage](https://www.splunk.com)
[link to dashboard with title](https://app.eu0.signalfx.com/#/dashboard/EaJHrbPAEAA?groupId=EaJHgrsAIAA&configId=EaJHsHzAEAA "Link to the Sample chart Dashboard!")
Copy the above by using the copy button and paste it in the Edit box.
the preview will show you how it will look.
2. Saving our chart
Give the Note chart a name, in our example we used Example text chart, then press the Save And Close Button.
This will bring you back to you Dashboard, that now includes the note.
3. Ordering & sizing of charts
If you do not like the default order and sizes of your charts you can simply use window dragging technique to move and size them to the desired location.
Grab the top border of a chart and you should see the mouse pointer change to a drag icon (see picture below).
Now drag the Latency vs Load chart to sit between the Latency History Chart and the Example text chart.
You can also resize windows by dragging from the left, right and bottom edges.
As a last exercise reduce the width of the note chart to about a third of the other charts. The chart will automatically snap to one of the sizes it supports. Widen the 3 other charts to about a third of the Dashboard. Drag the notes to the right of the others and resize it to match it to the 3 others. Set the Time to -1h and you should have the following dashboard!
On to Detectors!
Working with Detectors
10 minutes
Create a Detector from one of your charts
Setting Alert conditions
Running a pre-flight check
Working with muting rules
1. Introduction
Splunk Observability Cloud uses detectors, events, alerts, and notifications to keep you informed when certain criteria are met. For example, you might want a message sent to a Slack channel or an email address for the Ops team when CPU Utilization has reached 95%, or when the number of concurrent users is approaching a limit that might require you to spin up an additional AWS instance.
These conditions are expressed as one or more rules that trigger an alert when the conditions in the rules are met. Individual rules in a detector are labeled according to criticality: Info, Warning, Minor, Major, and Critical.
2. Creating a Detector
In Dashboards click on your Custom Dashboard Group (that you created in the previous module) and then click on the dashboard name.
We are now going to create a new detector from a chart on this dashboard. Click on the bell icon on the Latency vs Load chart, and then click New Detector From Chart.
In the text field next to Detector Name, ADD YOUR INITIALS before the proposed detector name.
Naming the detector
It’s important that you add your initials in front of the proposed detector name.
It should be something like this: XYZ’s Latency Chart Detector.
Click on Create Alert Rule
In the Detector window, inside Alert signal, the Signal we will alert on is marked with a (blue) bell in the Alert on column. The bell indicates which Signal is being used to generate the alert.
Click on Proceed to Alert Condition
3. Setting Alert condition
In Alert condition, click on Static Threshold and then on Proceed to Alert Settings
In Alert Settings, enter the value 290 in the Threshold field. In the same window change Time on top right to past day (-1d).
4. Alert pre-flight check
A pre-flight check will take place after 5 seconds. See the Estimated alert count. Based on the current alert settings, the amount of alerts we would have received in 1 day would have been 3.
About pre-flight checks
Once you set an alert condition, the UI estimates how many alerts you might get based on the current settings, and in the timeframe set on the upper right corner - in this case, the past day.
Immediately, the platform will start analyzing the signals with the current settings, and perform something we call a Pre-flight Check. This enables you to test the alert conditions using the historical data in the platform, to ensure the settings are logical and will not inadvertently generate an alert storm, removing the guesswork from configuring alerts in a simple but very powerful way, only available using the Splunk Observability Cloud.
Click on Add Recipient and then on your email address displayed as the first option.
Notification Services
That’s the same as entering that email address OR you can enter another email address by clicking on E-mail….
This is just one example of the many Notification Services the platform has available. You can check this out by going to the Integrations tab of the top menu, and see Notification Services.
6. Alert Activation
Click on Proceed to Alert Activation
In Activate… click on Activate Alert Rule
If you want to get alerts quicker you edit the rule and lower the value from 290 to say 280.
If you change the Time to -1h you can see how many alerts you might get with the threshold you have chosen based on the metrics from the last 1 hour.
Click on the in the navbar and then click on Detectors. You can optionally filter for your initials. You will see you detector listed here. If you don’t then please refresh your browser.
Congratulations! You have created your first detector and activated it!
Subsections of Working with Detectors
Working with Muting Rules
Learn how to configure Muting Rules
Learn how to resume notifications
1. Configuring Muting Rules
There will be times when you might want to mute certain notifications. For example, if you want to schedule downtime for maintenance on a server or set of servers, or if you are testing new code or settings etc. For that you can use muting rules in Splunk Observability Cloud. Let’s create one!
Click on Alerts & Detectors in the sidebar and then click Detectors to see the list of active detectors.
If you created a detector in Creating a Detector you can click on the three dots ... on the far right for that detector; if not, do that for another detector.
From the drop-down click on Create Muting Rule…
In the Muting Rule window check Mute Indefinitely and enter a reason.
Important
This will mute the notifications permanently until you come back here and un-check this box or resume notifications for this detector.
Click Next and in the new modal window confirm the muting rule setup.
Click on Mute Indefinitely to confirm.
You won’t be receiving any email notifications from your detector until you resume notifications again. Let’s now see how to do that!
2. Resuming notifications
To Resume notifications, click on Muting Rules, you will see the name of the detector you muted notifications for under Detector heading.
Click on the thee dots ... on the far right, and click on Resume Notifications.
Click on Resume to confirm and resume notifications for this detector.
Congratulations! You have now resumed your alert notifications!
Monitoring as Code
10 minutes
Use Terraform1 to manage Observability Cloud Dashboards and Detectors
Run Terraform to create detectors and dashboards from code using the Splunk Terraform Provider.
See how Terraform can also delete detectors and dashboards.
1. Initial setup
Monitoring as code adopts the same approach as infrastructure as code. You can manage monitoring the same way you do applications, servers, or other infrastructure components.
You can use monitoring as code to build out your visualizations, what to monitor, and when to alert, among other things. This means your monitoring setup, processes, and rules can be versioned, shared, and reused.
Full documentation for the Splunk Terraform Provider is available here.
Remaining in your AWS/EC2 instance, change into the o11y-cloud-jumpstart directory
cd ~/observability-content-contrib/integration-examples/terraform-jumpstart
Initialize Terraform and upgrade to the latest version of the Splunk Terraform Provider.
Note: Upgrading the SignalFx Terraform Provider
You will need to run the command below each time a new version of the Splunk Terraform Provider is released. You can track the releases on GitHub.
terraform init -upgrade
    Upgrading modules...
    - aws in modules/aws
    - azure in modules/azure
    - docker in modules/docker
    - gcp in modules/gcp
    - host in modules/host
    - kafka in modules/kafka
    - kubernetes in modules/kubernetes
    - parent_child_dashboard in modules/dashboards/parent
    - pivotal in modules/pivotal
    - rum_and_synthetics_dashboard in modules/dashboards/rum_and_synthetics
    - usage_dashboard in modules/dashboards/usage

    Initializing the backend...

    Initializing provider plugins...
    - Finding latest version of splunk-terraform/signalfx...
    - Installing splunk-terraform/signalfx v6.20.0...
    - Installed splunk-terraform/signalfx v6.20.0 (self-signed, key ID CE97B6074989F138)

    Partner and community providers are signed by their developers.
    If you'd like to know more about provider signing, you can read about it here:
    https://www.terraform.io/docs/cli/plugins/signing.html

    Terraform has created a lock file .terraform.lock.hcl to record the provider
    selections it made above. Include this file in your version control repository
    so that Terraform can guarantee to make the same selections by default when
    you run "terraform init" in the future.

    Terraform has been successfully initialized!

    You may now begin working with Terraform. Try running "terraform plan" to see
    any changes that are required for your infrastructure. All Terraform commands
    should now work.

    If you ever set or change modules or backend configuration for Terraform,
    rerun this command to reinitialize your working directory. If you forget, other
    commands will detect it and remind you to do so if necessary.
2. Create execution plan
The terraform plan command creates an execution plan. By default, creating a plan consists of:
Reading the current state of any already-existing remote objects to make sure that the Terraform state is up-to-date.
Comparing the current configuration to the prior state and noting any differences.
Proposing a set of change actions that should, if applied, make the remote objects match the configuration.
The plan command alone will not actually carry out the proposed changes, and so you can use this command to check whether the proposed changes match what you expected before you apply the changes
terraform plan -var="api_token=$API_TOKEN" -var="realm=$REALM" -var="o11y_prefix=[$INSTANCE]"
Plan: 146 to add, 0 to change, 0 to destroy.
If the plan executes successfully, we can go ahead and apply:
3. Apply execution plan
The terraform apply command executes the actions proposed in the Terraform plan above.
The most straightforward way to use terraform apply is to run it without any arguments at all, in which case it will automatically create a new execution plan (as if you had run terraform plan) and then prompt you to provide the API Token, Realm (the prefix defaults to Splunk) and approve the plan, before taking the indicated actions.
Due to this being a workshop it is required that the prefix is to be unique so you need to run the terraform apply below.
Once the apply has been completed, validate that the detectors were created, under the Alerts & Detectors and click on the Detectors tab. They will be prefixed by the instance name. To check the prefix value run:
echo$INSTANCE
You will see a list of the new detectors and you can search for the prefix that was output from above.
3. Destroy all your hard work
The terraform destroy command is a convenient way to destroy all remote objects managed by your Terraform configuration.
While you will typically not want to destroy long-lived objects in a production environment, Terraform is sometimes used to manage ephemeral infrastructure for development purposes, in which case you can use terraform destroy to conveniently clean up all of those temporary objects once you are finished with your work.
Now go and destroy all the Detectors and Dashboards that were previously applied!
Validate all the detectors have been removed by navigating to Alerts → Detectors
Terraform is a tool for building, changing, and versioning infrastructure safely and efficiently. Terraform can manage existing and popular service providers as well as custom in-house solutions. ↩︎
A provider is responsible for understanding API interactions and exposing resources. Providers generally are an IaaS (e.g. Alibaba Cloud, AWS, GCP, Microsoft Azure, OpenStack), PaaS (e.g. Heroku), or SaaS services (e.g. Splunk, Terraform Cloud, DNSimple, Cloudflare). ↩︎
Service Bureau
10 minutes
How to keep track of the usage of Observability Cloud in your organization
Learn how to keep track of spend by exploring the Subscription Usage interface
Creating Teams
Adding notification rules to Teams
Controlling usage
1. Understanding engagement
To fully understand Observability Cloud engagement inside your organization, click on the » bottom left and select the Settings → Organization Overview, this will provide you with the following dashboards that show you how your Observability Cloud organization is being used:
You will see various dashboards such as Throttling, System Limits, Entitlements & Engagement. The workshop organization you’re using now may have less data to work with as this is cleared down after each workshop.
Take a minute to explore the various dashboards and charts in the Organization Overview of this workshop instance.
2. Subscription Usage
If you want to see what your usage is against your subscription you can select Subscription Usage.
This screen may take a few seconds to load whilst it calculates and pulls in the usage.
3. Understanding usage
You will see a screen similar to the one below that will give you an overview of the current usage, the average usage and your entitlement per category: Hosts, Containers, Custom Metrics and High Resolution Metrics.
The top chart shows you the current subscription levels per category (shown by the red arrows at the top in the screenshot below).
Also, your current usage of the four categories is displayed (shown in the red lines at the bottom of the chart).
In this example, you can see that there are 25 Hosts, 0 Containers, 100 Custom Metrics and 0 High Resolution Metrics.
In the bottom chart, you can see the usage per category for the current period (shown in the drop-down box on the top right of the chart).
The blue line marked Average Usage indicates what Observability Cloud will use to calculate your average usage for the current Subscription Usage Period.
Info
As you can see from the screenshot, Observability Cloud does not use High Watermark or P95% for cost calculation but the actual average hourly usage, allowing you to do performance testing or Blue/Green style deployments etc. without the risk of overage charges.
To get a feel for the options you can change the metric displayed by selecting the different options from the Usage Metric drop-down on the left, or change the Subscription Usage Period with the drop-down on the right.
Please take a minute to explore the different time periods & categories and their views.
Finally, the pane on the right shows you information about your Subscription.
Subsections of Service Bureau
Teams
Introduction to Teams
Create a Team and add members to the Team
1. Introduction to Teams
To make sure that users see the dashboards and alerts that are relevant to them when using Observability Cloud, most organizations will use Observability Cloud’s Teams feature to assign a member to one or more Teams.
Ideally, this matches work-related roles, for example, members of a Dev-Ops or Product Management group would be assigned to the corresponding Teams in Observability Cloud.
When a user logs into Observability Cloud, they can choose which Team Dashboard will be their home page and they will typically select the page for their primary role.
In the example below, the user is a member of the Development, Operations and Product Management Teams, and is currently viewing the Dashboard for the Operations Team.
This Dashboard has specific Dashboard Groups for Usage, SaaS and APM Business Workflows assigned but any Dashboard Group can be linked to a Teams Dashboard.
They can use the menu along the top left to quickly navigate between their allocated teams, or they can use the ALL TEAMS dropdown on the right to select specific Team Dashboards, as well as quickly access ALL Dashboards** using the adjacent link.
Alerts can be linked to specific Teams so the Team can monitor only the Alerts they are interested in, and in the above example, they currently have 1 active Critical Alert.
The Description for the Team Dashboard can be customized and can include links to team-specific resources (using Markdown).
2. Creating a new Team
To work with Splunk’s Team UI click on the hamburger icon top left and select the Organizations Settings → Teams.
When the Team UI is selected you will be presented with the list of current Teams.
To add a new Team click on the Create New Team button. This will present you with the Create New Team dialog.
Create your own team by naming it [YOUR-INITIALS]-Team and add yourself by searching for your name and selecting the Add link next to your name. This should result in a dialog similar to the one below:
You can remove selected users by pressing Remove or the small x.
Make sure you have your group created with your initials and with yourself added as a member, then click Done
This will bring you back to the Teams list that will now show your Team and the ones created by others.
Note
The Teams(s) you are a member of have a grey Member icon in front of it.
If no members are assigned to your Team, you should see a blue Add Members link instead of the member count, clicking on that link will get you to the Edit Team dialog where you can add yourself.
This is the same dialog you get when pressing the 3 dots … at the end of the line with your Team and selecting Edit Team
The … menu gives you the option to Edit, Join, Leave or Delete a Team (leave and join will depend on if you are currently a member).
3. Adding Notification Rules
You can set up specific Notification rules per team, by clicking on the Notification Policy tab, this will open the notification edit menu.
By default, the system offers you the ability to set up a general notification rule for your team.
Note
The Email all team members option means all members of this Team will receive an email with the Alert information, regardless of the alert type.
3.1 Adding recipients
You can add other recipients, by clicking Add Recipient. These recipients do not need to be Observability Cloud users.
However, if you click on the link Configure separate notification tiers for different severity alerts you can configure every alert level independently.
Different alert rules for the different alert levels can be configured, as shown in the above image.
Critical and Major are using Splunk's On-Call Incident Management solution. For the Minor alerts, we send it to the Teams Slack channel and for Warning and Info we send an email.
3.2 Notification Integrations
In addition to sending alert notifications via email, you can configure Observability Cloud to send alert notifications to the services shown below.
Take a moment to create some notification rules for your Team.
Controlling Usage
Discover how you can restrict usage by creating separate Access Tokens and setting limits.
1. Access Tokens
If you wish to control the consumption of Hosts, Containers, Custom Metrics and High Resolution Metrics, you can create multiple Access Tokens and allocate them to different parts of your organization.
In the UI click on the » bottom left and select the Settings → Access Tokens under General Settings.
The Access Tokens Interface provides an overview of your allotments in the form of a list of Access Tokens that have been generated. Every Organization will have a Default token generated when they are first set up, but there will typically be multiple Tokens configured.
Each Token is unique and can be assigned limits for the number of Hosts, Containers, Custom Metrics and High Resolution Metrics it can consume.
The Usage Status Column quickly shows if a token is above or below its assigned limits.
2. Creating a new token
Let create a new token by clicking on the New Token button. This will provide you with the Name Your Access Token dialog.
Enter the new name of the new Token by using your Initials e.g. RWC-Token and make sure to tick both Ingest Token and API Token checkboxes!
After you press OK you will be taken back to the Access Token UI. Here your new token should be present, among the ones created by others.
If you have made an error in your naming, want to disable/enable a token or set a Token limit, click on the ellipsis (…) menu button behind a token limit to open the manage token menu.
If you made a typo you can use the Rename Token option to correct the name of your token.
3. Disabling a token
If you need to make sure a token cannot be used to send Metrics in you can disable a token.
Click on Disable to disable the token, this means the token cannot be used for sending in data to Splunk Observability Cloud.
The line with your token should have become greyed out to indicate that it has been disabled as you can see in the screenshot below.
Go ahead and click on the ellipsis (…) menu button to Disable and Enable your token.
4. Manage token usage limits
Now, let’s start limiting usage by clicking on Manage Token Limit in the 3 … menu.
This will show the Manage Token Limit Dialog:
In this dialog, you can set the limits per category.
Please go ahead and specify the limits as follows for each usage metric:
Limit
Value
Host Limit
5
Container Limit
15
Custom Metric Limit
20
High Resolution Metric Limit
0
For our lab use your email address, and double check that you have the correct numbers in your dialog box as shown in the table above.
Token limits are used to trigger an alert that notifies one or more recipients when the usage has been above 90% of the limit for 5 minutes.
To specify the recipients, click Add Recipient, then select the recipient or notification method you want to use (specifying recipients is optional but highly recommended).
The severity of token alerts is always Critical.
Click on Update to save your Access Tokens limits and The Alert Settings.
Note: Going above token limit
When a token is at or above its limit in a usage category, new metrics for that usage category will not be stored and processed by Observability Cloud. This will make sure there will be no unexpected cost due to a team sending in data without restriction.
Note: Advanced alerting
If you wish to get alerts before you hit 90%, you can create additional detectors using whatever values you want. These detectors could target the Teams consuming the specific Access Tokens so they can take action before the admins need to get involved.
In your company you would distribute these new Access Tokens to various teams, controlling how much information/data they can send to Observability Cloud.
This will allow you to fine-tune the way you consume your Observability Cloud allotment and prevent overages from happening.
Congratulations! You have now completed the Service Bureau module.
Build a Distributed Trace in Lambda and Kinesis
45 minutesAuthor
Katie Hymers
This workshop will equip you with how a distributed trace is constructed for a small serverless application that runs on AWS Lambda, producing and consuming a message via AWS Kinesis.
We will see how auto-instrumentation works with manual steps to force a Producer function’s context to be sent to Consumer function via a Record put on a Kinesis stream.
For this workshop Splunk has prepared an Ubuntu Linux instance in AWS/EC2 all pre-configured for you.
To get access to the instance that you will be using in the workshop, please visit the URL provided by the workshop leader.d
Subsections of Build a Distributed Trace in Lambda and Kinesis
Setup
This lab will make a tracing superhero out of you!
In this lab you will learn how a distributed trace is constructed for a small serverless application that runs on AWS Lambda, producing and consuming your message via AWS Kinesis.
Pre-requisites
You should already have the lab content available on your EC2 lab host.
Ensure that this lab’s required folder o11y-lambda-lab is on your home directory:
cd ~ && ls
o11y-lambda-lab
Note
If you don’t see it, fetch the lab contents by running the following command:
In your Splunk Observability Cloud Organisation (Org) obtain your Access Token and Realm Values.
Please reset your environment variables from the earlier lab. Take care that for this lab we may be using different names - make sure to match the Environment Variable names below.
Examine the output of the updated serverless.yml contents (you may need to scroll up to the relevant section).
cat ~/o11y-lambda-lab/auto/serverless.yml
# USER SET VALUES ===================== custom:accessToken:<updated to your Access Token>realm:<updated to your Realm>prefix:<updated to your Hostname>#======================================
Update Manual instrumentation template
Update your manual instrumentation Serverless template to include new values from the Enviornment variables.
Examine the output of the updated serverless.yml contents (you may need to scroll up to the relevant section).
cat ~/o11y-lambda-lab/manual/serverless.yml
# USER SET VALUES ===================== custom:accessToken:<updated to your Access Token>realm:<updated to your Realm>prefix:<updated to your Hostname>#======================================
Set your AWS Credentials
You will be provided with AWS Access Key ID and AWS Secret Access Key values - substitue these values in place of AWS_ACCESS_KEY_ID and AWS_ACCESS_KEY_SECRET in the bellow command:
This command will create a file ~/.aws/credentials with your AWS Credentials populated.
Note that we are using sls here, which is a Serverless framework for developing and deploying AWS Lambda functions. We will be using this command throughout the lab.
Now you are set up and ready go!
Auto-Instrumentation
Auto-Instrumentation
Navigate to the auto directory that contains auto-instrumentation code.
cd ~/o11y-lambda-lab/auto
Inspect the contents of the files in this directory. Take a look at the serverless.yml template.
cat serverless.yml
Workshop Question
Can you identify which AWS entities are being created by this template?
Can you identify where OpenTelemetry instrumentation is being set up?
Can you determine which instrumentation information is being provided by the Environment Variables?
You should see the Splunk OpenTelemetry Lambda layer being added to each fuction.
Using the environment variables we are configuring and enriching our auto-instrumentation.
Here we provide minimum information, such as NodeJS wrapper location in the Splunk APM Layer, environment name, service name, and our Splunk Org credentials. We are sending trace data directly to Splunk Observability Cloud. You could alternatively export traces to an OpenTelemetry Collector set up in Gateway mode.
Take a look at the function code.
cat handler.js
Workshop Question
Can you identify the code for producer function?
Can you identify the code for consumer function?
Notice there is no mention of Splunk or OpenTelemetry in the code. We are adding the instrumentation using the Lambda layer and Environment Variables only.
Deploy your Lambdas
Run the following command to deploy your Lambda Functions:
sls deploy
Deploying hostname-lambda-lab to stage dev (us-east-1)
...
...
endpoint: POST - https://randomstring.execute-api.us-east-1.amazonaws.com/dev/producer
functions:
  producer: hostname-lambda-lab-dev-producer (1.6 kB)
  consumer: hostname-lambda-lab-dev-consumer (1.6 kB)
This command will follow the instructions in your serverless.yml template to create your Lambda functions and your Kinesis stream. Note it may take a 1-2 minutes to execute.
Note
serverless.yml is in fact a CloudFormation template. CloudFormation is an infrastructure as code service from AWS. You can read more about it here - https://aws.amazon.com/cloudformation/
Check the details of your serverless functions:
sls info
Take note of your endpoint value:
Send some Traffic
Use the curl command to send a payload to your producer function. Note the command option -d is followed by your message payload.
Try changing the value of name to your name and telling the Lambda function about your superpower. Replace YOUR_ENDPOINT with the endpoint from your previous step.
You should see the following output if your message is successful:
{"message":"Message placed in the Event Stream: hostname-eventSteam"}
If unsuccessful, you will see:
{"message": "Internal server error"}
If this occurs, ask one of the lab facilitators for assistance.
If you see a success message, generate more load: re-send that messate 5+ times. You should keep seeing a success message after each send.
Check the lambda logs output:
Producer function logs:
sls logs -f producer
Consumer function logs:
sls logs -f consumer
Examine the logs carefully.
Workshop Question
Do you see OpenTelemetry being loaded? Look out for lines with splunk-extension-wrapper.
Lambdas in Splunk APM
Lambdas in Splunk APM
Now it’s time to check how your Lambda traffic has been captured in Splunk APM.
Navigate to your Splunk Observability Cloud
Select APM from the Main Menu and then select your APM Environment. Your APM environment should be in the format $INSTANCE-apm-lambda where the hostname value is a four letter name of your lab host. (Check it by looking at your command prompt, or by running echo $INSTANCE).
Note
It may take a few minutes for you traces to appear in Splunk APM. Try hitting refresh on your browser until you find your environement name in the list of Envrionments
Go to Explore the Service Map to see the Dependencies between your Lambda Functions.
You should be able to see the producer-lambda and the call it is making to Kinesis service.
Workshop Question
What about your consumer-lambda?
Click into Traces and examine some traces that container procuder function calls and traces with consumer function calls.
We can see the producer-lambda putting a Record on the Kinesis stream. But the action of consumer-function is disconnected!
This is because the Trace Context is not being propagated.
This is not something that is supported automatically Out-of-the-Box by Kinesis service at the time of this lab. Our Distributed Trace stops at Kinesis inferred service, and we can’t see the propagation any further.
Not yet…
Let’s see how we work around this in the next section of this lab.
Manual Instrumentation
Manual Instrumentation
Navigate to the manual directory that contains manually instrumentated code.
cd ~/o11y-lambda-lab/manual
Inspect the contents of the files in this directory. Take a look at the serverless.yml template.
cat serverless.yml
Workshop Question
Do you see any difference from the same file in your auto directory?
While remaining in your manual directory, run the following commandd to re-deploy your Lambda Functions:
sls deploy -f producer
Deploying function producer to stage dev (us-east-1)

✔ Function code deployed (6s)
Configuration did not change. Configuration update skipped. (6s)
sls deploy -f consumer
Deploying function consumer to stage dev (us-east-1)

✔ Function code deployed (6s)
Configuration did not change. Configuration update skipped. (6s)
Note that this deployment now only updates the code changes within the function. Our configuration remains the same.
Check the details of your serverless functions:
sls info
You endpoint value should remain the same:
Send some Traffic again
Use the curl command to send a payload to your producer function. Note the command option -d is followed by your message payload.
Try changing the value of name to your name and telling the Lambda function about your superpower. Replace YOUR_ENDPOINT with the endpoint from your previous step.
You should see the following output if your message is successful:
{"message":"Message placed in the Event Stream: hostname-eventSteam"}
If unsuccessful, you will see:
{"message":"Internal server error"}
If this occurs, ask one of the lab facilitators for assistance.
If you see a success message, generate more load: re-send that messate 5+ times. You should keep seeing a success message after each send.
Check the lambda logs output:
sls logs -f producer
sls logs -f consumer
Examine the logs carefully.
Workshop Question
Do you notice the difference?
Note that we are logging our Record together with the Trace context that we have added to it. Copy one of the underlined sub-sections of your trace parent context, and save it for later.
It should be self-explanatory from the Propagator we are creating in the Functions
Workshop Question
Bonus Question: What happens if we mix and match the W3C and B3 headers?
Expand the consumer-lambda span.
Workshop Question
Can you find the attributes from your message?
Summary
Before you Go
Please kindly clean up your lab using the following command:
sls remove
Conclusion
Congratuations on finishing the lab. You have seen how we complement auto-instrumentation with manual steps to force Producer function’s context to be sent to Consumer function via a Record put on a Kinesis stream. This allowed us to build the expected Distributed Trace.
You can now build out a Trace manually by linking two different functions together. This is very powerful when your auto-instrumenation, or third-party systems, do not support context propagation out of the box.
Getting Data In (GDI) with OTel and UF
45 minutes
During this technical workshop, you will learn how to:
Efficiently deploy complex environments
Capture metrics from these environments to Splunk Observability Cloud
Auto-instrument a Python application
Enable OS logging to Splunk Enterprise via Universal Forwarder
To simplify the workshop modules, a pre-configured AWS EC2 instance is provided.
By the end of this technical workshop, you will have an approach to demonstrating metrics collection for complex environments and services.
Subsections of Getting Data In (GDI) with OTel and UF
Getting Started with O11y GDI - Real Time Enrichment Workshop
Please note to begin the following lab, you must have completed the prework:
Obtain a Splunk Observability Cloud access key
Understand cli commands
Follow these steps if using O11y Workshop EC2 instances
cd /home/splunk
git clone https://github.com/leungsteve/realtime_enrichment.git
cd realtime_enrichment/workshop
python3 -m venv rtapp-workshop
source rtapp-workshop/bin/activate
Deploy Complex Environments and Capture Metrics
Objective: Learn how to efficiently deploy complex infrastructure components such as Kafka and MongoDB to demonstrate metrics collection with Splunk O11y IM integrations
Duration: 15 Minutes
Scenario
A prospect uses Kafka and MongoDB in their environment. Since there are integrations for these services, you’d like to demonstrate this to the prospect. What is a quick and efficient way to set up a live environment with these services and have metrics collected?
1. Where can I find helm charts?
Google “myservice helm chart”
https://artifacthub.io/ (Note: Look for charts from trusted organizations, with high star count and frequent updates)
Use information for each Helm chart and Splunk O11y Data Setup to generate values.yaml for capturing metrics from Kafka and MongoDB.
Note
values.yaml for the different services will be passed to the Splunk Helm Chart at installation time. These will configure the OTEL collector to capture metrics from these services.
Verify that out of the box dashboards for Kafka, MongoDB and Zookeeper are populated in the Infrastructure Monitor landing page. Drill down into each component to view granular details for each service.
Tip: You can use the filter k8s.cluster.name with your cluster name to find your instance.
Infrastructure Monitoring Landing page:
K8 Navigator:
MongoDB Dashboard:
Kafka Dashboard:
Code to Kubernetes - Python
Code to Kubernetes - Python
Objective: Understand activities to instrument a python application and run it on Kubernetes.
Verify the code
Containerize the app
Deploy the container in Kubernetes
Note: these steps do not involve Splunk
Duration: 15 Minutes
1. Verify the code - Review service
Navigate to the review directory
cd /home/splunk/realtime_enrichment/flask_apps/review/
fromflaskimportFlask,jsonifyimportrandomimportsubprocessreview=Flask(__name__)num_reviews=8635403num_reviews=100000reviews_file='/var/appdata/yelp_academic_dataset_review.json'@review.route('/')defhello_world():returnjsonify(message='Hello, you want to hit /get_review. We have '+str(num_reviews)+' reviews!')@review.route('/get_review')defget_review():random_review_int=str(random.randint(1,num_reviews))line_num=random_review_int+'q;d'command=["sed",line_num,reviews_file]# sed "7997242q;d" <file>random_review=subprocess.run(command,stdout=subprocess.PIPE,text=True)returnrandom_review.stdoutif__name__=="__main__":review.run(host='0.0.0.0',port=5000,debug=True)
Inspect requirements.txt
Flask==2.0.2
Create a virtual environment and Install the necessary python packages
Start the REVIEW service. Note: You can stop the app with control+C
python3 review.py
* Serving Flask app 'review'(lazy loading) * Environment: production
...snip...
* Running on http://10.160.145.246:5000/ (Press CTRL+C to quit) * Restarting with stat
127.0.0.1 - - [17/May/2022 22:46:38]"GET / HTTP/1.1"200 -
127.0.0.1 - - [17/May/2022 22:47:02]"GET /get_review HTTP/1.1"200 -
127.0.0.1 - - [17/May/2022 22:47:58]"GET /get_review HTTP/1.1"200 -
Verify that the service is working
Open a new terminal and ssh into your ec2 instance. Then use the curl command in your terminal.
curl http://localhost:5000
Or hit the URL http://{Your_EC2_IP_address}:5000 and http://{Your_EC2_IP_address}:5000/get_review with a browser
curl localhost:5000
{"message": "Hello, you want to hit /get_review. We have 100000 reviews!"}curl localhost:5000/get_review
{"review_id":"NjbiESXotcEdsyTc4EM3fg","user_id":"PR9LAM19rCM_HQiEm5OP5w","business_id":"UAtX7xmIfdd1W2Pebf6NWg","stars":3.0,"useful":0,"funny":0,"cool":0,"text":"-If you're into cheap beer (pitcher of bud-light for $7) decent wings and a good time, this is the place for you. Its generally very packed after work hours and weekends. Don't expect cocktails. \n\n-You run into a lot of sketchy characters here sometimes but for the most part if you're chilling with friends its not that bad. \n\n-Friendly bouncer and bartenders.","date":"2016-04-12 20:23:24"}
Workshop Question
What does this application do?
Do you see the yelp dataset being used?
Why did the output of pip freeze differ each time you ran it?
Which port is the REVIEW app listening on? Can other python apps use this same port?
2. Create a REVIEW container
To create a container image, you need to create a Dockerfile, run docker build to build the image referencing the Docker file and push it up to a remote repository so it can be pulled by other sources.
Verify that the deployment and services are running:
kubectl get deployments
NAME                                                    READY   UP-TO-DATE   AVAILABLE   AGE
review                                                  1/1     1            1           19h
kubectl get services
NAME                       TYPE        CLUSTER-IP      EXTERNAL-IP   PORT(S)                         AGE
review                     NodePort    10.43.175.21    <none>        5000:30000/TCP                  154d
curl localhost:30000
{
  "message": "Hello, you want to hit /get_review. We have 100000 reviews!"
}
curl localhost:30000/get_review
{"review_id":"Vv9rHtfBrFc-1M1DHRKN9Q","user_id":"EaNqIwKkM7p1bkraKotqrg","business_id":"TA1KUSCu8GkWP9w0rmElxw","stars":3.0,"useful":1,"funny":0,"cool":0,"text":"This is the first time I've actually written a review for Flip, but I've probably been here about 10 times. \n\nThis used to be where I would take out of town guests who wanted a good, casual, and relatively inexpensive meal. \n\nI hadn't been for a while, so after a long day in midtown, we decided to head to Flip. \n\nWe had the fried pickles, onion rings, the gyro burger, their special burger, and split a nutella milkshake. I have tasted all of the items we ordered previously (with the exception of the special) and have been blown away with how good they were. My guy had the special which was definitely good, so no complaints there. The onion rings and the fried pickles were greasier than expected. Though I've thought they were delicious in the past, I probably wouldn't order either again. The gyro burger was good, but I could have used a little more sauce. It almost tasted like all of the ingredients didn't entirely fit together. Something was definitely off. It was a friday night and they weren't insanely busy, so I'm not sure I would attribute it to the staff not being on their A game...\n\nDon't get me wrong. Flip is still good. The wait staff is still amazingly good looking. They still make delicious milk shakes. It's just not as amazing as it once was, which really is a little sad.","date":"2010-10-11 18:18:35"}
Workshop Question
What changes are required if you need to make an update to your Dockerfile now?
Instrument REVIEWS for Tracing
1. Use Data Setup to instrument a Python application
Monitor System Logs with Splunk Universal Forwarder
Objective: Learn how to monitor Linux system logs with the Universal Forwarder sending logs to Splunk Enterprise
Duration: 10 Minutes
Scenario
You’ve been tasked with monitoring the OS logs of the host running your Kubernetes cluster. We are going to utilize a script that will autodeploy the Splunk Universal Forwarder. You will then configure the Universal Forwarder to send logs to the Splunk Enterprise instance assigned to you.
1. Ensure You’re in the Correct Directory
we will need to be in /home/splunk/session-2
cd /home/splunk/session-2
2. Review the Universal Forwarder Install Script
Let’s take a look at the script that will install the Universal Forwarder and Linux TA automatically for you.
This script is primarily used for remote instances.
Note we are not using a deployment server in this lab, however it is recommended in production we do that.
What user are we installing Splunk as?
#!/bin/sh
# This EXAMPLE script shows how to deploy the Splunk universal forwarder# to many remote hosts via ssh and common Unix commands.# For "real" use, this script needs ERROR DETECTION AND LOGGING!!# --Variables that you must set -----# Set username using by splunkd to run.SPLUNK_RUN_USER="ubuntu"# Populate this file with a list of hosts that this script should install to,# with one host per line. This must be specified in the form that should# be used for the ssh login, ie. username@host## Example file contents:# splunkuser@10.20.13.4# splunkker@10.20.13.5HOSTS_FILE="myhost.txt"# This should be a WGET command that was *carefully* copied from splunk.com!!# Sign into splunk.com and go to the download page, then look for the wget# link near the top of the page (once you have selected your platform)# copy and paste your wget command between the ""WGET_CMD="wget -O splunkforwarder-9.0.3-dd0128b1f8cd-Linux-x86_64.tgz 'https://download.splunk.com/products/universalforwarder/releases/9.0.3/linux/splunkforwarder-9.0.3-dd0128b1f8cd-Linux-x86_64.tgz'"# Set the install file name to the name of the file that wget downloads# (the second argument to wget)INSTALL_FILE="splunkforwarder-9.0.3-dd0128b1f8cd-Linux-x86_64.tgz"# After installation, the forwarder will become a deployment client of this# host. Specify the host and management (not web) port of the deployment server# that will be managing these forwarder instances.# Example 1.2.3.4:8089# DEPLOY_SERVER="x.x.x.x:8089"# After installation, the forwarder can have additional TA's added to the # /app directory please provide the local where TA's will be. TA_INSTALL_DIRECTORY="/home/splunk/session-2"# Set the seed app folder name for deploymentclien.conf# DEPLOY_APP_FOLDER_NAME="seed_all_deploymentclient"# Set the new Splunk admin passwordPASSWORD="buttercup"REMOTE_SCRIPT_DEPLOY="
cd /opt
sudo $WGET_CMD sudo tar xvzf $INSTALL_FILE sudo rm $INSTALL_FILE #sudo useradd $SPLUNK_RUN_USER sudo find $TA_INSTALL_DIRECTORY -name '*.tgz' -exec tar xzvf {} --directory /opt/splunkforwarder/etc/apps \;
sudo chown -R $SPLUNK_RUN_USER:$SPLUNK_RUN_USER /opt/splunkforwarder
echo \"[user_info]
USERNAME = admin
PASSWORD = $PASSWORD\" > /opt/splunkforwarder/etc/system/local/user-seed.conf
#sudo cp $TA_INSTALL_DIRECTORY/*.tgz /opt/splunkforwader/etc/apps/
#sudo find /opt/splunkforwarder/etc/apps/ -name '*.tgz' -exec tar xzvf {} \;
#sudo -u splunk /opt/splunkforwarder/bin/splunk start --accept-license --answer-yes --auto-ports --no-prompt
/opt/splunkforwarder/bin/splunk start --accept-license --answer-yes --auto-ports --no-prompt
#sudo /opt/splunkforwarder/bin/splunk enable boot-start -user $SPLUNK_RUN_USER /opt/splunkforwarder/bin/splunk enable boot-start -user $SPLUNK_RUN_USER #sudo cp $TA_INSTALL_DIRECTORY/*.tgz /opt/splunkforwarder/etc/apps/
exit
"DIR="$(cd"$( dirname "${BASH_SOURCE[0]}")" >/dev/null &&pwd)"#===============================================================================================echo"In 5 seconds, will run the following script on each remote host:"echoecho"===================="echo"$REMOTE_SCRIPT_DEPLOY"echo"===================="echo sleep 5echo"Reading host logins from $HOSTS_FILE"echoecho"Starting."for DST in `cat "$DIR/$HOSTS_FILE"`;doif[ -z "$DST"];thencontinue;fiecho"---------------------------"echo"Installing to $DST"echo"Initial UF deployment" sudo ssh -t "$DST""$REMOTE_SCRIPT_DEPLOY"doneecho"---------------------------"echo"Done"echo"Please use the following app folder name to override deploymentclient.conf options: $DEPLOY_APP_FOLDER_NAME"
3. Run the install script
We will run the install script now. You will see some Warnings at the end. This is totally normal. The script is built for use on remote machines, however for todays lab you will be using localhost.
./install.sh
You will be asked Are you sure you want to continue connecting (yes/no/[fingerprint])?
Answer Yes.
Enter your ssh password when prompted.
4. Verify installation of the Universal Forwarader
We need to verify that the Splunk Universal Forwarder is installed and running.
You should see a couple PID’s return and a “Splunk is currently running.” message.
/opt/splunkforwarder/bin/splunk status
5. Configure the Universal Forwarder to Send Data to Splunk Enterprise
We will be able to send the data to our Splunk Enterprise environment easily by entering one line into the cli.
6. Verify the Data in Your Splunk Enterprise Environment
We are now going to take a look at the Splunk Enterprise environment to verify logs are coming in.
Logs will be coming into index=main
Open your web browser and navigate to: http://<your_splunk_enterprise_ip:8000
You will use the credentials admin:<your_ssh_password>
In the search bar, type in the following:
index=main host=<your_host_name>
You should see data from your host. Take note of the interesting fields and the different data sources flowing in.
Splunk OnCall
1 hour 30 minutesAuthor
Geoff Higginbottom
Aim
This module is simply to ensure you have access to the Splunk On-Call UI (formerly known as VictorOps), Splunk Infrastructure Monitoring UI (formerly known as SignalFx) and the EC2 Instance which has been allocated to you.
Once you have access to each platform, keep them open for the duration of the workshop as you will be switching between them and the workshop instructions.
1. Activate your Splunk On-Call Login
You should have received an invitation to Activate your Splunk On-Call account via e-mail, if you have not already done so, click the Activate Account link and follow the prompts.
If you did not receive an invitation it is probably because you already have a Splunk On-Call login, linked to a different organization.
If so log in to that Org, then use the organization dropdown next to your username in the top left to switch to the Observability Workshop Org.
Note
If you do not see the Organisation dropdown menu item next to your name with Observability Workshop EMEA that is OK, it simply means you only have access to a single Org so that menu is not visible to you.
2. Activate your Splunk Infrastructure Monitoring Login
You should have received an invitation to join the Splunk Infrastructure Monitoring - Observability Workshop. If you have not already done so click the JOIN NOW button and follow the prompts to set a password and activate your login.
3. Access your EC2 Instance
Splunk has provided you with a dedicated EC2 Instance which you can use during this workshop for triggering Incidents the same way the instructor did during the introductory demo. This VM has Splunk Infrastructure Monitoring deployed and has an associated Detector configured. The Detector will pass Alerts to Splunk On-Call which will then create Incidents and page the on-call user.
The welcome e-mail you received providing you all the details for this Workshop contain the instructions for accessing your allocated EC2 Instance.
SSH (Mac OS/Linux)
Most attendees will be able to connect to the workshop by using SSH from their Mac or Linux device.
To use SSH, open a terminal on your system and type ssh splunk@x.x.x.x (replacing x.x.x.x with the IP address found in your welcome e-mail).
When prompted Are you sure you want to continue connecting (yes/no/[fingerprint])? please type yes.
Enter the password provided in the welcome e-mail.
Upon successful login you will be presented with the Splunk logo and the Linux prompt.
If you are blocked from using SSH (Port 22) or unable to install Putty you may be able to connect to the workshop instance by using a web browser.
!!! note
This assumes that access to port 6501 is not restricted by your company’s firewall.
Open your web browser and type http://x.x.x.x:650 (where x.x.x.x is the IP address from the welcome e-mail).
Once connected, login in as splunk and the password is the one provided in the welcome e-mail.
Once you are connected successfully you should see a screen similar to the one below:
Copy & Paste in browser
Unlike when you are using regular SSH, copy and paste does require a few extra steps to complete when using a browser session. This is due to cross browser restrictions.
When the workshop asks you to copy instructions into your terminal, please do the following:
Copy the instruction as normal, but when ready to paste it in the web terminal, choose Paste from browser as show below:
This will open a dialogue box asking for the text to be pasted into the web terminal:
Paste the text in the text box as show, then press OK to complete the copy and paste process.
Unlike regular SSH connection, the web browser has a 60 second time out, and you will be disconnected, and a Connect button will be shown in the center of the web terminal.
Simply click the Connect button and you will be reconnected and will be able to continue.
The aim of this module is for you to configure your personal profile which controls how you will be notified by Splunk On-Call whenever you get paged.
1. Contact Methods
Switch to the Splunk On-Call UI and click on your login name in the top right hand corner and chose Profile from the drop down. Confirm your contact methods are listed correctly and add any additional phone numbers and e-mail address you wish to use.
2. Mobile Devices
To install the Splunk On-Call app for your smartphone search your phones App Store for Splunk On-Call to find the appropriate version of the app. The publisher should be listed as VictorOps Inc.
Install the App and login, then refresh the Profile page and your device should now be listed under the devices section. Click the Test push notification button and confirm you receive the test message.
3. Personal Calendar
This link will enable you to sync your on-call schedule with your calendar, however as you do not have any allocated shifts yet this will currently be empty. You can add it to your calendar by copying the link into your preferred application and setting it up as a new subscription.
4. Paging Policies
Paging Polices specify how you will be contacted when on-call. The Primary Paging Policy will have defaulted to sending you an SMS assuming you added your phone number when activating your account. We will now configure this policy into a three tier multi-stage policy similar to the image below.
4.1 Send a push notification
Click the edit policy button in the top right corner for the Primary Paging Policy.
Send a push notification to all my devices
Execute the next step if I have not responded within 5 minutes
Click Add a Step
4.2 Send an e-mail
Send an e-mail to [your email address]
Execute the next step if I have not responded within 5 minutes
Click Add a Step
4.3 Call your number
Every 5 minutes until we have reached you
Make a phone call to [your phone number]
Click Save to save the policy.
When you are on-call or in the escalation path of an incident, you will receive notifications in this order following these time delays.
To cease the paging you must acknowledge the incident. Acknowledgements can occur in one of the following ways:
Expanding the Push Notification on your device and selecting Acknowledge
Responding to the SMS with the 5 digit code included
Pressing 4 during the Phone Call
Slack Button
For more information on Notification Types, see here.
5. Custom Paging Policies
Custom paging polices enable you to override the primary policy based on the time and day of the week. A good example would be to get the system to immediately phone you whenever you get a page during the evening or weekends as this is more likely to get your attention than a push notification.
Create a new Custom Policy by clicking Add a Policy and configure with the following settings:
5.1 Custom evening policy
Policy Name: Evening
Every 5 minutes until we have reached you
Make a phone call to [your phone number]
Time Period: All 7 Days
Time zone
Between 7pm and 9am
Click Save to save the policy then add one more.
5.2 Custom weekend policy
Policy Name: Weekend
Every 5 minutes until we have reached you
Make a phone call to [your phone number]
Time Period: Sat & Sun
Time zone
Between 9am and 7pm
Click Save to save the policy.
These custom paging policies will be used during the specified times in place of the Primary Policy. However, admins do have the ability to ignore these custom policies, and we will highlight how this is achieved in a later module.
The final option here is the setting for Recovery Notifications. These are typically low priority, will default to Push, but can also be email, sms or phone call. Your profile is now fully configured using these example configurations.
Organizations will have different views on how profiles should be configured and will typically issue guidelines for paging policies and times between escalations etc.
Please wait for the instructor before proceeding to the Teams module.
Subsections of User Profile
Teams
Aim
The aim of this module is for you to complete the first step of Team configuration by adding users to your Team.
1. Find your Team
Navigate to the Teams tab on the main toolbar, you should find you that a Team has been created for you as part of the workshop pre-setup and you would have been informed of your Team Name via e-mail.
If you have found your pre-configured Team, skip Step 2. and proceed to Step 3. Configure Your Team. However, if you cannot find your allocated Team, you will need to create a new one, so proceed with Step 2. Create Team
2. Create Team
Only complete this step if you cannot find your pre-allocated Team as detailed in your workshop e-mail. Select Add Team, then enter your allocated team name, this will typically be in the format of “AttendeeID Workshop” and then save by clicking the Add Team button.
3. Configure Your Team
You now need to add other users to your team. If you are running this workshop using the Splunk provided environment, the following accounts are available for testing. If you are running this lab in your own environment, you will have been provided a list of usernames you can use in place of the table below.
These users are dummy accounts who will not receive notifications when they are on call.
Name
Username
Shift
Duane Chow
duanechow
Europe
Steven Gomez
gomez
Europe
Walter White
heisenberg
Europe
Jim Halpert
jimhalpert
Asia
Lydia Rodarte-Quayle
lydia
Asia
Marie Schrader
marie
Asia
Maximo Arciniega
maximo
West Coast
Michael Scott
michaelscott
West Coast
Tuco Salamanca
tuco
West Coast
Jack Welker
jackwelker
24/7
Hank Schrader
hank
24/7
Pam Beesly
pambeesly
24/7
Add the users to your team, using either the above list or the alternate one provided to you. The value in the Shift column can be ignored for now, but will be required for a later step.
Click Invite User button on the right hand side, then either start typing the usernames (this will filter the list), or copy and paste them into the dialogue box. Once all users are added to the list click the Add User button.
To make a team member a Team Admin, simply click the :fontawesome-regular-edit: icon in the right hand column, pick any user and make them an Admin.
Tip
For large team management you can use the APIs to streamline this process.
A rotation is a recurring schedule, that consists of one or more shifts, with members who rotate through a shift.
The aim of this module is for you to configure two example Rotations, and assign Team Members to the Rotations.
Navigate to the Rotations tab on the Teams sub menu, you should have no existing Rotations so we need to create some.
The 1st Rotation you will create is for a follow the sun support pattern where the members of each shift provide cover during their normal working hours within their time zone.
The 2nd will be a Rotation used to provide escalation support by more experienced senior members of the team, based on a 24/7, 1 week shift pattern.
1. Follow the Sun Support - Business Hours
Click Add Rotation
Enter a name of “Follow the Sun Support - Business Hours” and Select Partial day from the three available shift templates.
Enter a Shift name of “Asia”
Time Zone set to “Asia/Tokyo”
Each user is on duty from “Monday through Friday from 9.00am to 5.00pm”
Handoff happens every “5 days”
The next handoff happens - Select the next Monday using the calendar
Click Save Rotation
You will now be prompted to add Members to this shift; add the Asia members who are Jim Halpert, Lydie Rodarte-Quayle and Marie Schrader, but only if you’re using the Splunk provided environment for this workshop.
If you’re using your own Organisation refer to the specific list provided separately.
Now add an 2nd shift for Europe by again clicking +Add a shift → Partial Day
Enter a Shift name of “Europe”
Time Zone set to “Europe/London”
Each user is on duty from “Monday through Friday from 9.00am to 5.00pm”
Handoff happens every “5 days”
The next handoff happens - Select the next Monday using the calendar
Click Save Shift
You will again be prompted to add Members to this shift; add the Europe members who are Duane Chow, Steven Gomez and Walter White, but only if you’re using the Observability Workshop Org for this workshop.
If you’re using your own Organisation refer to the specific list provided separately.
Now add a 3rd shift for West Coast USA by again clicking +Add a shift - Partial Day
Enter a Shift name of “West Coast”
Time Zone set to “US/Pacific”
Each user is on duty from “Monday through Friday from 9.00am to 5.00pm”
Handoff happens every “5 days”
The next handoff happens - Select the next Monday using the calendar
Click Save Shift
You will again be prompted to add Members to this shift; add the West Coast members who are Maximo Arciniega, Michael Scott and Tuco Salamanca, but only if you’re using the Observability Workshop Org for this workshop.
If you’re using your own Organisation refer to the specific list provided separately.
The first user added will be the ‘current’ user for that shift.
You can re-order the shifts by simply dragging the users up and down, and you can change the current user by clicking Set Current on an alternate user
You will now have three different Shift patterns, that provide cover 24hr hours, Mon - Fri, but with no cover at weekends.
We will now add another Rotation for our Senior SRE Escalation cover.
2. Senior SRE Escalation
Click Add Rotation
Enter a name of “Senior SRE Escalation”
Select 24/7 from the three available shift templates
Enter a Shift name of “Senior SRE Escalation”
Time Zone set to “Asia/Tokyo”
Handoff happens every “7 days at 9.00am”
The next handoff happens [select the next Monday from the date picker]
Click Save Rotation
You will again be prompted to add Members to this shift; add the 24/7 members who are Jack Welker, Hank Schrader and Pam Beesly, but only if you’re using the Observability Workshop Org for this workshop.
If you’re using your own Organisation refer to the specific list provided separately.
Please wait for the instructor before proceeding to the Configuring Escalation Policies module.
Configure Escalation Policies
Aim
Escalation policies determine who is actually on-call for a given team and are the link to utilizing any rotations that have been created.
The aim of this module is for you to create three different Escalation Policies to demonstrate a number of different features and operating models.
The instructor will start by explaining the concepts before you proceed with the configuration.
Navigate to the Escalation Polices tab on the Teams sub menu, you should have no existing Polices so we need to create some.
We are going to create the following Polices to cover off three typical use cases.
1. 24/7 Policy
Click Add Escalation Policy
Policy Name: 24/7
Step 1
Immediately
Notify the on-duty user(s) in rotation → Senior SRE Escalation
Click Save
2. Primary Policy
Click Add Escalation Policy
Policy Name: Primary
Step 1
Immediately
Notify the on-duty user(s) in rotation → Follow the Sun Support - Business Hours
Click Add Step
Step 2
If still un-acknowledged after 15 minutes
Notify the next user(s) in the current on-duty shift → Follow the Sun Support - Business Hours
Click Add Step
Step 3
If still un-acknowledged after 15 more minutes
Execute Policy → [Your Team Name] : 24/7
Click Save
3. Waiting Room Policy
Click Add Escalation Policy
Policy Name: Waiting Room
Step 1
If still un-acknowledged after 10 more minutes
Execute Policy → [Your Team Name] : Primary
Click Save
You should now have the following three escalation polices:
You may have noticed that when we created each policy there was the following warning message:
Warning
There are no routing keys for this policy - it will only receive incidents via manual reroute or when on another escalation policy
This is because there are no Routing Keys linked to these Escalation Polices, so now that we have these polices configured we can create the Routing Keys and link them to our Polices..
Routing Keys map the incoming alert messages from your monitoring system to an Escalation Policy which in turn sends the notifications to the appropriate team.
Note that routing keys are case insensitive and should only be composed of letters, numbers, hyphens, and underscores.
The aim of this module is for you to create some routing keys and then link them to your Escalation Policies you have created in the previous exercise.
1. Instance ID
Each participant requires a unique Routing Key so we use the Hostname of the EC2 Instance you were allocated. We are only doing this to ensure your Routing Key is unique and we know all Hostnames are unique. In a production deployment the Routing Key would typically reflect the name of a System or Service being monitored, or a Team such as 1st Line Support etc.
Your welcome e-mail informed you of the details of your EC2 Instance that has been provided for you to use during this workshop and you should have logged into this as part of the 1st exercise.
The e-mail also contained the Hostname of the Instance, but you can also obtain it from the Instance directly. To get your Hostname from within the shell session connected to your Instance run the following command:
echo${HOSTNAME}
zevn
It is very important that when creating the Routing Keys you use the 4 letter hostname allocated to you as a Detector has been configured within Splunk Infrastructure Monitoring using this hostname, so any deviation will cause future exercises to fail.
2 Create Routing Keys
Navigate to Settings on the main menu bar, you should now be at the Routing Keys page.
You are going to create the following two Routing Keys using the naming conventions listed in the following table, but replacing {==HOSTNAME==} with the value from above and replace TEAM_NAME with the team you were allocated or created earlier.
Routing Key
Escalation Policies
HOSTNAME_PRI
TEAM_NAME : Primary
HOSTNAME_WR
TEAM_NAME : Waiting Room
There will probably already be a number of Routing Keys configured, but to add a new one simply scroll to the bottom of the page and then click Add Key
In the left hand box, enter the name for the key as per the table above. In the Routing Key column, select your Teams Primary policy from the drop down in the Escalation Polices column. You can start typing your Team Name to filter the results.
Note
If there are a large number of participants on the workshop, resulting in an unusually large number of Escalation Policies sometimes the search filter does not list all the Policies under your Team Name. If this happens instead of using the search feature, simply scroll down to your team name, all the policies will then be listed.
Repeat the above steps for both Keys, xxxx_PRI and xxxx_WR, mapping them to your Teams Primary and Waiting Room policies.
You should now have two Routing Keys configured, similar to the following:
Tip
You can assign a Routing Key to multiple Escalation Policies if required by simply selecting more from the list
If you now navigate back to Teams → [Your Team Name] → Escalation Policies and look at the settings for your Primary and Waiting Room polices you will see that these now have Routes assigned to them.
The 24/7 policy does not have a Route assigned as this will only be triggered via an Execute Policy escalation from the Primary policy.
Please wait for the instructor before proceeding to the Incident Lifecycle/Overview module.
Incident Lifecycle
Aim
The aim of this module is for you to get more familiar with the Timeline Tab and the filtering features.
1. Timeline
The aim of Splunk On-Call is to make being on call more bearable, and it does this by getting the critical data, to the right people, at the right time.
The key to making it work for you is to centralize all your alerting sources, sending them all to the Splunk On-Call platform, then you have a single pane of glass in which to manage all of your alerting.
Login to the Splunk On-Call UI and select the Timeline tab on the main menu bar, you should have a screen similar to the following image:
2. People
On the left we have the People section with the Teams and Users sub tabs. On the Teams tab, click on All Teams then expand [Your Team name].
Users with the Splunk On-Call Logo against their name are currently on call. Here you can see who is on call within a particular Team, or across all Teams via Users → On-Call.
If you click into one of the currently on call users, you can see their status. It shows which Rotation they are on call for, when their current Shift ends and their next Shift starts (times are displayed in your time zone), what contact methods they have and which Teams they belong to (dummy users such as Hank do not have Contact Methods configured).
3. Timeline
In the centre Timeline section you get a realtime view of what is happening within your environment with the newest messages at the top. Here you can quickly post update messages to make your colleagues aware of important developments etc.
You can filter the view using the buttons on the top toolbar showing only update messages, GitHub integrations, or apply more advanced filters.
Lets change the Filters settings to streamline your view. Click the Filters button then within the Routing Keys tab change the Show setting from all routing keys to selected routing keys. Change the My Keys value to all and the Other Keys value to selected and deselect all keys under the Other Keys section.
Click anywhere outside of the dialogue box to close it.
You will probably now have a much simpler view as you will not currently have Incidents created using your Routing Keys, so you are left with the other types of messages that the Timeline can display.
Click on Filters again, but this time switch to the Message Types tab. Here you control the types of messages that are displayed.
For example, deselect On-call Changes and Escalations, this will reduce the amount of messages displayed.
4. Incidents
On the right we have the Incidents section. Here we get a list of all the incidents within the platform, or we can view a more specific list such as incidents you are specifically assigned to, or for any of the Teams you are a member of.
Select the Team Incidents tab you should find that the Triggered, Acknowledged & Resolved tabs are currently all empty as you have had no incidents logged.
Let’s change that by generating your first incident!
The aim of this module is for you to place yourself ‘On-Call’ then generate an Incident using the supplied EC2 Instance so you can then work through the lifecycle of an Incident.
1. On-Call
Before generating any incidents you should assign yourself to the current Shift within your Follow the Sun Support - Business Hours Rotation and also place yourself On-Call.
Click on the Schedule link within your Team in the People section on the left, or navigate to Teams → [Your Team] → Rotations
Expand the Follow the Sun Support - Business Hours Rotation
Click on the Manage members icon (the figures) for the current active shift depending on your time zone
Use the Select a user to add… dropdown to add yourself to the shift
Then click on Set Current next to your name to make yourself the current on-call user within the shift
You should now get a Push Notification to your phone informing you that You Are Now On-Call
2. Trigger Alert
Switch back to your shell session connected to your EC2 Instance; all of the following commands will be executed from your Instance.
Force the CPU to spike to 100% by running the following command:
This will result in an Alert being generated by Splunk Infrastructure Monitoring which in turn will generate an Incident within Splunk On-Call within a maximum of 10 seconds. This is the default polling time for the OpenTelemetry Collector installed on your instance (note it can be reduced to 1 second).
Use your Splunk On-Call App on your phone to acknowledge the Incident by clicking on the push notification …
…to open the alert in the Splunk On-Call mobile app, then clicking on either the single tick in the top right hand corner, or the Acknowledge link to acknowledge the incident and stop the escalation process.
The :fontawesome-solid-check: will then transform into a :fontawesome-solid-check::fontawesome-solid-check:, and the status will change from TRIGGERED to ACKNOWLEDGED.
Triggered Incident
Acknowledge Incident
2. Details and Annotations
Still on your phone, select the Alert Details tab. Then on the Web UI, navigate back to Timeline, select Team Incidents on the right, then select Acknowledged and click into the new Incident, this will open up the War Room Dashboard view of the Incident.
You should now have the Details tab displayed on both your Phone and the Web UI. Notice how they both show the exact same information.
Now select the Annotations tab on both the Phone and the Web UI, you should have a Graph displayed in the UI which is generated by Splunk Infrastructure Monitoring.
On your phone you should get the same image displayed (sometimes it’s a simple hyperlink depending on the image size)
Splunk On-Call is a ‘Mobile First’ platform meaning the phone app is full functionality and you can manage an incident directly from your phone.
For the remainder of this module we will focus on the Web UI however please spend some time later exploring the phone app features.
3. Link to Alerting System
Sticking with the Web UI, click the 2. Alert Details in SignalFx link.
This will open a new browser tab and take you directly to the Alert within Splunk Infrastructure Monitoring where you could then progress your troubleshooting using the powerful tools built into its UI.
However, we are focussing on Splunk On-Call so close this tab and return to the Splunk On-Call UI.
4. Similar Incidents
What if Splunk On-Call could identify previous incidents within the system which may give you a clue to the best way to tackle this incident.
The Similar Incidents tab does exactly that, surfacing previous incidents allowing you to look at them and see what actions were taken to resolve them, actions which could be easily repeated for this incident.
5 Timeline
On right we have a Time Line view where you can add messages and see the history of previous alerts and interactions.
6 Add Responders
On the far left you have the option of allocating additional resources to this incident by clicking on the Add Responders link.
This allows you build a virtual team specific to this incident by adding other Teams or individual Users, and also share details of a Conference Bridge where you can all get together and collaborate.
Once the system has built up some incident data history, it will use Machine Learning to suggest Teams and Users who have historically worked on similar incidents, as they may be best placed to help resolve this incident quickly.
You can select different Teams and/or Users and also choose from a pre-configured conference bridge, or populate the details of a new bridge from your preferred provider.
We do not need to add any Responders in this exercise so close the Add Responders dialogue by clicking Cancel.
7 Reroute
If it’s decided that maybe the incident could be better dealt with by a different Team, the call can be Rerouted by clicking the Reroute Button at the top of the left hand panel.
In a similar method to that used in the Add Responders dialogue, you can select Teams or Users to Reroute the Incident to.
We do not need to actually Reroute in this exercise so close the Reroute Incident dialogue by clicking Cancel.
8 Snooze
You can also snooze this incident by clicking on the alarm clock Button at the top of the left hand panel.
You can enter an amount of time upto 24 hours to snooze the incident. This action will be tracked in the Timeline, and when the time expires the paging will restart.
This is useful for low priority incidents, enabling you to put them on a back burner for a few hours, but it ensures they do not get forgotten thanks to the paging process starting again.
We do not need to actually Snooze in this exercise so close the Snooze Incident dialogue by clicking Cancel.
9 Action Tracking
Now lets fix this issue and update the Incident with what we did. Add a new message at the top of the right hand panel such as Discovered rogue process, terminated it.
All the actions related to the Incident will be recorded here, and can then be summarized is a Post Incident Review Report available from the Reports tab
10 Resolution
Now kill off the process we started in the VM to max out the CPU by switching back the Shell session for the VM and pressing ctrl+c
Within no more than 10 seconds SignalFx should detect the new CPU value, clear the alert state in SignalFx, then automatically update the Incident in VictorOps marking it as Resolved.
As we have two way integration between Splunk Infrastructure Monitoring and Splunk On-Call we could have also marked the incident as Resolved in Splunk On-Call, and this would have resulted in the alert in Splunk Infrastructure Monitoring being resolved as well.
That completes this introduction to Splunk On-Call!