Automatic discovery and configuration for Java
You can now start the application with the following command. Notice that we are passing the mysql profile to the application, this will tell the application to use the MySQL database we started earlier. We are also setting the otel.service.name and otel.resource.attributes to a logical names using the instance name. These will also be used in the UI for filtering:
java \
-Dserver.port=8083 \
-Dotel.service.name=$INSTANCE-petclinic-service \
-Dotel.resource.attributes=deployment.environment=$INSTANCE-petclinic-env \
-jar target/spring-petclinic-*.jar --spring.profiles.active=mysql
You can validate the application is running by visiting http://<IP_ADDRESS>:8083 (replace <IP_ADDRESS> with the IP address you obtained earlier).
When we installed the collector we configured it to enable AlwaysOn Profiling and Metrics. This means that the collector will automatically generate CPU and Memory profiles for the application and send them to Splunk Observability Cloud.
When you start the PetClinic application you will see the collector automatically detect the application and instrument it for traces and profiling.
Picked up JAVA_TOOL_OPTIONS: -javaagent:/usr/lib/splunk-instrumentation/splunk-otel-javaagent.jar
OpenJDK 64-Bit Server VM warning: Sharing is only supported for boot loader classes because bootstrap classpath has been appended
[otel.javaagent 2024-08-20 11:35:58:970 +0000] [main] INFO io.opentelemetry.javaagent.tooling.VersionLogger - opentelemetry-javaagent - version: splunk-2.6.0-otel-2.6.0
[otel.javaagent 2024-08-20 11:35:59:730 +0000] [main] INFO com.splunk.opentelemetry.profiler.ConfigurationLogger - -----------------------
[otel.javaagent 2024-08-20 11:35:59:730 +0000] [main] INFO com.splunk.opentelemetry.profiler.ConfigurationLogger - Profiler configuration:
[otel.javaagent 2024-08-20 11:35:59:730 +0000] [main] INFO com.splunk.opentelemetry.profiler.ConfigurationLogger - splunk.profiler.enabled : true
[otel.javaagent 2024-08-20 11:35:59:731 +0000] [main] INFO com.splunk.opentelemetry.profiler.ConfigurationLogger - splunk.profiler.directory : /tmp
[otel.javaagent 2024-08-20 11:35:59:731 +0000] [main] INFO com.splunk.opentelemetry.profiler.ConfigurationLogger - splunk.profiler.recording.duration : 20s
[otel.javaagent 2024-08-20 11:35:59:731 +0000] [main] INFO com.splunk.opentelemetry.profiler.ConfigurationLogger - splunk.profiler.keep-files : false
[otel.javaagent 2024-08-20 11:35:59:732 +0000] [main] INFO com.splunk.opentelemetry.profiler.ConfigurationLogger - splunk.profiler.logs-endpoint : null
[otel.javaagent 2024-08-20 11:35:59:732 +0000] [main] INFO com.splunk.opentelemetry.profiler.ConfigurationLogger - otel.exporter.otlp.endpoint : null
[otel.javaagent 2024-08-20 11:35:59:732 +0000] [main] INFO com.splunk.opentelemetry.profiler.ConfigurationLogger - splunk.profiler.memory.enabled : true
[otel.javaagent 2024-08-20 11:35:59:732 +0000] [main] INFO com.splunk.opentelemetry.profiler.ConfigurationLogger - splunk.profiler.memory.event.rate : 150/s
[otel.javaagent 2024-08-20 11:35:59:732 +0000] [main] INFO com.splunk.opentelemetry.profiler.ConfigurationLogger - splunk.profiler.call.stack.interval : PT10S
[otel.javaagent 2024-08-20 11:35:59:733 +0000] [main] INFO com.splunk.opentelemetry.profiler.ConfigurationLogger - splunk.profiler.include.internal.stacks : false
[otel.javaagent 2024-08-20 11:35:59:733 +0000] [main] INFO com.splunk.opentelemetry.profiler.ConfigurationLogger - splunk.profiler.tracing.stacks.only : false
[otel.javaagent 2024-08-20 11:35:59:733 +0000] [main] INFO com.splunk.opentelemetry.profiler.ConfigurationLogger - -----------------------
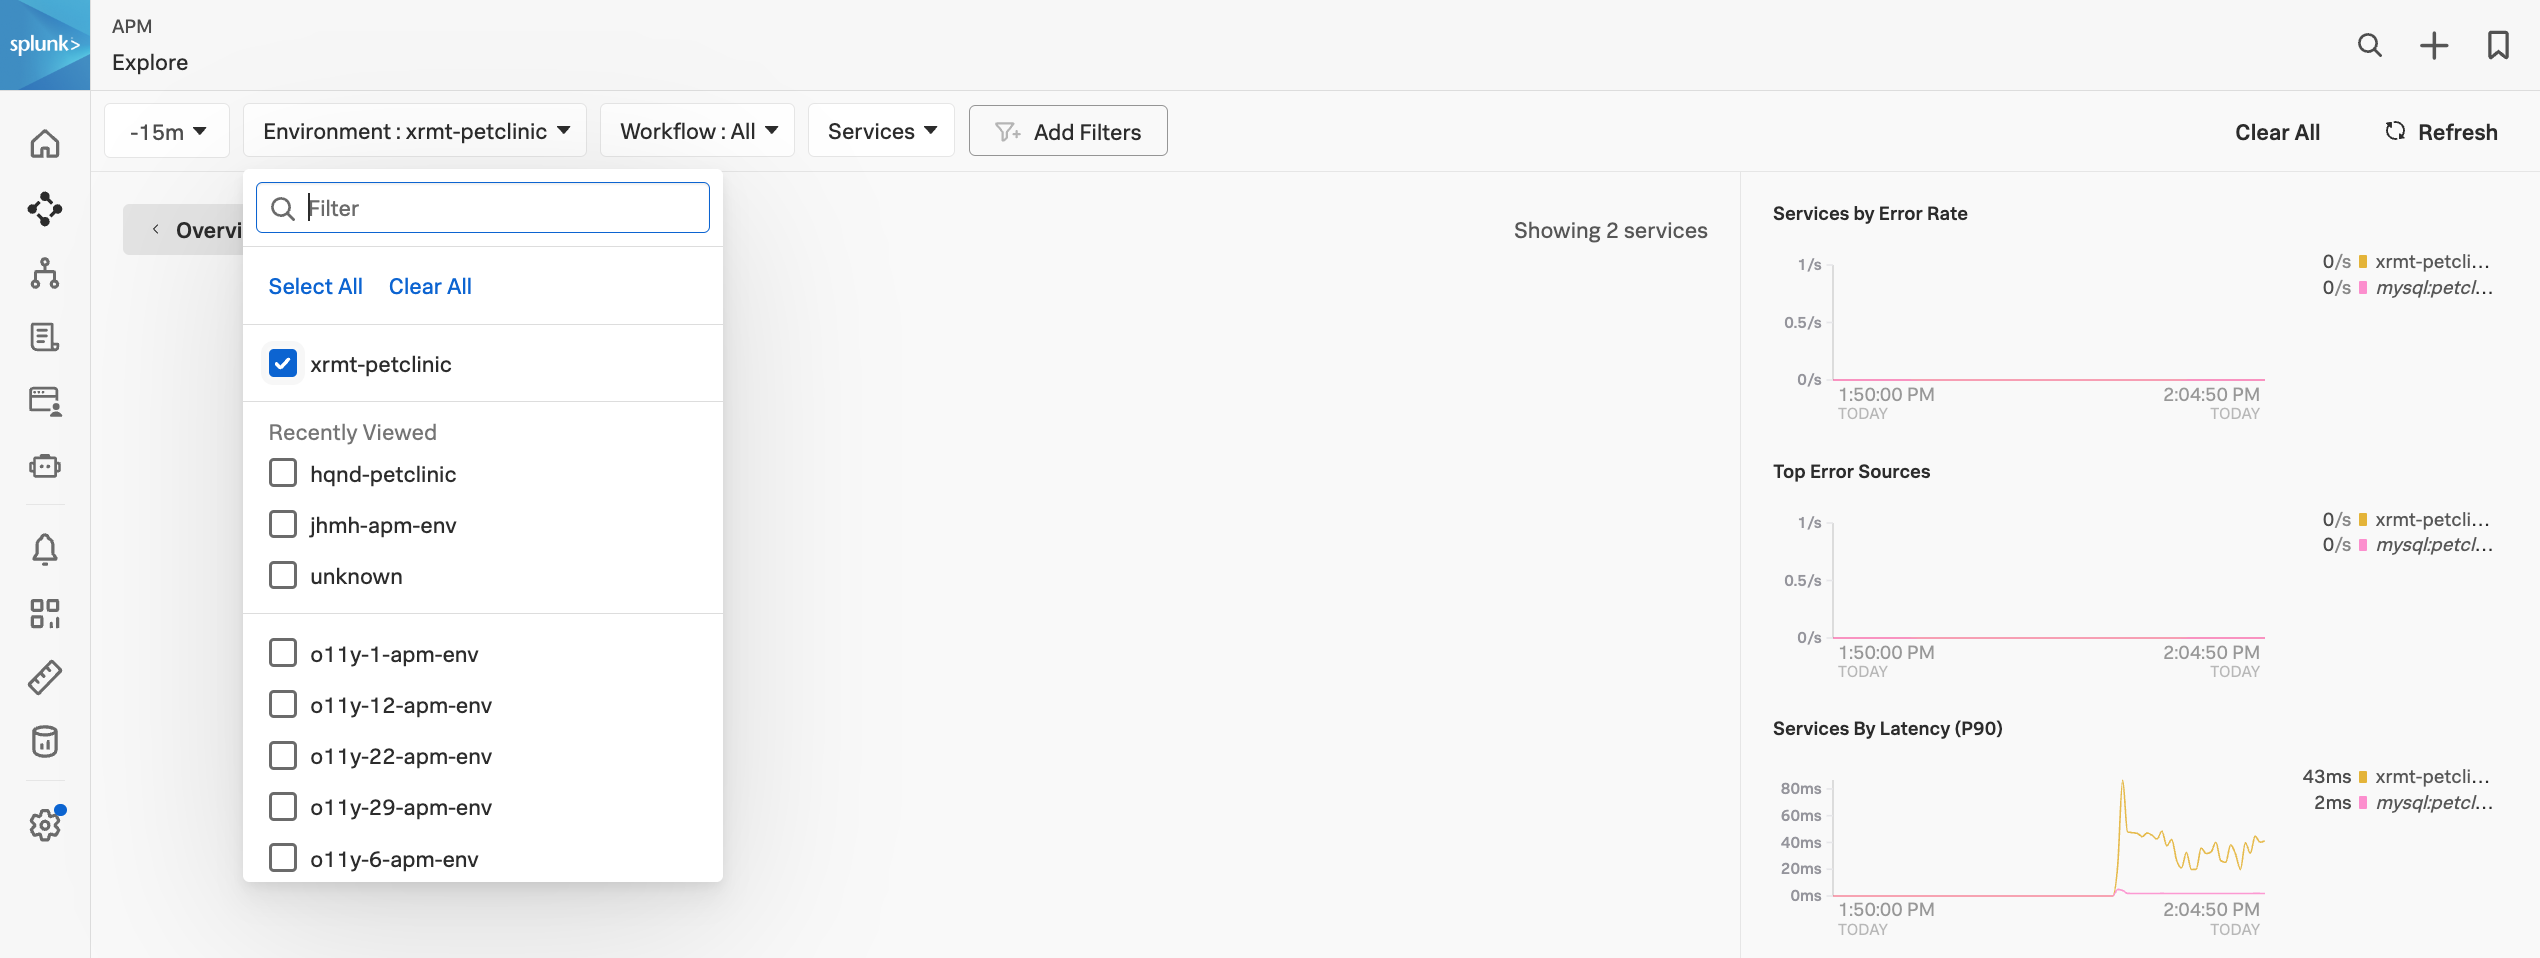
[otel.javaagent 2024-08-20 11:35:59:733 +0000] [main] INFO com.splunk.opentelemetry.profiler.JfrActivator - Profiler is active.You can now visit the Splunk APM UI and examine the application components, traces, profiling, DB Query performance and metrics. From the left-hand menu APM → Explore, click the environment dropdown and select your environment e.g. <INSTANCE>-petclinic (where<INSTANCE> is replaced with the value you noted down earlier).
Once your validation is complete you can stop the application by pressing Ctrl-c.
Resource attributes can be added to every reported span. For example version=0.314. A comma-separated list of resource attributes can also be defined e.g. key1=val1,key2=val2.
Let’s launch the PetClinic again using new resource attributes. Note, that adding resource attributes to the run command will override what was defined when we installed the collector. Let’s add a new resource attribute version=0.314:
java \
-Dserver.port=8083 \
-Dotel.service.name=$INSTANCE-petclinic-service \
-Dotel.resource.attributes=deployment.environment=$INSTANCE-petclinic-env,version=0.314 \
-jar target/spring-petclinic-*.jar --spring.profiles.active=mysql
Back in the Splunk APM UI we can drill down on a recent trace and see the new version attribute in a span.