4. Log Observer
For the Splunk Log Observer component, the Splunk OpenTelemetry Collector automatically collects logs from the Spring PetClinic application and sends them to Splunk Observability Cloud using the OTLP exporter, anotating the log events with trace_id, span_id and trace flags.
Log Observer provides a real-time view of logs from your applications and infrastructure. It allows you to search, filter, and analyze logs to troubleshoot issues and monitor your environment.
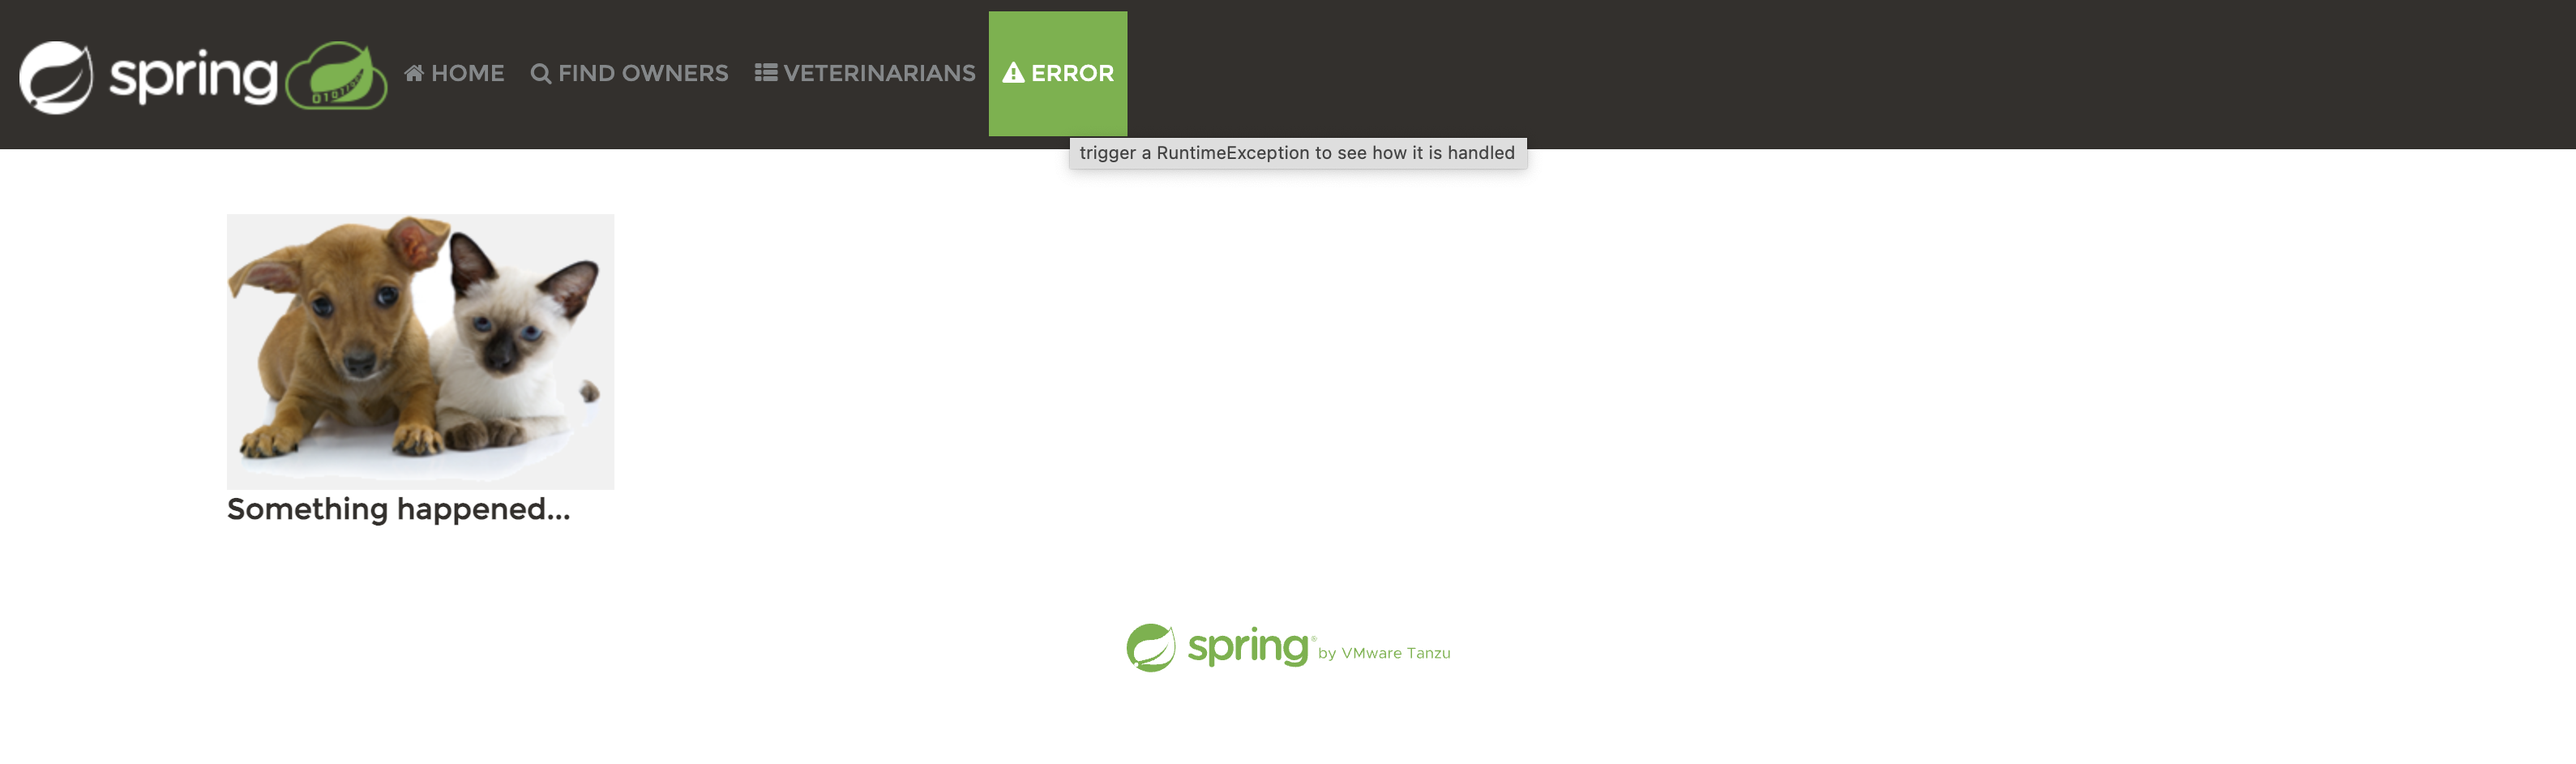
Go back to the PetClinic web application and click on the Error link several times. This will generate some log messages in the PetClinic application logs.
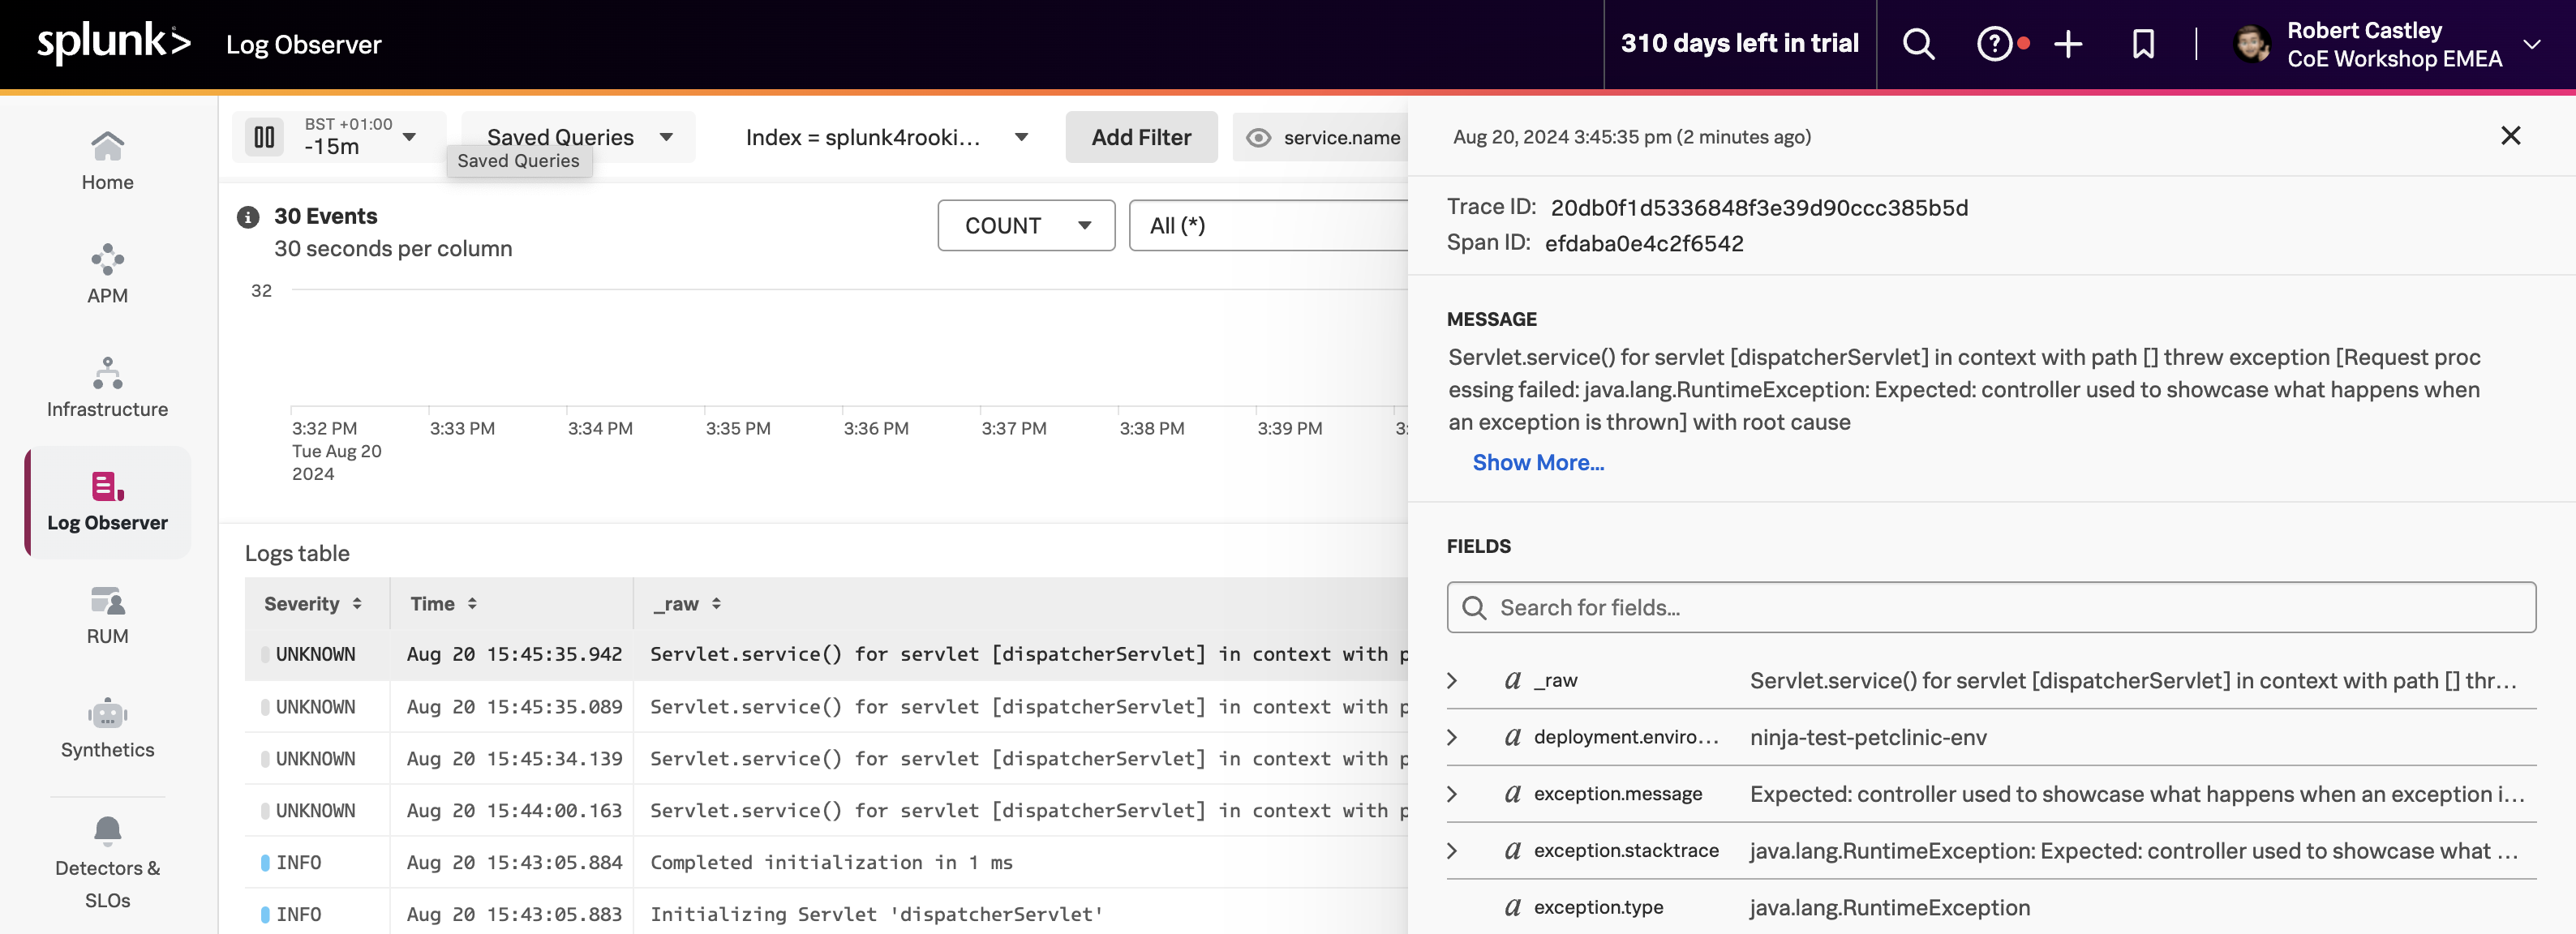
From the left-hand menu click on Log Observer and ensure Index is set to splunk4rookies-workshop.
Next, click Add Filter search for the field service.name select the value <INSTANCE>-petclinic-service and click = (include). You should now see only the log messages from your PetClinic application.
Select one of the log entries that were generated by clicking on the Error link in the PetClinic application. You will see the log message and the trace metadata that was automatically injected into the log message. Also, you will notice that Related Content is available for APM and Infrastructure.
This is the end of the workshop and we have certainly covered a lot of ground. At this point, you should have metrics, traces (APM & RUM), logs, database query performance and code profiling being reported into Splunk Observability Cloud and all without having to modify the PetClinic application code (well except for RUM).
Congratulations!