PetClinic Monolith Workshop
30 minutes Author Robert CastleyThe goal is to walk through the basic steps to configure the following components of the Splunk Observability Cloud platform:
- Splunk Infrastructure Monitoring (IM)
- Splunk Automatic Discovery for Java (APM)
- Database Query Performance
- AlwaysOn Profiling
- Splunk Real User Monitoring (RUM)
- RUM to APM Correlation
- Splunk Log Observer (LO)
We will also show the steps about how to clone (download) a sample Java application (Spring PetClinic), as well as how to compile, package and run the application.
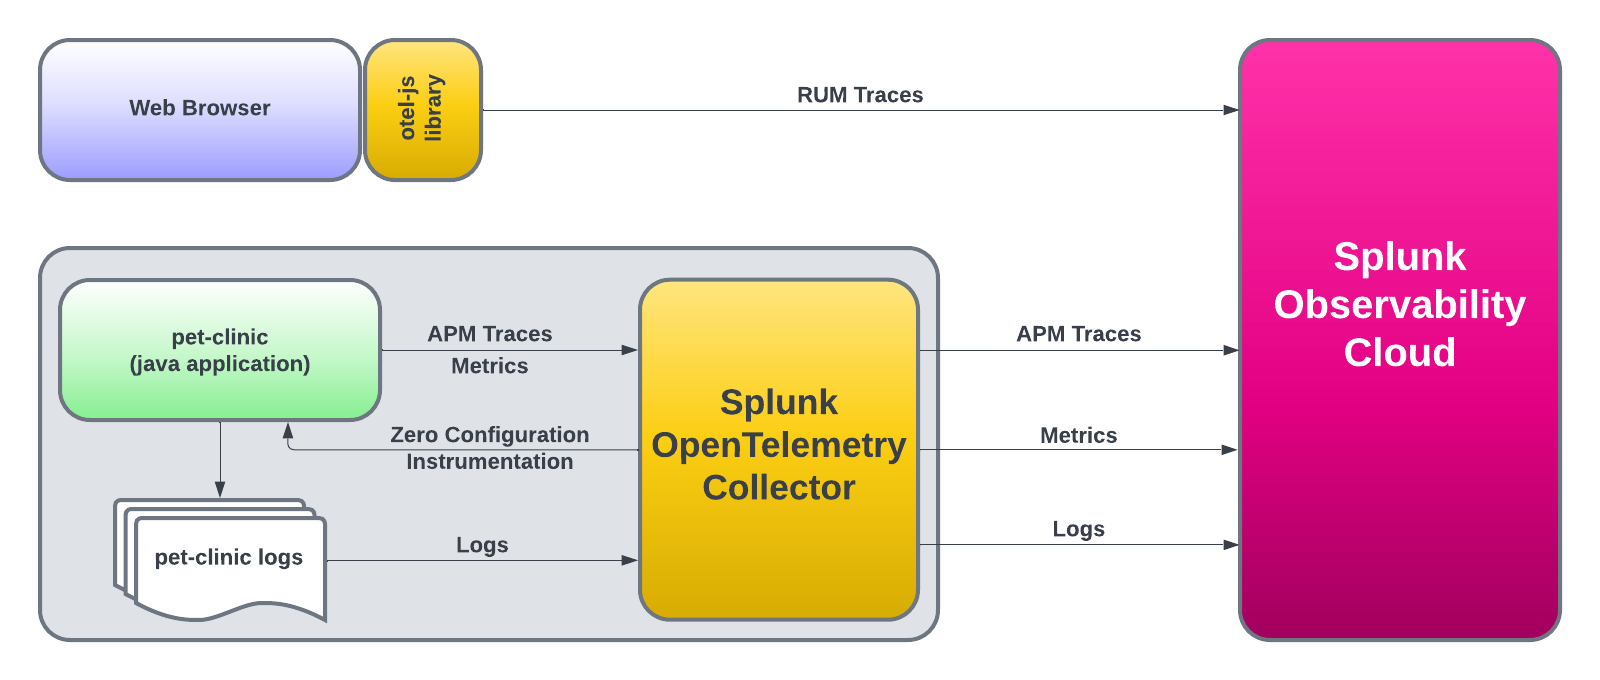
Once the application is up and running, we will instantly start seeing metrics, traces and logs via the automatic discovery and configuration for Java 2.x that will be used by the Splunk APM product.
After that, we will instrument PetClinic’s end user interface (HTML pages rendered by the application) with the Splunk OpenTelemetry Javascript Libraries (RUM) that will generate RUM traces around all the individual clicks and page loads executed by an end user.
Lastly, we will view the logs generated by the automatic injection of trace metadata into the PetClinic application logs.
- Outbound SSH access to port
2222. - Outbound HTTP access to port
8083. - Familiarity with the
bashshell andvi/vimeditor.