PetClinic Monolith Workshop
30 minutes
Author
Robert CastleyThe goal is to walk through the basic steps to configure the following components of the Splunk Observability Cloud platform:
- Splunk Infrastructure Monitoring (IM)
- Splunk Automatic Discovery for Java (APM)
- Database Query Performance
- AlwaysOn Profiling
- Splunk Real User Monitoring (RUM)
- RUM to APM Correlation
- Splunk Log Observer (LO)
We will also show the steps about how to clone (download) a sample Java application (Spring PetClinic), as well as how to compile, package and run the application.
Once the application is up and running, we will instantly start seeing metrics, traces and logs via the automatic discovery and configuration for Java 2.x that will be used by the Splunk APM product.
After that, we will instrument PetClinic’s end user interface (HTML pages rendered by the application) with the Splunk OpenTelemetry Javascript Libraries (RUM) that will generate RUM traces around all the individual clicks and page loads executed by an end user.
Lastly, we will view the logs generated by the automatic injection of trace metadata into the PetClinic application logs.
Prerequisites
- Outbound SSH access to port
2222. - Outbound HTTP access to port
8083. - Familiarity with the
bash shell and vi/vim editor.
Subsections of PetClinic Monolith Workshop
Installing the OpenTelemetry Collector
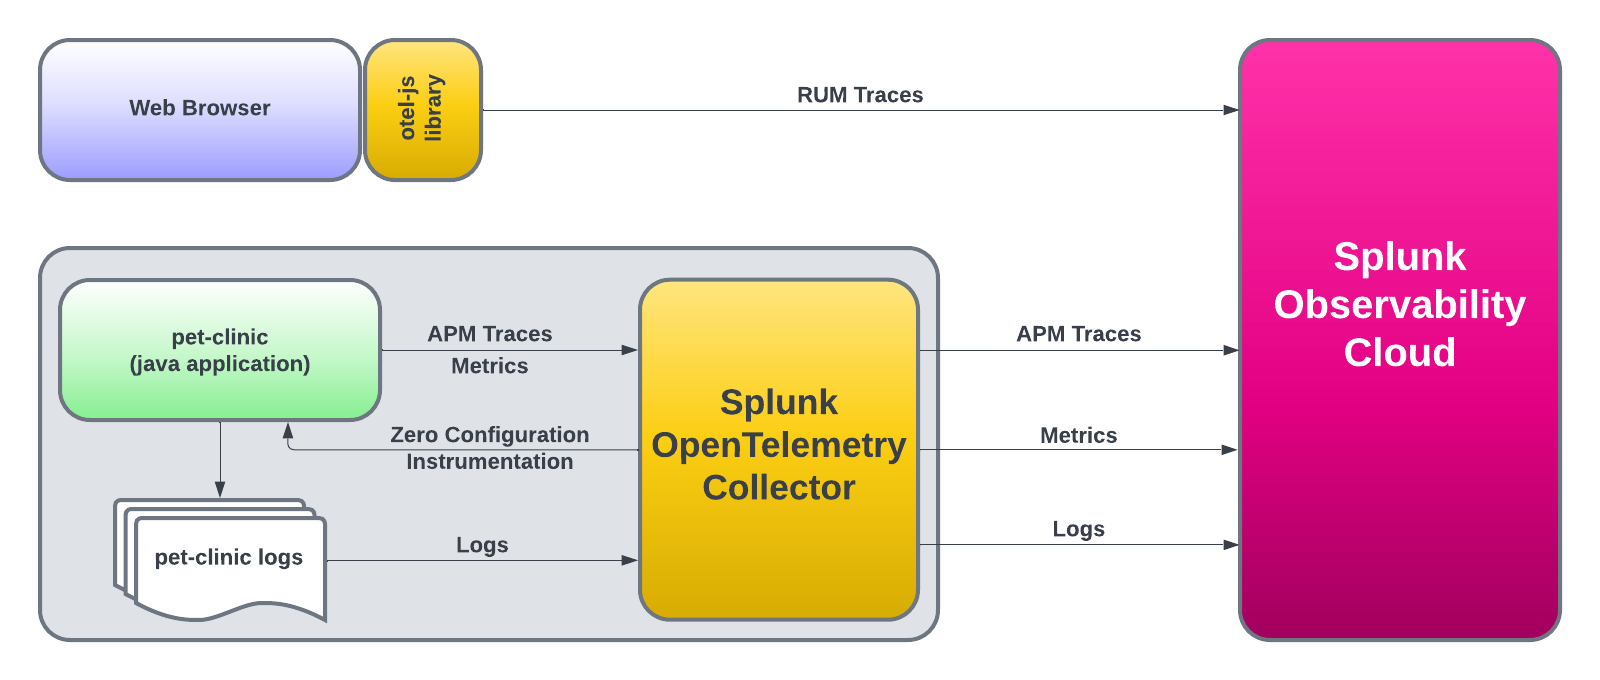
The Splunk OpenTelemetry Collector is the core component of instrumenting infrastructure and applications. Its role is to collect and send:
- Infrastructure metrics (disk, CPU, memory, etc)
- Application Performance Monitoring (APM) traces
- Profiling data
- Host and application logs
Remove any existing OpenTelemetry Collectors
If you have completed the Splunk IM workshop, please ensure you have deleted the collector running in Kubernetes before continuing. This can be done by running the following command:
helm delete splunk-otel-collector
To ensure your instance is configured correctly, we need to confirm that the required environment variables for this workshop are set correctly. In your terminal run the following command:
. ~/workshop/scripts/check_env.sh
In the output check that all of the following environment variables are present and have values set. If any are missing, please contact your instructor:
ACCESS_TOKEN
REALM
RUM_TOKEN
HEC_TOKEN
HEC_URL
INSTANCE
We can then go ahead and install the Collector. Some additional parameters are passed to the install script, they are:
--with-instrumentation - This will install the agent from the Splunk distribution of OpenTelemetry Java, which is then loaded automatically when the PetClinic Java application starts up. No configuration is required!--deployment-environment - Sets the resource attribute deployment.environment to the value passed. This is used to filter views in the UI.--enable-profiler - Enables the profiler for the Java application. This will generate CPU profiles for the application.--enable-profiler-memory - Enables the profiler for the Java application. This will generate memory profiles for the application.--enable-metrics - Enables the exporting of Micrometer metrics--hec-token - Sets the HEC token for the collector to use--hec-url - Sets the HEC URL for the collector to use
curl -sSL https://dl.signalfx.com/splunk-otel-collector.sh > /tmp/splunk-otel-collector.sh && \
sudo sh /tmp/splunk-otel-collector.sh --realm $REALM -- $ACCESS_TOKEN --mode agent --without-fluentd --with-instrumentation --deployment-environment $INSTANCE-petclinic --enable-profiler --enable-profiler-memory --enable-metrics --hec-token $HEC_TOKEN --hec-url $HEC_URL
Next, we will patch the collector to expose the hostname of the instance and not the AWS instance ID. This will make it easier to filter data in the UI:
sudo sed -i 's/gcp, ecs, ec2, azure, system/system, gcp, ecs, ec2, azure/g' /etc/otel/collector/agent_config.yaml
Once the agent_config.yaml has been patched, you will need to restart the collector:
sudo systemctl restart splunk-otel-collector
Once the installation is completed, you can navigate to the Hosts with agent installed dashboard to see the data from your host, Dashboards → Hosts with agent installed.
Use the dashboard filter and select host.name and type or select the hostname of your workshop instance (you can get this from the command prompt in your terminal session). Once you see data flowing for your host, we are then ready to get started with the APM component.
Building the Spring PetClinic Application
The first thing we need to set up APM is… well, an application. For this exercise, we will use the Spring PetClinic application. This is a very popular sample Java application built with the Spring framework (Springboot).
First, clone the PetClinic GitHub repository, and then we will compile, build, package and test the application:
git clone https://github.com/spring-projects/spring-petclinic
Change into the spring-petclinic directory:
Using Docker, start a MySQL database for PetClinic to use:
docker run -d -e MYSQL_USER=petclinic -e MYSQL_PASSWORD=petclinic -e MYSQL_ROOT_PASSWORD=root -e MYSQL_DATABASE=petclinic -p 3306:3306 docker.io/biarms/mysql:5.7
Next, we will start another container running Locust that will generate some simple traffic to the PetClinic application. Locust is a simple load-testing tool that can be used to generate traffic to a web application.
docker run --network="host" -d -p 8090:8090 -v ~/workshop/petclinic:/mnt/locust docker.io/locustio/locust -f /mnt/locust/locustfile.py --headless -u 1 -r 1 -H http://127.0.0.1:8083
Next, compile, build and package PetClinic using maven:
./mvnw package -Dmaven.test.skip=true
[!INFO]
This will take a few minutes the first time you run and will download a lot of dependencies before it compiles the application. Future builds will be a lot quicker.
Once the build completes, you need to obtain the public IP address of the instance you are running on. You can do this by running the following command:
You will see an IP address returned, make a note of this as we will need it to validate that the application is running.
Automatic discovery and configuration for Java
You can now start the application with the following command. Notice that we are passing the mysql profile to the application, this will tell the application to use the MySQL database we started earlier. We are also setting the otel.service.name and otel.resource.attributes to a logical names using the instance name. These will also be used in the UI for filtering:
java \
-Dserver.port=8083 \
-Dotel.service.name=$INSTANCE-petclinic-service \
-Dotel.resource.attributes=deployment.environment=$INSTANCE-petclinic-env \
-jar target/spring-petclinic-*.jar --spring.profiles.active=mysql
You can validate the application is running by visiting http://<IP_ADDRESS>:8083 (replace <IP_ADDRESS> with the IP address you obtained earlier).
When we installed the collector we configured it to enable AlwaysOn Profiling and Metrics. This means that the collector will automatically generate CPU and Memory profiles for the application and send them to Splunk Observability Cloud.
When you start the PetClinic application you will see the collector automatically detect the application and instrument it for traces and profiling.
Picked up JAVA_TOOL_OPTIONS: -javaagent:/usr/lib/splunk-instrumentation/splunk-otel-javaagent.jar
OpenJDK 64-Bit Server VM warning: Sharing is only supported for boot loader classes because bootstrap classpath has been appended
[otel.javaagent 2024-08-20 11:35:58:970 +0000] [main] INFO io.opentelemetry.javaagent.tooling.VersionLogger - opentelemetry-javaagent - version: splunk-2.6.0-otel-2.6.0
[otel.javaagent 2024-08-20 11:35:59:730 +0000] [main] INFO com.splunk.opentelemetry.profiler.ConfigurationLogger - -----------------------
[otel.javaagent 2024-08-20 11:35:59:730 +0000] [main] INFO com.splunk.opentelemetry.profiler.ConfigurationLogger - Profiler configuration:
[otel.javaagent 2024-08-20 11:35:59:730 +0000] [main] INFO com.splunk.opentelemetry.profiler.ConfigurationLogger -                  splunk.profiler.enabled : true
[otel.javaagent 2024-08-20 11:35:59:731 +0000] [main] INFO com.splunk.opentelemetry.profiler.ConfigurationLogger -                splunk.profiler.directory : /tmp
[otel.javaagent 2024-08-20 11:35:59:731 +0000] [main] INFO com.splunk.opentelemetry.profiler.ConfigurationLogger -       splunk.profiler.recording.duration : 20s
[otel.javaagent 2024-08-20 11:35:59:731 +0000] [main] INFO com.splunk.opentelemetry.profiler.ConfigurationLogger -               splunk.profiler.keep-files : false
[otel.javaagent 2024-08-20 11:35:59:732 +0000] [main] INFO com.splunk.opentelemetry.profiler.ConfigurationLogger -            splunk.profiler.logs-endpoint : null
[otel.javaagent 2024-08-20 11:35:59:732 +0000] [main] INFO com.splunk.opentelemetry.profiler.ConfigurationLogger -              otel.exporter.otlp.endpoint : null
[otel.javaagent 2024-08-20 11:35:59:732 +0000] [main] INFO com.splunk.opentelemetry.profiler.ConfigurationLogger -           splunk.profiler.memory.enabled : true
[otel.javaagent 2024-08-20 11:35:59:732 +0000] [main] INFO com.splunk.opentelemetry.profiler.ConfigurationLogger -        splunk.profiler.memory.event.rate : 150/s
[otel.javaagent 2024-08-20 11:35:59:732 +0000] [main] INFO com.splunk.opentelemetry.profiler.ConfigurationLogger -      splunk.profiler.call.stack.interval : PT10S
[otel.javaagent 2024-08-20 11:35:59:733 +0000] [main] INFO com.splunk.opentelemetry.profiler.ConfigurationLogger -  splunk.profiler.include.internal.stacks : false
[otel.javaagent 2024-08-20 11:35:59:733 +0000] [main] INFO com.splunk.opentelemetry.profiler.ConfigurationLogger -      splunk.profiler.tracing.stacks.only : false
[otel.javaagent 2024-08-20 11:35:59:733 +0000] [main] INFO com.splunk.opentelemetry.profiler.ConfigurationLogger - -----------------------
[otel.javaagent 2024-08-20 11:35:59:733 +0000] [main] INFO com.splunk.opentelemetry.profiler.JfrActivator - Profiler is active.
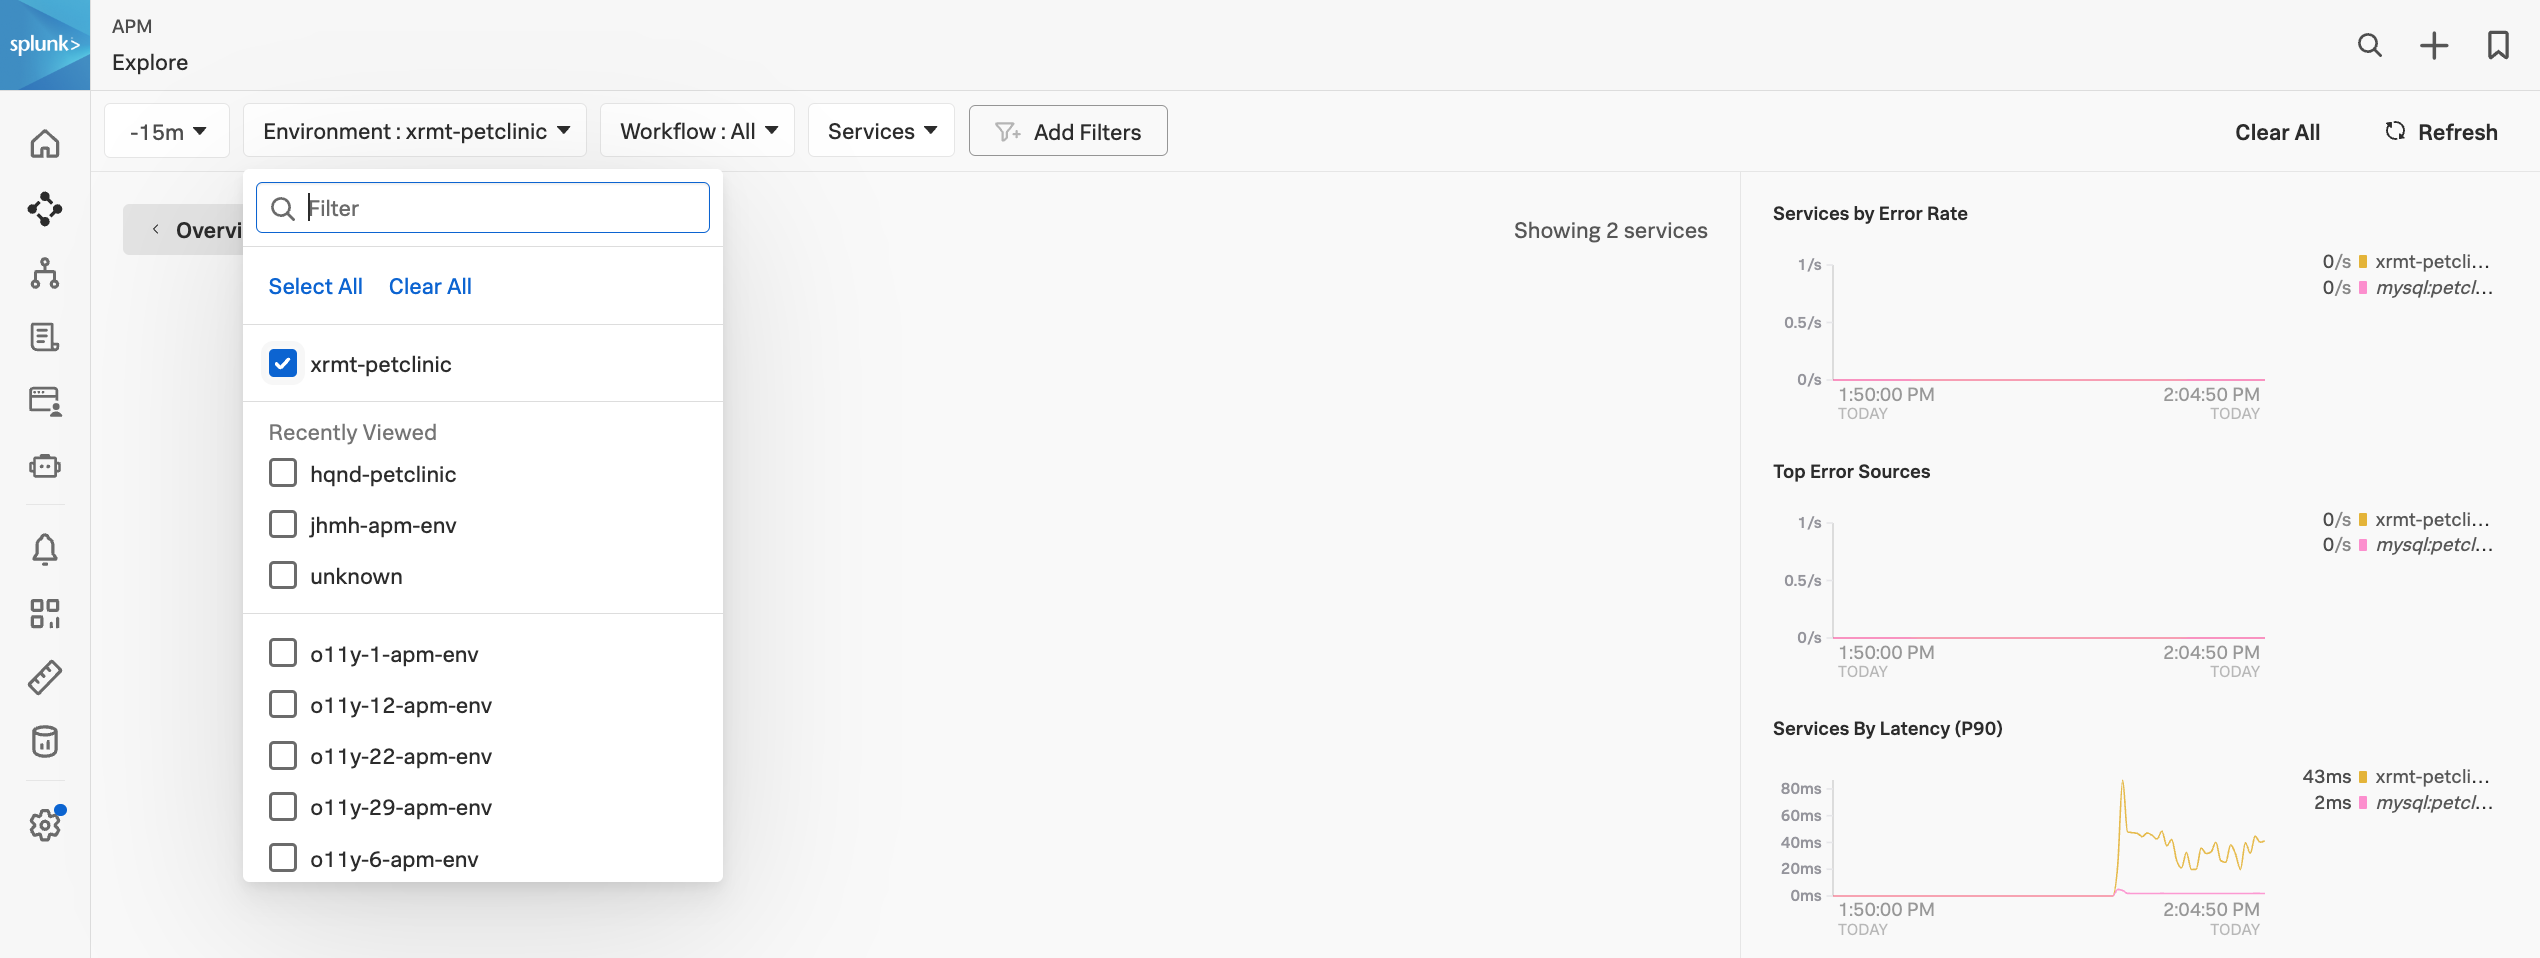
You can now visit the Splunk APM UI and examine the application components, traces, profiling, DB Query performance and metrics. From the left-hand menu APM → Explore, click the environment dropdown and select your environment e.g. <INSTANCE>-petclinic (where<INSTANCE> is replaced with the value you noted down earlier).
Once your validation is complete you can stop the application by pressing Ctrl-c.
Resource attributes can be added to every reported span. For example version=0.314. A comma-separated list of resource attributes can also be defined e.g. key1=val1,key2=val2.
Let’s launch the PetClinic again using new resource attributes. Note, that adding resource attributes to the run command will override what was defined when we installed the collector. Let’s add a new resource attribute version=0.314:
java \
-Dserver.port=8083 \
-Dotel.service.name=$INSTANCE-petclinic-service \
-Dotel.resource.attributes=deployment.environment=$INSTANCE-petclinic-env,version=0.314 \
-jar target/spring-petclinic-*.jar --spring.profiles.active=mysql
Back in the Splunk APM UI we can drill down on a recent trace and see the new version attribute in a span.
3. Real User Monitoring
For the Real User Monitoring (RUM) instrumentation, we will add the Open Telemetry Javascript https://github.com/signalfx/splunk-otel-js-web snippet in the pages, we will use the wizard again Data Management → Add Integration → RUM Instrumentation → Browser Instrumentation.
Your instructor will inform you which token to use from the dropdown, click Next. Enter App name and Environment using the following syntax:
<INSTANCE>-petclinic-service - replacing <INSTANCE> with the value you noted down earlier.<INSTANCE>-petclinic-env - replacing <INSTANCE> with the value you noted down earlier.
The wizard will then show a snippet of HTML code that needs to be placed at the top of the pages in the <head> section. The following is an example of the (do not use this snippet, use the one generated by the wizard):
/*

IMPORTANT: Replace the <version> placeholder in the src URL with a
version from https://github.com/signalfx/splunk-otel-js-web/releases

*/
<script src="https://cdn.signalfx.com/o11y-gdi-rum/latest/splunk-otel-web.js" crossorigin="anonymous"></script>
<script>
    SplunkRum.init({
        realm: "eu0",
        rumAccessToken: "<redacted>",
        applicationName: "petclinic-1be0-petclinic-service",
        deploymentEnvironment: "petclinic-1be0-petclinic-env"
    });
</script>
The Spring PetClinic application uses a single HTML page as the “layout” page, that is reused across all pages of the application. This is the perfect location to insert the Splunk RUM Instrumentation Library as it will be loaded in all pages automatically.
Let’s then edit the layout page:
vi src/main/resources/templates/fragments/layout.html
Next, insert the snippet we generated above in the <head> section of the page. Make sure you don’t include the comment and replace <version> in the source URL to latest e.g.
<!doctype html>
<html th:fragment="layout (template, menu)">

<head>
<script src="https://cdn.signalfx.com/o11y-gdi-rum/latest/splunk-otel-web.js" crossorigin="anonymous"></script>
<script>
    SplunkRum.init({
        realm: "eu0",
        rumAccessToken: "<redacted>",
        applicationName: "petclinic-1be0-petclinic-service",
        deploymentEnvironment: "petclinic-1be0-petclinic-env"
    });
</script>
...
With the code changes complete, we need to rebuild the application and run it again. Run the maven command to compile/build/package PetClinic:
./mvnw package -Dmaven.test.skip=true
java \
-Dserver.port=8083 \
-Dotel.service.name=$INSTANCE-petclinic-service \
-Dotel.resource.attributes=deployment.environment=$INSTANCE-petclinic-env,version=0.314 \
-jar target/spring-petclinic-*.jar --spring.profiles.active=mysql
Then let’s visit the application using a browser to generate real-user traffic http://<IP_ADDRESS>:8083.
In RUM, filter down into the environment as defined in the RUM snippet above and click through to the dashboard.
When you drill down into a RUM trace you will see a link to APM in the spans. Clicking on the trace ID will take you to the corresponding APM trace for the current RUM trace.
4. Log Observer
For the Splunk Log Observer component, the Splunk OpenTelemetry Collector automatically collects logs from the Spring PetClinic application and sends them to Splunk Observability Cloud using the OTLP exporter, anotating the log events with trace_id, span_id and trace flags.
Log Observer provides a real-time view of logs from your applications and infrastructure. It allows you to search, filter, and analyze logs to troubleshoot issues and monitor your environment.
Go back to the PetClinic web application and click on the Error link several times. This will generate some log messages in the PetClinic application logs.

From the left-hand menu click on Log Observer and ensure Index is set to splunk4rookies-workshop.
Next, click Add Filter search for the field service.name select the value <INSTANCE>-petclinic-service and click = (include). You should now see only the log messages from your PetClinic application.
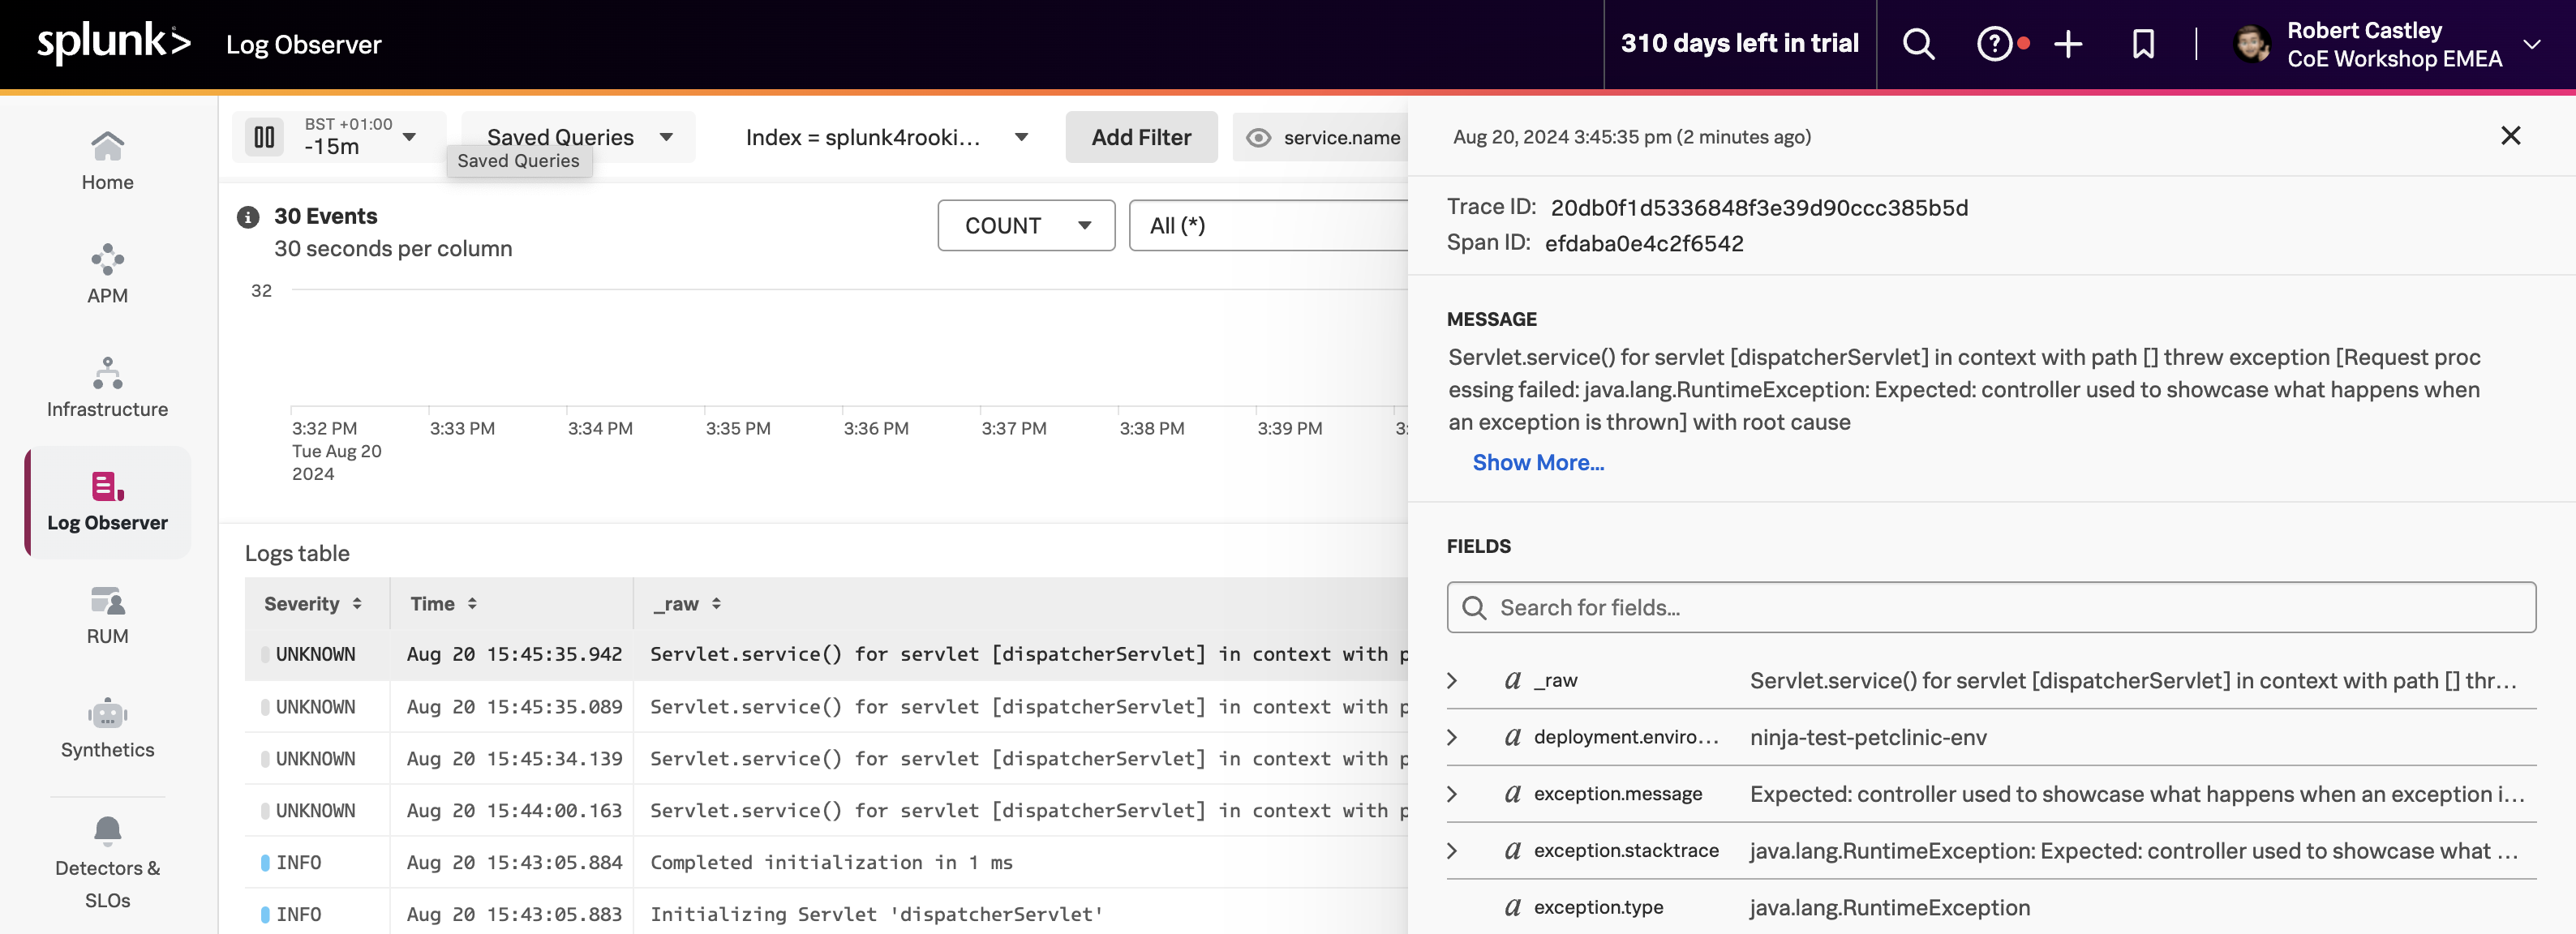
Select one of the log entries that were generated by clicking on the Error link in the PetClinic application. You will see the log message and the trace metadata that was automatically injected into the log message. Also, you will notice that Related Content is available for APM and Infrastructure.
This is the end of the workshop and we have certainly covered a lot of ground. At this point, you should have metrics, traces (APM & RUM), logs, database query performance and code profiling being reported into Splunk Observability Cloud and all without having to modify the PetClinic application code (well except for RUM).
Congratulations!