Viewing the data in Splunk APM
Log in to Splunk Observability Cloud, from the left-hand menu click on APM ![]()
![]() to see the data generated by the traces from the newly instrumented services. Change the Environment filter (1) to the name of your workshop instance in the dropdown box (this will be
to see the data generated by the traces from the newly instrumented services. Change the Environment filter (1) to the name of your workshop instance in the dropdown box (this will be <INSTANCE>-workshop where INSTANCE is the value from the shell script you ran earlier) and make sure it is the only one selected.
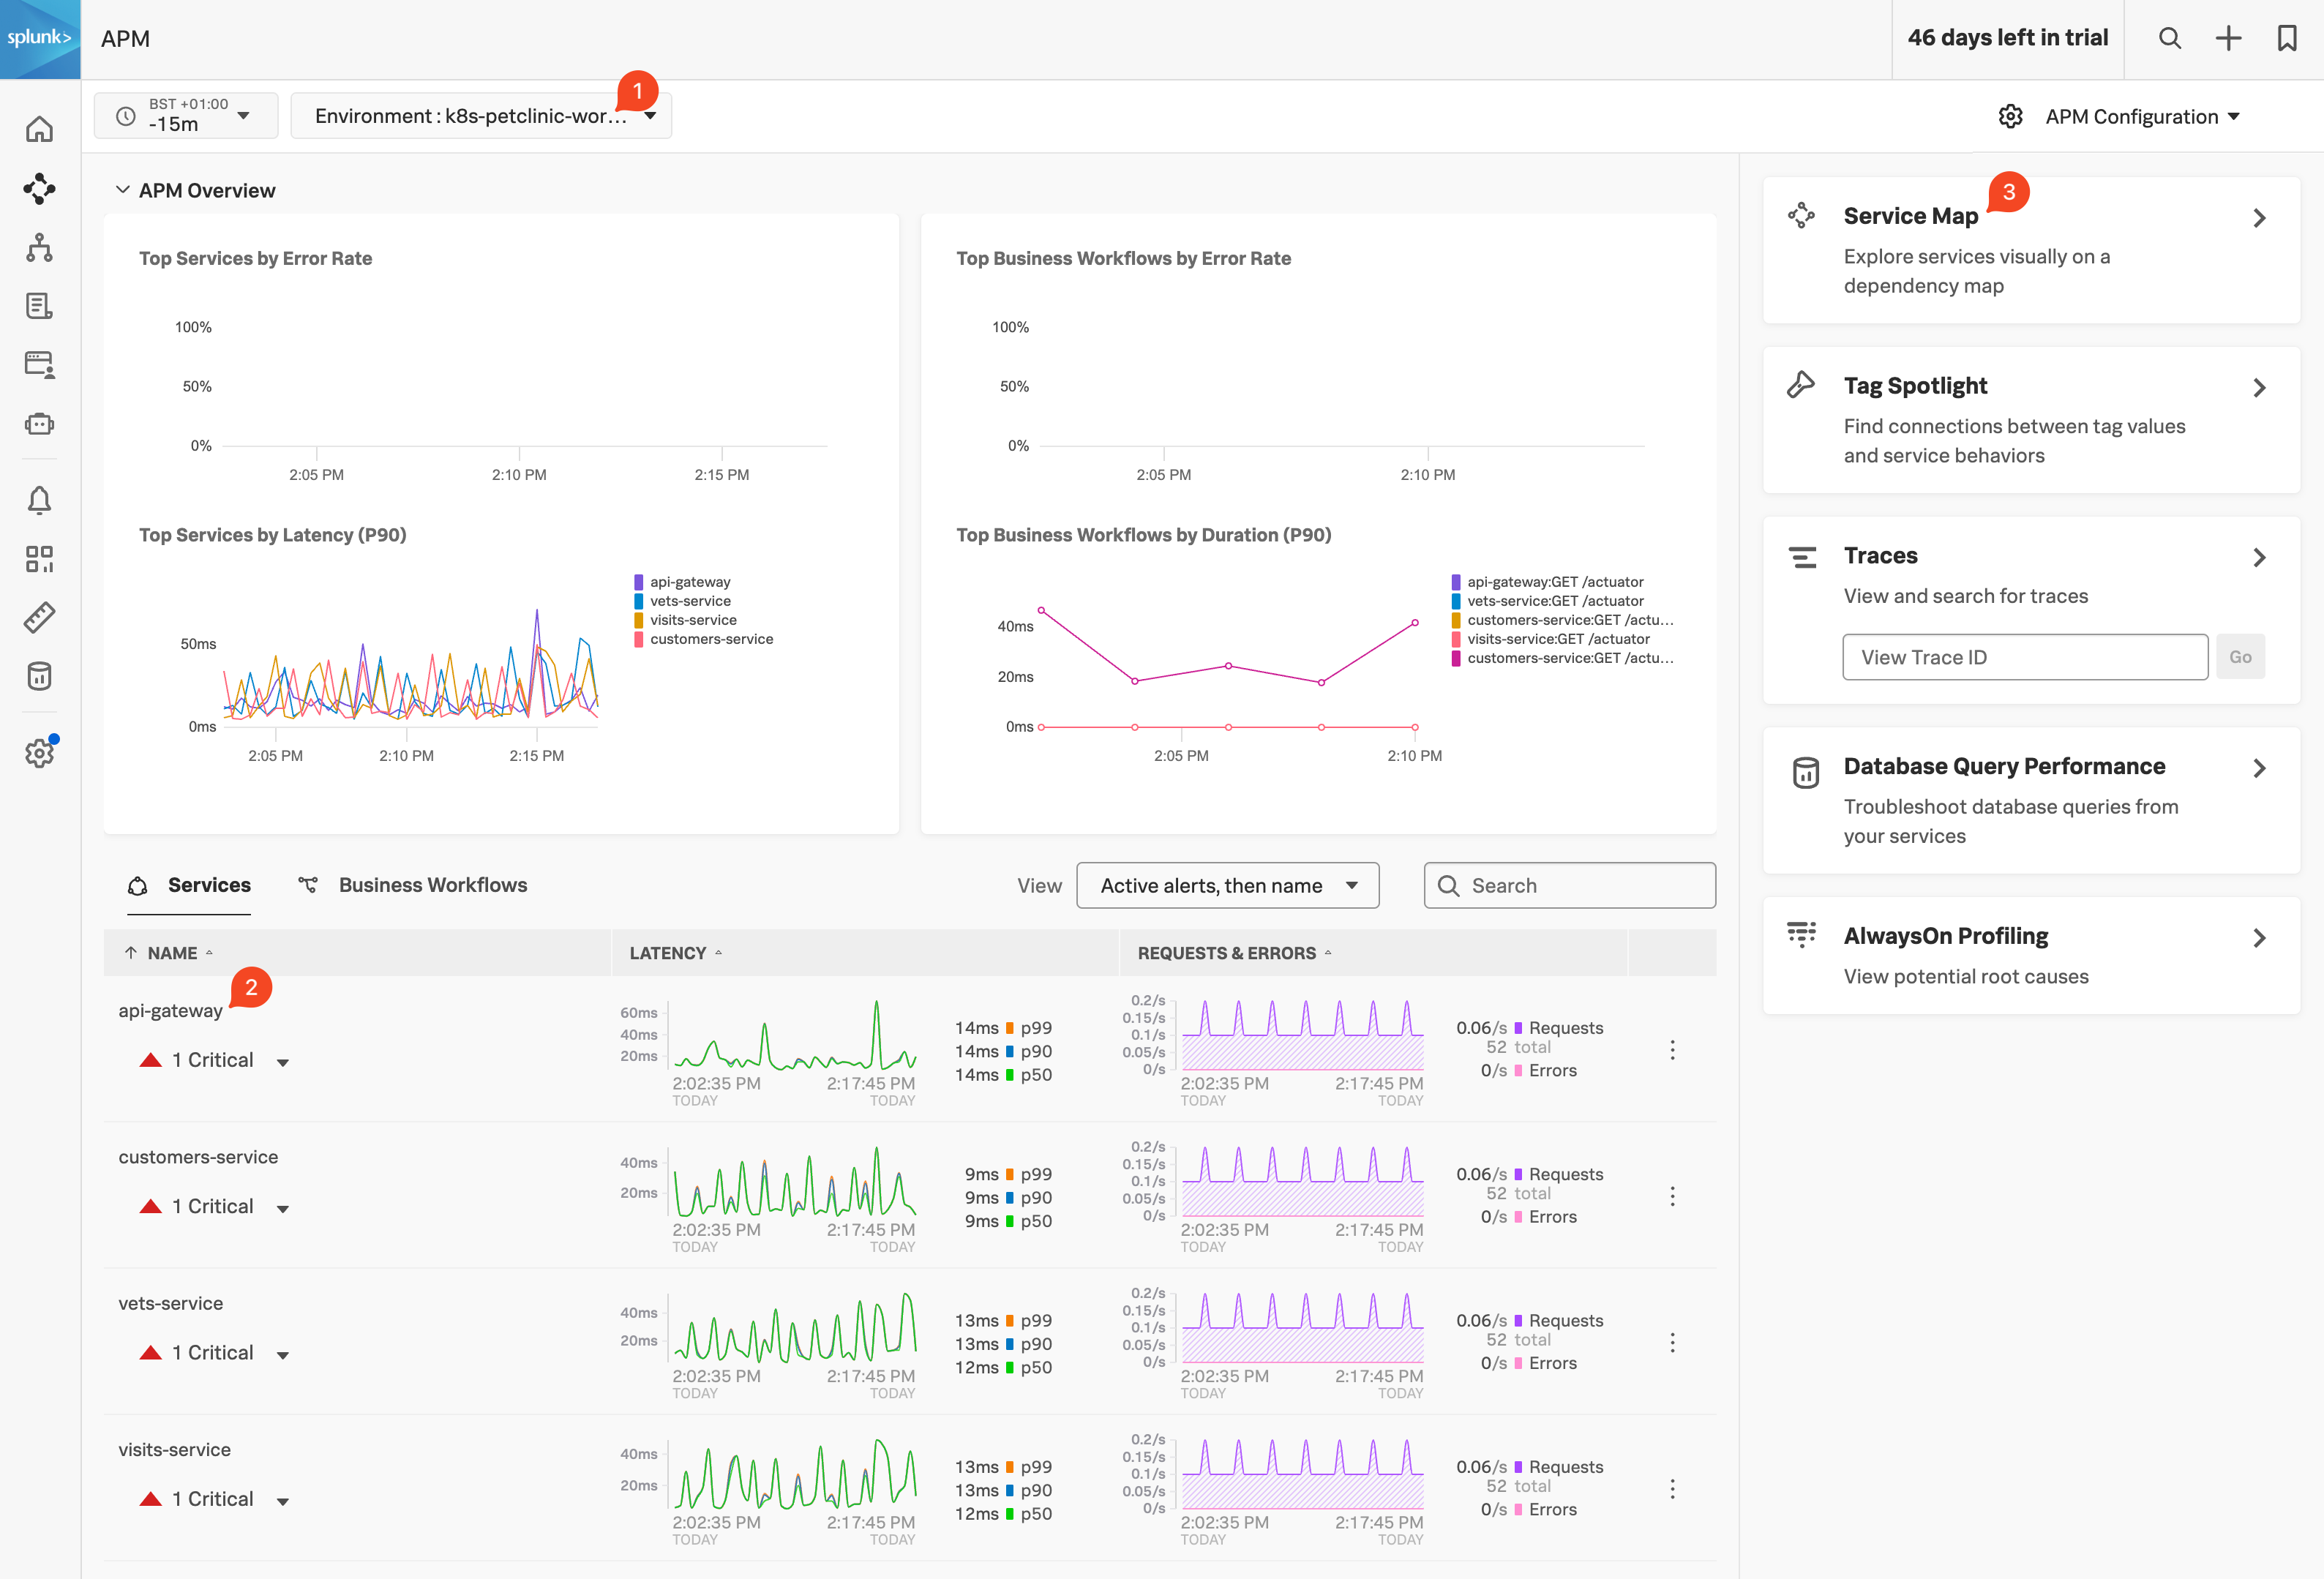
You will see the name (2) of the api-gateway service and metrics in the Latency and Request & Errors charts (you can ignore the Critical Alert, as it is caused by the sudden request increase generated by the load generator). You will also see the rest of the services appear.
Once you see the Customer service, Vets service and Visits services like show in the screenshot above, let’s click on the Service Map (3) pane to get ready for the next section.