Setting up automatic discovery and configuration for APM

10 minutes  

In this section we will enable automatic discovery and configuration for the Java services running in Kubernetes. This means that the OpenTelemetry Collector will look for Pod annotations that indicate that the Java application should be instrumented with the Splunk OpenTelemetry Java agent. This will allow us to get traces, spans, and profiling data from the Java services running on the cluster.

automatic discovery and configuration

It is important to understand that automatic discovery and configuration is designed to get trace, span & profiling data out of your application, without requiring code changes or recompilation.

This is a great way to get started with APM, but it is not a replacement for manual instrumentation. Manual instrumentation allows you to add custom spans, tags, and logs to your application, which can provide more context and detail to your traces.

For Java applications the OpenTelemetry Collector will look for the annotation instrumentation.opentelemetry.io/inject-java.

The annotation can have the value set true or to the namespace/daemonset of the OpenTelemetry Collector e.g. default/splunk-otel-collector. This allows working across namespaces and what we will use in this workshop.

Using the deployment.yaml

If you want your Pods to send traces automatically, you can add the annotation to the deployment.yaml as shown below. This will add the instrumentation library during the initial deployment. To speed things up we have done that for the following Pods:

  • admin-server
  • config-server
  • discovery-server
apiVersion: apps/v1
kind: Deployment
metadata:
  name: admin-server
  labels: 
    app.kubernetes.io/part-of: spring-petclinic
spec:
  selector:
    matchLabels:
      app: admin-server
  template:
    metadata:
      labels:
        app: admin-server
      annotations:
        instrumentation.opentelemetry.io/inject-java: "default/splunk-otel-collector"
Last Modified Sep 19, 2024

Subsections of Setting up automatic discovery and configuration for APM

Patching the Deployment

To configure automatic discovery and configuration the deployments need to be patched to add the instrumentation annotation. Once patched, the OpenTelemetry Collector will inject the automatic discovery and configuration library and the Pods will be restarted in order to start sending traces and profiling data. First, confirm that the api-gateway does not have the splunk-otel-java image.

kubectl describe pods api-gateway | grep Image:
Image:         quay.io/phagen/spring-petclinic-api-gateway:0.0.2

Next, enable the Java automatic discovery and configuration for all of the services by adding the annotation to the deployments. The following command will patch the all deployments. This will trigger the OpenTelemetry Operator to inject the splunk-otel-java image into the Pods:

kubectl get deployments -l app.kubernetes.io/part-of=spring-petclinic -o name | xargs -I % kubectl patch % -p "{\"spec\": {\"template\":{\"metadata\":{\"annotations\":{\"instrumentation.opentelemetry.io/inject-java\":\"default/splunk-otel-collector\"}}}}}"
deployment.apps/config-server patched (no change)
deployment.apps/admin-server patched (no change)
deployment.apps/customers-service patched
deployment.apps/visits-service patched
deployment.apps/discovery-server patched (no change)
deployment.apps/vets-service patched
deployment.apps/api-gateway patched

There will be no change for the config-server, discovery-server and admin-server as these have already been patched.

To check the container image(s) of the api-gateway pod again, run the following command:

kubectl describe pods api-gateway | grep Image:
Image:         ghcr.io/signalfx/splunk-otel-java/splunk-otel-java:v1.30.0
Image:         quay.io/phagen/spring-petclinic-api-gateway:0.0.2

A new image has been added to the api-gateway which will pull splunk-otel-java from ghcr.io (if you see two api-gateway containers, the original one is probably still terminating, so give it a few seconds).

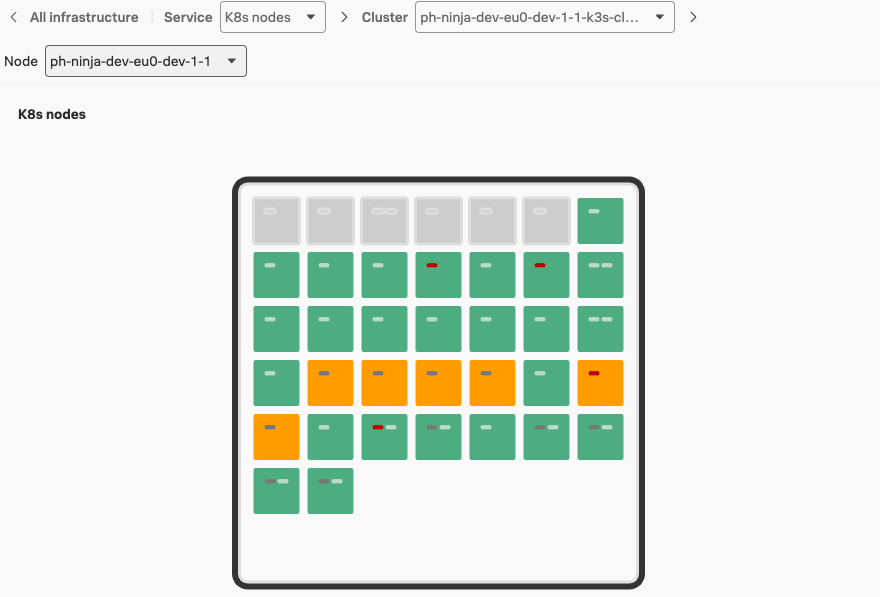
Navigate back to the Kubernetes Navigator in Splunk Observability Cloud. After a couple of minutes you will see that the Pods are being restarted by the operator and the automatic discovery and configuration container will be added. This will look similar to the screenshot below:

restart restart

Wait for the Pods to turn green in the Kubernetes Navigator, then go tho the next section.

Last Modified Sep 19, 2024

Viewing the data in Splunk APM

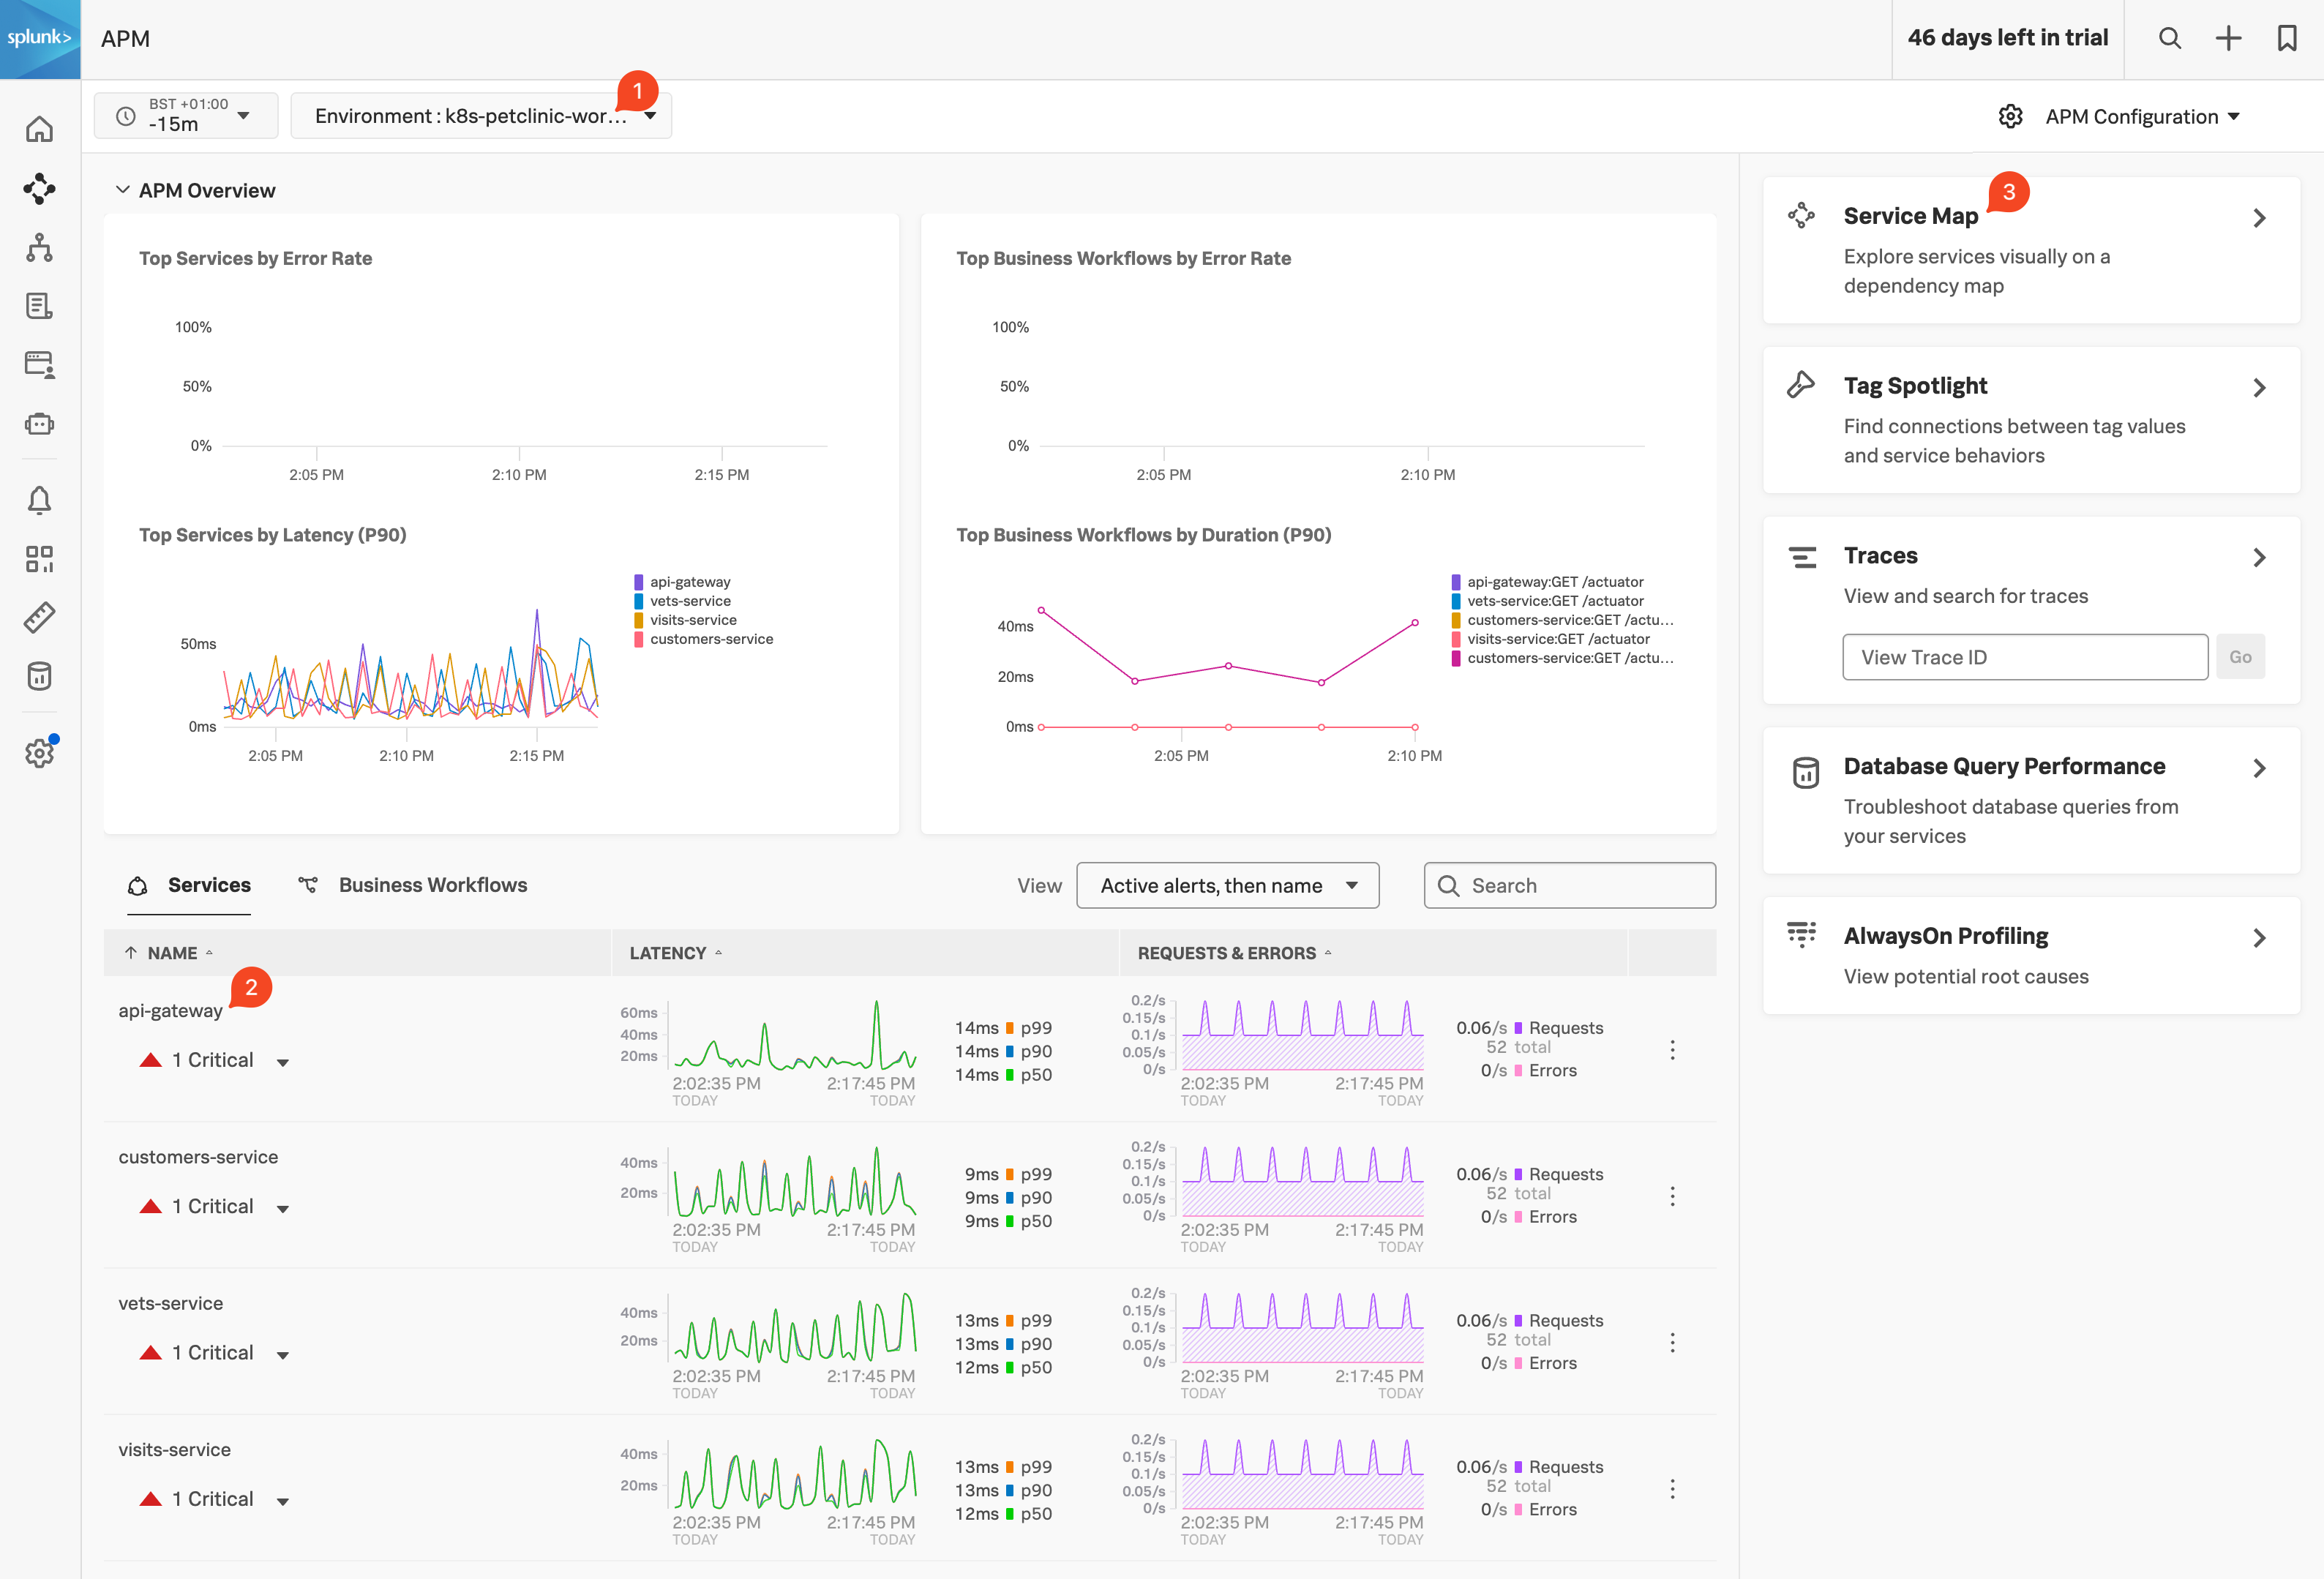
Log in to Splunk Observability Cloud, from the left-hand menu click on APM APM APM to see the data generated by the traces from the newly instrumented services. Change the Environment filter (1) to the name of your workshop instance in the dropdown box (this will be <INSTANCE>-workshop where INSTANCE is the value from the shell script you ran earlier) and make sure it is the only one selected.

apm apm

You will see the name (2) of the api-gateway service and metrics in the Latency and Request & Errors charts (you can ignore the Critical Alert, as it is caused by the sudden request increase generated by the load generator). You will also see the rest of the services appear.

Once you see the Customer service, Vets service and Visits services like show in the screenshot above, let’s click on the Service Map (3) pane to get ready for the next section.