APM Trace
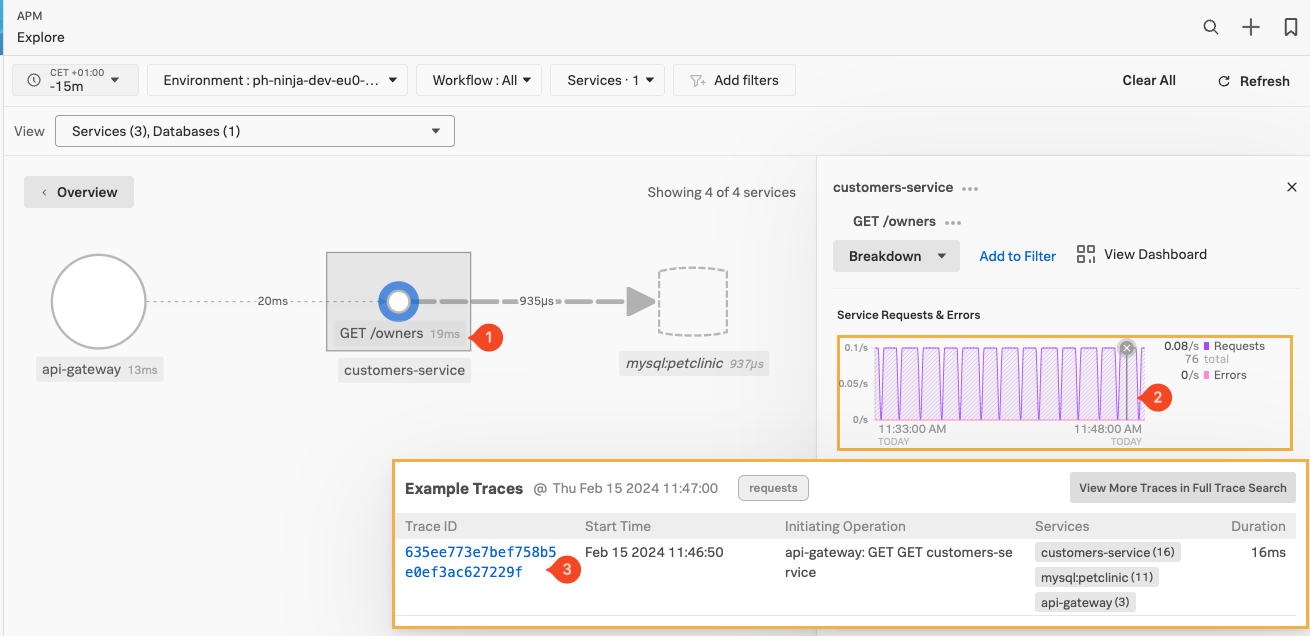
To pick a trace, select a line in the Service Requests & Errors chart (2), when the dot appears click to get a list of sample traces:
Once you have the list of sample traces, click on the blue (3) Trace ID Link (make sure it has the same three services mentioned in the Service Column.)
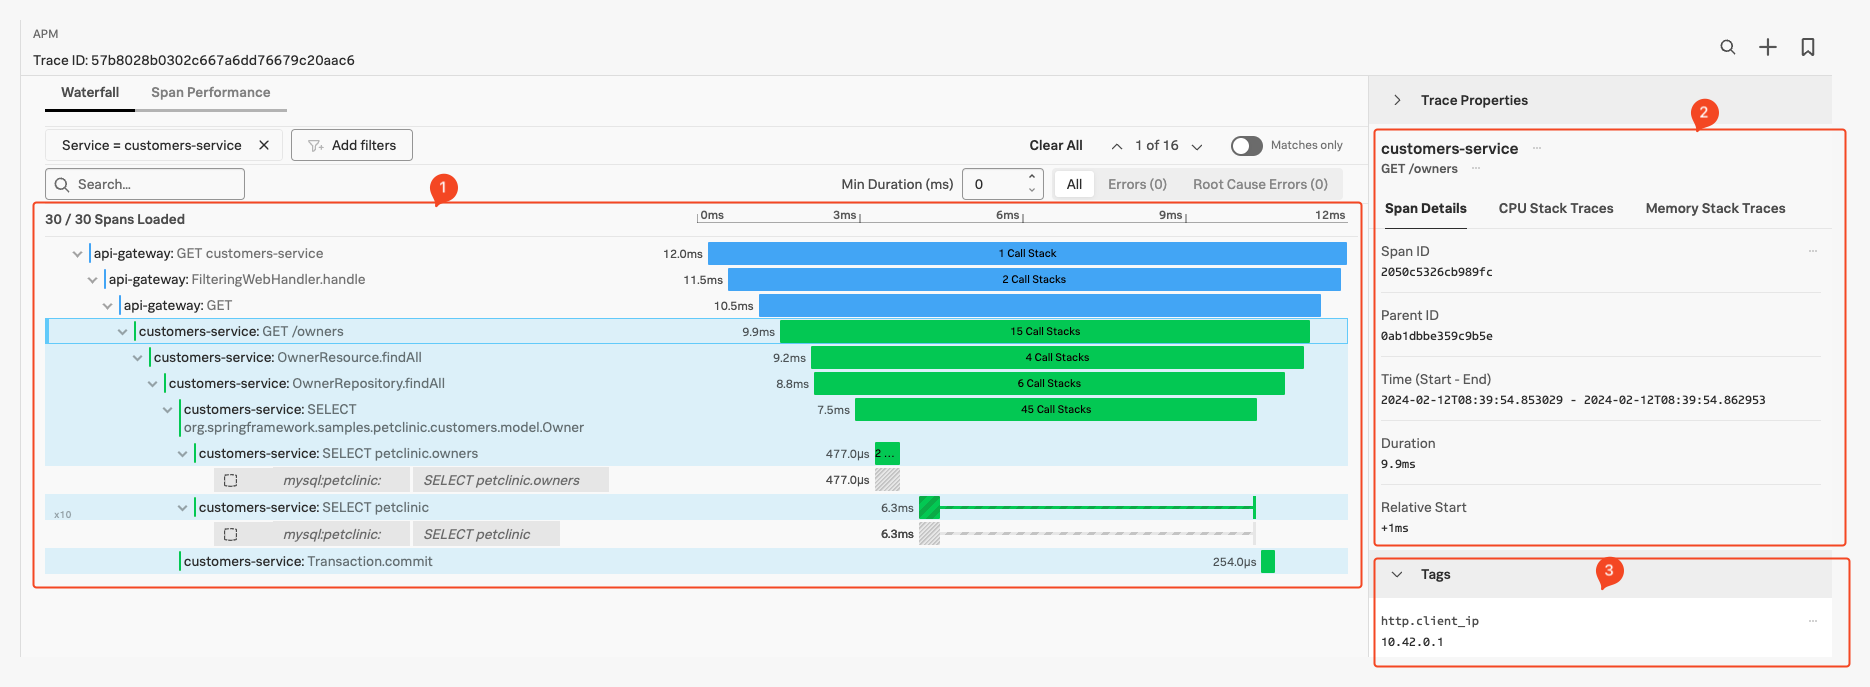
This brings us the the Trace selected in the Waterfall view:
Here we find several sections:
- The actual Waterfall Pane (1), where you see the trace and all the instrumented functions visible as spans, with their duration representation and order/relationship showing.
- The Trace Info Pane (2), by default, shows the selected Span information (highlighted with a box around the Span in the Waterfall Pane).
- The Span Pane (3), here you can find all the Tags that have been sent in the selected Span, You can scroll down to see all of them.
- The process Pane, with tags related to the process that created the Span (scroll down to see as it is not in the screenshot).
- The Trace Properties at the top of the right-hand pane by default is collapsed as shown.