APM Span
While we examine our spans, let’s look at several features that you get out of the box without code modifications when using automatic discovery and configuration on top of tracing:
Due to the fact there are several different routes
First, in the Waterfall Pane, make sure the customers-service:SELECT petclinic.owners or similar span is selected as shown in the screenshot below:
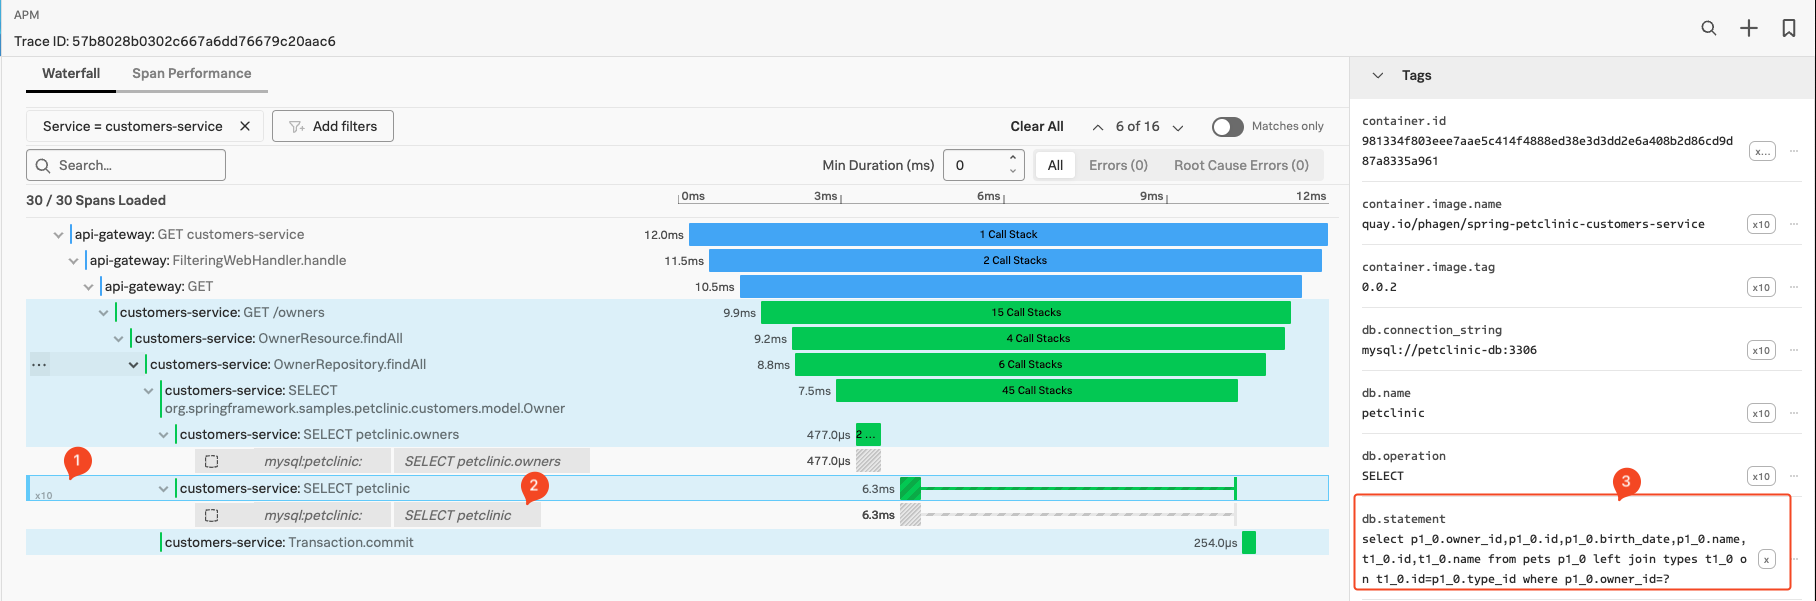
- The basic latency information is shown as a bar for the instrumented function or call, in our example, it took 6.3 Milliseconds.
- Several similar Spans (1), are only visible if the span is repeated multiple times. In this case, there are 10 repeats in our example. (You can show/hide them all by clicking on the
10xand all spans will show in order) - Inferred Services: Calls made to external systems that are not instrumented, show up as a grey ‘inferred’ span. The Inferred Service or span in our case here is a call to the Mysql Database
mysql:petclinic SELECT petclinic(2) as shown above our selected span. - Span Tags: In the Tag Pane, standard tags produced by the automatic discovery and configuration. In this case, the span is calling a Database, so it includes the
db.statementtag (3). This tag will hold the DB query statement and is used by the Database call performed during this span. This will be used by the DB-Query Performance feature. We look at DB-Query Performance in the next section. - Always-on Profiling: IF the system is configured to and has captured Profiling data during a Span life cycle, it will show the number of Call Stacks captured in the Spans timeline (15 Call Stacks for the
customers-service:SELECT petclinic.ownersSpan shown above).
We will look at Profiling in the next section.