APM Features
15 minutes
As we have seen in the previous section, once you enable automatic discovery and configuration on your services, traces are sent to Splunk Observability Cloud.
With these traces, Splunk will automatically generate Service Maps and RED Metrics. These are the first steps in understanding the behavior of your services and how they interact with each other.
In this next section, we are going to examine the traces themselves and what information they provide to help you understand the behavior of your services all without touching your code.
Subsections of APM Features
APM Service Map
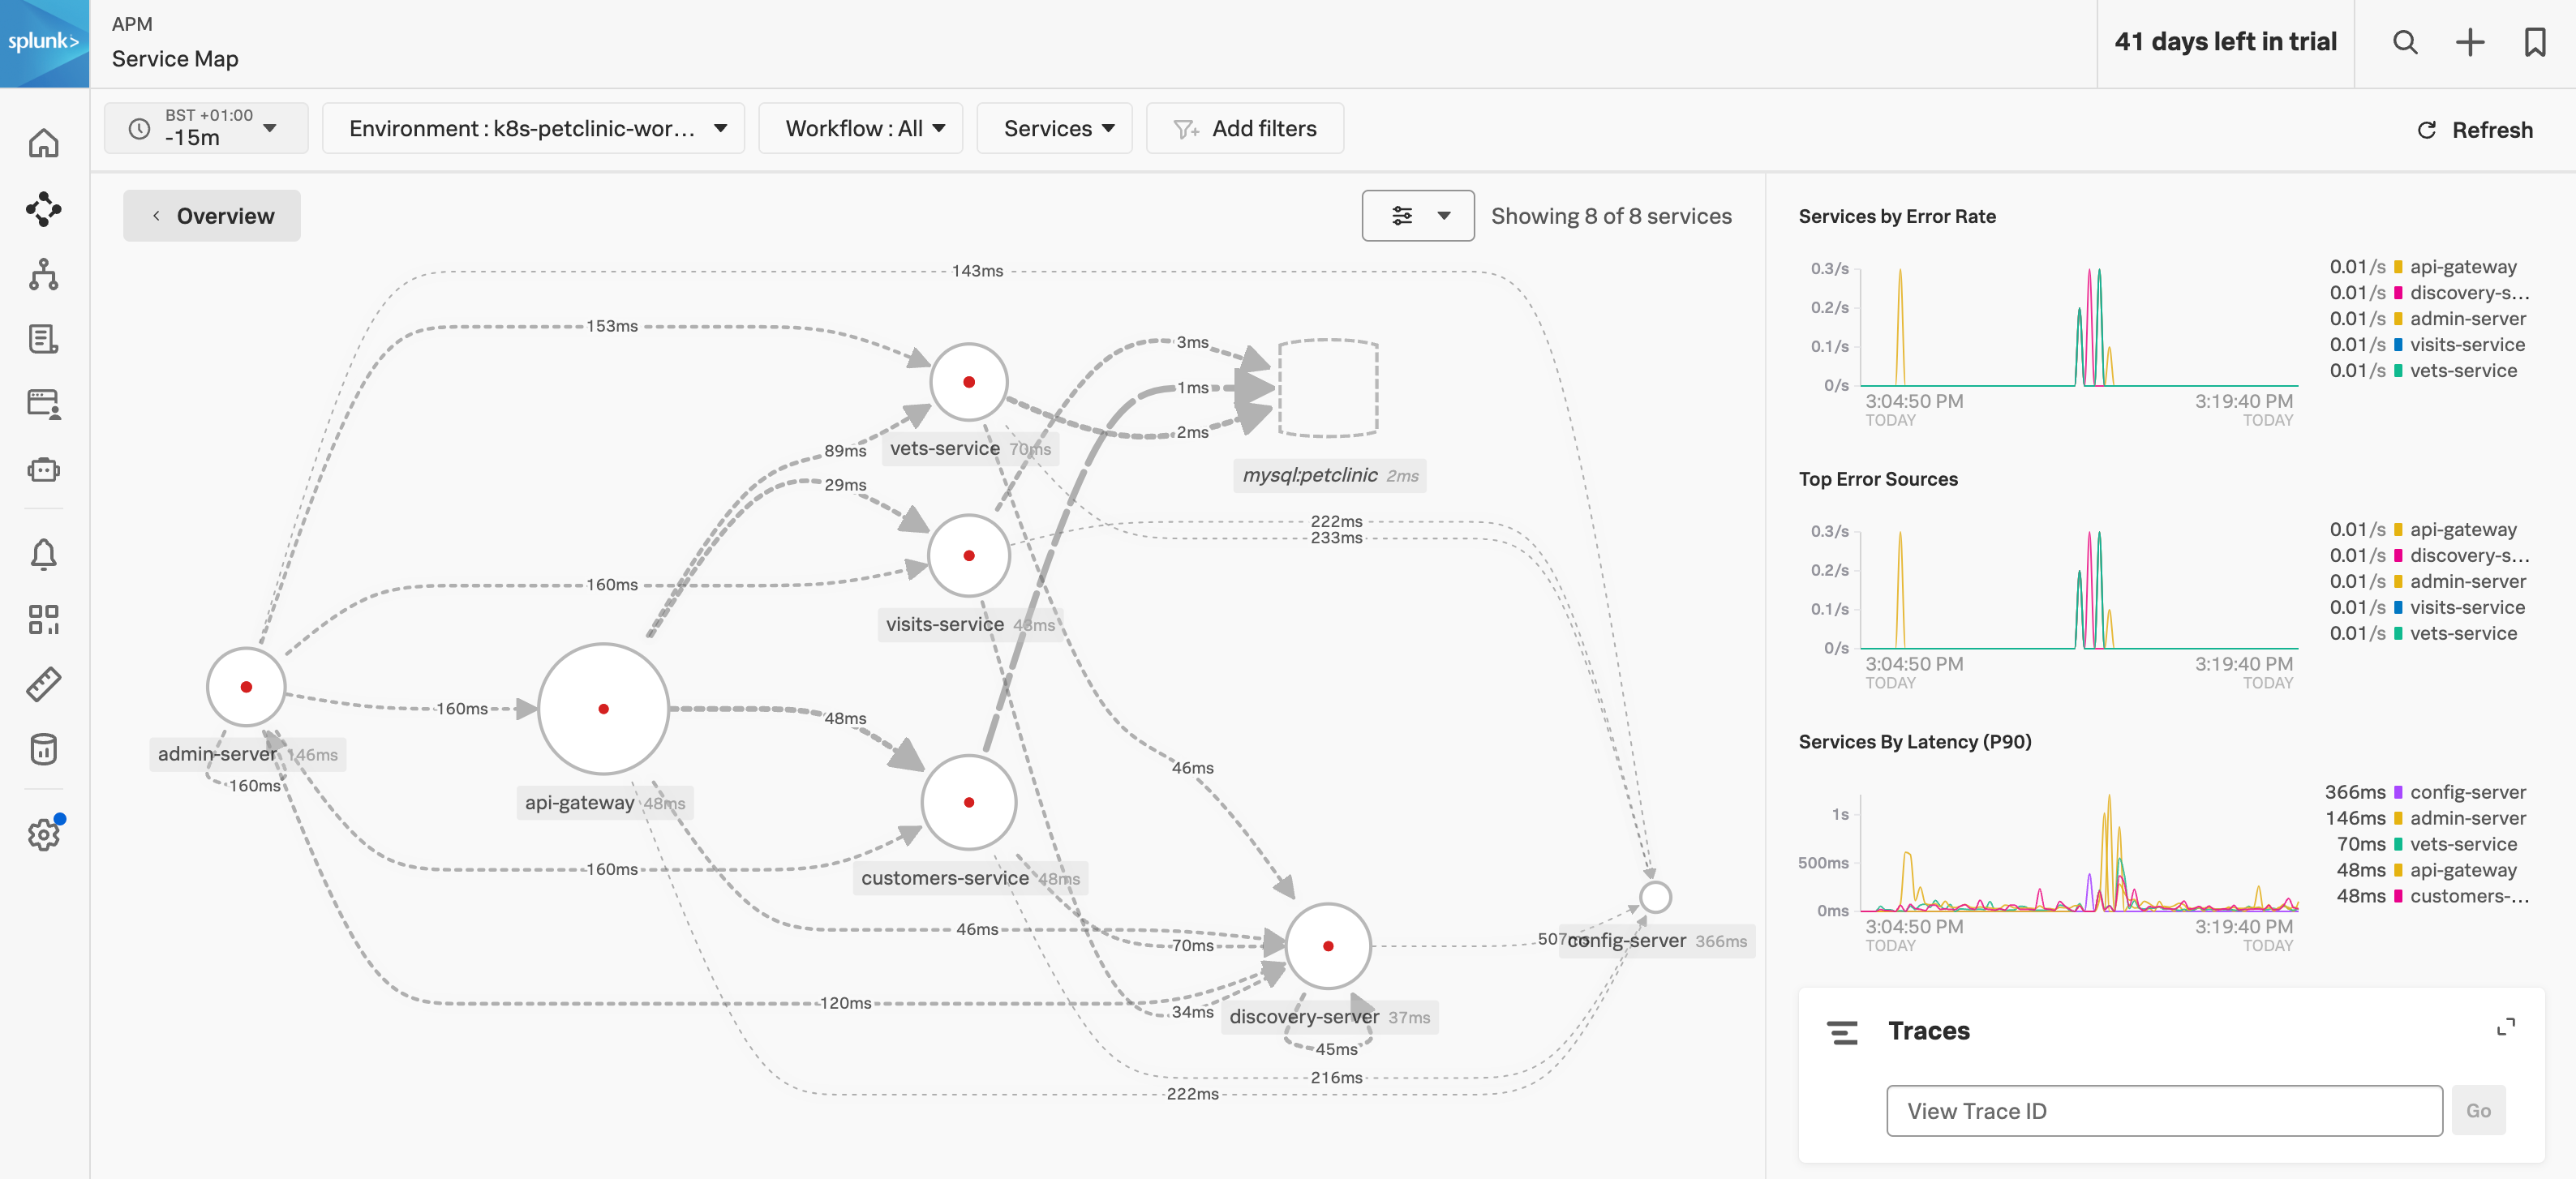
The above map shows all the interactions between all of the services. The map may still be in an interim state as it will take the Petclinic Microservice application a few minutes to start up and fully synchronize. Reducing the time filter to a custom time of 2 minutes will help. The initial startup-related errors (red dots) will eventually disappear.
Next, let’s examine the metrics that are available for each service that is instrumented and visit the request, error, and duration (RED) metrics Dashboard
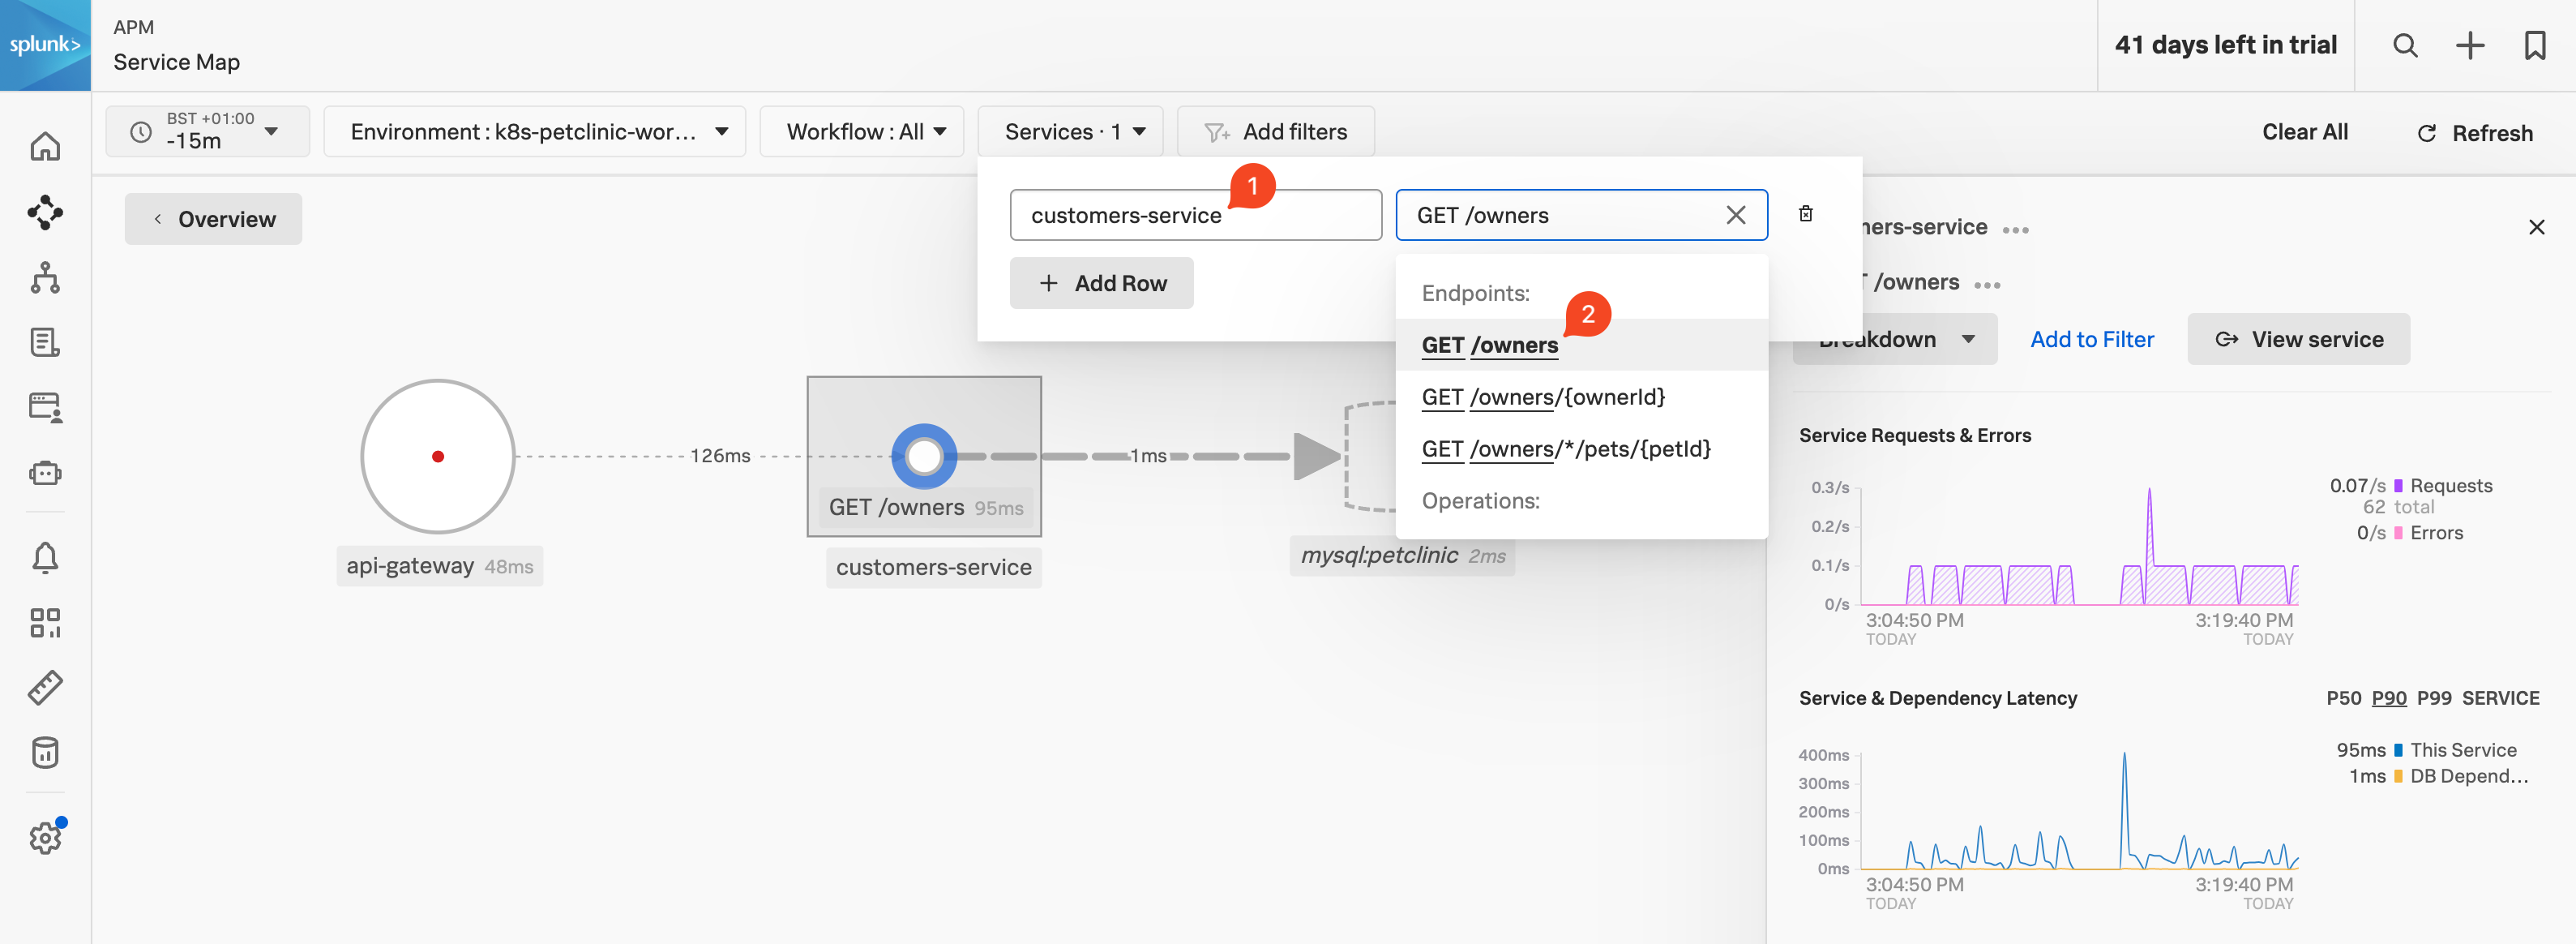
For this exercise we are going to use a common scenario you would use if the service operation was showing high latency, or errors for example.
Select (click) on the Customer Service in the Dependency map (1), then make sure the customers-service is selected in the Services dropdown box (2). Next, select GET /Owners from the Operations dropdown (3)**.
This should give you the workflow with a filter on GET /owners (1) as shown below.
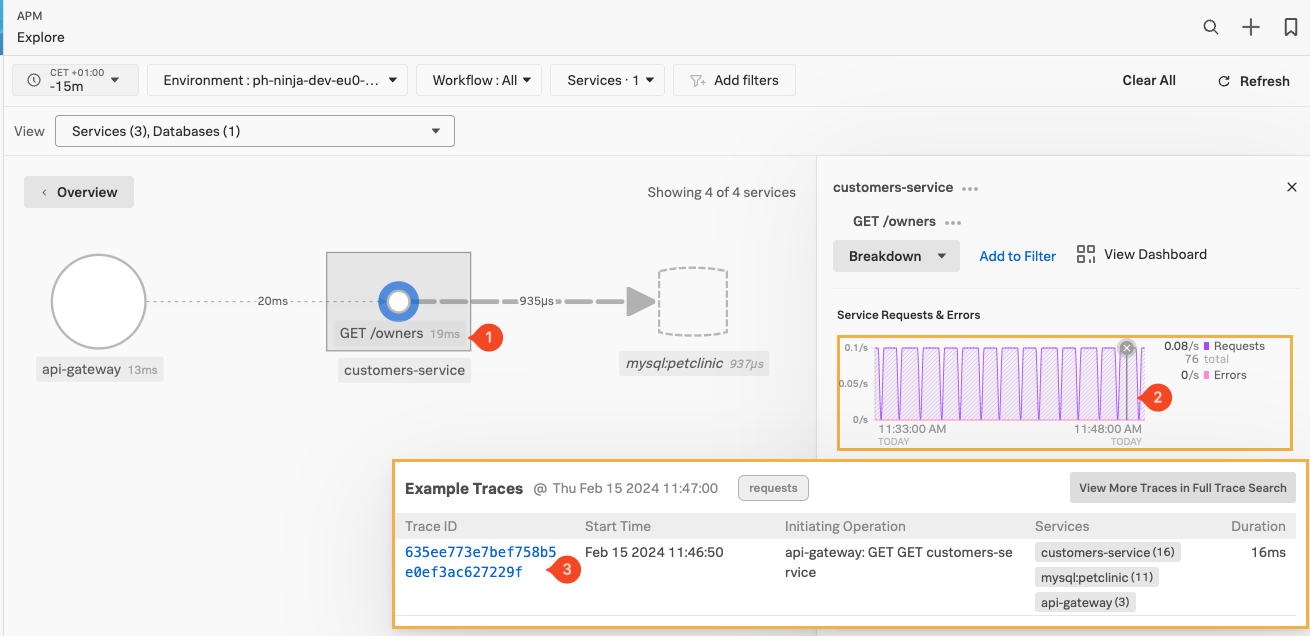
APM Trace
To pick a trace, select a line in the Service Requests & Errors chart (2), when the dot appears click to get a list of sample traces:
Once you have the list of sample traces, click on the blue (3) Trace ID Link (make sure it has the same three services mentioned in the Service Column.)
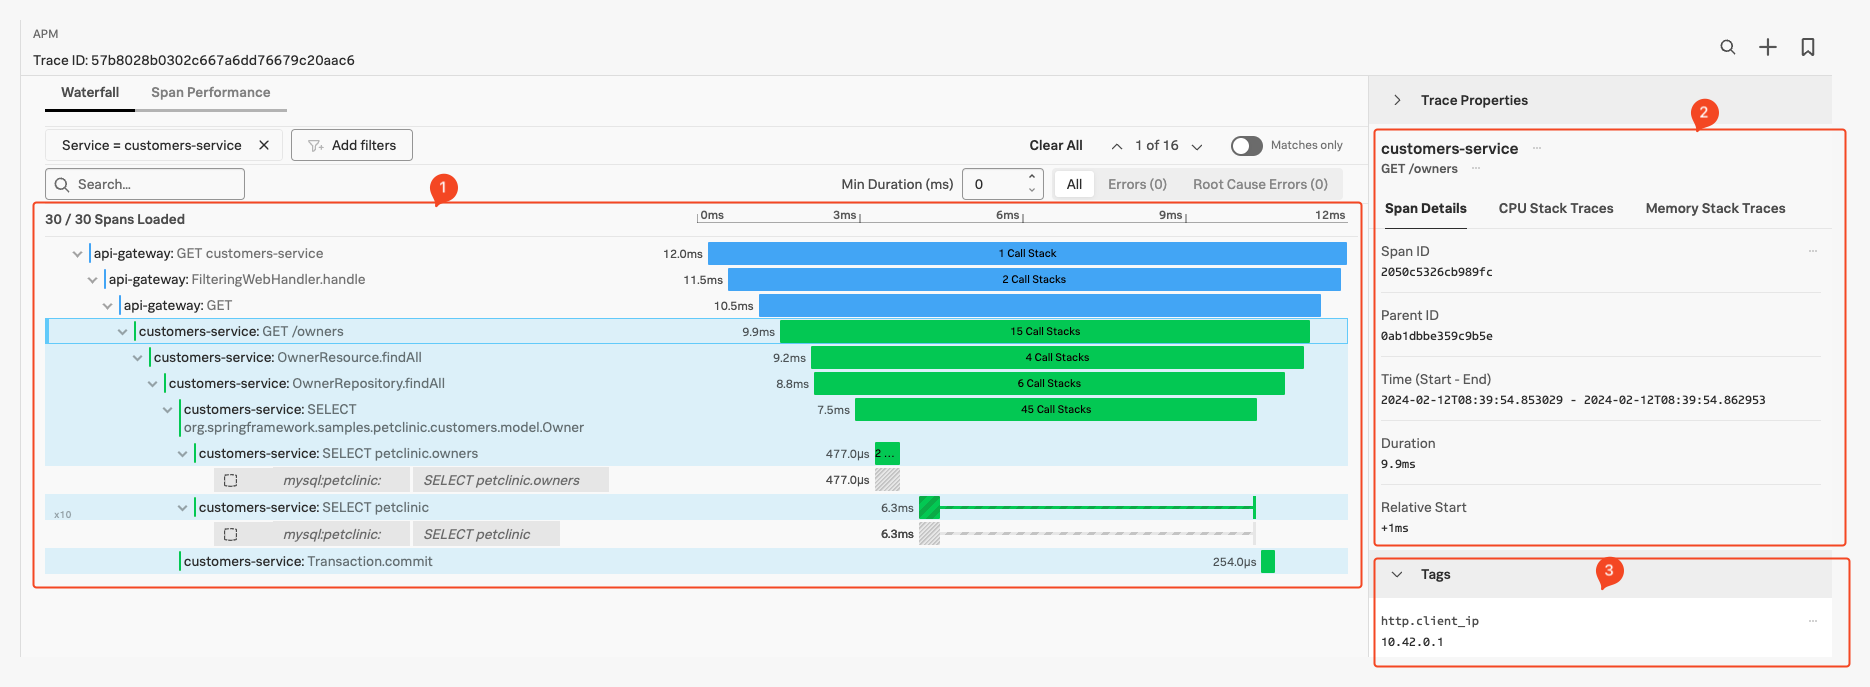
This brings us the the Trace selected in the Waterfall view:
Here we find several sections:
- The actual Waterfall Pane (1), where you see the trace and all the instrumented functions visible as spans, with their duration representation and order/relationship showing.
- The Trace Info Pane (2), by default, shows the selected Span information (highlighted with a box around the Span in the Waterfall Pane).
- The Span Pane (3), here you can find all the Tags that have been sent in the selected Span, You can scroll down to see all of them.
- The process Pane, with tags related to the process that created the Span (scroll down to see as it is not in the screenshot).
- The Trace Properties at the top of the right-hand pane by default is collapsed as shown.
APM Span
While we examine our spans, let’s look at several features that you get out of the box without code modifications when using automatic discovery and configuration on top of tracing:
Due to the fact there are several different routes
First, in the Waterfall Pane, make sure the customers-service:SELECT petclinic.owners or similar span is selected as shown in the screenshot below:
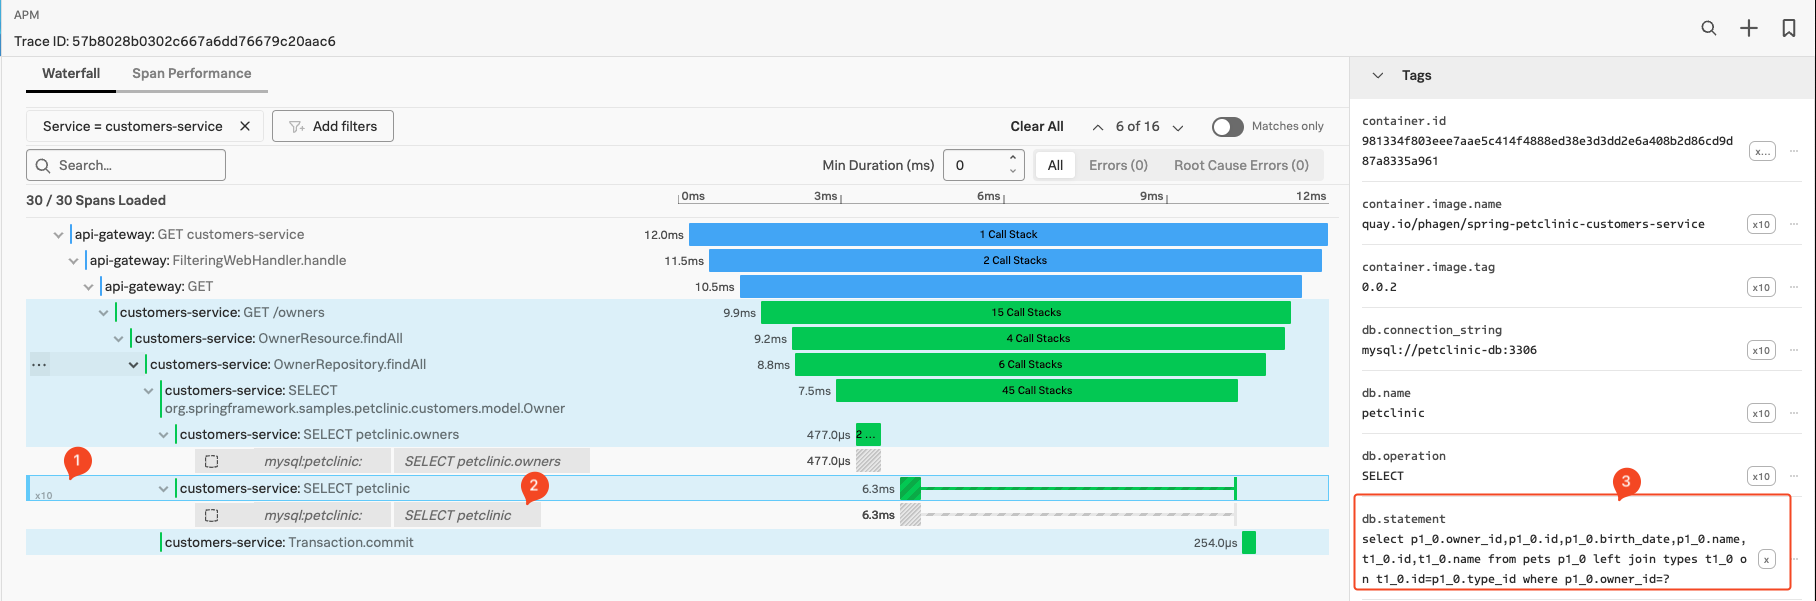
- The basic latency information is shown as a bar for the instrumented function or call, in our example, it took 6.3 Milliseconds.
- Several similar Spans (1), are only visible if the span is repeated multiple times. In this case, there are 10 repeats in our example. (You can show/hide them all by clicking on the
10x and all spans will show in order) - Inferred Services: Calls made to external systems that are not instrumented, show up as a grey ‘inferred’ span. The Inferred Service or span in our case here is a call to the Mysql Database
mysql:petclinic SELECT petclinic (2) as shown above our selected span. - Span Tags: In the Tag Pane, standard tags produced by the automatic discovery and configuration. In this case, the span is calling a Database, so it includes the
db.statement tag (3). This tag will hold the DB query statement and is used by the Database call performed during this span. This will be used by the DB-Query Performance feature. We look at DB-Query Performance in the next section. - Always-on Profiling: IF the system is configured to and has captured Profiling data during a Span life cycle, it will show the number of Call Stacks captured in the Spans timeline (15 Call Stacks for the
customers-service:SELECT petclinic.owners Span shown above).
We will look at Profiling in the next section.
Service Centric View
Splunk APM provide Service Centric Views that provide engineers a deep understanding of service performance in one centralized view. Now, across every service, engineers can quickly identify errors or bottlenecks from a service’s underlying infrastructure, pinpoint performance degradations from new deployments, and visualize the health of every third party dependency.
To see this dashboard for the api-gateway, make sure you have the api-gateway service selected in the Service Map, then click on the *View Service button in the top of the right-hand pane. This will bring you to the Service Centric View dashboard:
This view, which is available for each of your instrumented services, offers an overview of Service metrics, Runtime metrics and Infrastructure metrics.
You can select the *Back function of you browser to go back to the previous view.