Always-On Profiling in the Trace Waterfall
Make sure you have your original (or similar) Trace & Span (1) selected in the APM Waterfall view and select Memory Stack Traces (2) from the right-hand pane:
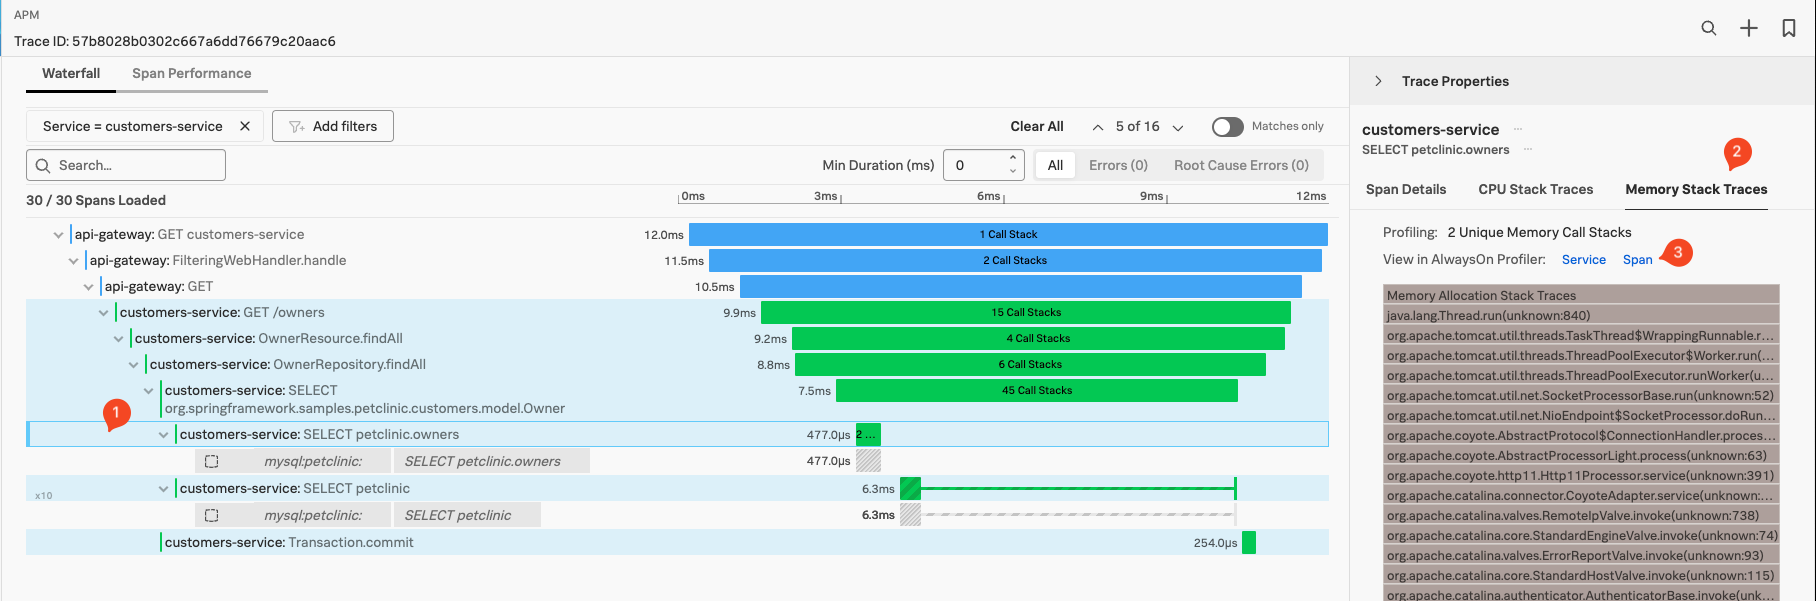
The pane should show you the Memory Stack Trace Flame Graph (3), you can scroll down and/or make the pane for a better view by dragging the right side of the pane.
As AlwaysOn Profiling is constantly taking snapshots, or stack traces, of your application’s code and reading through thousands of stack traces is not practical, AlwaysOn Profiling aggregates and summarizes profiling data, providing a convenient way to explore Call Stacks in a view called the Flame Graph. It represents a summary of all stack traces captured from your application. You can use the Flame Graph to discover which lines of code might be causing performance issues and to confirm whether the changes you make to the code have the intended effect.
To dive deeper into the Always-on Profiling, select Span (3) in the Profiling Pane under Memory Stack Traces This will bring you to the Always-on Profiling main screen, with the Memory view pre-selected:
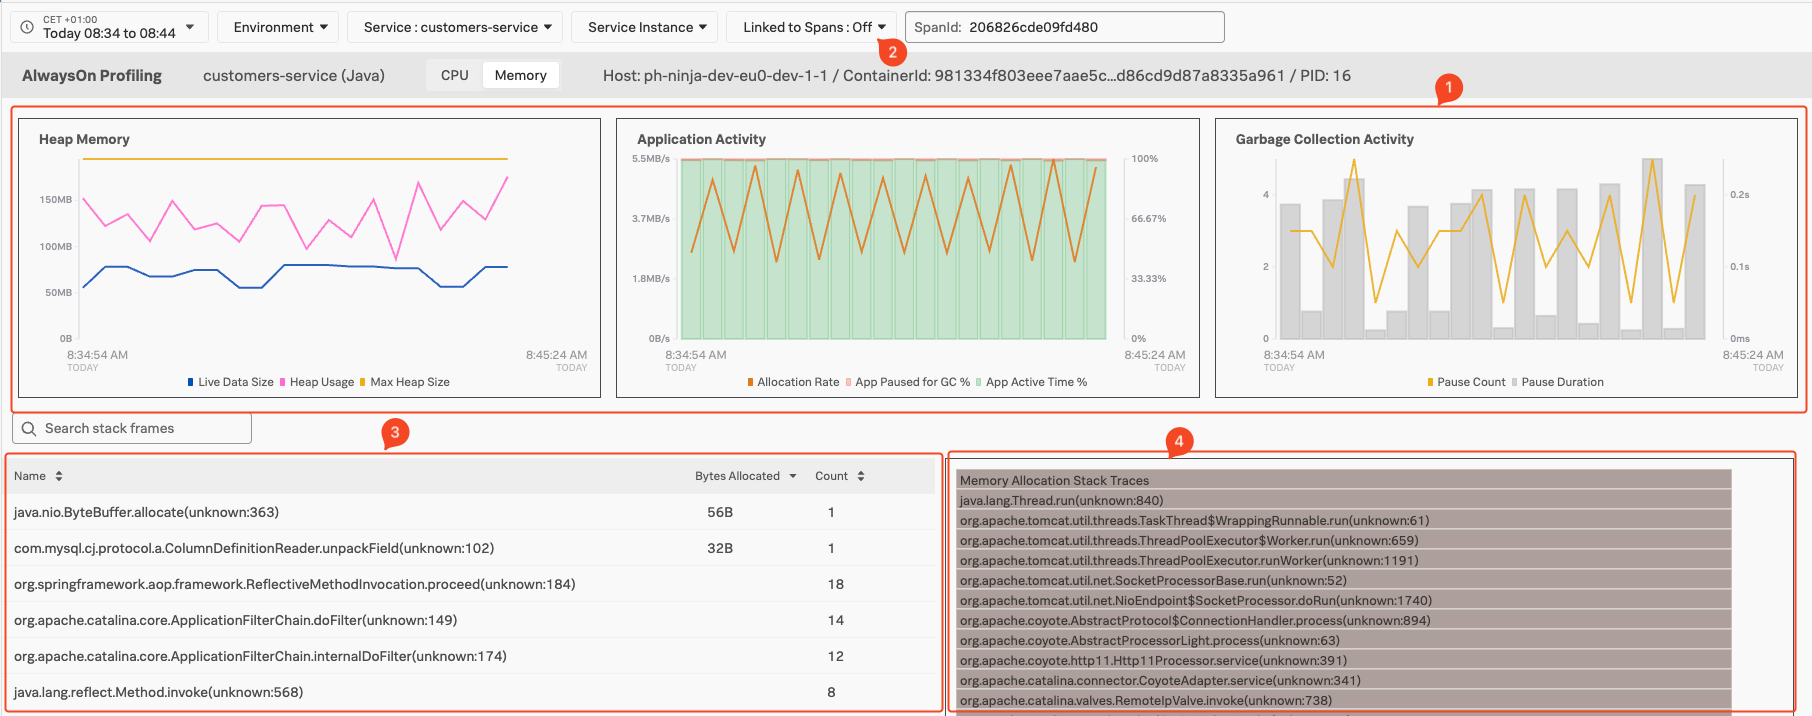
- Java Memory Metric Charts (1), Allow you to
Monitor Heap Memory, Application ActivitylikeMemory Allocation RateandGarbage CollectingMetrics. - Ability to focus/see metrics and Stack Traces only related to the Span (2), This will filter out background activities running in the Java application if required.
- Java Function calls identified. (3), allowing you to drill down into the Methods called from that function.
- The Flame Graph (4), with the visualization of hierarchy based on the stack traces of the profiled service.
For further investigation the UI let’s you grab the actual stack trace, so you can use in your coding platform to go to the actual lines of code used at this point (depending of course on your preferred Coding platform)