Database Query Performance
With Database Query Performance, you can monitor the impact of your database queries on service availability directly in Splunk APM. This way, you can quickly identify long-running, unoptimized, or heavy queries and mitigate issues they might be causing, without having to instrument your databases.
To look at the performance of your database queries, make sure you are on the APM Explore page either by going back in the browser or navigating to the APM section in the Menu bar, then click on the Explore tile.
Select the inferred database service mysql:petclinic Inferred Database server in the Dependency map (1), then scroll the right-hand pane to find the Database Query Performance Pane (2).
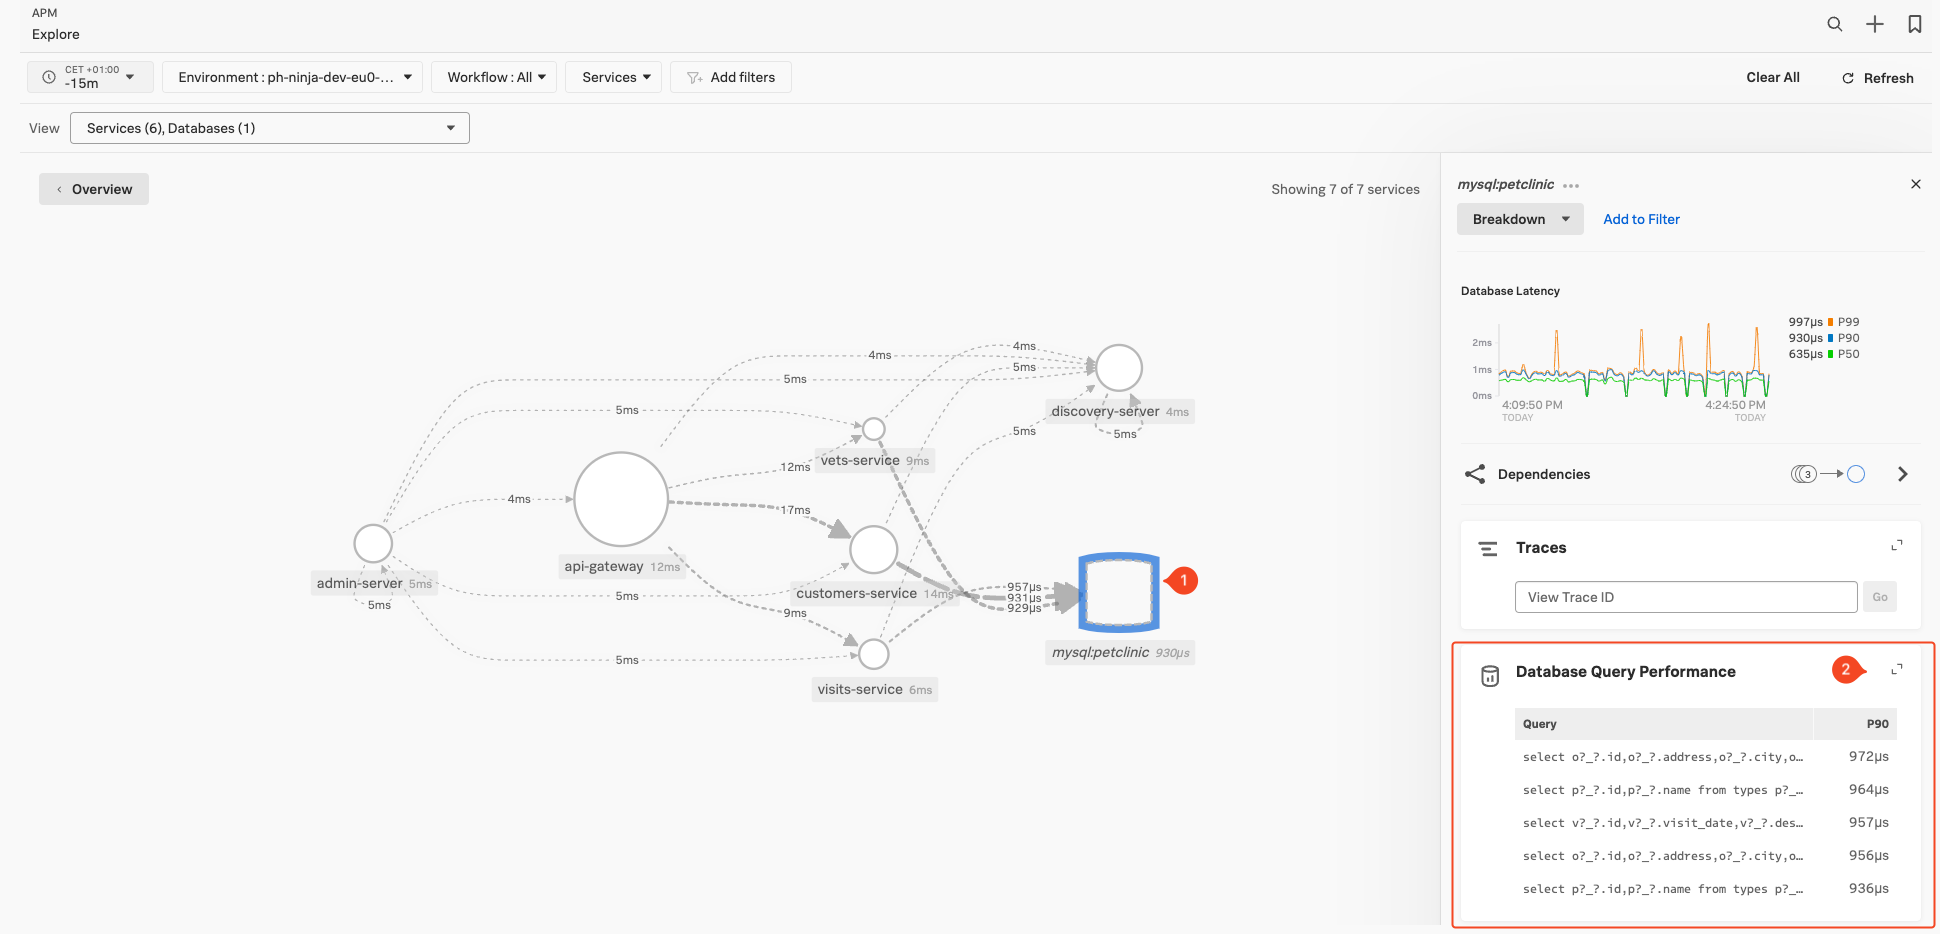
If the service you have selected in the map is indeed an (inferred) database server, this pane will populate with the top 90% (P90) database calls based on duration. To dive deeper into the db-query performance function click somewhere on the word Database Query Performance at the top of the pane.
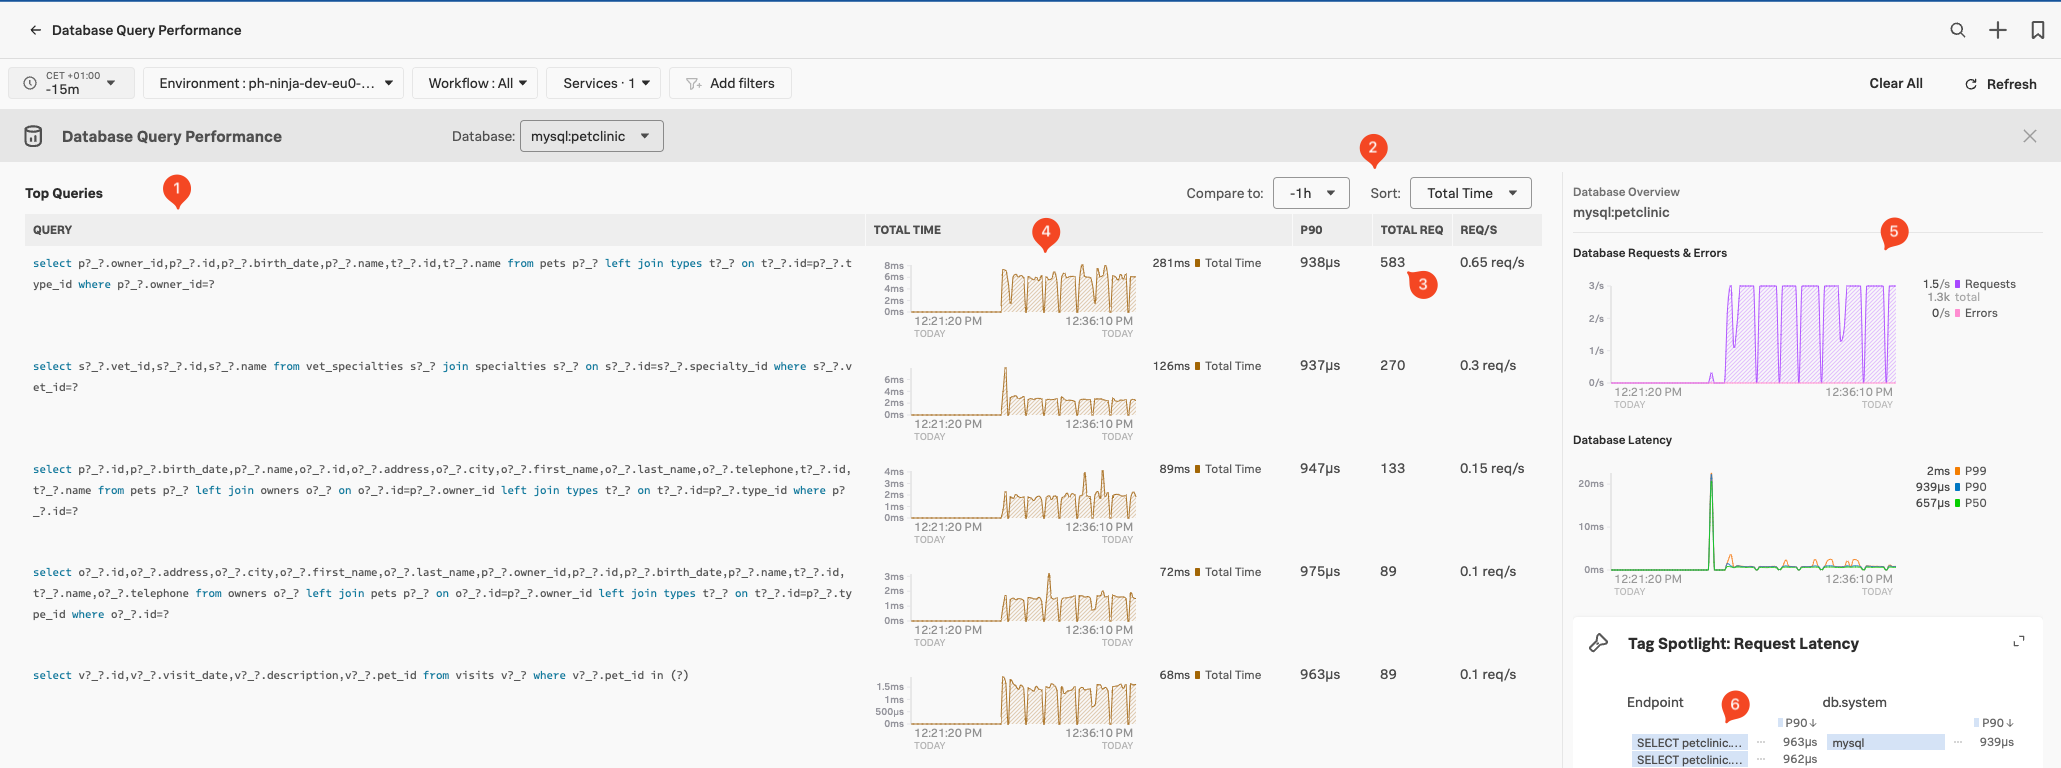
This will bring us to the DB-query Performance overview screen:
By default, Splunk APM instrumentation sanitizes database queries to remove or mask sensible data, such as secrets or personally identifiable information (PII) from the db.statements. You can find how to turn off database query normalization here.
This screen will show us all the Database queries (1) done towards our database from your application, based on the Traces & Spans sent to the Splunk Observability Cloud. Note that you can compare them across a time block or sort them on Total Time, P90 Latency & Requests (2).
For each Database query in the list, we see the highest latency, the total number of calls during the time window and the number of requests per second (3). This allows you to identify places where you might optimize your queries.
You can select traces containing Database Calls via the two charts in the right-hand pane (5). Use the Tag Spotlight pane (6) to drill down what tags are related to the database calls, based on endpoints or tags.
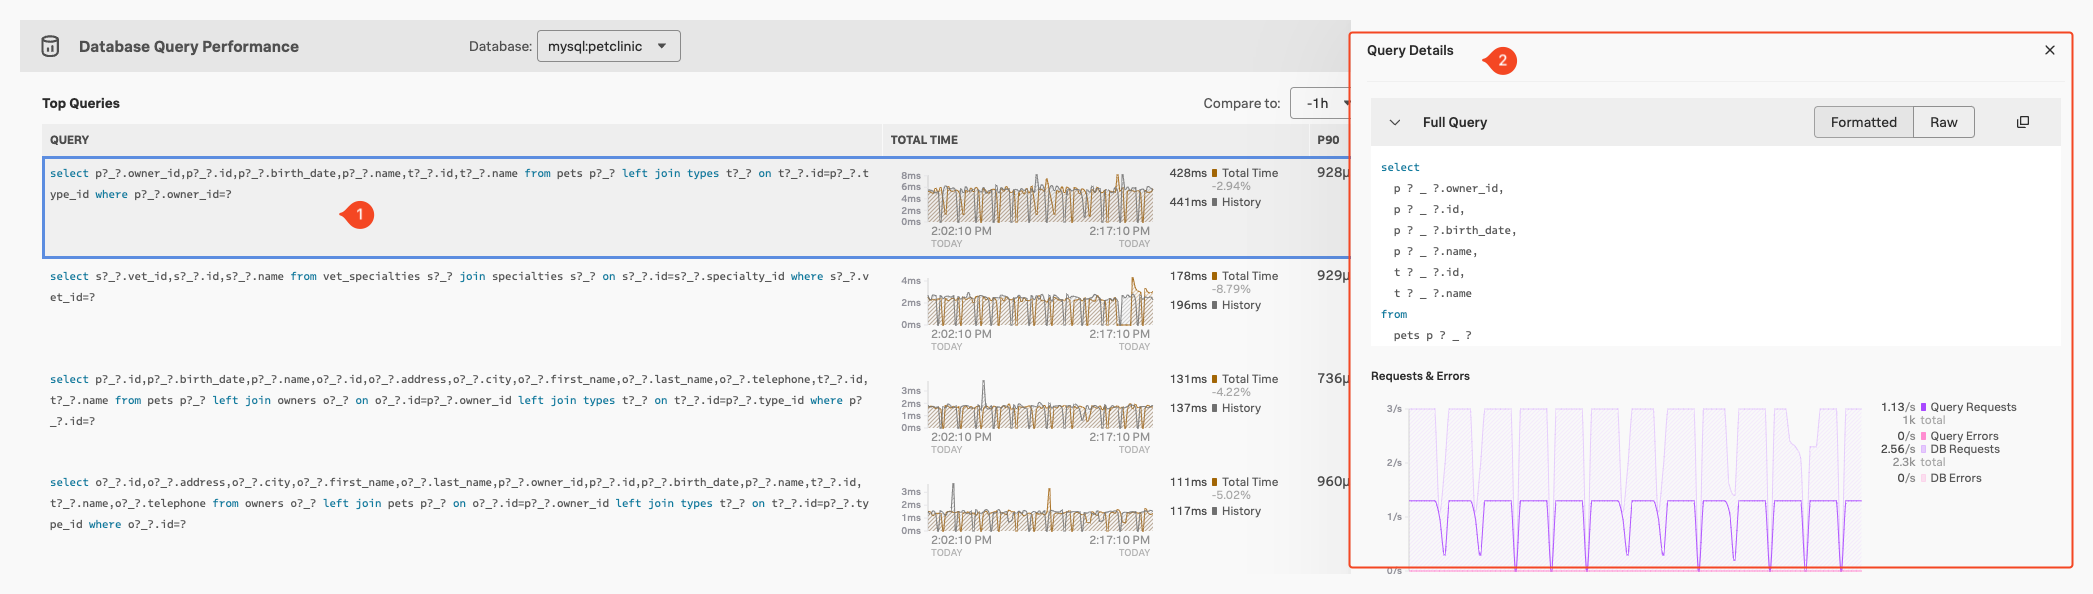
If you click on a specific Query (1) you get a detailed query Details pane appears (2), which you can use for more detailed investigations: