Log Observer
10 minutes
Up until this point, there have been no code changes, yet tracing, profiling and Database Query Performance data is being sent to Splunk Observability Cloud.
Next we will work with the Splunk Log Observer to the mix to obtain log data from the Spring PetClinic application.
The Splunk OpenTelemetry Collector automatically collects logs from the Spring PetClinic application and sends them to Splunk Observability Cloud using the OTLP exporter, annotating the log events with trace_id, span_id and trace flags.
The Splunk Log Observer is then used to view the logs and with the changes to the log format the platform can automatically correlate log information with services and traces.
This feature is called Related Content.
Subsections of Log Observer
Viewing the Logs
In order to see logs click on the Log Observer  in the left-hand menu. Once in Log Observer please ensure Index on the filter bar is set to splunk4rookies-workshop.
Next, click Add Filter and search for the field deployment.environment, select your workshop instance and click = (to include). You will now see only the log messages from your PetClinic application.
Next search for the field service.name, select the value customers-service and click = (to include). Now the log entries will be reduced to show the entries from your customers-service only.
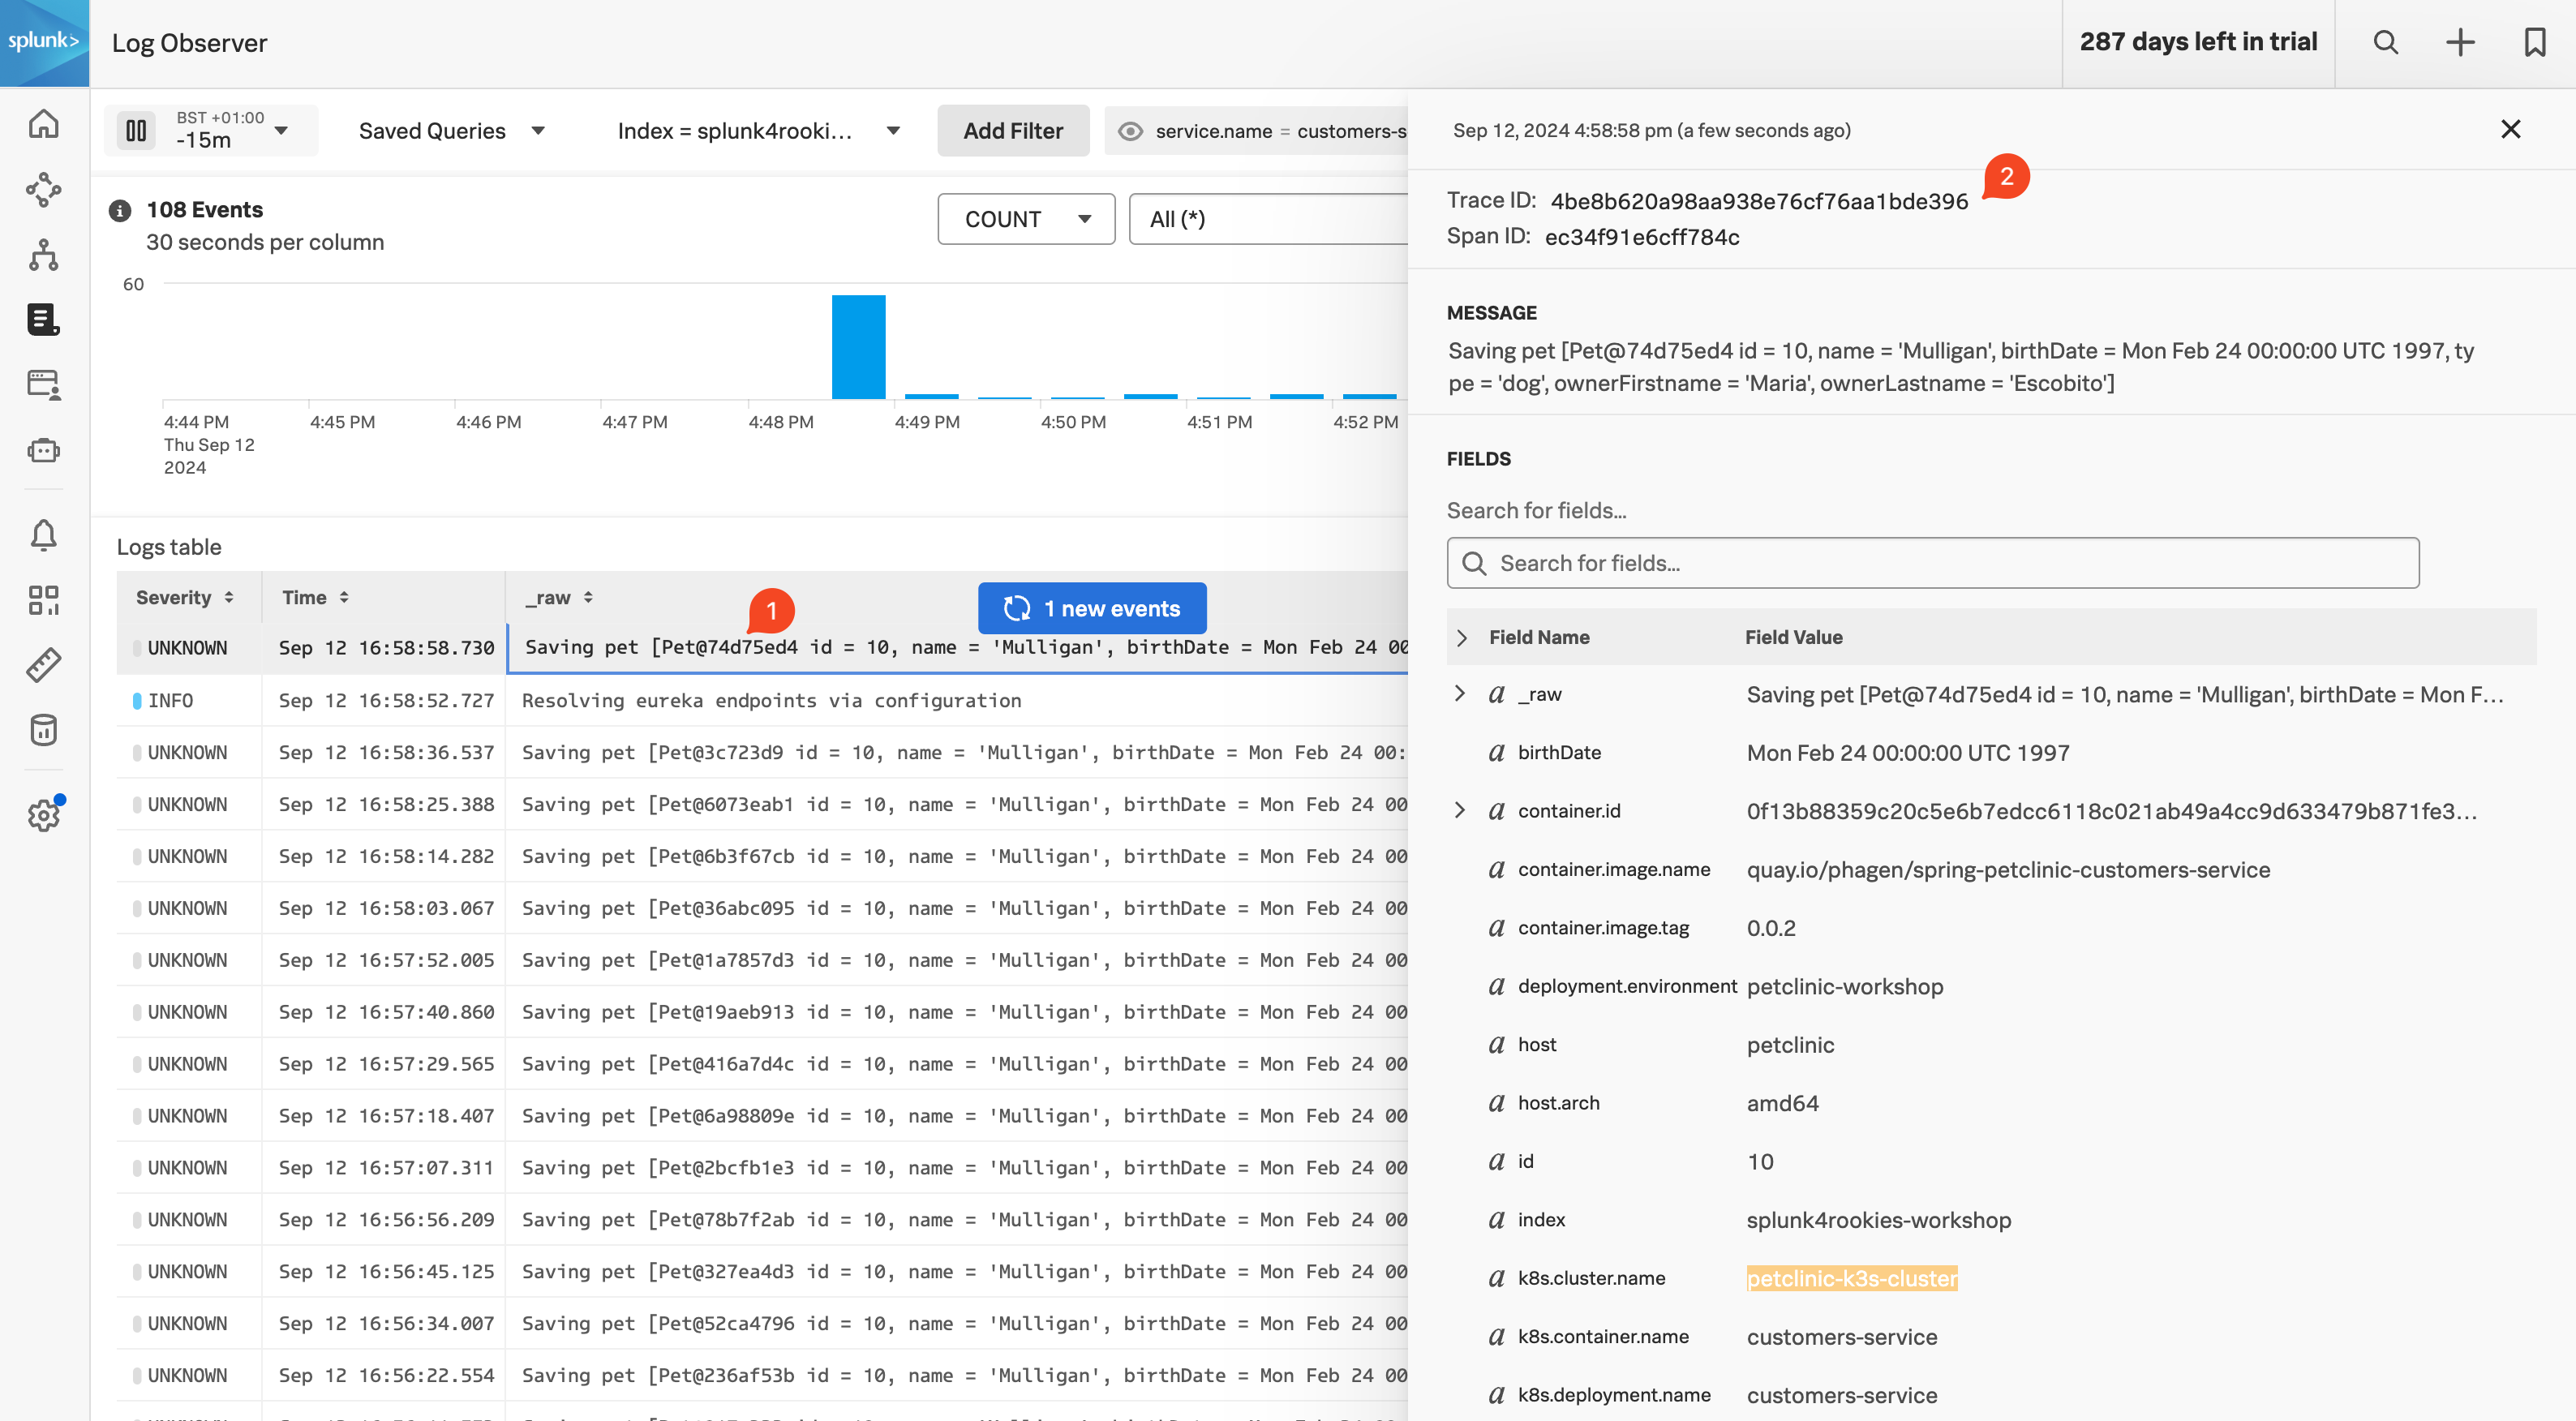
Click on an entry with an injected trace_id (1). A side pane will open where you can see the detailed information, including the relevant trace and span IDs (2).
Related Content
In the bottom pane is where any related content will be reported. In the screenshot below you can see that APM has found a trace that is related to this log line (1):
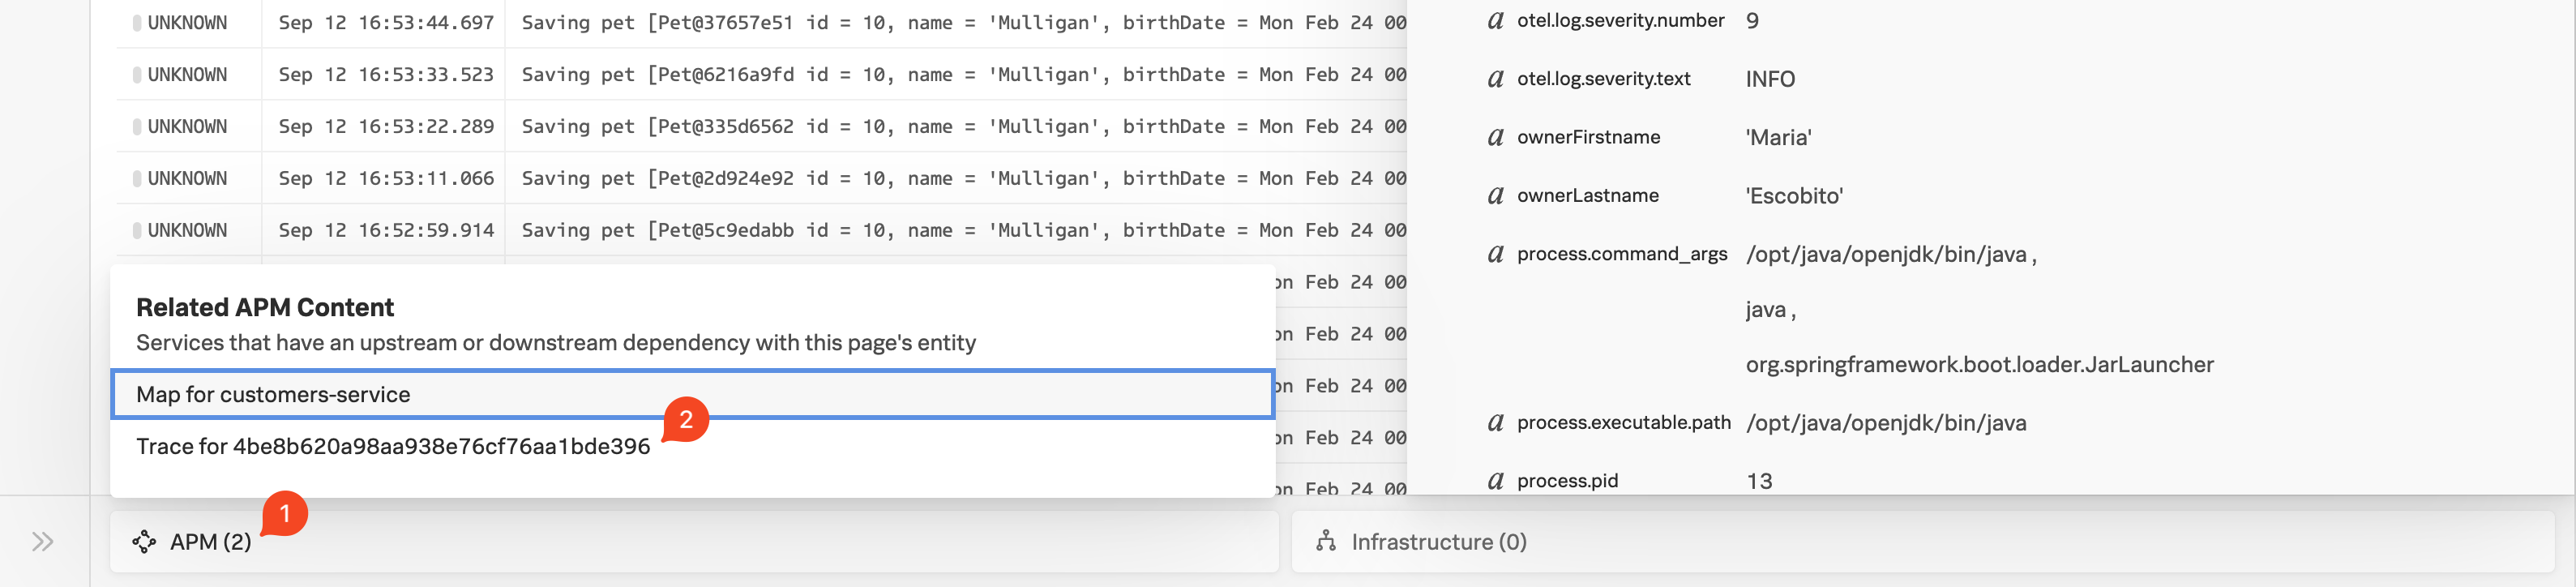
By clicking on Trace for 4be8b620a98aa938e76cf76aa1bde396 (2) will take us to the waterfall in APM for this specific trace that this log line was generated from:
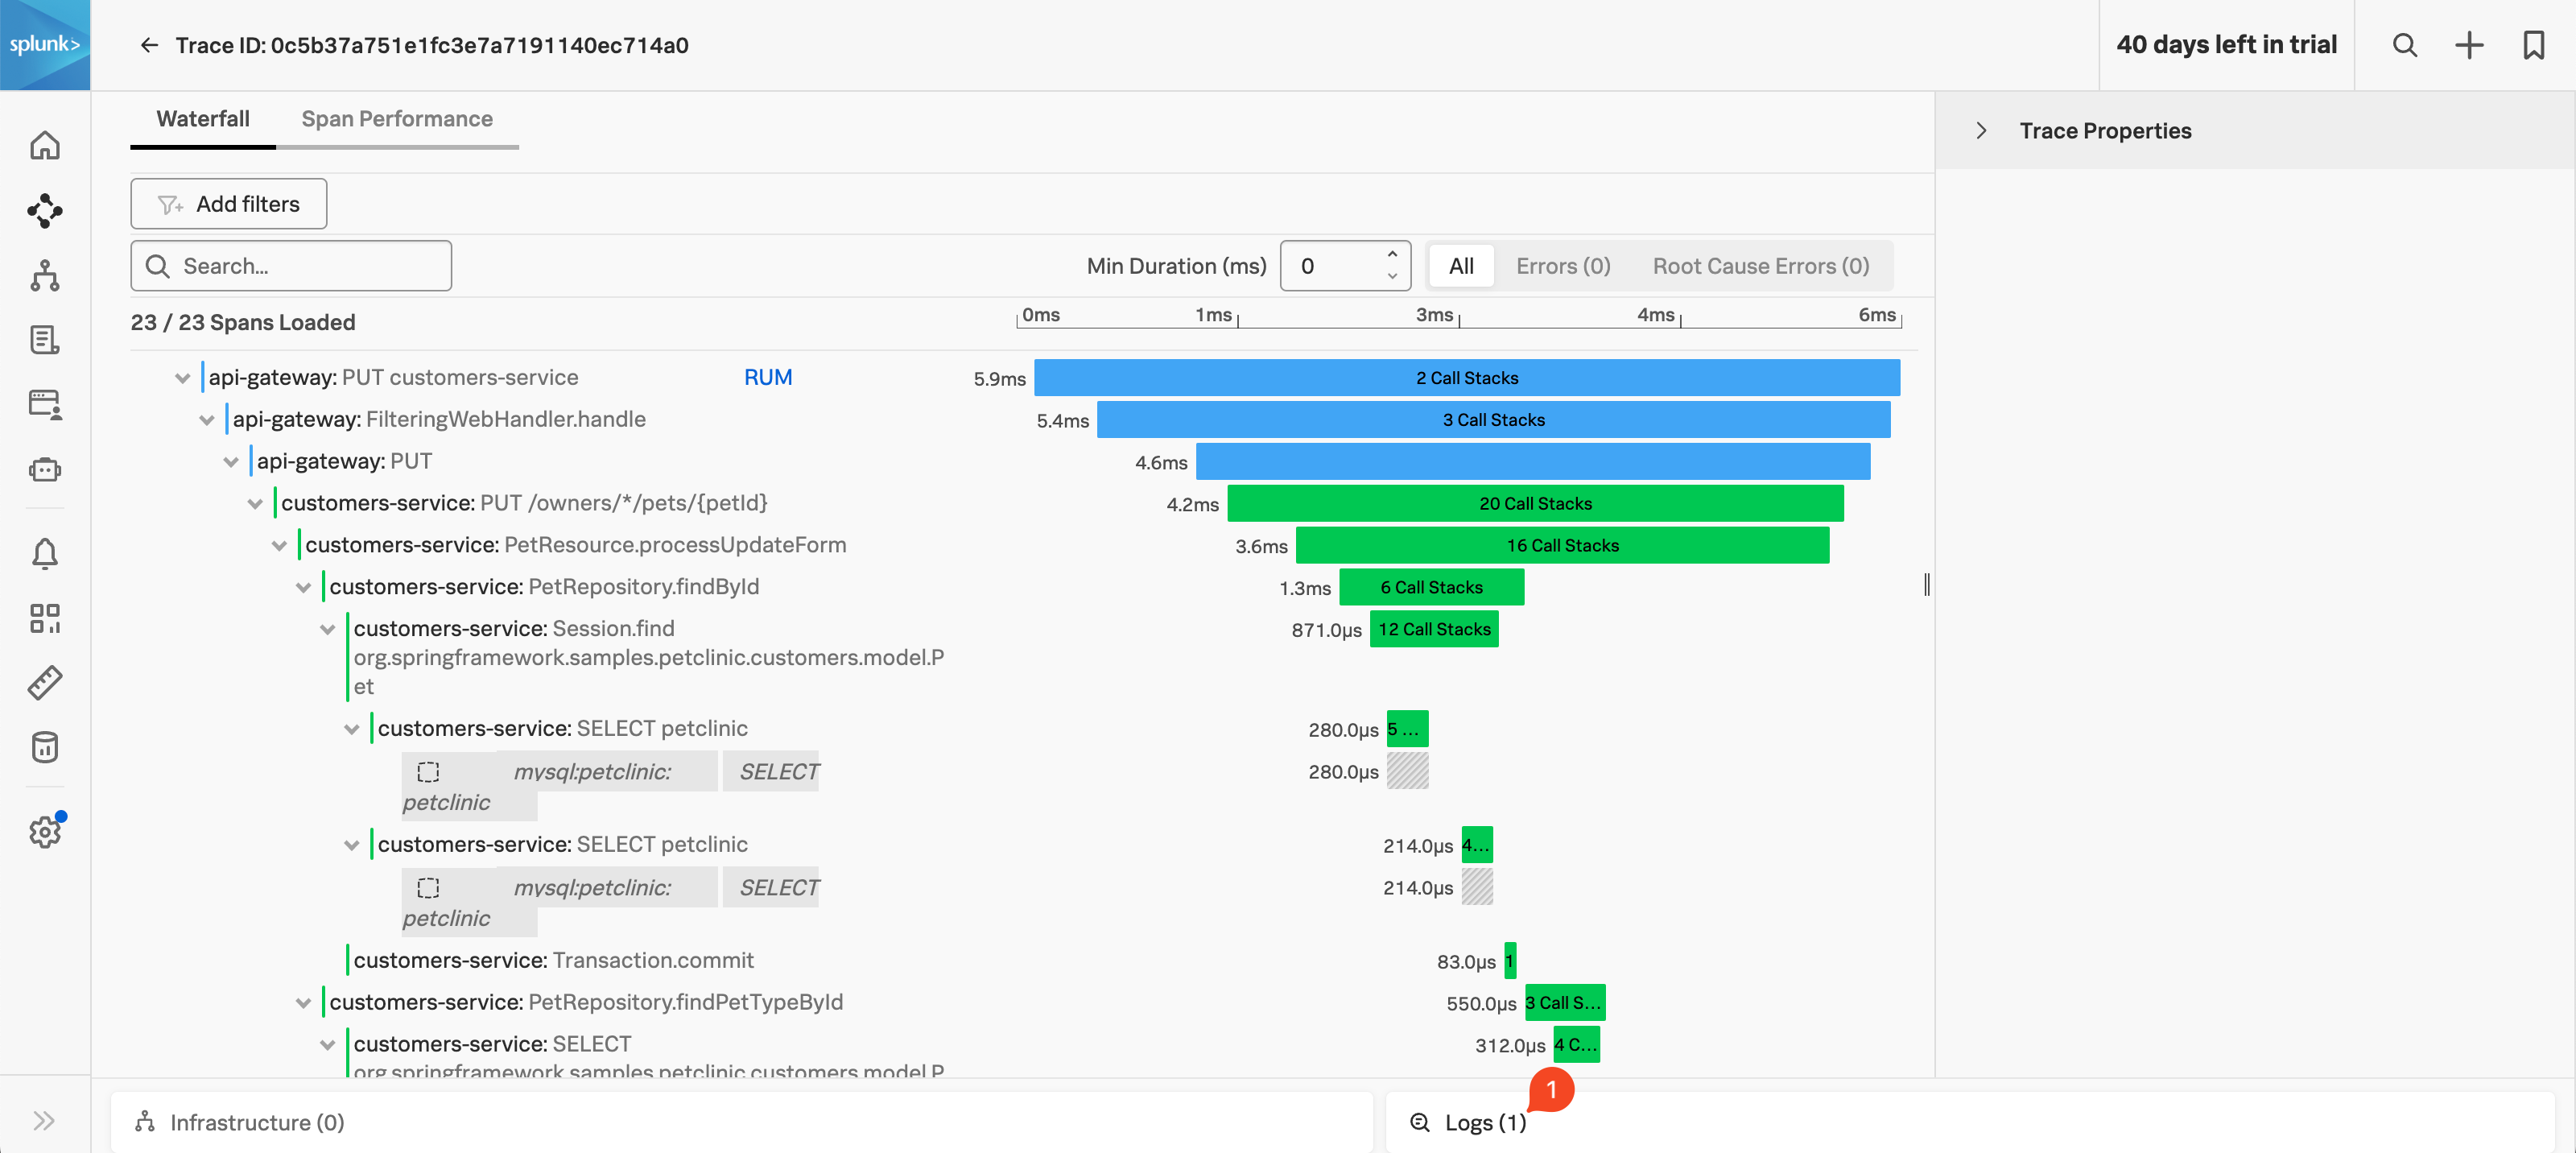
Note that you now have Related Content pane for Logs appear (1). Clicking on this will take you back to Log Observer and will display all the log lines that are part of this trace.