To enable Real User Monitoring (RUM) instrumentation for your application, you need to add the Open Telemetry Javascript https://github.com/signalfx/splunk-otel-js-web snippet to your code.
The Spring PetClinic application uses a single HTML page as the “index” page, that is reused across all pages of the application. This is the perfect location to insert the Splunk RUM Instrumentation Library as it will be loaded for all pages automatically.
The following snippet is inserted into the section of the index.html page:
<scriptsrc="/static/env.js"></script><scriptsrc="https://cdn.signalfx.com/o11y-gdi-rum/latest/splunk-otel-web.js"crossorigin="anonymous"></script><scriptsrc="https://cdn.signalfx.com/o11y-gdi-rum/latest/splunk-otel-web-session-recorder.js"crossorigin="anonymous"></script><script>varrealm=env.RUM_REALM;console.log('Realm:',realm);varauth=env.RUM_AUTH;varappName=env.RUM_APP_NAME;varenvironmentName=env.RUM_ENVIRONMENTif(realm&&auth){SplunkRum.init({realm:realm,rumAccessToken:auth,applicationName:appName,deploymentEnvironment:environmentName,version:'1.0.0',});SplunkSessionRecorder.init({app:appName,realm:realm,rumAccessToken:auth});constProvider=SplunkRum.provider;vartracer=Provider.getTracer('appModuleLoader');}else{// Realm or auth is empty, provide default values or skip initialization
console.log("Realm or auth is empty. Skipping Splunk Rum initialization.");}</script>
The above snippet of code has already been added to index.html in the repository you cloned earlier, but it is not yet activated, we will do that in the next section.
If you want you can verify the snippet, we added to the index.html by viewing the file:
more ~/spring-petclinic-microservices/spring-petclinic-api-gateway/src/main/resources/static/index.html
<!DOCTYPE html>

<html ng-app="petClinicApp" lang="en">

<head>
    <meta http-equiv="Content-Type" content="text/html; charset=UTF-8"/>
    <meta charset="utf-8"/>
    <meta http-equiv="X-UA-Compatible" content="IE=edge"/>
    <meta name="viewport" content="width=device-width, initial-scale=1, user-scalable=0, minimal-ui"/>
    <!-- The above 4 meta tags *must* come first in the head; any other head content must come *after* these tags -->

    <link rel="shortcut icon" type="image/x-icon" href="/images/favicon.png"/>

    <title>PetClinic :: a Spring Framework demonstration</title>
    <link rel="stylesheet" href="/webjars/bootstrap/css/bootstrap.min.css"/>
    <link rel="stylesheet" href="/css/petclinic.css"/>

    <script src="/webjars/jquery/jquery.min.js"></script>
    <script src="/webjars/bootstrap/js/bootstrap.min.js"></script>

    <script src="/webjars/angularjs/angular.min.js"></script>
    <script src="/webjars/angular-ui-router/angular-ui-router.min.js"></script>
    <!-- Section added for  RUM -->
    <script src="/scripts/env.js"></script>
    <script src="https://cdn.signalfx.com/o11y-gdi-rum/latest/splunk-otel-web.js" crossorigin="anonymous"></script>
    <script src="https://cdn.signalfx.com/o11y-gdi-rum/latest/splunk-otel-web-session-recorder.js" crossorigin="anonymous"></script>
    <script>
        var realm = env.RUM_REALM;
        console.log('Realm:', realm);
        var auth = env.RUM_AUTH;
        var appName = env.RUM_APP_NAME;
        var environmentName = env.RUM_ENVIRONMENT
        if (realm && auth) {
            SplunkRum.init({
                realm: realm,
                rumAccessToken: auth,
                applicationName: appName,
                deploymentEnvironment: environmentName,
                version: '1.0.0',
            });

            SplunkSessionRecorder.init({
                app: appName,
                realm: realm,
                rumAccessToken: auth
            });
            const Provider = SplunkRum.provider;
            var tracer=Provider.getTracer('appModuleLoader');
        } else {
        // Realm or auth is empty, provide default values or skip initialization
        console.log("Realm or auth is empty. Skipping Splunk Rum initialization.");
        }
    </script>
     <!-- Section added for  RUM -->
    <script src="/scripts/app.js"></script>
Subsections of Real User Monitoring
Rebuild PetClinic with RUM enabled
At the top of the previous code snippet, there is a reference to the file /static/env.js, which contains/sets the variables used by RUM, currently these are not configured and therefore no RUM traces are currently being sent.
Run the script that will update variables to enable RUM traces so they are viewable in Splunk Observability Cloud. Note, that the env.js script contains a deliberate JavaScript error, that will be picked up in RUM:
As soon as the container is pushed into the repository, just restart the api-gateway to apply the changes:
kubectl rollout restart deployment api-gateway
deployment.apps/api-gateway restarted
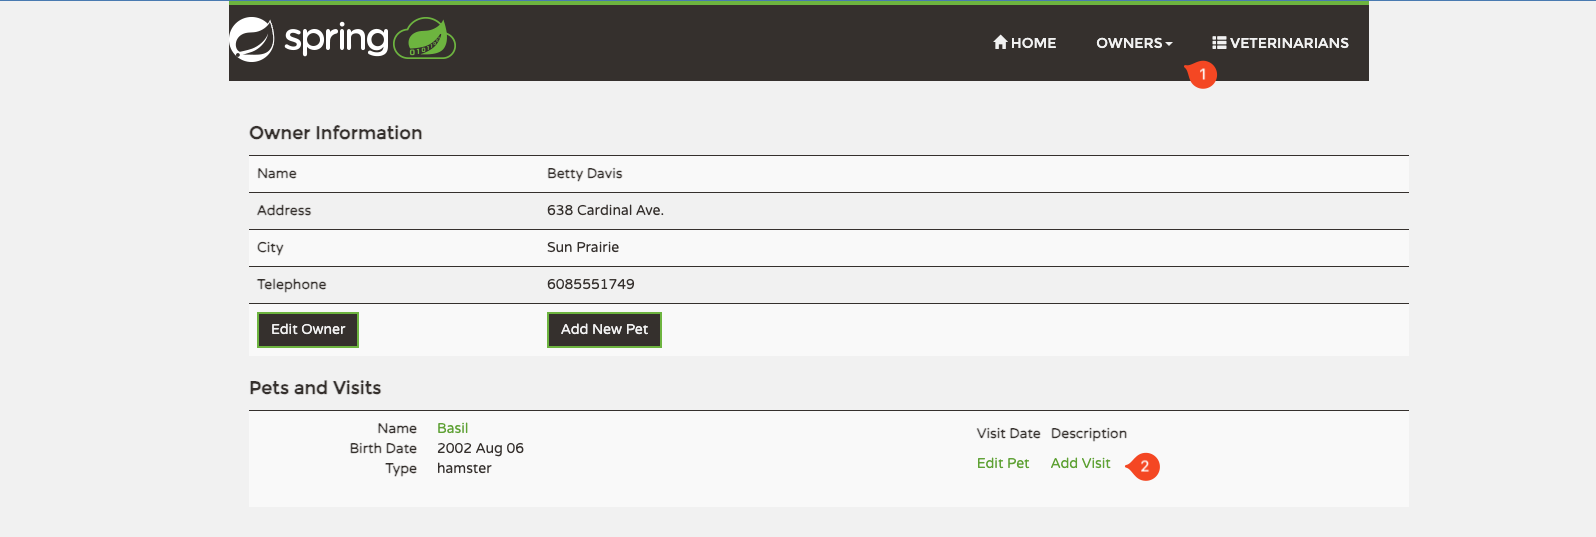
Validate that the application is running by visiting http://<IP_ADDRESS>:81 (replace <IP_ADDRESS> with the IP address you obtained above). Make sure the application is working correctly by visiting the All Owners(1) and select an owner, then add a visit(2). We will use this action when checking RUM
If you want, you can access this website on your phone/tablet as well as this data will also show up in RUM.
Select the RUM view for the Petclinic App
Once RUM has been configured and you have added a visit for a pet, you can log in to Splunk Observability Cloud and verify that RUM traces are flowing in.
Lets start a quick high level tour into RUM by clicking RUM in the left-hand menu. Then change the Environment filter (1) to the name of your workshop instance from the dropdown box, it will be <INSTANCE>-workshop(1) (where INSTANCE is the value from the shell script you ran earlier). Make sure it is the only one selected.
Then change the App(2) dropdown box to the name of your app, it will be <INSTANCE>-store
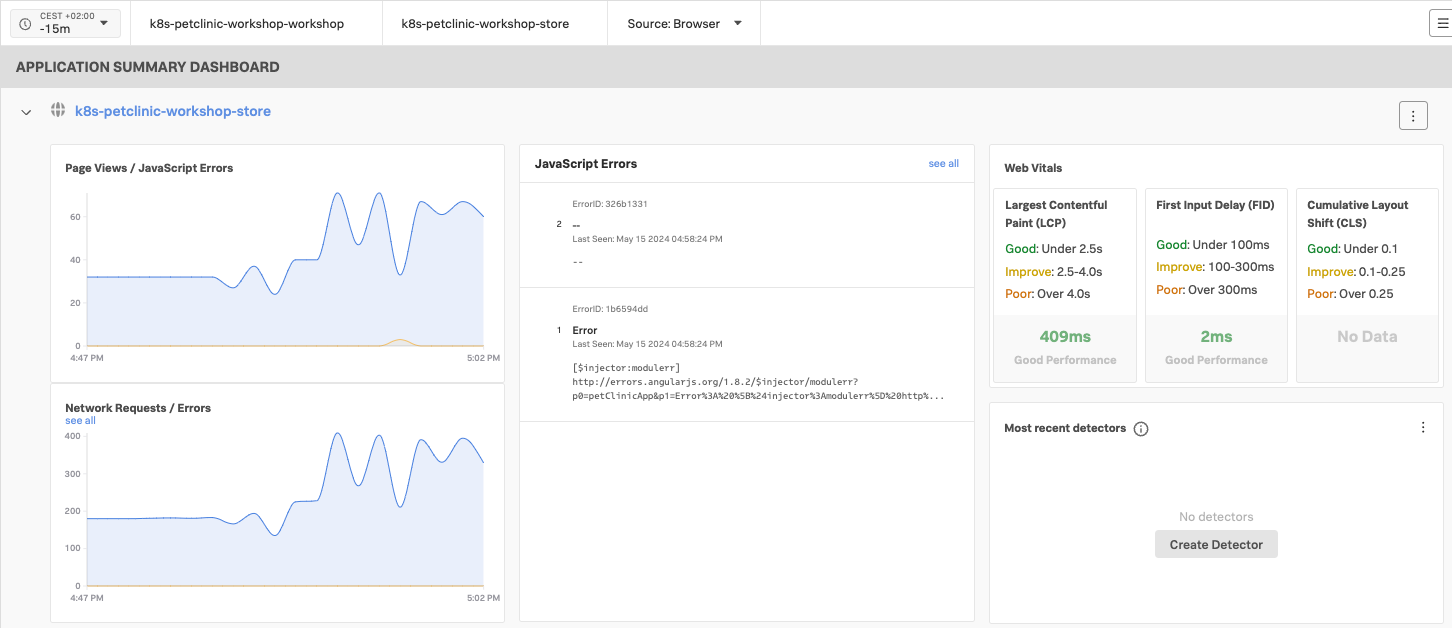
Once you have selected your Environment and App, you will see an overview page showing the RUM status of your App (if your Summary Dashboard is just a single row of numbers, you are looking at the condensed view. You can expand it by clicking on the > in front of the Application name). If any JavaScript error occurred they will show up as shown below:
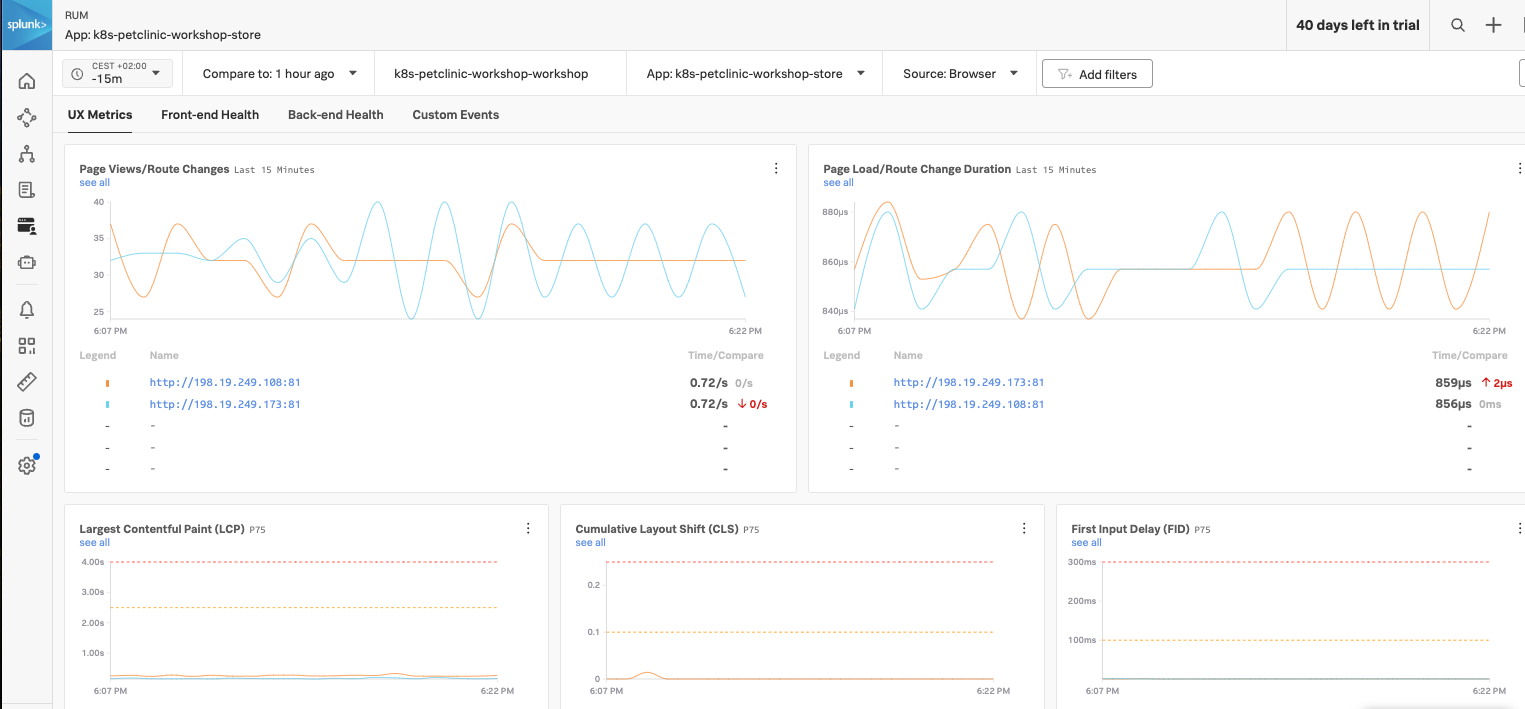
To continue, click on the blue link (with your workshop name) to get to the details page, this will bring up a new dashboard view breaking down the interactions by UX Metrics, Front-end Health, Back-end Health and Custom Events and comparing them to historic metrics (1 hour by default).
Normally you have only one line inside the first chart, Click on the link that relates to your Petclinic shop,
http://198.19.249.62 in our example:
This will bring us to the Tag Spotlight page:
RUM trace Waterfall view & linking to APM
In the TAG Spotlight view, you are presented with all the tags associated with the RUM data. Tags are key-value pairs that are used to identify the data. In this case, the tags are automatically generated by the OpenTelemetry instrumentation. The tags are used to filter the data and to create the charts and tables. The Tag Spotlight view allows you detect trends in behavior and to drill down into a user session.
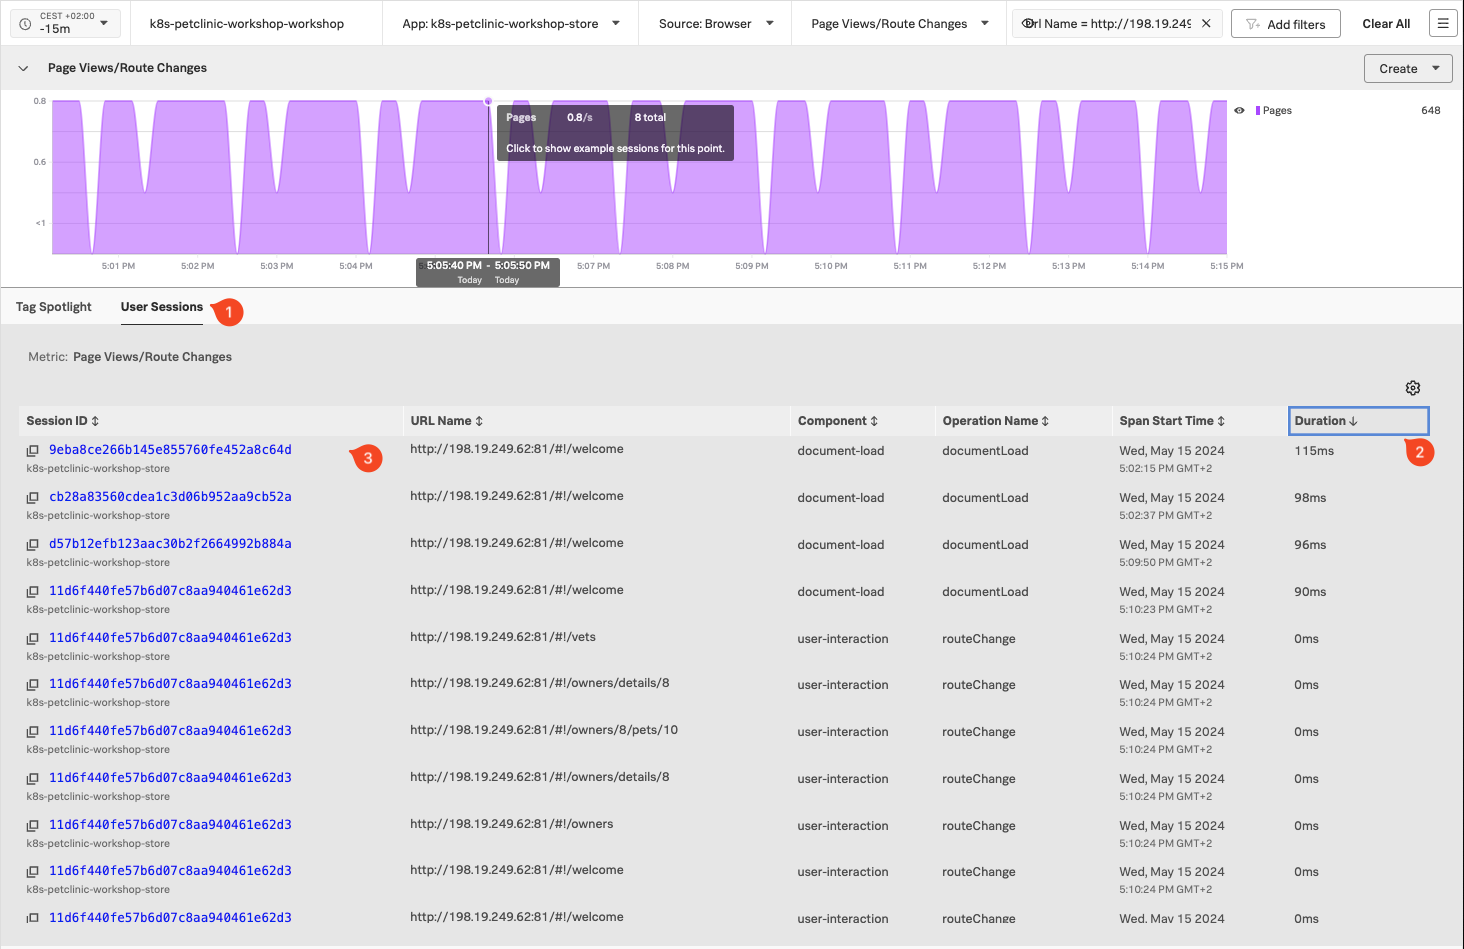
Click on User Sessions (1), this will show you the list of user session that occurred during the time window.
We want to look at one of the session , so click on Duration(2) to sort on duration, and make sure you click on the link of one of the longer ones (3):
RUM trace Waterfall view & linking to APM
We are now looking at the RUM Trace waterfall, this will tell you what happened during the session on the user device as they visited the page of our petclinic application.
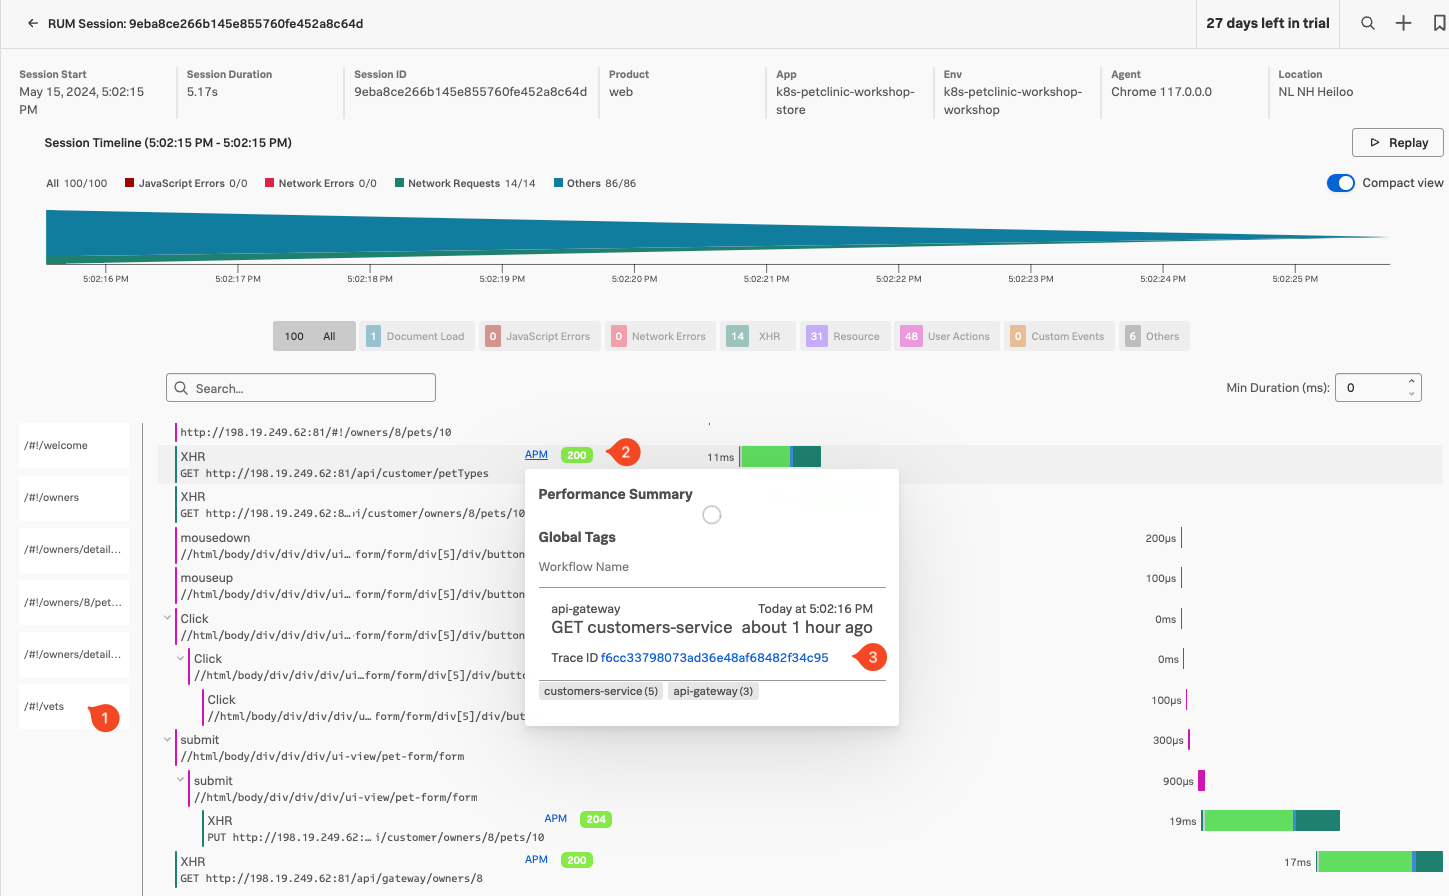
If you scroll down the waterfall find click on the Vets segment on the right (1), you see a list of action that occurred during the handling of the Vets request. Note, that the HTTP request have a blue APM link before the return code. Pick one, and click on the APM link. This will show you the APM info for this Ser vice call to our Microservices in Kubernetes.
Note , that there give you the information what happened during action in the Microservices, and if you want to drill down to verify what happened with the request, click on the Trace ID url.
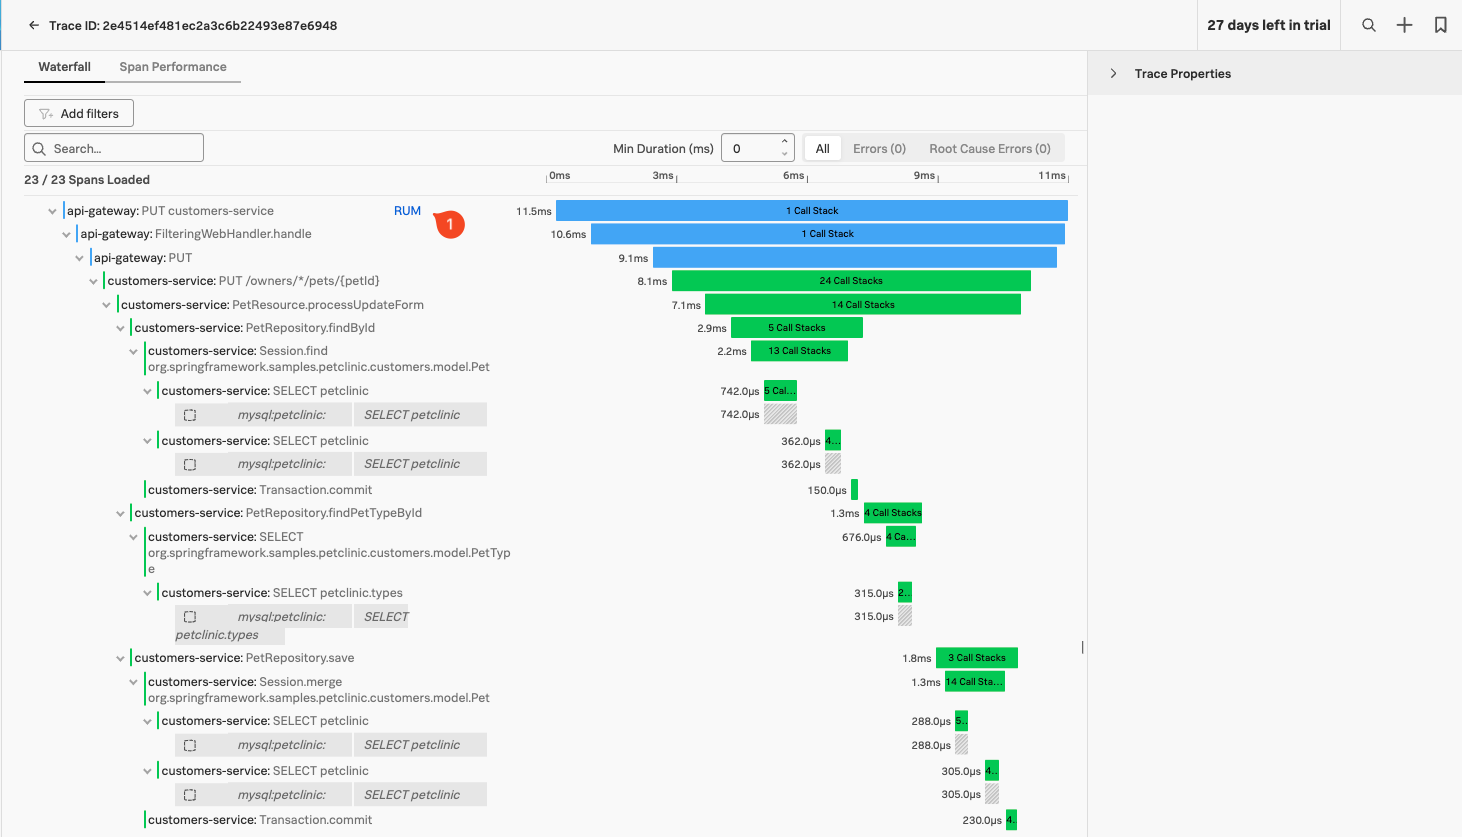
This will show you the trace related to your request from RUM:
You can see that the entry point into your service now has a RUM (1) related content link added, allowing you to return back to your RUM session after you validated what happened in your Microservices.