NodeJS Zero-Config Workshop
30 minutes
Author
Robert CastleyThe goal is to walk through the basic steps to configure the following components of the Splunk Observability Cloud platform:
- Splunk Infrastructure Monitoring (IM)
- Splunk Zero Configuration Auto Instrumentation for NodeJS (APM)
- Splunk Log Observer (LO)
We will deploy the OpenTelemetry Astronomy Shop application in Kubernetes, which contains two NodeJS services (Frontend & Payment Service). Once the application and the OpenTelemetry Connector are up and running, we will start seeing metrics, traces and logs via the Zero Configuration Auto Instrumentation for NodeJS that will be used by the Splunk Observability Cloud platform to provide insights into the application.
Prerequisites
- Outbound SSH access to port
2222. - Outbound HTTP access to port
8083. - Familiarity with the
bash shell and vi/vim editor.
Next, we will deploy the OpenTelemetry Demo.
graph TD
subgraph Service Diagram
accountingservice(Accounting Service):::golang
adservice(Ad Service):::java
cache[(Cache)]
cartservice(Cart Service):::dotnet
checkoutservice(Checkout Service):::golang
currencyservice(Currency Service):::cpp
emailservice(Email Service):::ruby
frauddetectionservice(Fraud Detection Service):::kotlin
frontend(Frontend):::typescript
frontendproxy(Frontend Proxy):::cpp
loadgenerator([Load Generator]):::python
paymentservice(Payment Service):::javascript
productcatalogservice(Product Catalog Service):::golang
quoteservice(Quote Service):::php
recommendationservice(Recommendation Service):::python
shippingservice(Shipping Service):::rust
featureflagservice(Feature Flag Service):::erlang
featureflagstore[(Feature Flag Store)]
queue[(queue)]
Internet -->|HTTP| frontendproxy
frontendproxy -->|HTTP| frontend
frontendproxy -->|HTTP| featureflagservice
loadgenerator -->|HTTP| frontendproxy
accountingservice -->|TCP| queue
cartservice --->|gRPC| featureflagservice
checkoutservice --->|gRPC| cartservice --> cache
checkoutservice --->|gRPC| productcatalogservice
checkoutservice --->|gRPC| currencyservice
checkoutservice --->|HTTP| emailservice
checkoutservice --->|gRPC| paymentservice
checkoutservice -->|gRPC| shippingservice
checkoutservice --->|TCP| queue
frontend -->|gRPC| adservice
frontend -->|gRPC| cartservice
frontend -->|gRPC| productcatalogservice
frontend -->|gRPC| checkoutservice
frontend -->|gRPC| currencyservice
frontend -->|gRPC| recommendationservice -->|gRPC| productcatalogservice
frontend -->|gRPC| shippingservice -->|HTTP| quoteservice
frauddetectionservice -->|TCP| queue
adservice --->|gRPC| featureflagservice
productcatalogservice -->|gRPC| featureflagservice
recommendationservice -->|gRPC| featureflagservice
shippingservice -->|gRPC| featureflagservice
featureflagservice --> featureflagstore
end

classDef dotnet fill:#178600,color:white;
classDef cpp fill:#f34b7d,color:white;
classDef erlang fill:#b83998,color:white;
classDef golang fill:#00add8,color:black;
classDef java fill:#b07219,color:white;
classDef javascript fill:#f1e05a,color:black;
classDef kotlin fill:#560ba1,color:white;
classDef php fill:#4f5d95,color:white;
classDef python fill:#3572A5,color:white;
classDef ruby fill:#701516,color:white;
classDef rust fill:#dea584,color:black;
classDef typescript fill:#e98516,color:black;
graph TD
subgraph Service Legend
  dotnetsvc(.NET):::dotnet
  cppsvc(C++):::cpp
  erlangsvc(Erlang/Elixir):::erlang
  golangsvc(Go):::golang
  javasvc(Java):::java
  javascriptsvc(JavaScript):::javascript
  kotlinsvc(Kotlin):::kotlin
  phpsvc(PHP):::php
  pythonsvc(Python):::python
  rubysvc(Ruby):::ruby
  rustsvc(Rust):::rust
  typescriptsvc(TypeScript):::typescript
end

classDef dotnet fill:#178600,color:white;
classDef cpp fill:#f34b7d,color:white;
classDef erlang fill:#b83998,color:white;
classDef golang fill:#00add8,color:black;
classDef java fill:#b07219,color:white;
classDef javascript fill:#f1e05a,color:black;
classDef kotlin fill:#560ba1,color:white;
classDef php fill:#4f5d95,color:white;
classDef python fill:#3572A5,color:white;
classDef ruby fill:#701516,color:white;
classDef rust fill:#dea584,color:black;
classDef typescript fill:#e98516,color:black;
Subsections of NodeJS Zero-Config Workshop
Deploying the OpenTelemetry Demo
1. Create a namespace
To not conflict with other workshops, we will deploy the OpenTelemetry Demo in a separate namespace called otel-demo. To create the namespace, run the following command:
kubectl create namespace otel-demo
2. Deploy the OpenTelemetry Demo
Next, change to the directory containing the OpenTelemetry Demo application:
Deploy the OpenTelemetry Demo application:
kubectl apply -n otel-demo -f otel-demo.yaml
serviceaccount/opentelemetry-demo created
service/opentelemetry-demo-adservice created
service/opentelemetry-demo-cartservice created
service/opentelemetry-demo-checkoutservice created
service/opentelemetry-demo-currencyservice created
service/opentelemetry-demo-emailservice created
service/opentelemetry-demo-featureflagservice created
service/opentelemetry-demo-ffspostgres created
service/opentelemetry-demo-frontend created
service/opentelemetry-demo-kafka created
service/opentelemetry-demo-loadgenerator created
service/opentelemetry-demo-paymentservice created
service/opentelemetry-demo-productcatalogservice created
service/opentelemetry-demo-quoteservice created
service/opentelemetry-demo-recommendationservice created
service/opentelemetry-demo-redis created
service/opentelemetry-demo-shippingservice created
deployment.apps/opentelemetry-demo-accountingservice created
deployment.apps/opentelemetry-demo-adservice created
deployment.apps/opentelemetry-demo-cartservice created
deployment.apps/opentelemetry-demo-checkoutservice created
deployment.apps/opentelemetry-demo-currencyservice created
deployment.apps/opentelemetry-demo-emailservice created
deployment.apps/opentelemetry-demo-featureflagservice created
deployment.apps/opentelemetry-demo-ffspostgres created
deployment.apps/opentelemetry-demo-frauddetectionservice created
deployment.apps/opentelemetry-demo-frontend created
deployment.apps/opentelemetry-demo-kafka created
deployment.apps/opentelemetry-demo-loadgenerator created
deployment.apps/opentelemetry-demo-paymentservice created
deployment.apps/opentelemetry-demo-productcatalogservice created
deployment.apps/opentelemetry-demo-quoteservice created
deployment.apps/opentelemetry-demo-recommendationservice created
deployment.apps/opentelemetry-demo-redis created
deployment.apps/opentelemetry-demo-shippingservice created
Once the application is deployed, we need to wait for the pods to be in a Running state. To check the status of the pods, run the following command:
kubectl get pods -n otel-demo
NAME                                                        READY   STATUS    RESTARTS   AGE
opentelemetry-demo-emailservice-847d6fb577-bxll6            1/1     Running   0          40s
opentelemetry-demo-ffspostgres-55f65465dd-2gsj4             1/1     Running   0          40s
opentelemetry-demo-adservice-5b7c68859d-5hx5f               1/1     Running   0          40s
opentelemetry-demo-currencyservice-c4cb78446-qsd68          1/1     Running   0          40s
opentelemetry-demo-frontend-5d7cdb8786-5dl76                1/1     Running   0          39s
opentelemetry-demo-kafka-79868d56d8-62wsd                   1/1     Running   0          39s
opentelemetry-demo-paymentservice-5cb4ccc47c-65hxl          1/1     Running   0          39s
opentelemetry-demo-productcatalogservice-59d955f9d6-xtnjr   1/1     Running   0          38s
opentelemetry-demo-loadgenerator-755d6cd5b-r5lqs            1/1     Running   0          39s
opentelemetry-demo-quoteservice-5fbfb97778-vm62m            1/1     Running   0          38s
opentelemetry-demo-redis-57c49b7b5b-b2klr                   1/1     Running   0          37s
opentelemetry-demo-shippingservice-6667f69f78-cwj8q         1/1     Running   0          37s
opentelemetry-demo-recommendationservice-749f55f9b6-5k4lc   1/1     Running   0          37s
opentelemetry-demo-featureflagservice-67677647c-85xtm       1/1     Running   0          40s
opentelemetry-demo-checkoutservice-5474bf74b8-2nmns         1/1     Running   0          40s
opentelemetry-demo-frauddetectionservice-77fd69d967-lnjcg   1/1     Running   0          39s
opentelemetry-demo-accountingservice-96d44cfbc-vmtzb        1/1     Running   0          40s
opentelemetry-demo-cartservice-7c4f59bdd5-rfkf4             1/1     Running   0          40s
3. Validate the application is running
To validate the application is running, we will port-forward the frontend service. To do this, run the following command:
kubectl port-forward svc/opentelemetry-demo-frontend 8083:8080 -n otel-demo --address='0.0.0.0'
Obtain the public IP address of the instance you are running on. You can do this by running the following command:
Once the port-forward is running, you can access the application by opening a browser and navigating to http://<public IP address>:8083. You should see the following:
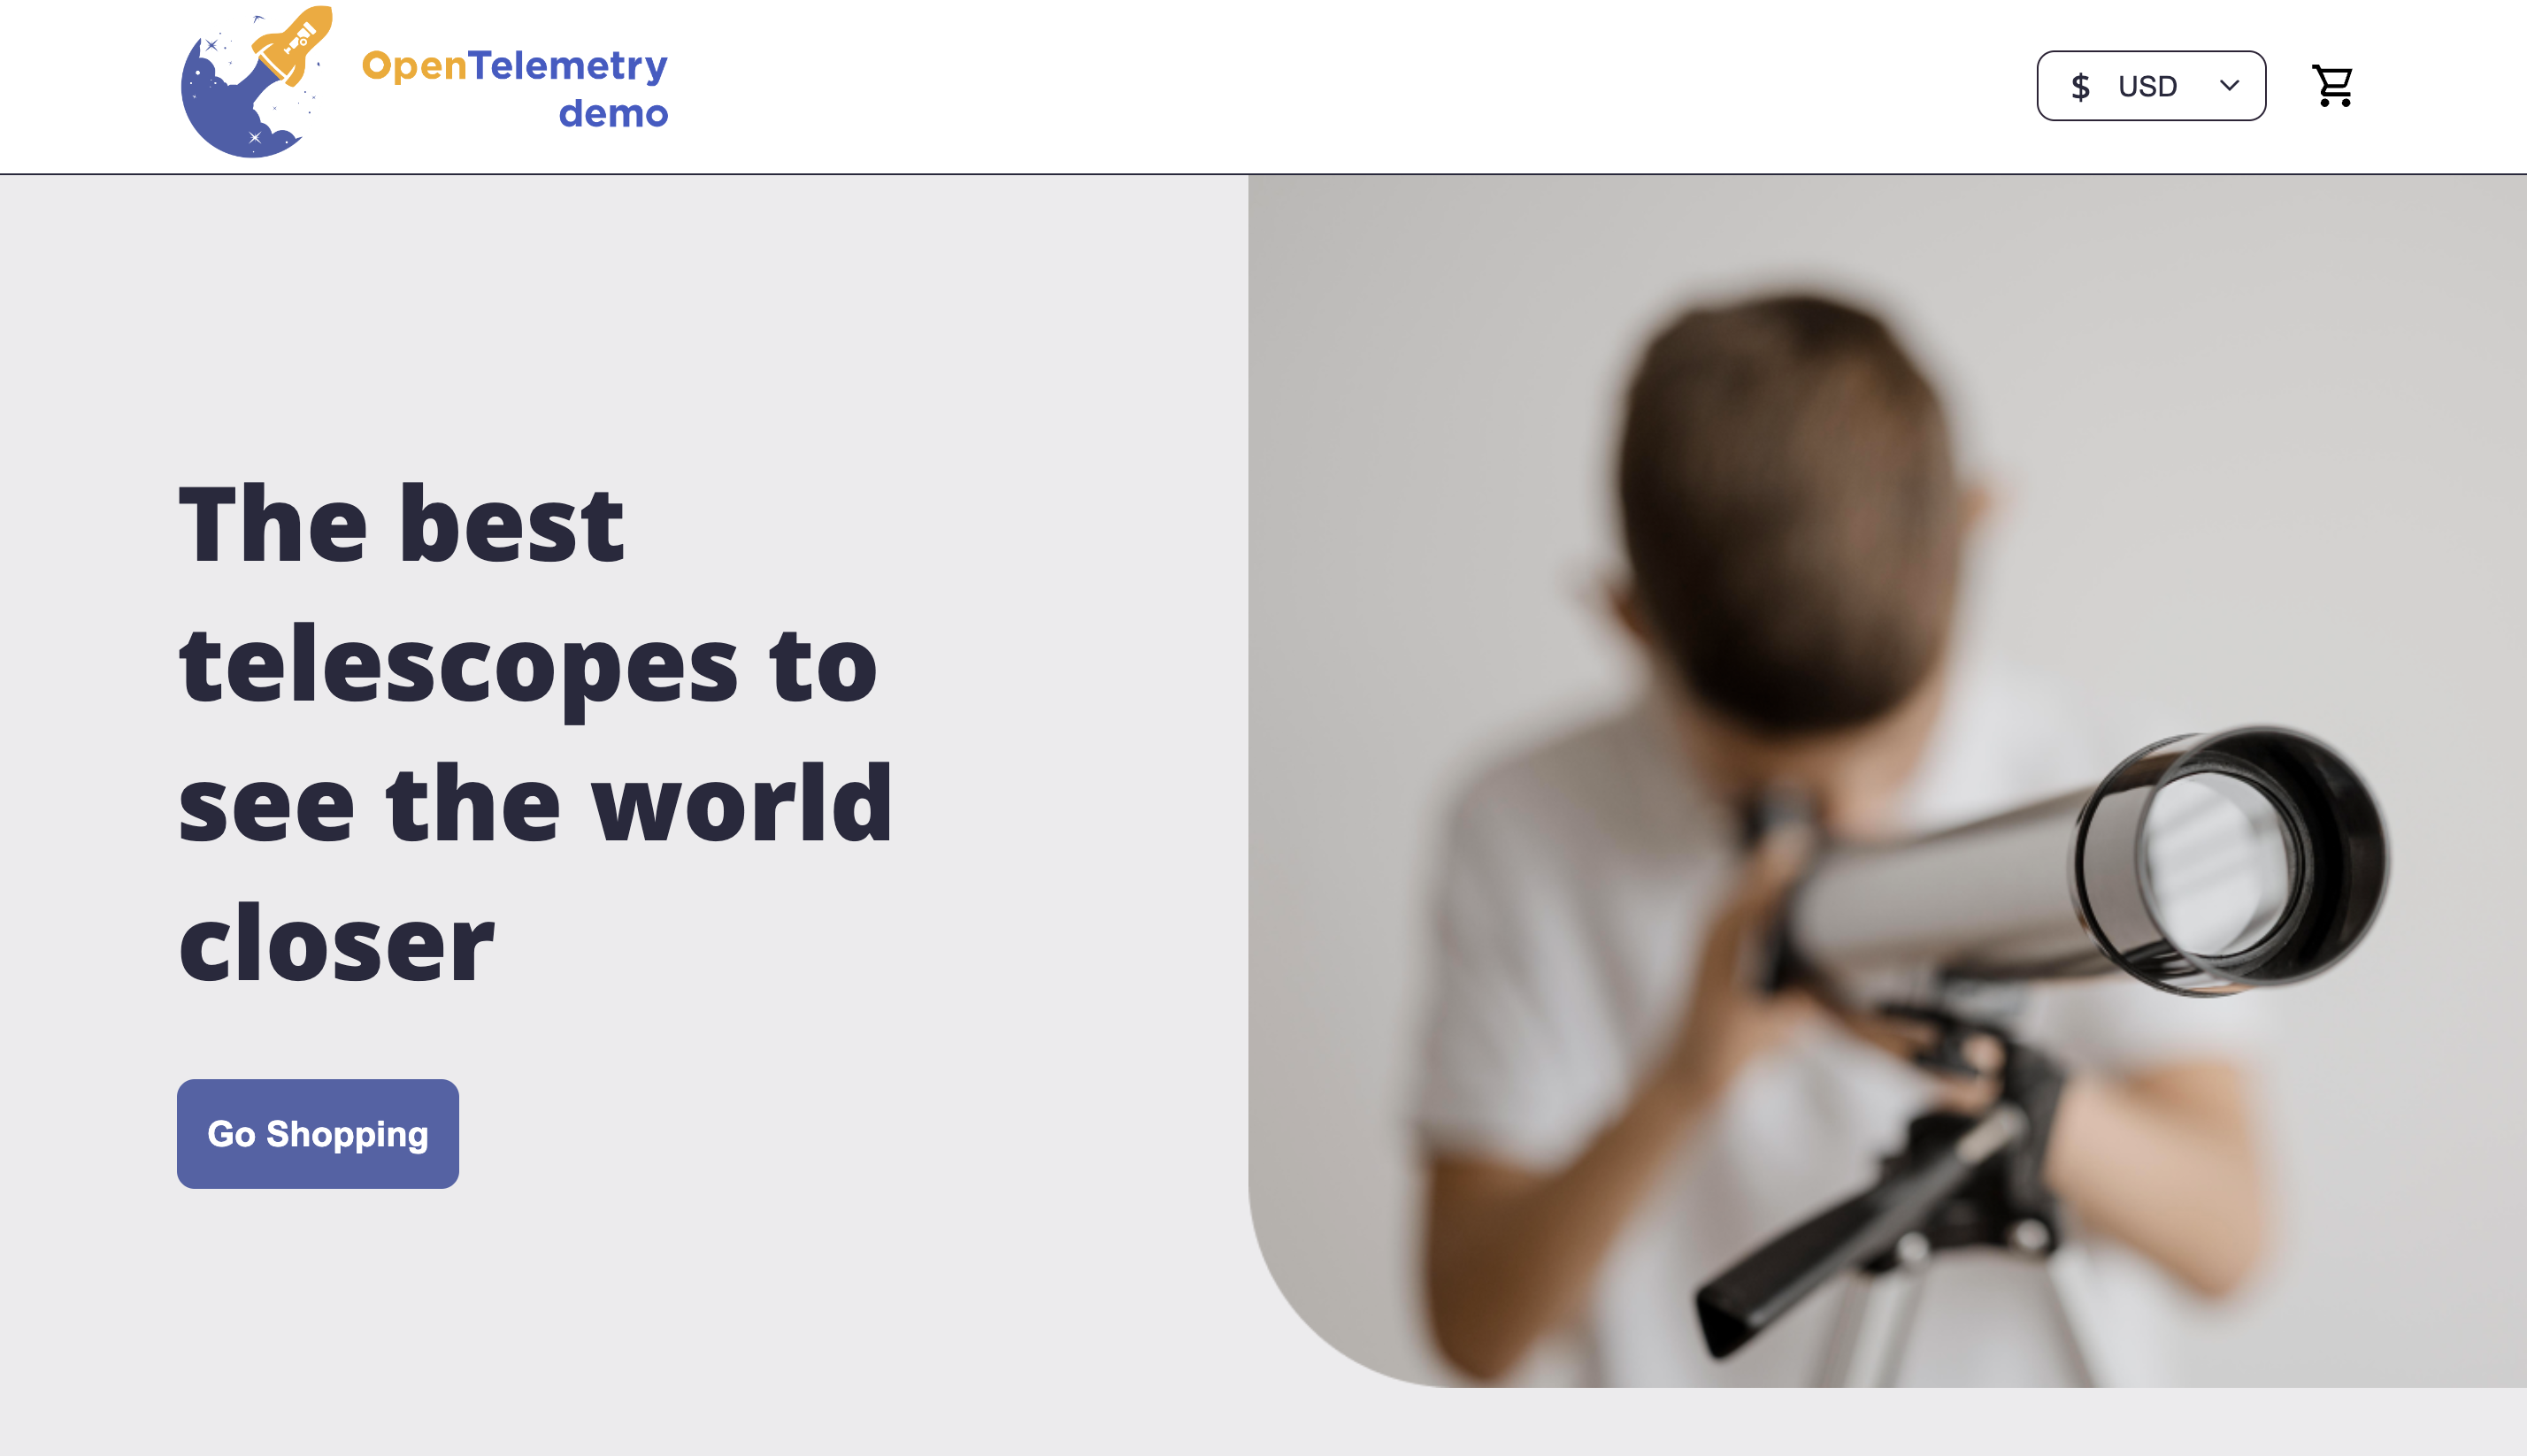
Once you have confirmed the application is running, you can close the port-forward by pressing ctrl + c.
Next, we will deploy the OpenTelemetry Collector.
Installing the OpenTelemetry Collector
1. Introduction
Delete any existing OpenTelemetry Collectors
If you have completed any other Observability workshops, please ensure you delete the collector running in Kubernetes before continuing. This can be done by running the following command:
helm delete splunk-otel-collector
2. Confirm environment variables
To ensure your instance is configured correctly, we need to confirm that the required environment variables for this workshop are set correctly. In your terminal run the following command:
In the output check the following environment variables are present and have values set:
ACCESS_TOKEN
REALM
RUM_TOKEN
HEC_TOKEN
HEC_URL
For this workshop, all of the above are required. If any are missing, please contact your instructor.
3. Install the OpenTelemetry Collector
We can then go ahead and install the Collector. Some additional parameters are passed to the helm install command, they are:
--set="operator.enabled=true" - Enabled the Splunk OpenTelemetry Collector Operator for Kubernetes.--set="certmanager.enabled=true" - The cert-manager adds certificates and certificate issuers as resource types in Kubernetes clusters and simplifies the process of obtaining, renewing and using those certificates.--set="splunkObservability.profilingEnabled=true" - Enables CPU/Memory profiling for supported languages.
helm repo add splunk-otel-collector-chart https://signalfx.github.io/splunk-otel-collector-chart && helm repo update
helm install splunk-otel-collector \
--set="operator.enabled=true", \
--set="certmanager.enabled=true", \
--set="splunkObservability.realm=$REALM" \
--set="splunkObservability.accessToken=$ACCESS_TOKEN" \
--set="clusterName=$INSTANCE-k3s-cluster" \
--set="splunkObservability.logsEnabled=false" \
--set="logsEngine=otel" \
--set="splunkObservability.profilingEnabled=true" \
--set="splunkObservability.infrastructureMonitoringEventsEnabled=true" \
--set="environment=$INSTANCE-workshop" \
--set="splunkPlatform.endpoint=$HEC_URL" \
--set="splunkPlatform.token=$HEC_TOKEN" \
--set="splunkPlatform.index=splunk4rookies-workshop" \
splunk-otel-collector-chart/splunk-otel-collector \
-f ~/workshop/k3s/otel-collector.yaml
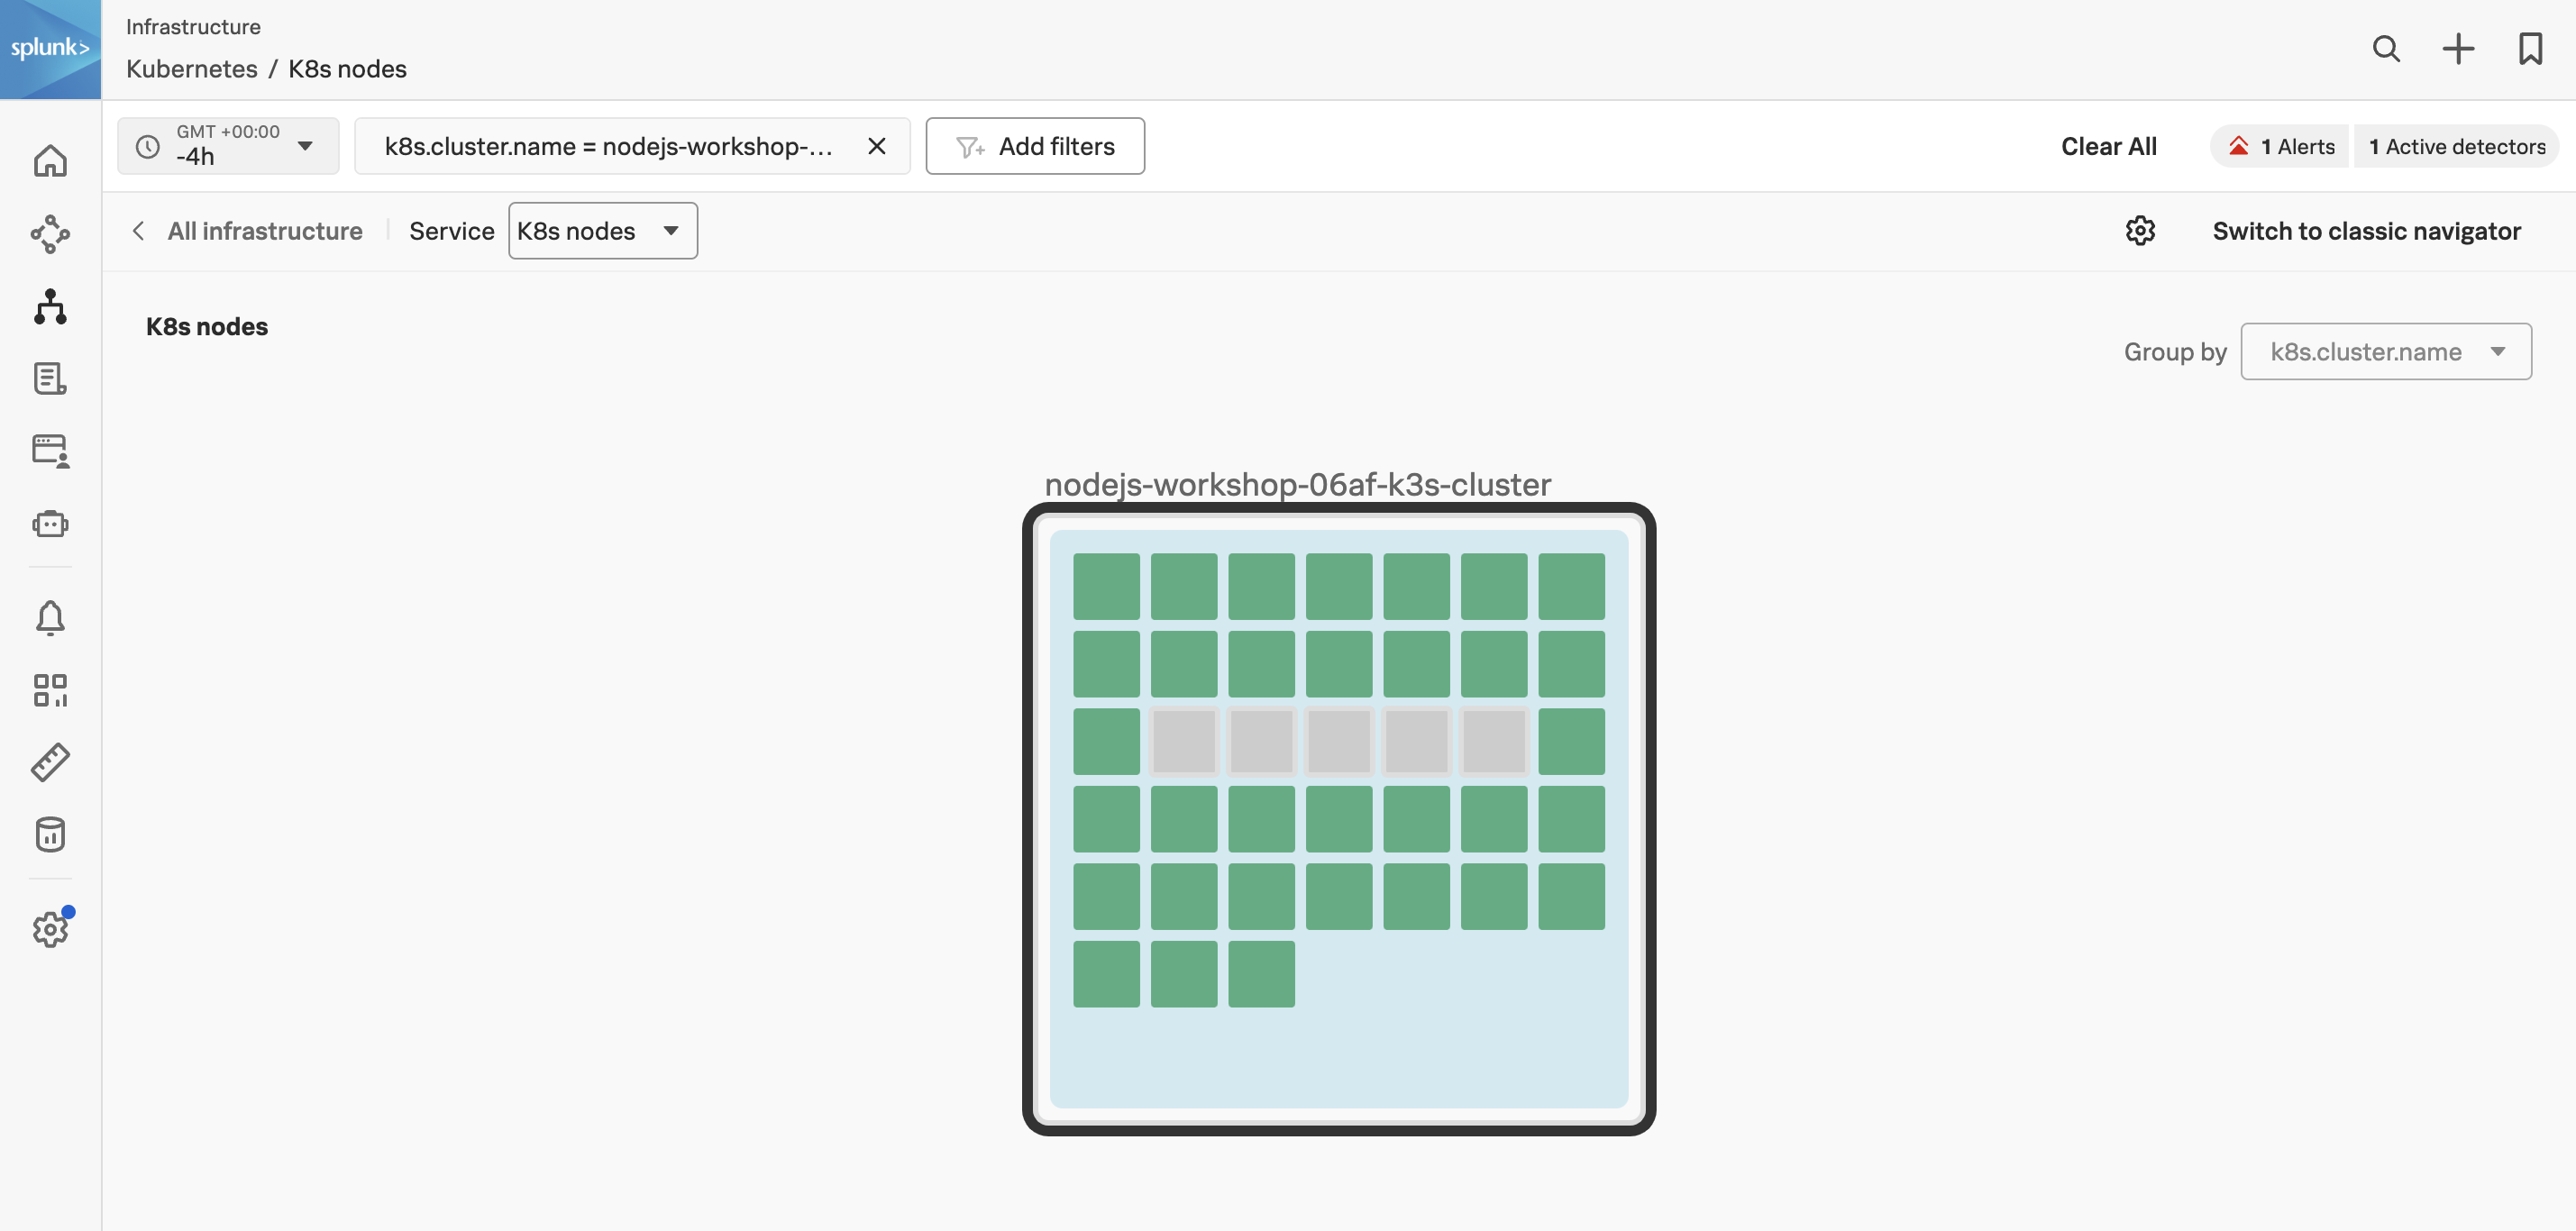
Once the installation is completed, you can navigate to the Kubernetes Navigator to see the data from your host.
Click on Add filters select k8s.cluster.name and select the cluster of your workshop instance.
You can determine your instance name from the command prompt in your terminal session:
Once you see data flowing for your host, we are then ready to get started with the APM component.
Zero Configuration - Frontend Service
1. Patching the Frontend service
First, confirm that you can see your environment in APM. There should be a service called loadgenerator displayed in the Service map.
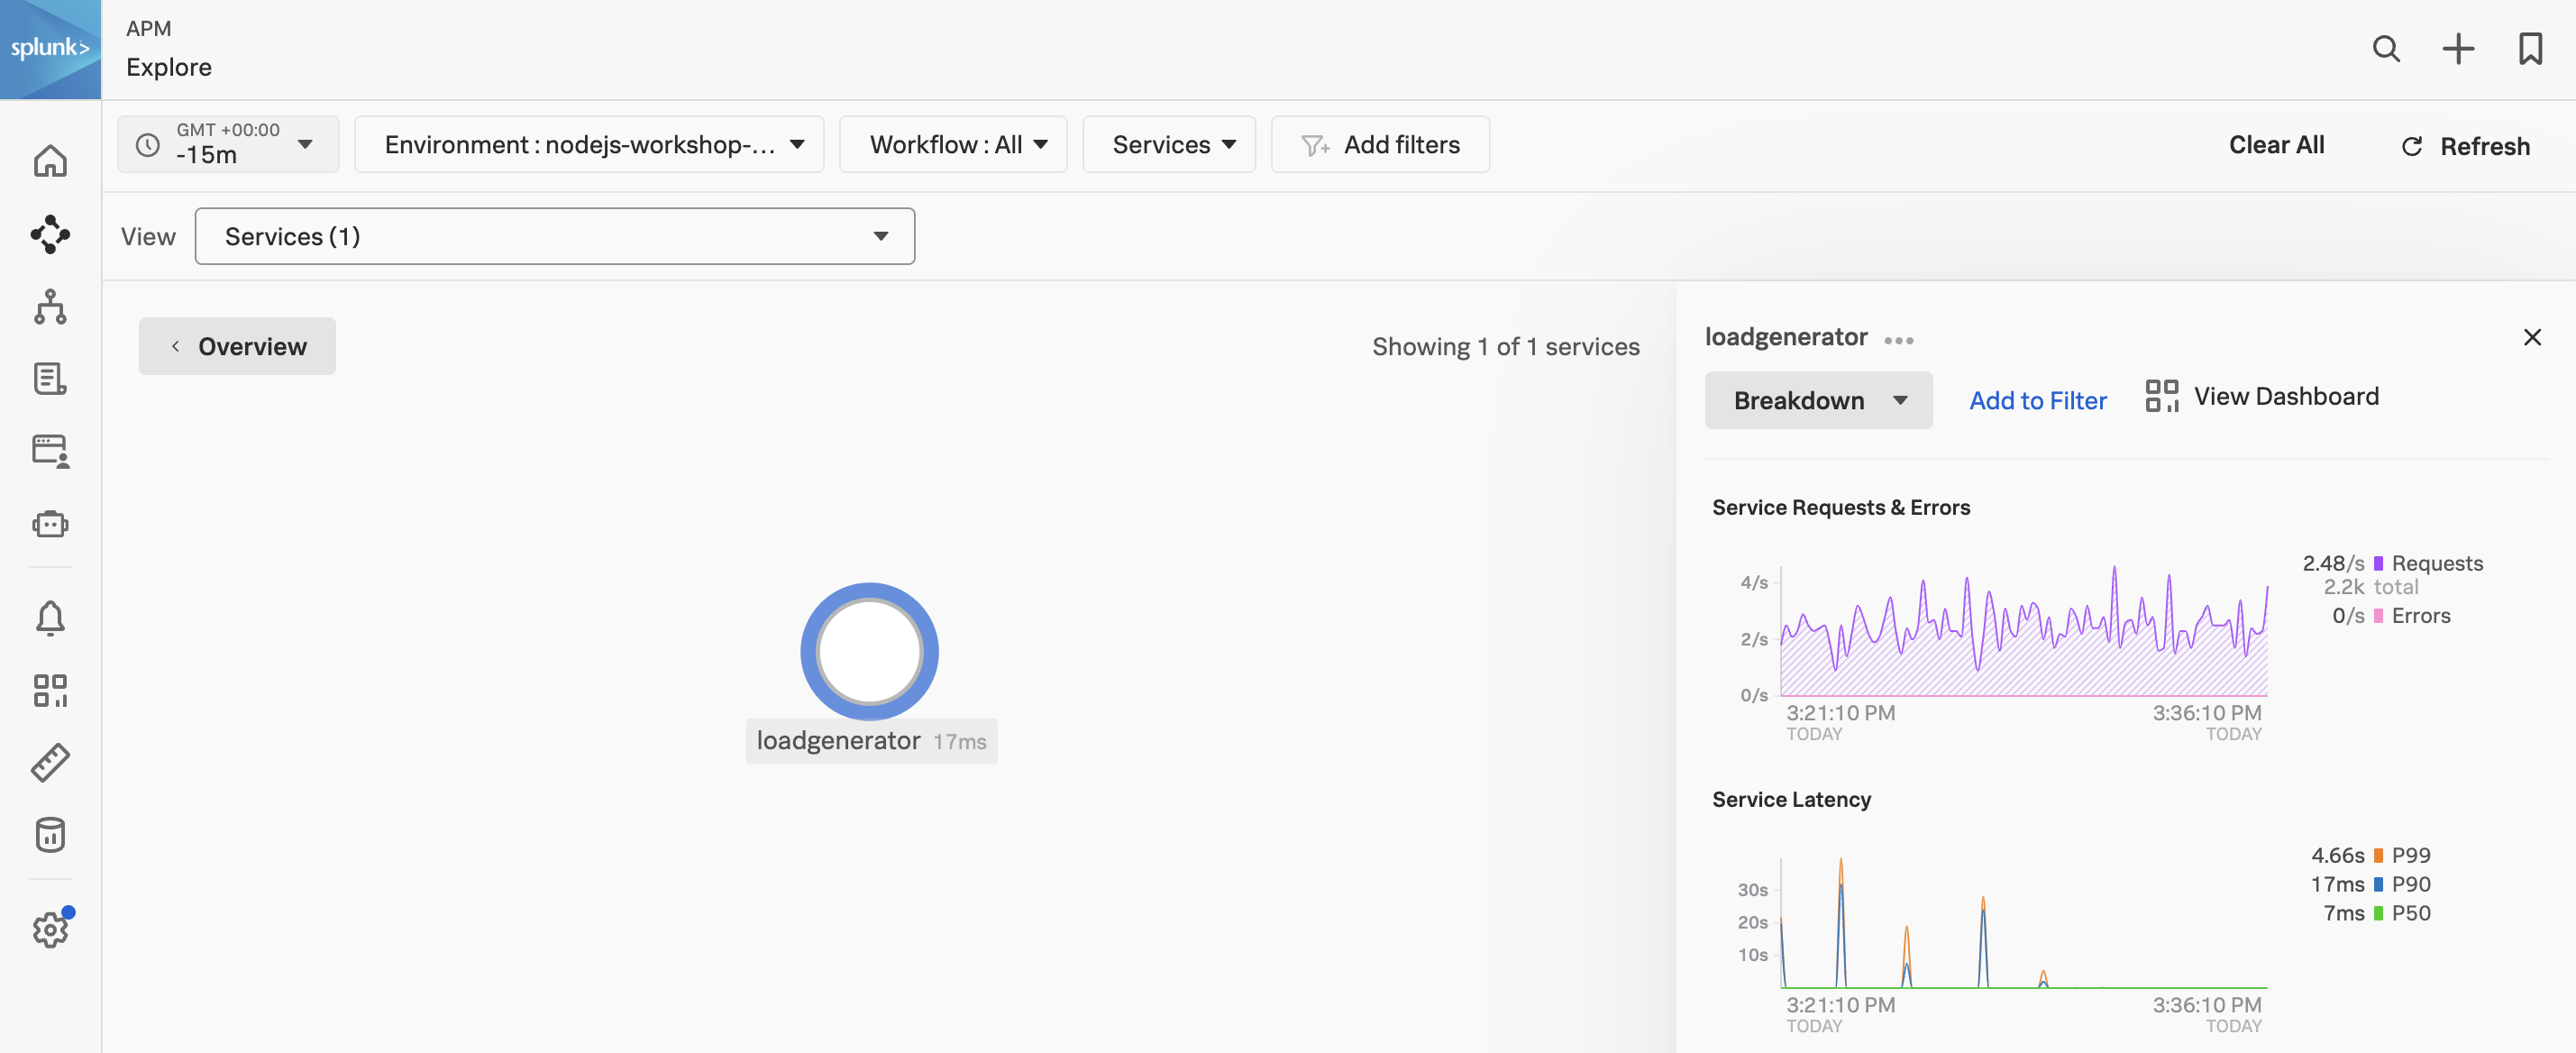
Next, we will patch the frontend deployment with an annotation to inject the NodeJS auto instrumentation. This will allow us to see the frontend service in APM. Note, that at this point we have not edited any code.
kubectl patch deployment opentelemetry-demo-frontend -n otel-demo -p '{"spec": {"template":{"metadata":{"annotations":{"instrumentation.opentelemetry.io/inject-nodejs":"default/splunk-otel-collector"}}}} }'
- This will cause the
opentelemetry-demo-frontend pod to restart. - The annotation value
default/splunk-otel-collector refers to the instrumentation configuration named splunk-otel-collector in the default namespace. - If the chart is not installed in the
default namespace, modify the annotation value to be {chart_namespace}/splunk-otel-collector.
After a few minutes, you should see the frontend service in APM.
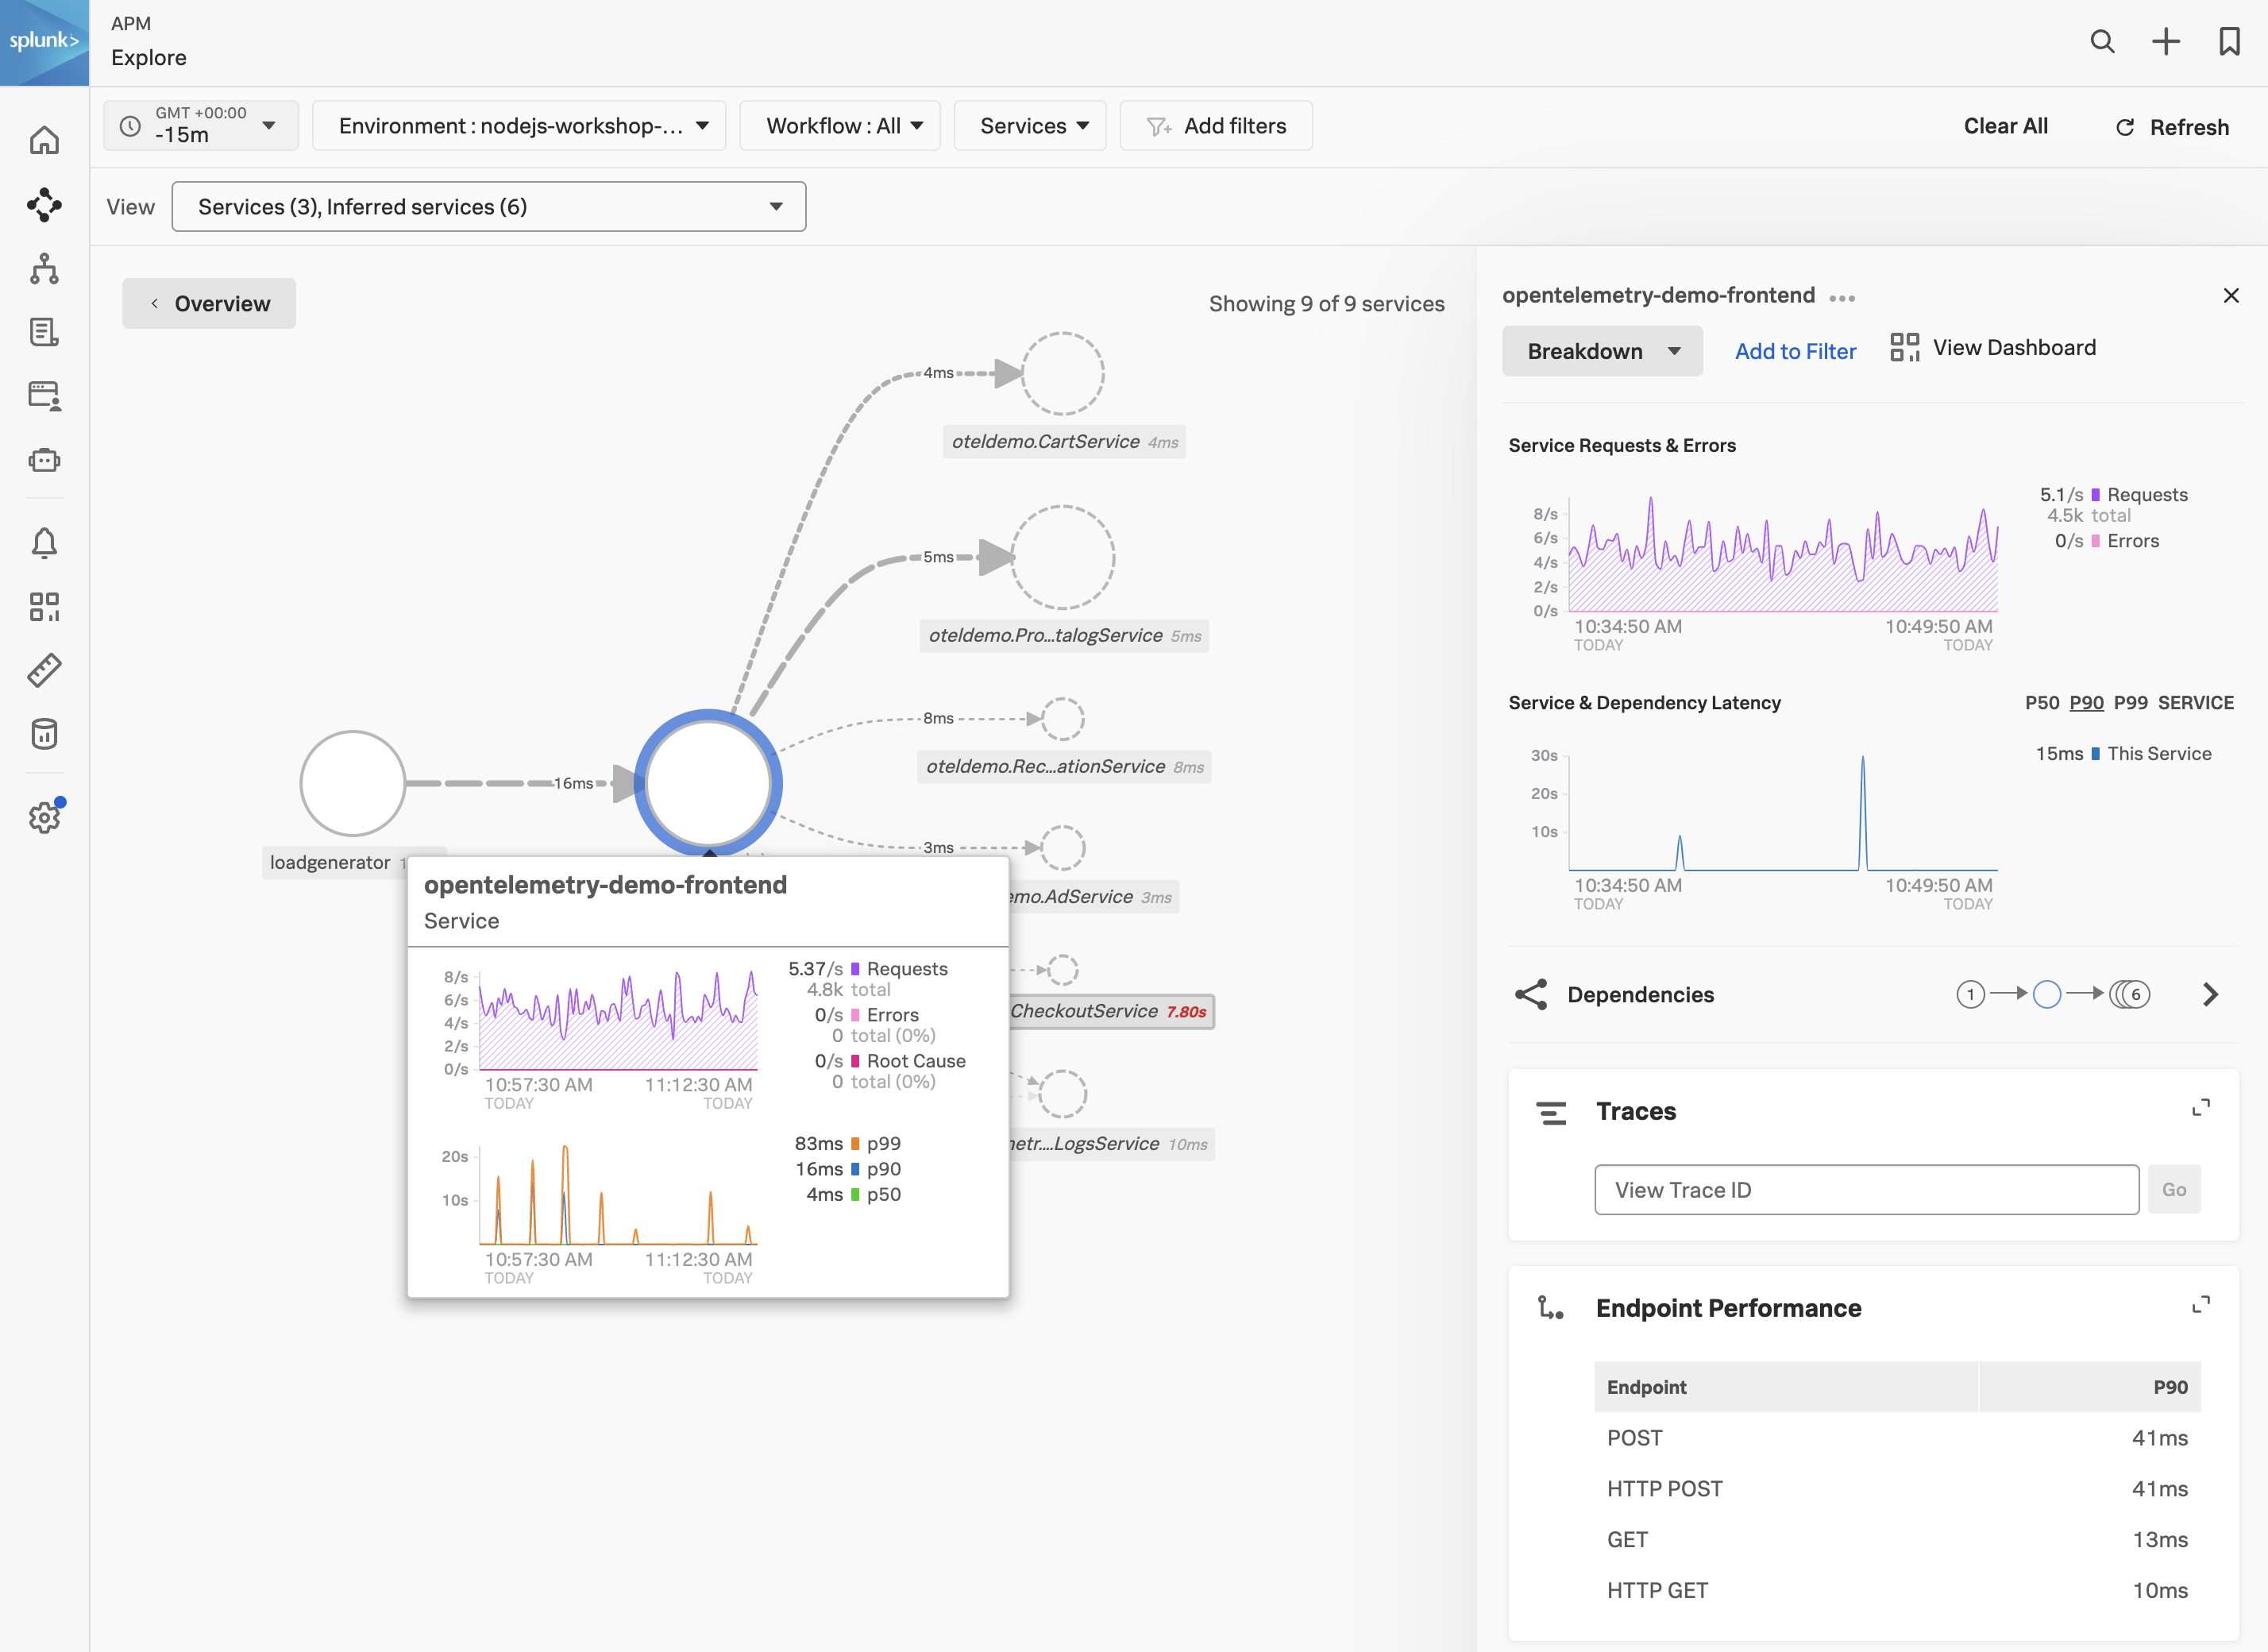
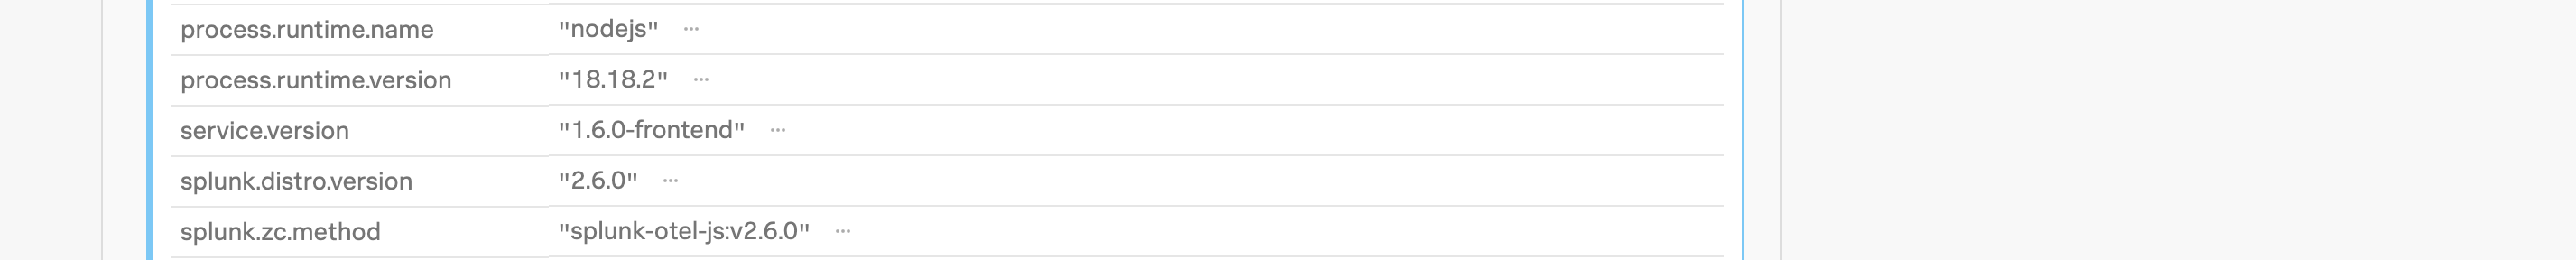
With the frontend service highlighted, click on the Traces tab to see the traces for the service. Select one of the traces and confirm that the trace contains metadata confirming that the Splunk Zero-Configuration Auto-Instrumentation for NodeJS is being used.
Zero Configuration - Payment Service
1. Patching the Payment Service
Finally, we will patch the paymentservice deployment with an annotation to inject the NodeJS auto instrumentation. This will allow us to see the paymentservice service in APM.
kubectl patch deployment opentelemetry-demo-paymentservice -n otel-demo -p '{"spec": {"template":{"metadata":{"annotations":{"instrumentation.opentelemetry.io/inject-nodejs":"default/splunk-otel-collector"}}}} }'
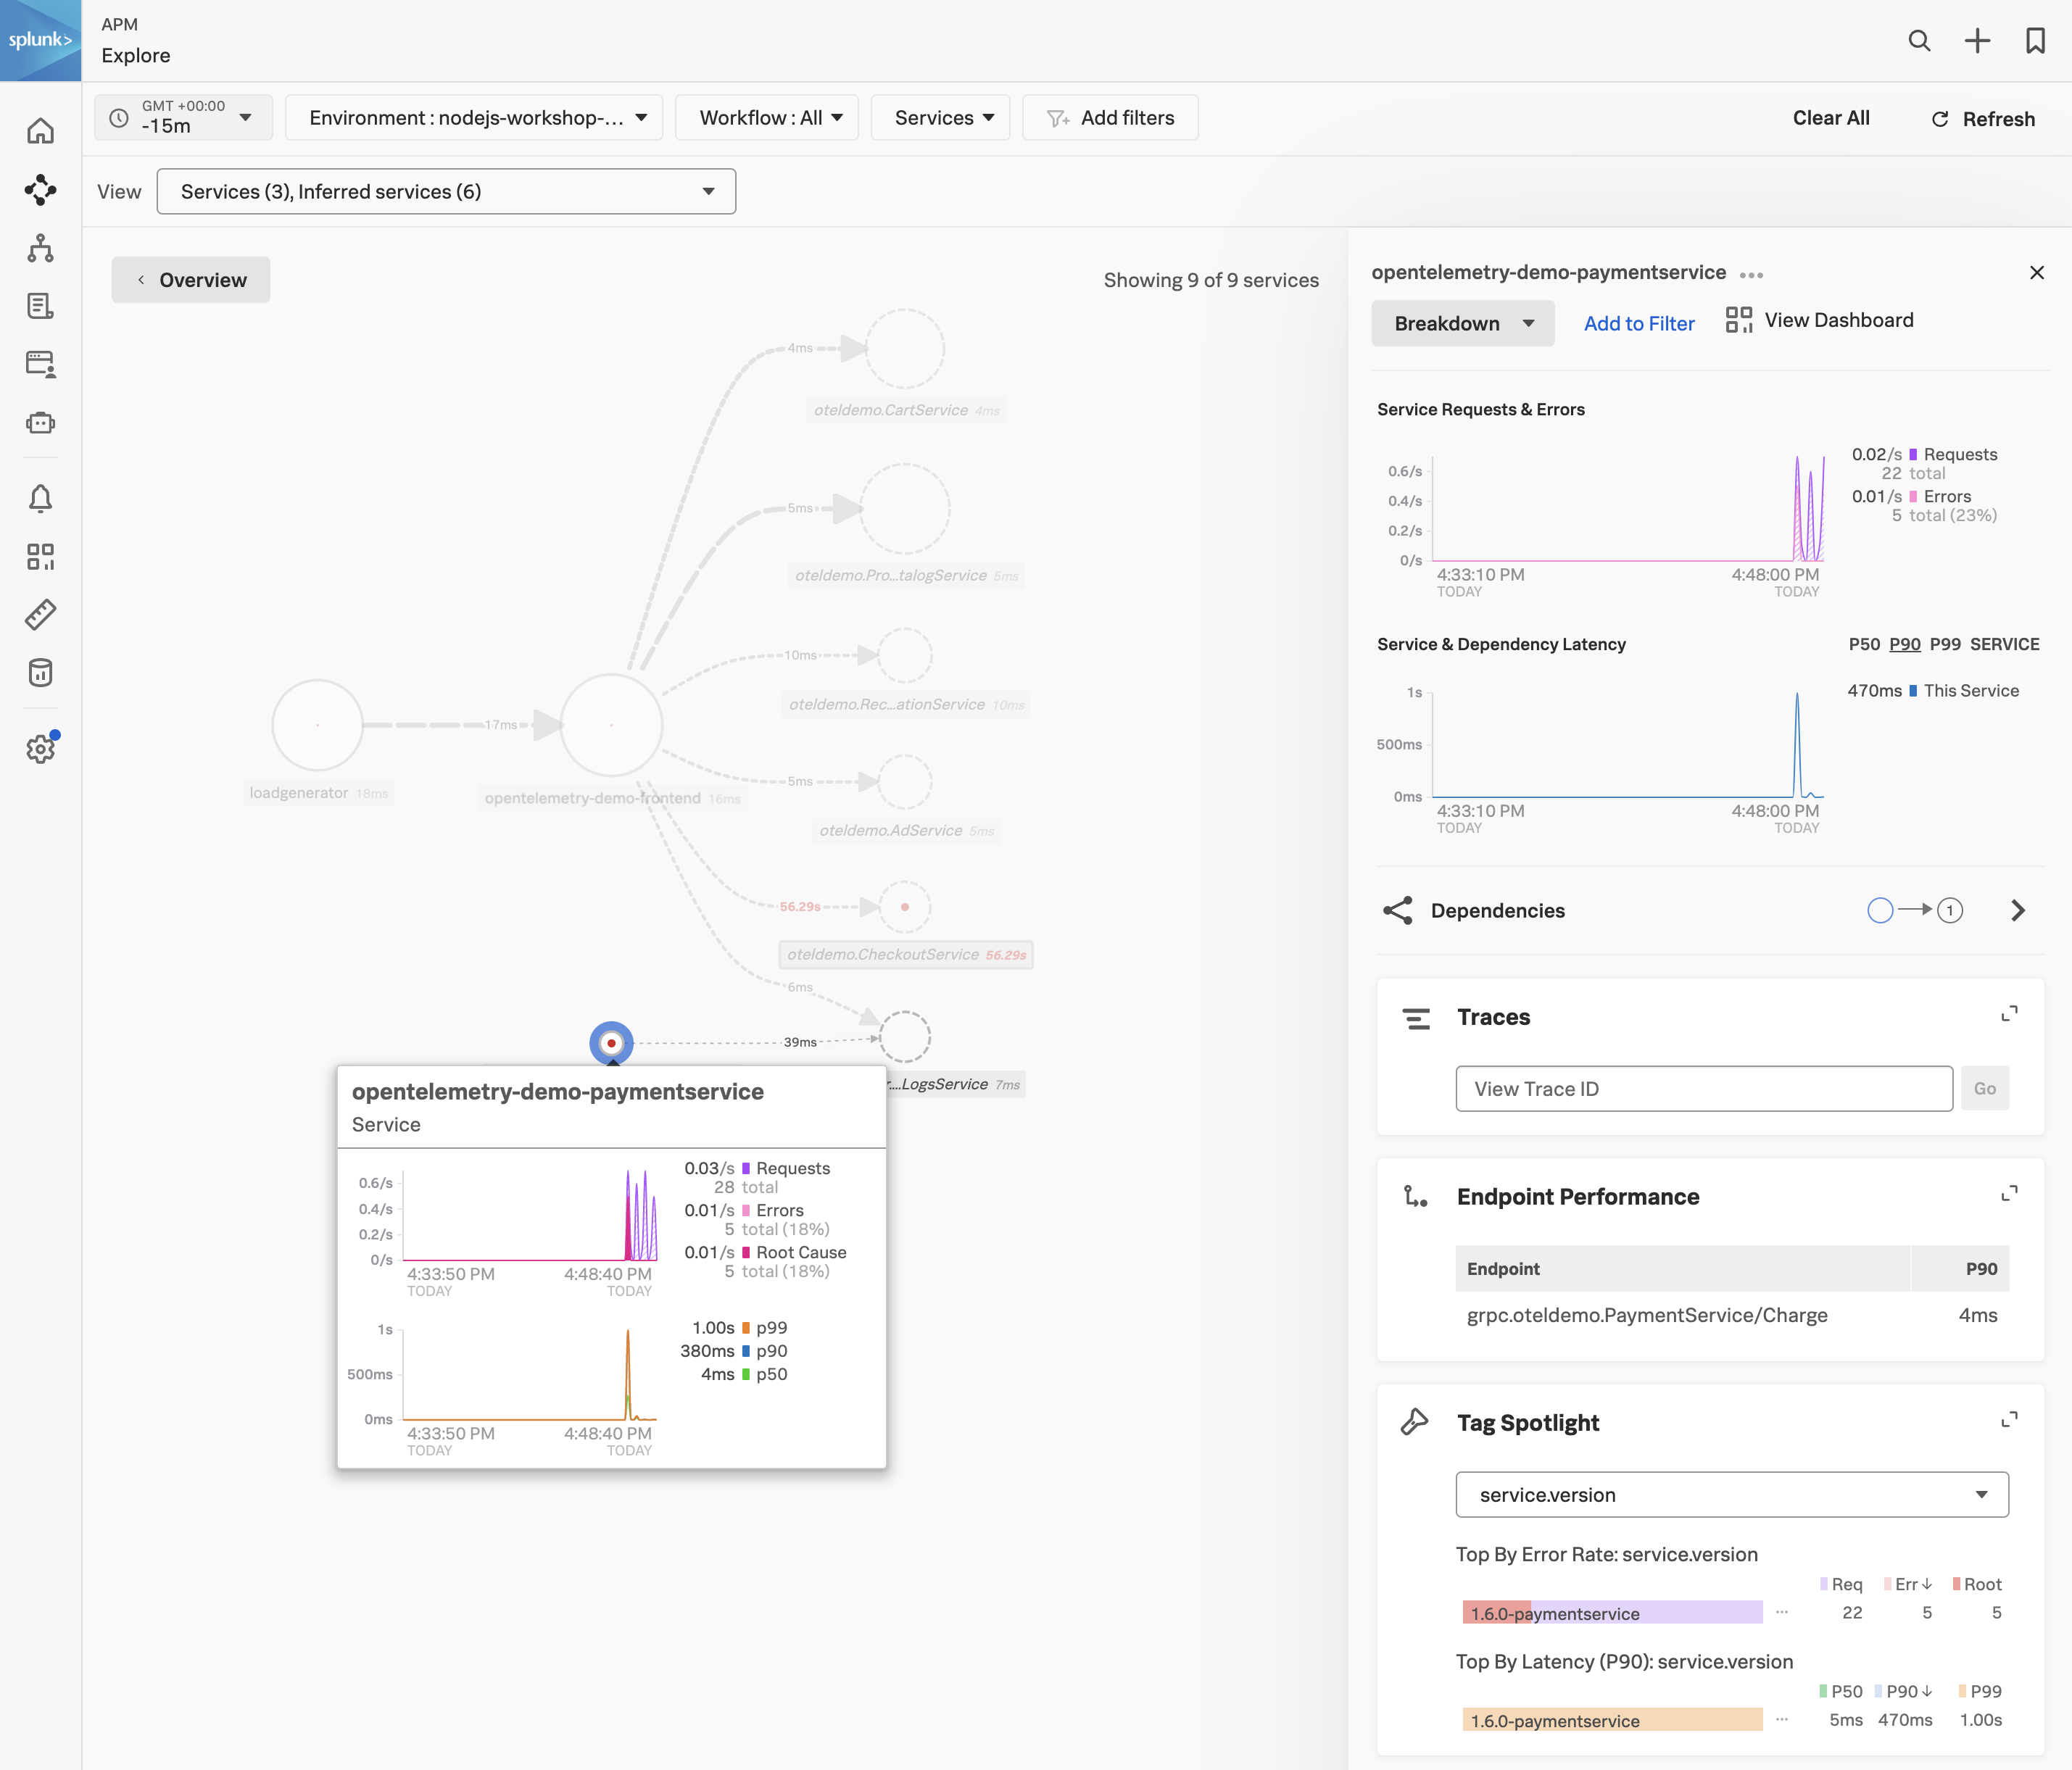
This will cause the opentelemetry-demo-paymentservice pod to restart and after a few minutes, you should see the paymentservice service in APM.
Code Profiling - Payment Service
1. AlwaysOn Profiling for the Payment Service
AlwaysOn Profiling is a feature of the Splunk Distribution of OpenTelemetry Collector that allows you to collect CPU and Memory profiling data for your services without having to modify your code. This is useful for troubleshooting performance issues in your services. Here are some of the benefits of AlwaysOn Profiling:
- Perform continuous profiling of your applications. The profiler is always on once you activate it.
- Collect code performance context and link it to trace data.
- Explore memory usage and garbage collection of your application.
- Analyze code bottlenecks that impact service performance.
- Identify inefficiencies that increase the need for scaling up cloud resources.
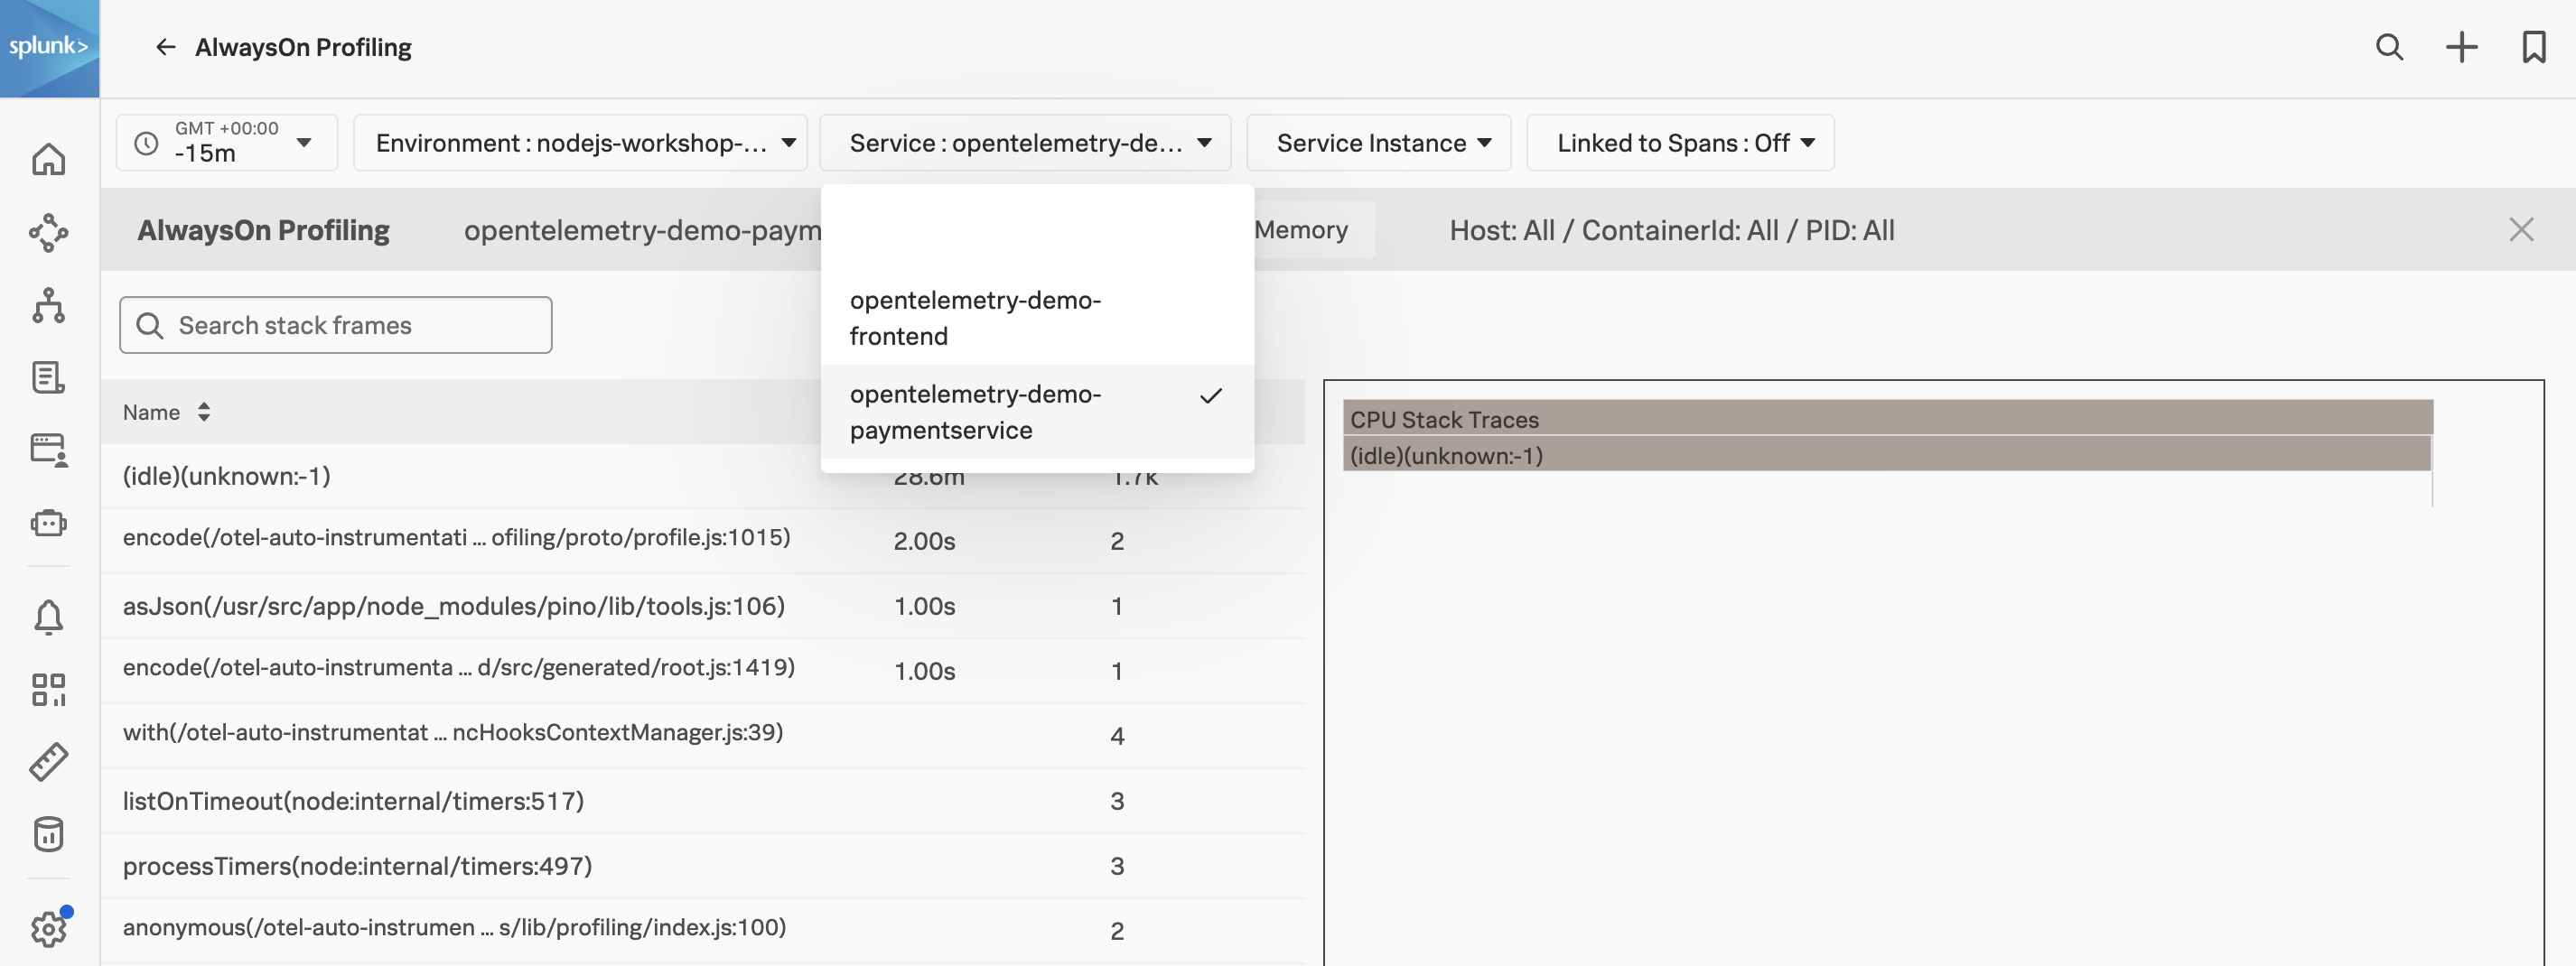
With the opentelemetry-demo-paymentservice selected, click on AlwaysOn Profiling to view the code profiling data for the service.
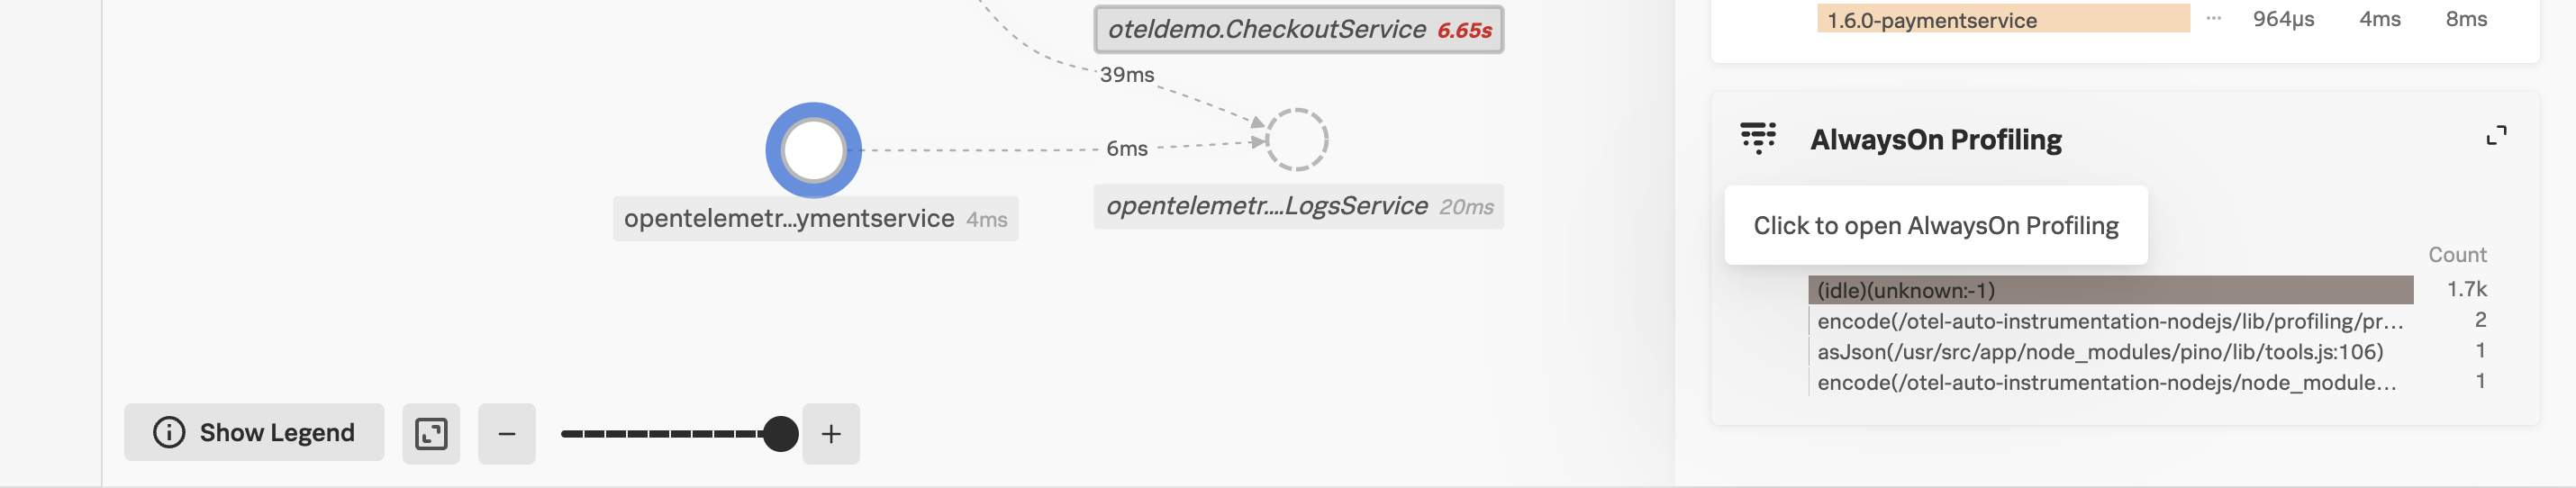
Here you can see the CPU and Memory profiling data for the paymentservice service. You can also see the CPU and Memory profiling data for the frontend service by selecting the opentelemetry-demofrontend service from the Service dropdown.
Logs - Payment Service
1. Viewing the logs for the Payment Service
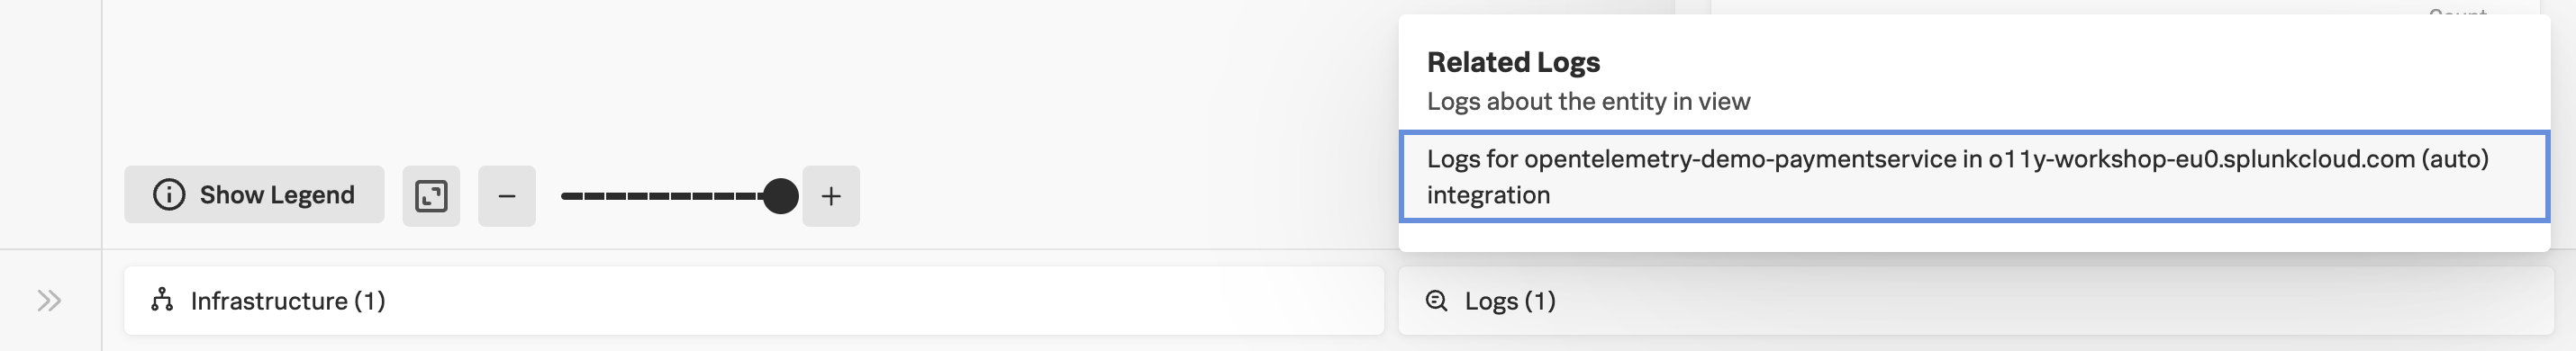
Navigate back to APM from the main menu and under Services click on opentelemetry-demo-paymentservice. This will open up the Service map for the paymentservice service only.
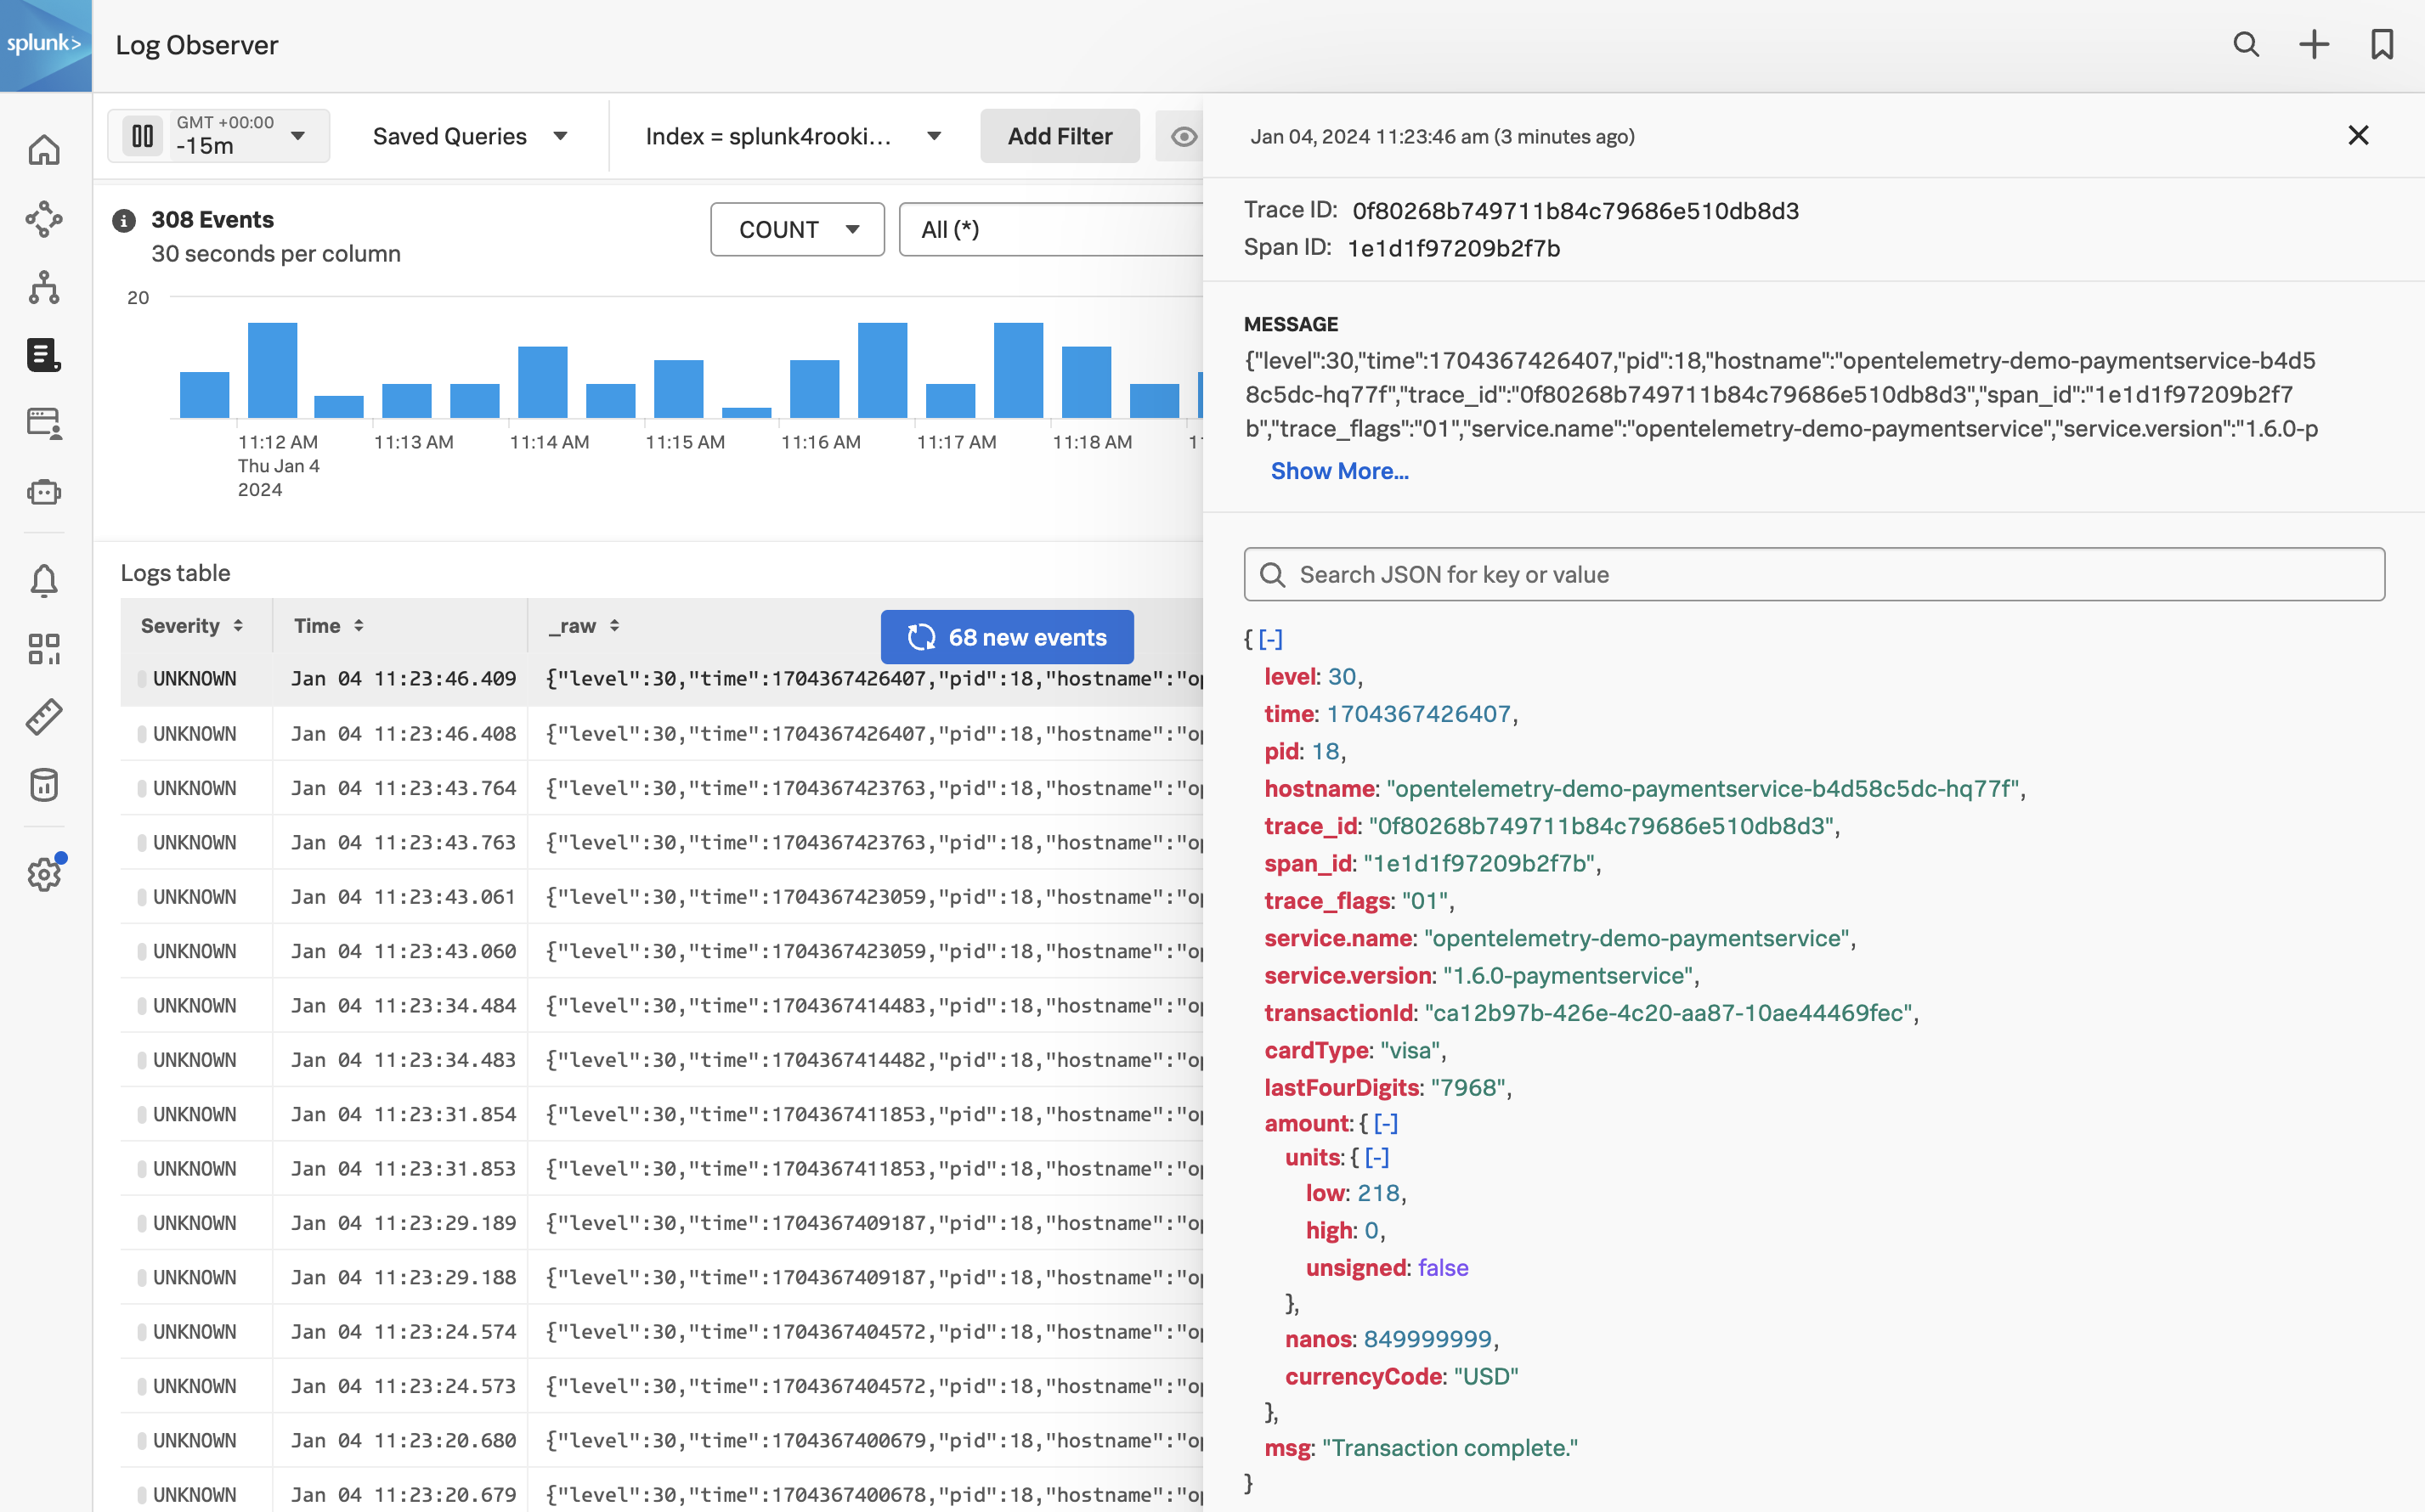
At the bottom of the page, click on the Logs(1) tab to view the logs for the paymentservice service.
Once in Log Observer select one of the log entries to view the metadata for the log entry.