Learn how to enable automatic discovery and configuration for your Java-based application running in Kubernetes. Experience real-time monitoring to help you maximize application behavior with end-to-end visibility.
A workshop using Zero Configuration Auto-Instrumentation for NodeJS.
Subsections of Automatic Discovery Workshops
PetClinic Monolith Workshop
30 minutesAuthor
Robert Castley
The goal is to walk through the basic steps to configure the following components of the Splunk Observability Cloud platform:
Splunk Infrastructure Monitoring (IM)
Splunk Automatic Discovery for Java (APM)
Database Query Performance
AlwaysOn Profiling
Splunk Real User Monitoring (RUM)
RUM to APM Correlation
Splunk Log Observer (LO)
We will also show the steps about how to clone (download) a sample Java application (Spring PetClinic), as well as how to compile, package and run the application.
Once the application is up and running, we will instantly start seeing metrics, traces and logs via the automatic discovery and configuration for Java 2.x that will be used by the Splunk APM product.
After that, we will instrument PetClinic’s end user interface (HTML pages rendered by the application) with the Splunk OpenTelemetry Javascript Libraries (RUM) that will generate RUM traces around all the individual clicks and page loads executed by an end user.
Lastly, we will view the logs generated by the automatic injection of trace metadata into the PetClinic application logs.
Prerequisites
Outbound SSH access to port 2222.
Outbound HTTP access to port 8083.
Familiarity with the bash shell and vi/vim editor.
Subsections of PetClinic Monolith Workshop
Installing the OpenTelemetry Collector
The Splunk OpenTelemetry Collector is the core component of instrumenting infrastructure and applications. Its role is to collect and send:
Infrastructure metrics (disk, CPU, memory, etc)
Application Performance Monitoring (APM) traces
Profiling data
Host and application logs
Remove any existing OpenTelemetry Collectors
If you have completed the Splunk IM workshop, please ensure you have deleted the collector running in Kubernetes before continuing. This can be done by running the following command:
helm delete splunk-otel-collector
To ensure your instance is configured correctly, we need to confirm that the required environment variables for this workshop are set correctly. In your terminal run the following command:
. ~/workshop/scripts/check_env.sh
In the output check that all of the following environment variables are present and have values set. If any are missing, please contact your instructor:
We can then go ahead and install the Collector. Some additional parameters are passed to the install script, they are:
--with-instrumentation - This will install the agent from the Splunk distribution of OpenTelemetry Java, which is then loaded automatically when the PetClinic Java application starts up. No configuration is required!
--deployment-environment - Sets the resource attribute deployment.environment to the value passed. This is used to filter views in the UI.
--enable-profiler - Enables the profiler for the Java application. This will generate CPU profiles for the application.
--enable-profiler-memory - Enables the profiler for the Java application. This will generate memory profiles for the application.
--enable-metrics - Enables the exporting of Micrometer metrics
--hec-token - Sets the HEC token for the collector to use
--hec-url - Sets the HEC URL for the collector to use
Next, we will patch the collector to expose the hostname of the instance and not the AWS instance ID. This will make it easier to filter data in the UI:
Once the agent_config.yaml has been patched, you will need to restart the collector:
sudo systemctl restart splunk-otel-collector
Once the installation is completed, you can navigate to the Hosts with agent installed dashboard to see the data from your host, Dashboards → Hosts with agent installed.
Use the dashboard filter and select host.name and type or select the hostname of your workshop instance (you can get this from the command prompt in your terminal session). Once you see data flowing for your host, we are then ready to get started with the APM component.
Building the Spring PetClinic Application
The first thing we need to set up APM is… well, an application. For this exercise, we will use the Spring PetClinic application. This is a very popular sample Java application built with the Spring framework (Springboot).
First, clone the PetClinic GitHub repository, and then we will compile, build, package and test the application:
Next, we will start another container running Locust that will generate some simple traffic to the PetClinic application. Locust is a simple load-testing tool that can be used to generate traffic to a web application.
Next, compile, build and package PetClinic using maven:
./mvnw package -Dmaven.test.skip=true
[!INFO]
This will take a few minutes the first time you run and will download a lot of dependencies before it compiles the application. Future builds will be a lot quicker.
Once the build completes, you need to obtain the public IP address of the instance you are running on. You can do this by running the following command:
curl http://ifconfig.me
You will see an IP address returned, make a note of this as we will need it to validate that the application is running.
Automatic discovery and configuration for Java
You can now start the application with the following command. Notice that we are passing the mysql profile to the application, this will tell the application to use the MySQL database we started earlier. We are also setting the otel.service.name and otel.resource.attributes to a logical names using the instance name. These will also be used in the UI for filtering:
You can validate the application is running by visiting http://<IP_ADDRESS>:8083 (replace <IP_ADDRESS> with the IP address you obtained earlier).
When we installed the collector we configured it to enable AlwaysOn Profiling and Metrics. This means that the collector will automatically generate CPU and Memory profiles for the application and send them to Splunk Observability Cloud.
When you start the PetClinic application you will see the collector automatically detect the application and instrument it for traces and profiling.
Picked up JAVA_TOOL_OPTIONS: -javaagent:/usr/lib/splunk-instrumentation/splunk-otel-javaagent.jar
OpenJDK 64-Bit Server VM warning: Sharing is only supported for boot loader classes because bootstrap classpath has been appended
[otel.javaagent 2024-08-20 11:35:58:970 +0000] [main] INFO io.opentelemetry.javaagent.tooling.VersionLogger - opentelemetry-javaagent - version: splunk-2.6.0-otel-2.6.0
[otel.javaagent 2024-08-20 11:35:59:730 +0000] [main] INFO com.splunk.opentelemetry.profiler.ConfigurationLogger - -----------------------
[otel.javaagent 2024-08-20 11:35:59:730 +0000] [main] INFO com.splunk.opentelemetry.profiler.ConfigurationLogger - Profiler configuration:
[otel.javaagent 2024-08-20 11:35:59:730 +0000] [main] INFO com.splunk.opentelemetry.profiler.ConfigurationLogger -                  splunk.profiler.enabled : true
[otel.javaagent 2024-08-20 11:35:59:731 +0000] [main] INFO com.splunk.opentelemetry.profiler.ConfigurationLogger -                splunk.profiler.directory : /tmp
[otel.javaagent 2024-08-20 11:35:59:731 +0000] [main] INFO com.splunk.opentelemetry.profiler.ConfigurationLogger -       splunk.profiler.recording.duration : 20s
[otel.javaagent 2024-08-20 11:35:59:731 +0000] [main] INFO com.splunk.opentelemetry.profiler.ConfigurationLogger -               splunk.profiler.keep-files : false
[otel.javaagent 2024-08-20 11:35:59:732 +0000] [main] INFO com.splunk.opentelemetry.profiler.ConfigurationLogger -            splunk.profiler.logs-endpoint : null
[otel.javaagent 2024-08-20 11:35:59:732 +0000] [main] INFO com.splunk.opentelemetry.profiler.ConfigurationLogger -              otel.exporter.otlp.endpoint : null
[otel.javaagent 2024-08-20 11:35:59:732 +0000] [main] INFO com.splunk.opentelemetry.profiler.ConfigurationLogger -           splunk.profiler.memory.enabled : true
[otel.javaagent 2024-08-20 11:35:59:732 +0000] [main] INFO com.splunk.opentelemetry.profiler.ConfigurationLogger -        splunk.profiler.memory.event.rate : 150/s
[otel.javaagent 2024-08-20 11:35:59:732 +0000] [main] INFO com.splunk.opentelemetry.profiler.ConfigurationLogger -      splunk.profiler.call.stack.interval : PT10S
[otel.javaagent 2024-08-20 11:35:59:733 +0000] [main] INFO com.splunk.opentelemetry.profiler.ConfigurationLogger -  splunk.profiler.include.internal.stacks : false
[otel.javaagent 2024-08-20 11:35:59:733 +0000] [main] INFO com.splunk.opentelemetry.profiler.ConfigurationLogger -      splunk.profiler.tracing.stacks.only : false
[otel.javaagent 2024-08-20 11:35:59:733 +0000] [main] INFO com.splunk.opentelemetry.profiler.ConfigurationLogger - -----------------------
[otel.javaagent 2024-08-20 11:35:59:733 +0000] [main] INFO com.splunk.opentelemetry.profiler.JfrActivator - Profiler is active.
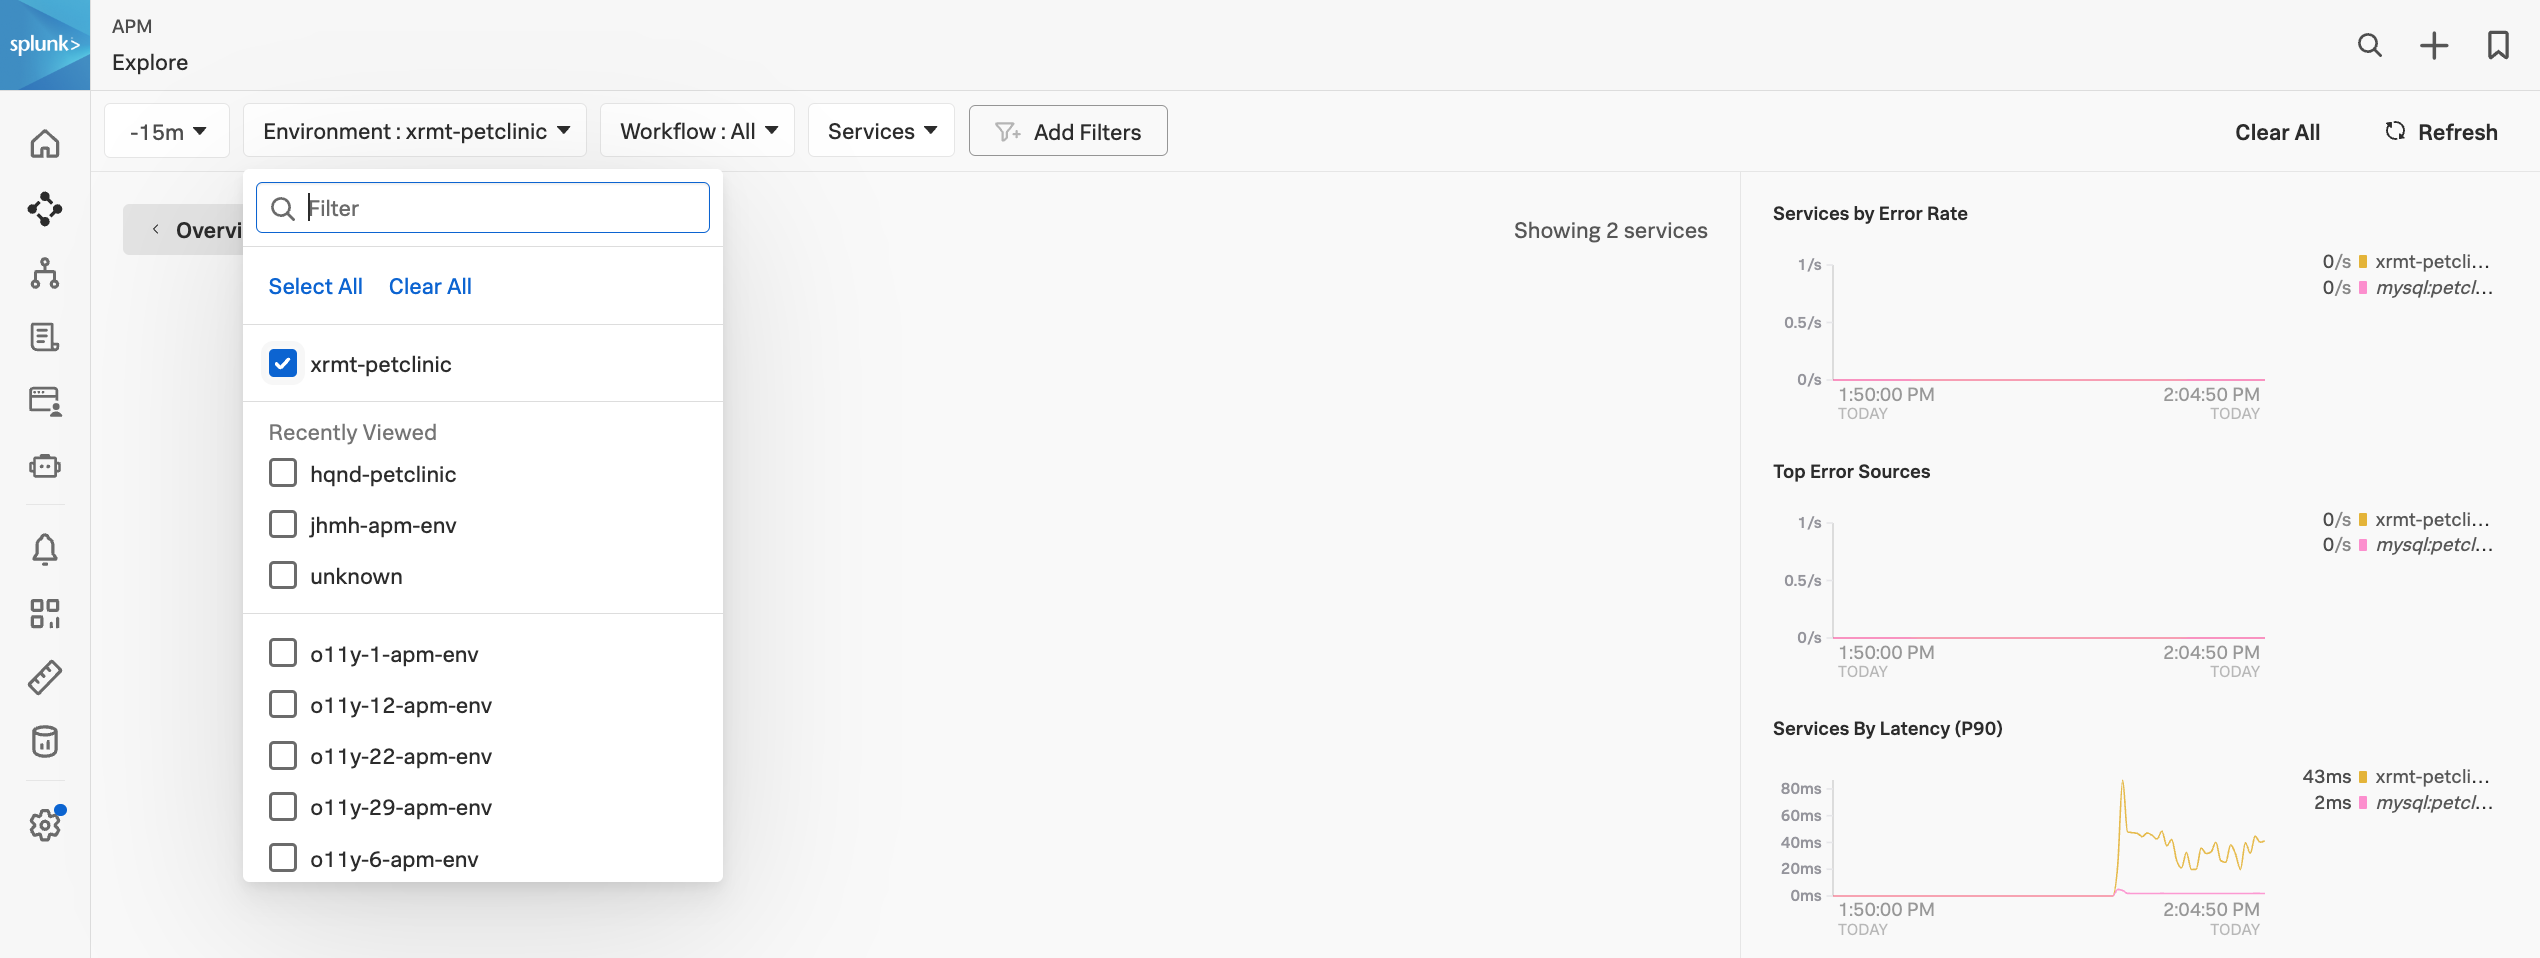
You can now visit the Splunk APM UI and examine the application components, traces, profiling, DB Query performance and metrics. From the left-hand menu APM → Explore, click the environment dropdown and select your environment e.g. <INSTANCE>-petclinic (where<INSTANCE> is replaced with the value you noted down earlier).
Once your validation is complete you can stop the application by pressing Ctrl-c.
Resource attributes can be added to every reported span. For example version=0.314. A comma-separated list of resource attributes can also be defined e.g. key1=val1,key2=val2.
Let’s launch the PetClinic again using new resource attributes. Note, that adding resource attributes to the run command will override what was defined when we installed the collector. Let’s add a new resource attribute version=0.314:
Back in the Splunk APM UI we can drill down on a recent trace and see the new version attribute in a span.
3. Real User Monitoring
For the Real User Monitoring (RUM) instrumentation, we will add the Open Telemetry Javascript https://github.com/signalfx/splunk-otel-js-web snippet in the pages, we will use the wizard again Data Management → Add Integration → RUM Instrumentation → Browser Instrumentation.
Your instructor will inform you which token to use from the dropdown, click Next. Enter App name and Environment using the following syntax:
<INSTANCE>-petclinic-service - replacing <INSTANCE> with the value you noted down earlier.
<INSTANCE>-petclinic-env - replacing <INSTANCE> with the value you noted down earlier.
The wizard will then show a snippet of HTML code that needs to be placed at the top of the pages in the <head> section. The following is an example of the (do not use this snippet, use the one generated by the wizard):
/*
IMPORTANT: Replace the <version> placeholder in the src URL with a
version from https://github.com/signalfx/splunk-otel-js-web/releases
*/
<scriptsrc="https://cdn.signalfx.com/o11y-gdi-rum/latest/splunk-otel-web.js"crossorigin="anonymous"></script><script>SplunkRum.init({realm:"eu0",rumAccessToken:"<redacted>",applicationName:"petclinic-1be0-petclinic-service",deploymentEnvironment:"petclinic-1be0-petclinic-env"});</script>
The Spring PetClinic application uses a single HTML page as the “layout” page, that is reused across all pages of the application. This is the perfect location to insert the Splunk RUM Instrumentation Library as it will be loaded in all pages automatically.
Let’s then edit the layout page:
vi src/main/resources/templates/fragments/layout.html
Next, insert the snippet we generated above in the <head> section of the page. Make sure you don’t include the comment and replace <version> in the source URL to latest e.g.
Then let’s visit the application using a browser to generate real-user traffic http://<IP_ADDRESS>:8083.
In RUM, filter down into the environment as defined in the RUM snippet above and click through to the dashboard.
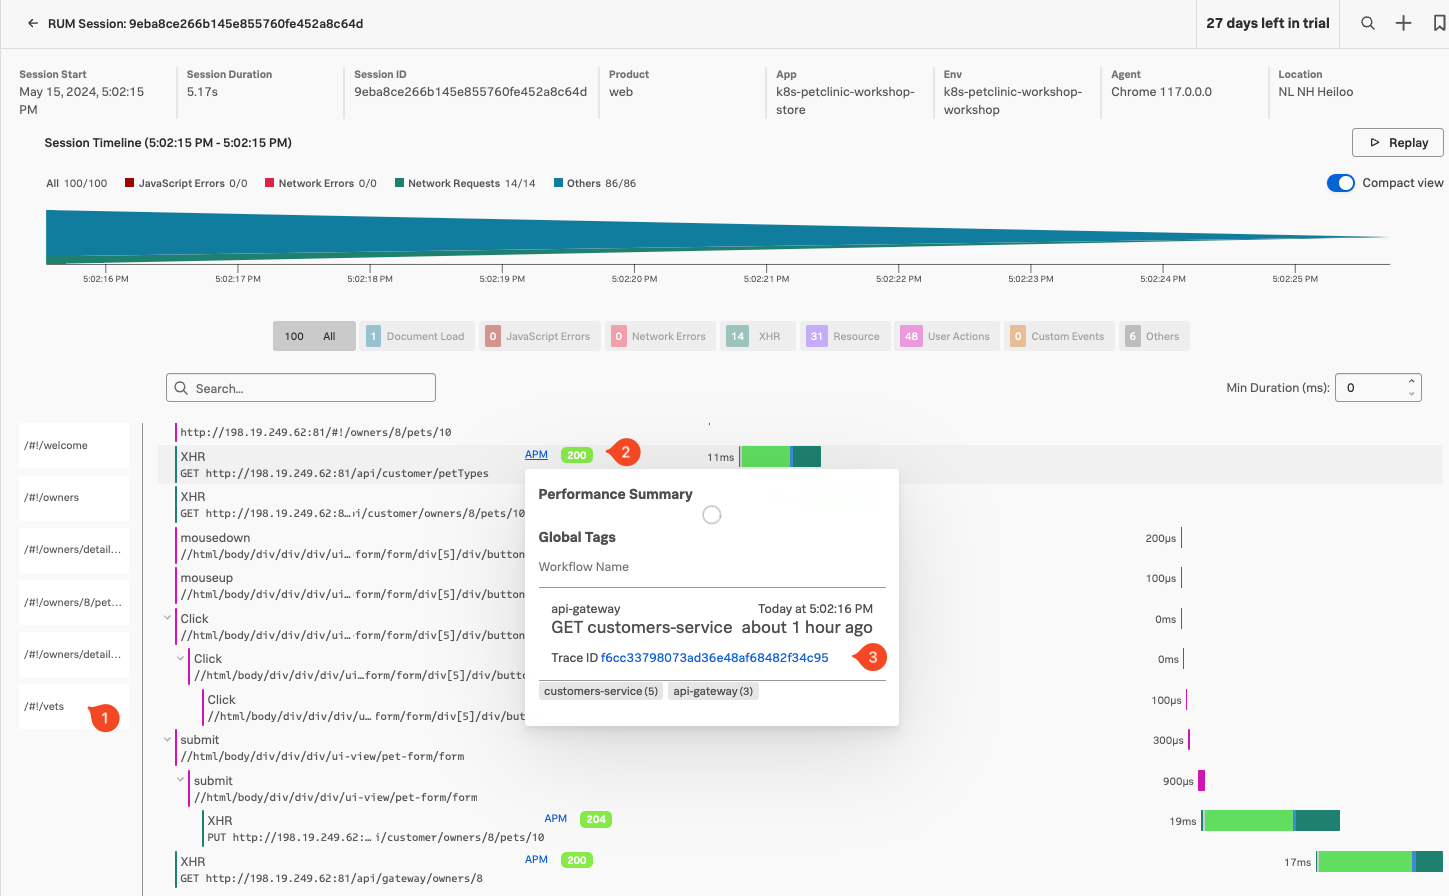
When you drill down into a RUM trace you will see a link to APM in the spans. Clicking on the trace ID will take you to the corresponding APM trace for the current RUM trace.
4. Log Observer
For the Splunk Log Observer component, the Splunk OpenTelemetry Collector automatically collects logs from the Spring PetClinic application and sends them to Splunk Observability Cloud using the OTLP exporter, anotating the log events with trace_id, span_id and trace flags.
Log Observer provides a real-time view of logs from your applications and infrastructure. It allows you to search, filter, and analyze logs to troubleshoot issues and monitor your environment.
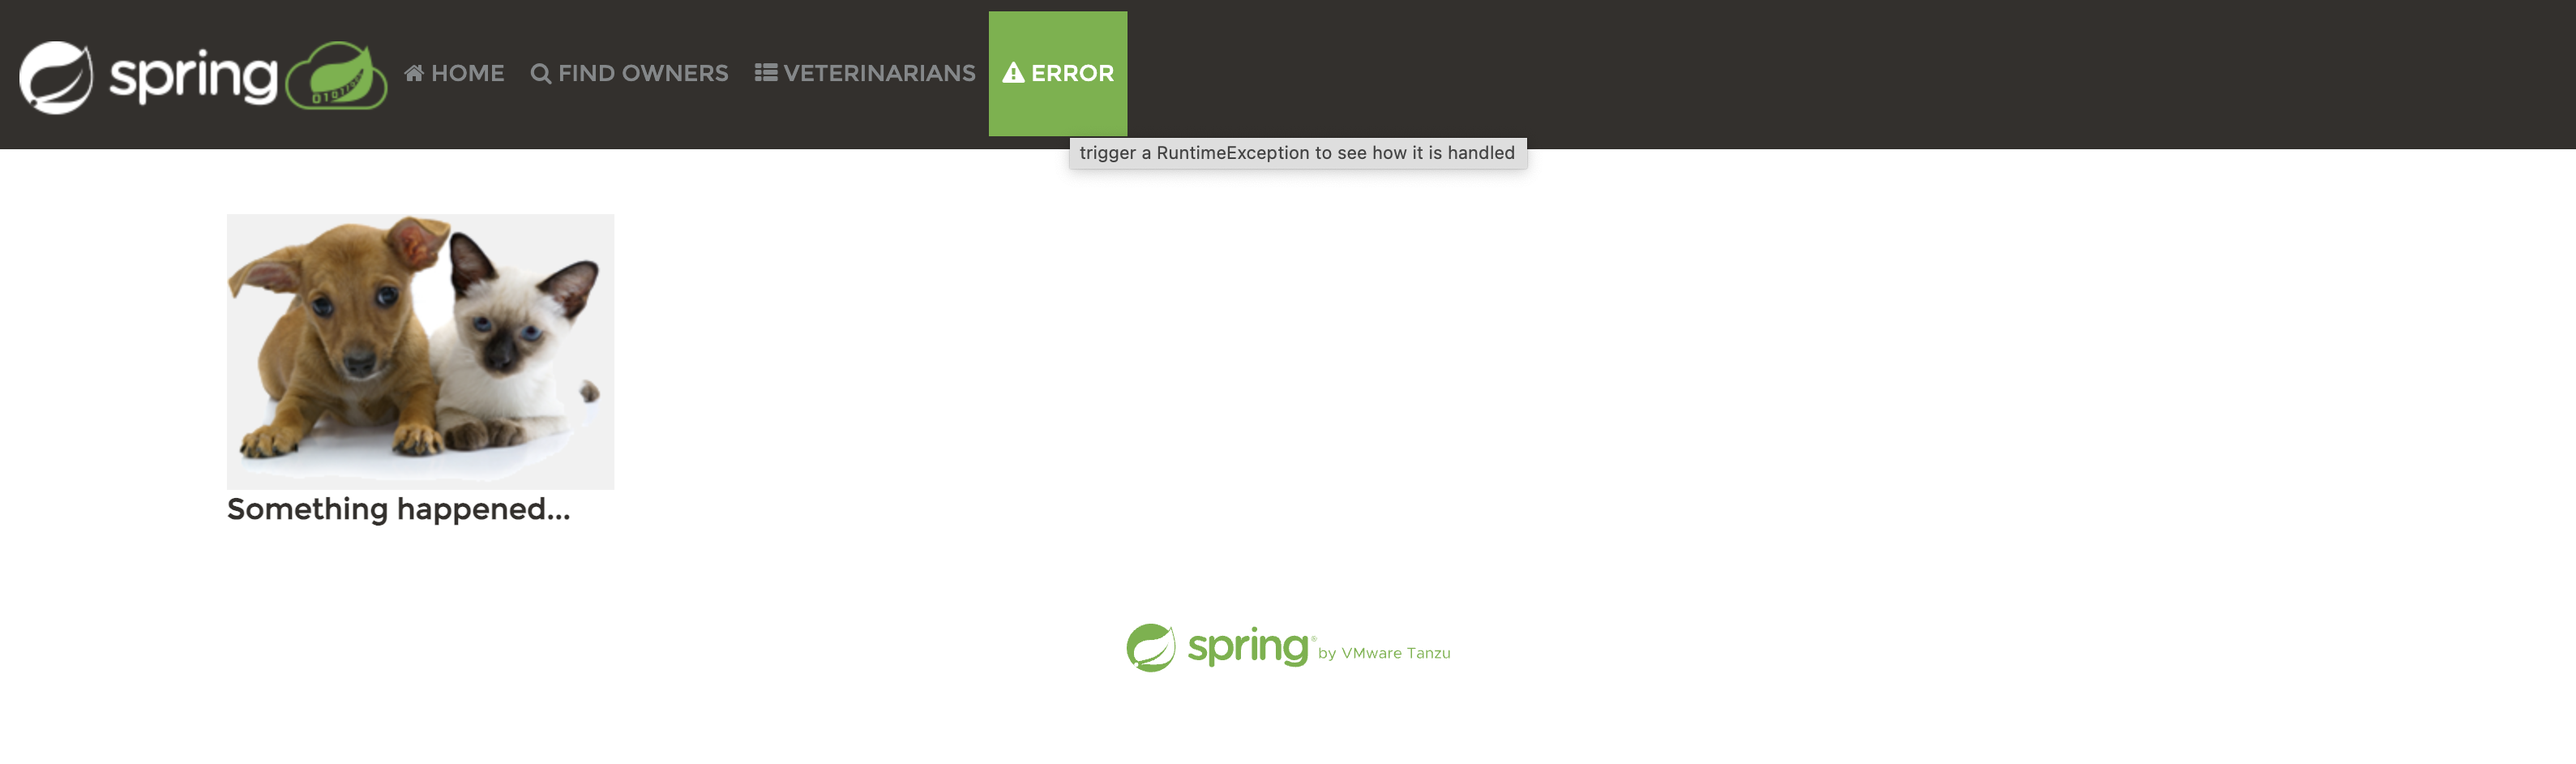
Go back to the PetClinic web application and click on the Error link several times. This will generate some log messages in the PetClinic application logs.
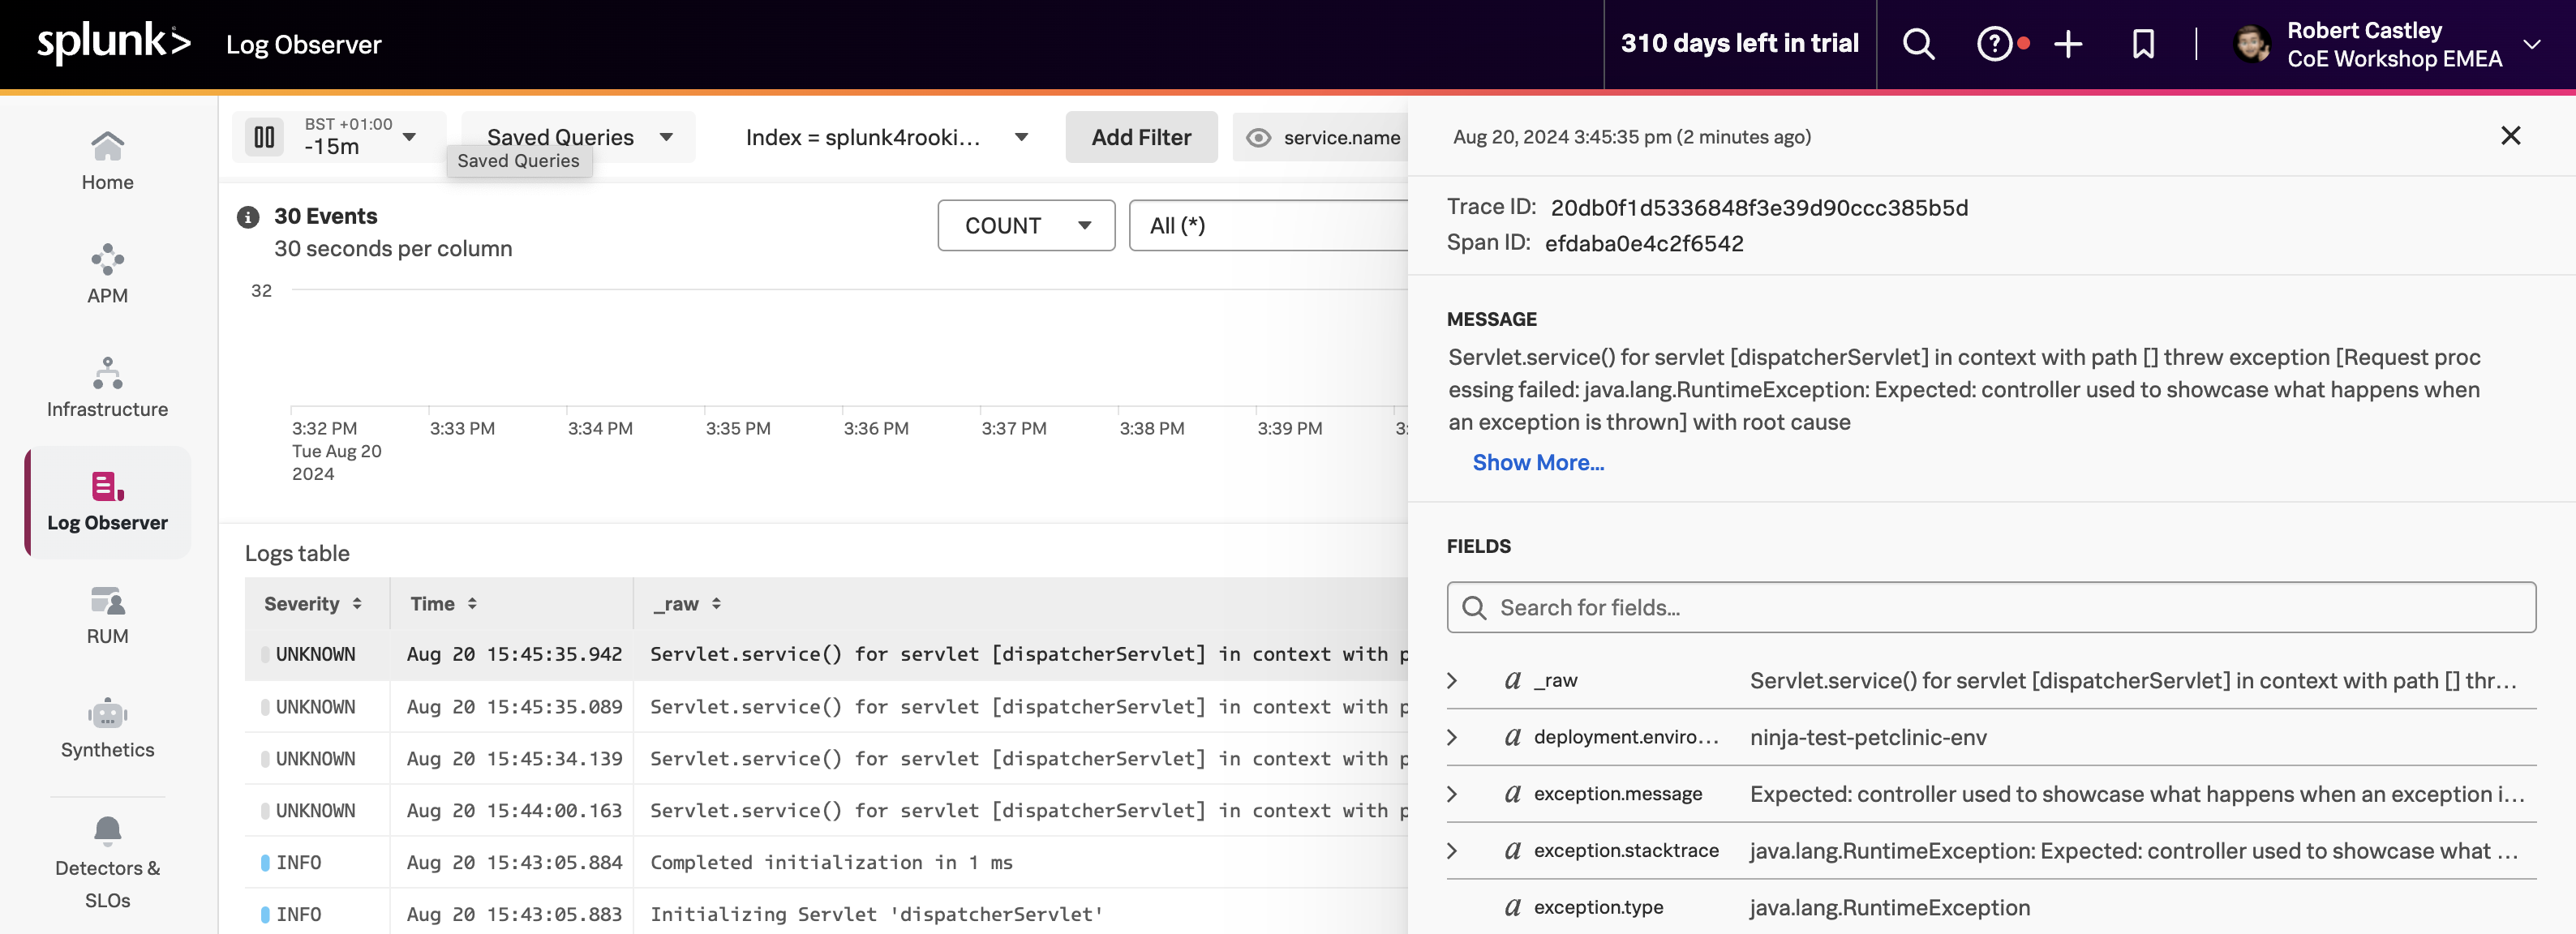
From the left-hand menu click on Log Observer and ensure Index is set to splunk4rookies-workshop.
Next, click Add Filter search for the field service.name select the value <INSTANCE>-petclinic-service and click = (include). You should now see only the log messages from your PetClinic application.
Select one of the log entries that were generated by clicking on the Error link in the PetClinic application. You will see the log message and the trace metadata that was automatically injected into the log message. Also, you will notice that Related Content is available for APM and Infrastructure.
This is the end of the workshop and we have certainly covered a lot of ground. At this point, you should have metrics, traces (APM & RUM), logs, database query performance and code profiling being reported into Splunk Observability Cloud and all without having to modify the PetClinic application code (well except for RUM).
Congratulations!
Spring PetClinic SpringBoot Based Microservices On Kubernetes
90 minutesAuthor
Pieter Hagen
The goal of this workshop is to introduce the features of Splunk’s automatic discovery and configuration for Java.
The workshop scenario will be created by installing a simple (un-instrumented) Java microservices application in Kubernetes.
By following the simple steps to install the Splunk OpenTelemetry Collector and enabling automatic discovery and configuration for existing Java based deployments you will learn how easy it is to send metrics, traces and logs to Splunk Observability Cloud.
Prerequisites
Outbound SSH access to port 2222.
Outbound HTTP access to port 81.
Familiarity with the Linux command line.
During this workshop we will cover the following components:
Splunk Infrastructure Monitoring (IM)
Splunk automatic discovery and configuration for Java (APM)
Database Query Performance
AlwaysOn Profiling
Splunk Log Observer (LO)
Splunk Real User Monitoring (RUM)
Splunk Synthetics is feeling a little left out here, but we cover that in other workshops
Subsections of Spring PetClinic SpringBoot Based Microservices On Kubernetes
Architecture
5 minutes
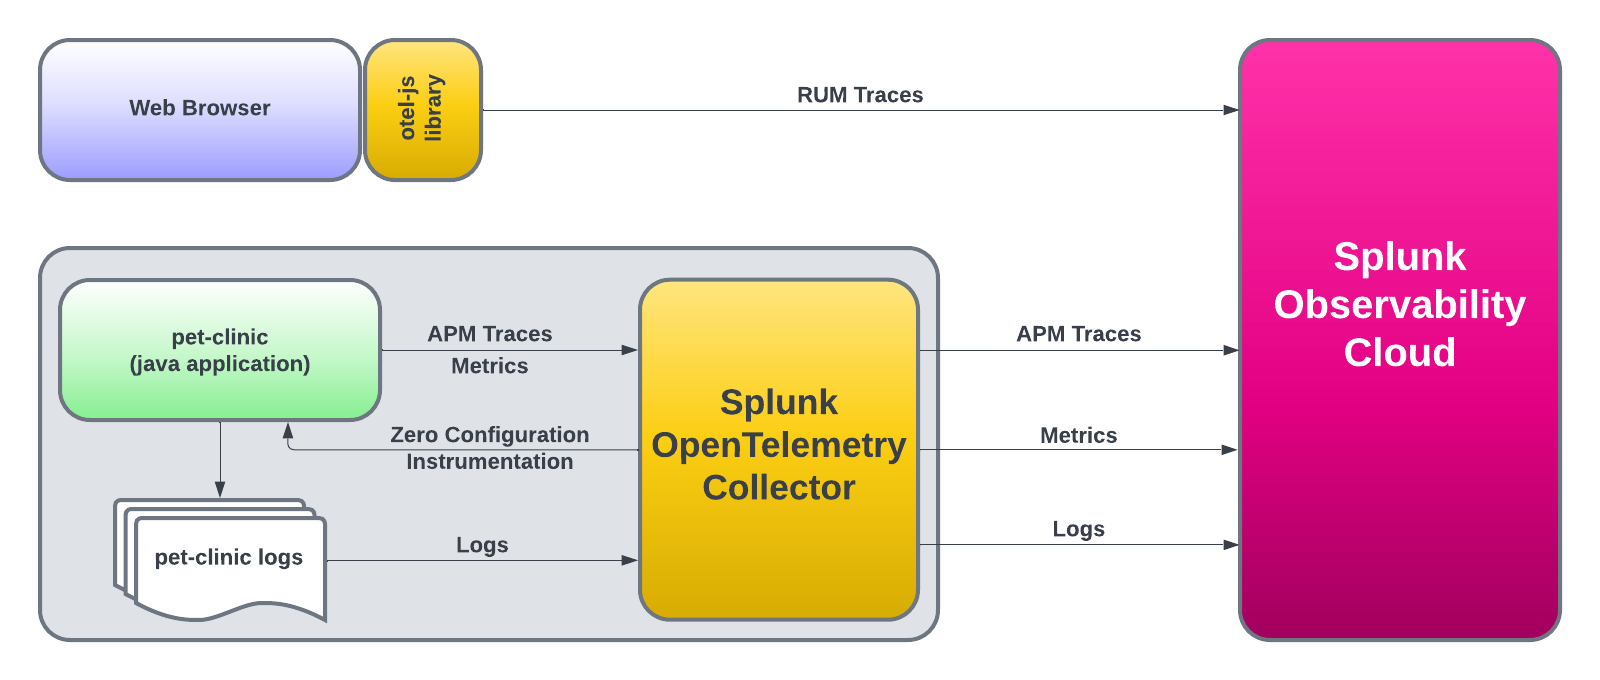
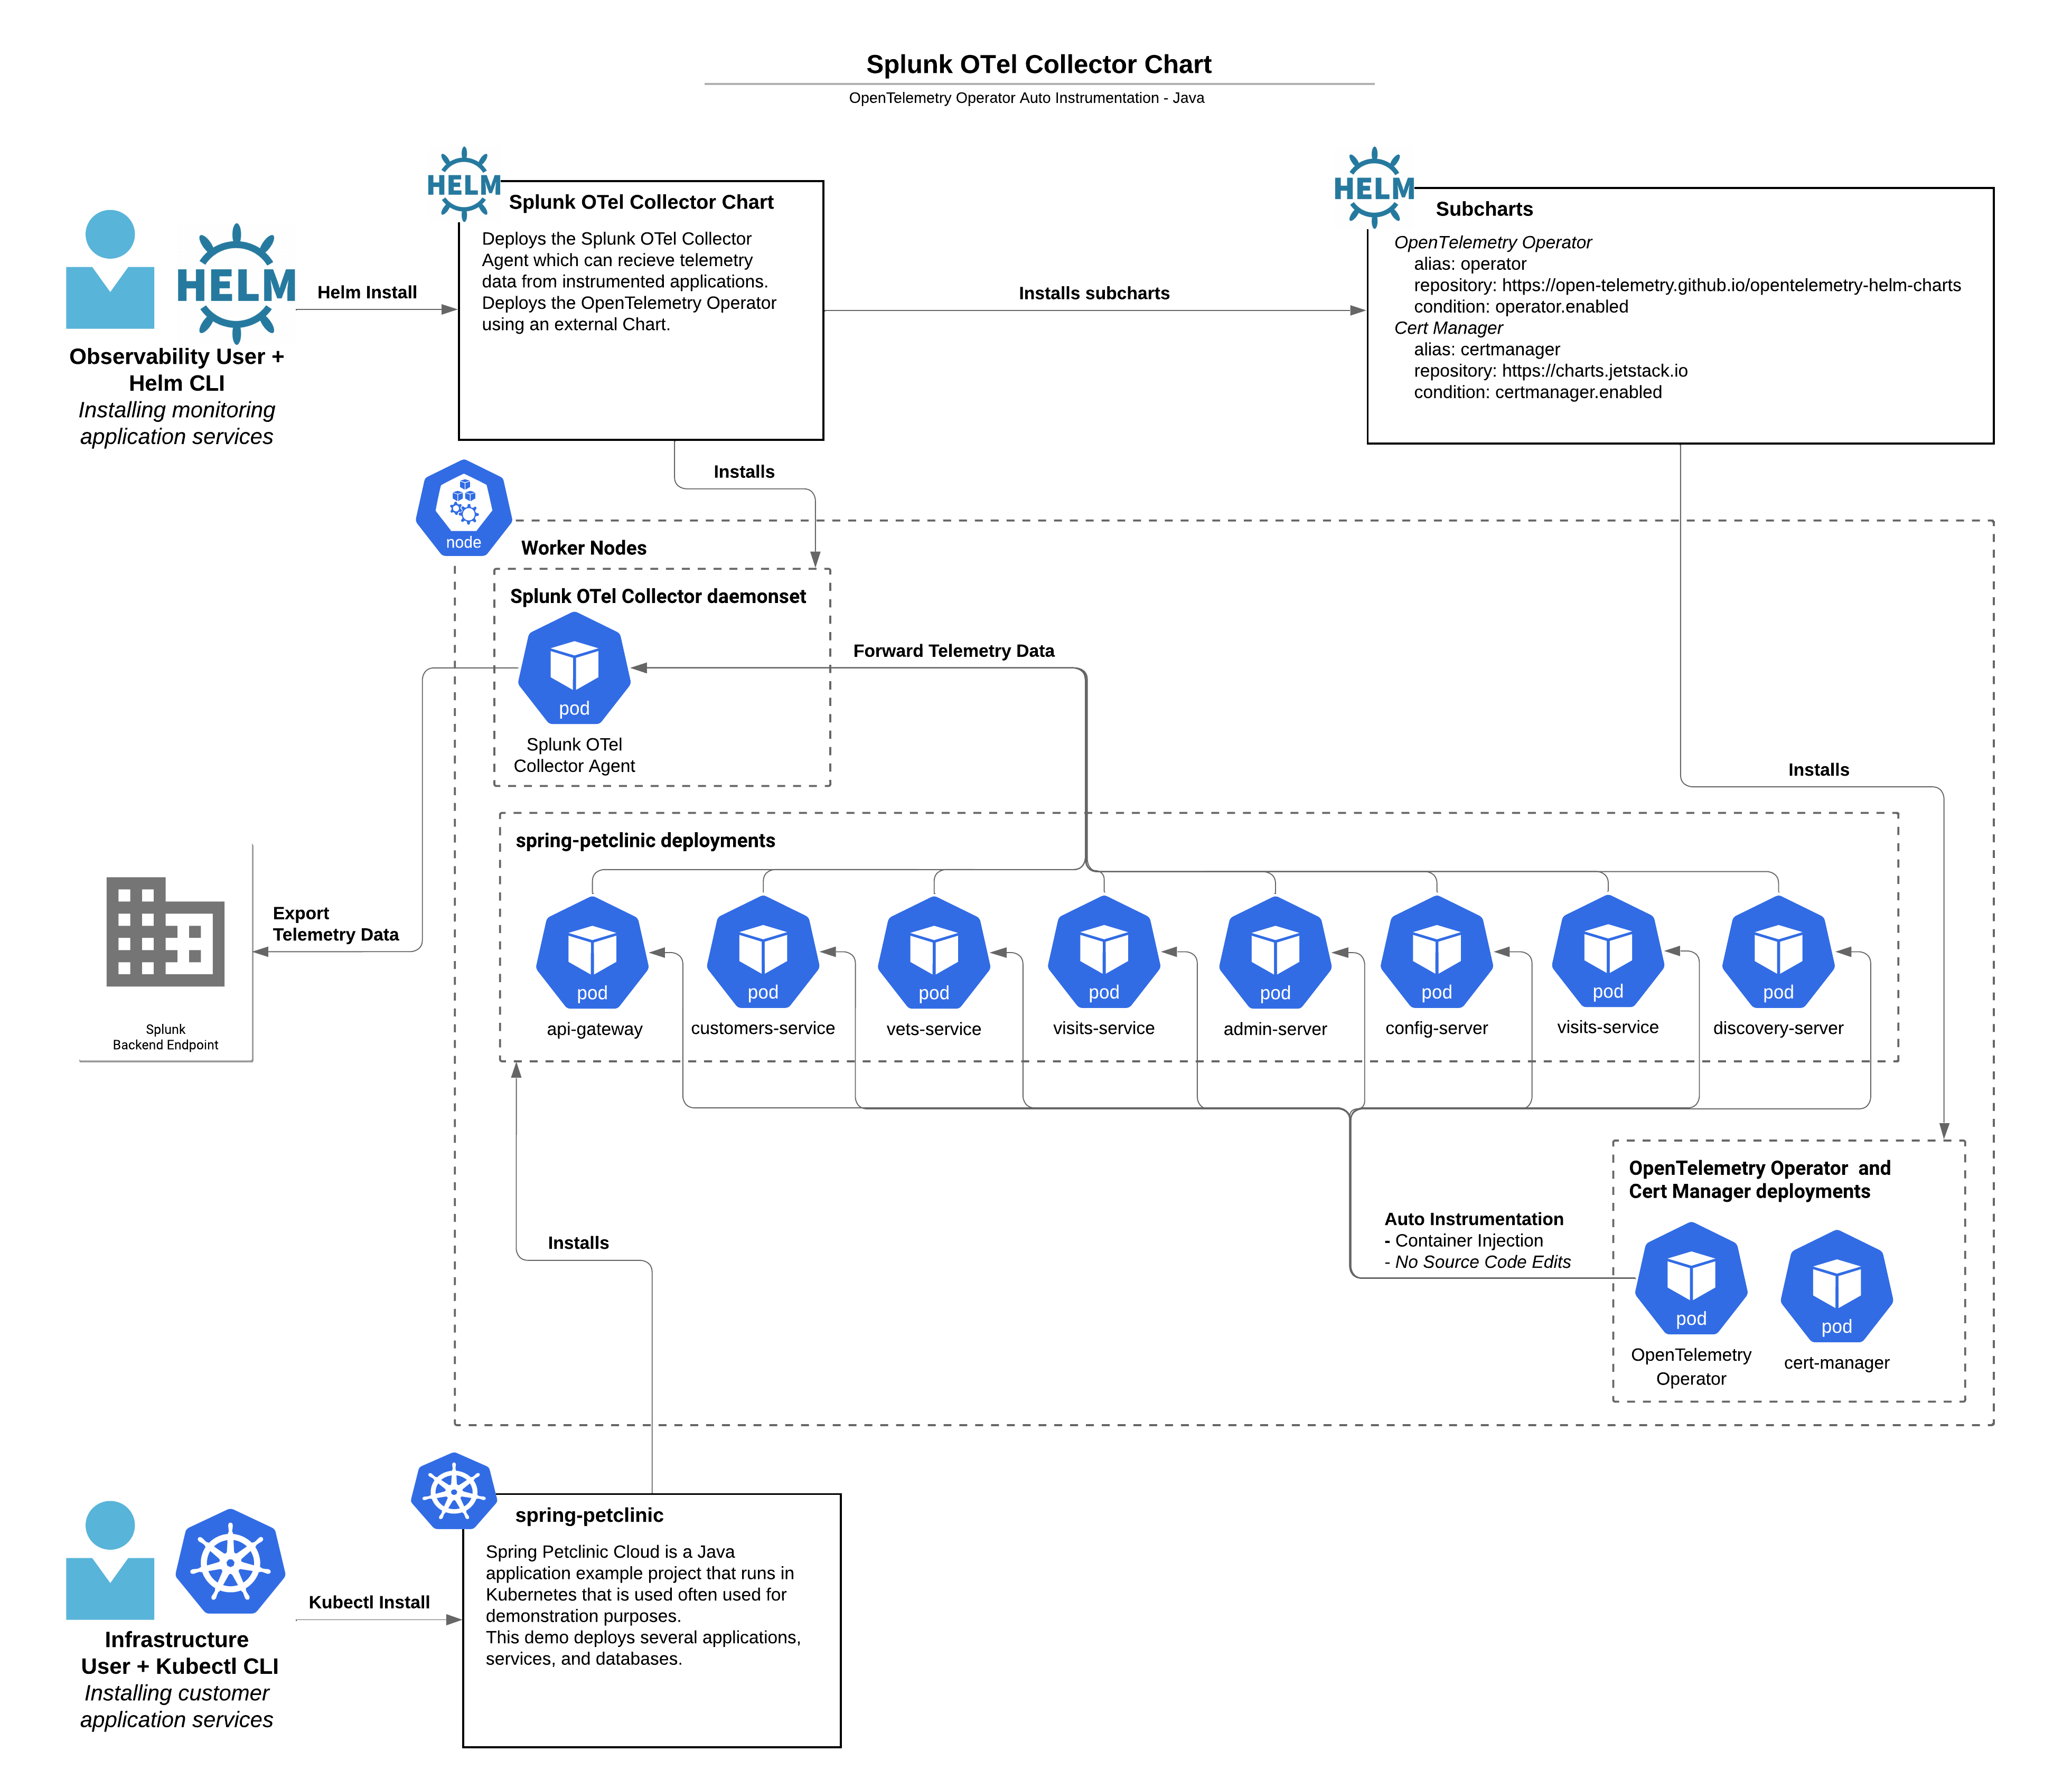
The diagram below details the architecture of the Spring PetClinic Java application running in Kubernetes with the Splunk OpenTelemetry Operator and automatic discovery and configuration enabled.
The Spring PetClinic Java application is a simple microservices application that consists of a frontend and backend services. The frontend service is a Spring Boot application that serves a web interface to interact with the backend services. The backend services are Spring Boot applications that serve RESTful API’s to interact with a MySQL database.
By the end of this workshop, you will have a better understanding of how to enable automatic discovery and configuration for your Java-based applications running in Kubernetes.
The instructor will provide you with the login information for the instance that we will be using during the workshop.
When you first log into your instance, you will be greeted by the Splunk Logo as shown below. If you have any issues connecting to your workshop instance then please reach out to your Instructor.
$ ssh -p 2222 splunk@<ip-address>

███████╗██████╗ ██╗     ██╗   ██╗███╗   ██╗██╗  ██╗    ██╗
██╔════╝██╔══██╗██║     ██║   ██║████╗  ██║██║ ██╔╝    ╚██╗
███████╗██████╔╝██║     ██║   ██║██╔██╗ ██║█████╔╝      ╚██╗
╚════██║██╔═══╝ ██║     ██║   ██║██║╚██╗██║██╔═██╗      ██╔╝
███████║██║     ███████╗╚██████╔╝██║ ╚████║██║  ██╗    ██╔╝
╚══════╝╚═╝     ╚══════╝ ╚═════╝ ╚═╝  ╚═══╝╚═╝  ╚═╝    ╚═╝
Last login: Mon Feb  5 11:04:54 2024 from [Redacted]
Waiting for cloud-init status...
Your instance is ready!
splunk@show-no-config-i-0d1b29d967cb2e6ff:~$
To ensure your instance is configured correctly, we need to confirm that the required environment variables for this workshop are set correctly. In your terminal run the following script and check that the environment variables are present and set with actual valid values:
Please make a note of the INSTANCE environment variable value as this will used later to filter data in Splunk Observability Cloud.
For this workshop, all of the above are required. If any have values missing, please contact your Instructor.
Delete any existing OpenTelemetry Collectors
If you have previously completed a Splunk Observability workshop using this EC2 instance, you need to ensure that any existing installation of the Splunk OpenTelemetry Collector is deleted. This can be achieved by running the following command:
helm delete splunk-otel-collector
Subsections of Preparation of the Workshop instance
Deploy the Splunk OpenTelemetry Collector
To get Observability signals (metrics, traces and logs) into Splunk Observability Cloud the Splunk OpenTelemetry Collector needs to be deployed into the Kubernetes cluster.
For this workshop, we will be using the Splunk OpenTelemetry Collector Helm Chart. First we need to add the Helm chart repository to Helm and update to ensure the latest version:
Using ACCESS_TOKEN={REDACTED}
Using REALM=eu0
"splunk-otel-collector-chart" has been added to your repositories
Using ACCESS_TOKEN={REDACTED}
Using REALM=eu0
Hang tight while we grab the latest from your chart repositories...
...Successfully got an update from the "splunk-otel-collector-chart" chart repository
Update Complete. ⎈Happy Helming!⎈
Splunk Observability Cloud offers wizards in the UI to walk you through the setup of the OpenTelemetry Collector on Kubernetes, but in the interest of time, we will use the Helm install command below. Additional parameters are set to enable the operator and automatic discovery and configuration.
--set="operator.enabled=true" - this will install the Opentelemetry operator that will be used to handle automatic discovery and configuration.
--set="certmanager.enabled=true" - this will install the required certificate manager for the operator.
--set="splunkObservability.profilingEnabled=true" - this enables Code Profiling via the operator.
To install the collector run the following command, do NOT edit this:
LAST DEPLOYED: Fri Apr 19 09:39:54 2024
NAMESPACE: default
STATUS: deployed
REVISION: 1
NOTES:
Splunk OpenTelemetry Collector is installed and configured to send data to Splunk Platform endpoint "https://http-inputs-o11y-workshop-eu0.splunkcloud.com:443/services/collector/event".

Splunk OpenTelemetry Collector is installed and configured to send data to Splunk Observability realm eu0.

[INFO] You've enabled the operator's auto-instrumentation feature (operator.enabled=true), currently considered ALPHA.
  - Instrumentation library maturity varies (e.g., Java is more mature than Go). For library stability, visit: https://opentelemetry.io/docs/instrumentation/#status-and-releases
  - Some libraries may be enabled by default. For current status, see: https://github.com/open-telemetry/opentelemetry-operator#controlling-instrumentation-capabilities
  - Splunk provides best-effort support for native OpenTelemetry libraries, and full support for Splunk library distributions. For used libraries, refer to the values.yaml under "operator.instrumentation.spec".
Ensure the Pods are reported as Running before continuing (this typically takes around 30 seconds).
Ensure there are no errors reported by the Splunk OpenTelemetry Collector (press ctrl + c to exit) or use the installed awesomek9s terminal UI for bonus points!
2021-03-21T16:11:10.900Z        INFO    service/service.go:364  Starting receivers...
2021-03-21T16:11:10.900Z        INFO    builder/receivers_builder.go:70 Receiver is starting... {"component_kind": "receiver", "component_type": "prometheus", "component_name": "prometheus"}
2021-03-21T16:11:11.009Z        INFO    builder/receivers_builder.go:75 Receiver started.       {"component_kind": "receiver", "component_type": "prometheus", "component_name": "prometheus"}
2021-03-21T16:11:11.009Z        INFO    builder/receivers_builder.go:70 Receiver is starting... {"component_kind": "receiver", "component_type": "k8s_cluster", "component_name": "k8s_cluster"}
2021-03-21T16:11:11.009Z        INFO    k8sclusterreceiver@v0.21.0/watcher.go:195       Configured Kubernetes MetadataExporter  {"component_kind": "receiver", "component_type": "k8s_cluster", "component_name": "k8s_cluster", "exporter_name": "signalfx"}
2021-03-21T16:11:11.009Z        INFO    builder/receivers_builder.go:75 Receiver started.       {"component_kind": "receiver", "component_type": "k8s_cluster", "component_name": "k8s_cluster"}
2021-03-21T16:11:11.009Z        INFO    healthcheck/handler.go:128      Health Check state change       {"component_kind": "extension", "component_type": "health_check", "component_name": "health_check", "status": "ready"}
2021-03-21T16:11:11.009Z        INFO    service/service.go:267  Everything is ready. Begin running and processing data.
2021-03-21T16:11:11.009Z        INFO    k8sclusterreceiver@v0.21.0/receiver.go:59       Starting shared informers and wait for initial cache sync.      {"component_kind": "receiver", "component_type": "k8s_cluster", "component_name": "k8s_cluster"}
2021-03-21T16:11:11.281Z        INFO    k8sclusterreceiver@v0.21.0/receiver.go:75       Completed syncing shared informer caches.       {"component_kind": "receiver", "component_type": "k8s_cluster", "component_name": "k8s_cluster"}
Deleting a failed installation
If you make an error installing the OpenTelemetry Collector you can start over by deleting the installation with the following command:
helm delete splunk-otel-collector
Deploy the PetClinic Application
The first deployment of our application will be using prebuilt containers to give us the base scenario: a regular Java microservices-based application running in Kubernetes that we want to start observing. So let’s deploy our application:
deployment.apps/config-server created
service/config-server created
deployment.apps/discovery-server created
service/discovery-server created
deployment.apps/api-gateway created
service/api-gateway created
service/api-gateway-external created
deployment.apps/customers-service created
service/customers-service created
deployment.apps/vets-service created
service/vets-service created
deployment.apps/visits-service created
service/visits-service created
deployment.apps/admin-server created
service/admin-server created
service/petclinic-db created
deployment.apps/petclinic-db created
configmap/petclinic-db-initdb-config created
deployment.apps/petclinic-loadgen-deployment created
configmap/scriptfile created
At this point, we can verify the deployment by checking if the Pods are running. The containers need to be downloaded and started so this may take a couple of minutes.
Make sure the output of kubectl get pods matches the output as shown above. Ensure all the services are shown as Running (or use k9s to contuuously monitor the status).
Once they are running, the application will take a few minutes to fully start up, create the database and synchronize all the services, so let’s use the time to check the local private repository is active.
Verify the local Private Registry
Later on, when we test our automatic discovery and configuration we are going to build new containers to highlight some of the additional features of Splunk Observability Cloud.
As configuration files and source code will be changed, the containers will need to be built and stored in a local private registry (which has already been enabled for you).
To check if the private registry is avaiable, run the following command (this will return an empty list):
curl -X GET http://localhost:9999/v2/_catalog
**{"repositories":[]}**
Verify Kubernetes Cluster metrics
10 minutes
Once the installation has been completed, you can log in to Splunk Observability Cloud and verify that the metrics are flowing in from your Kubernetes cluster.
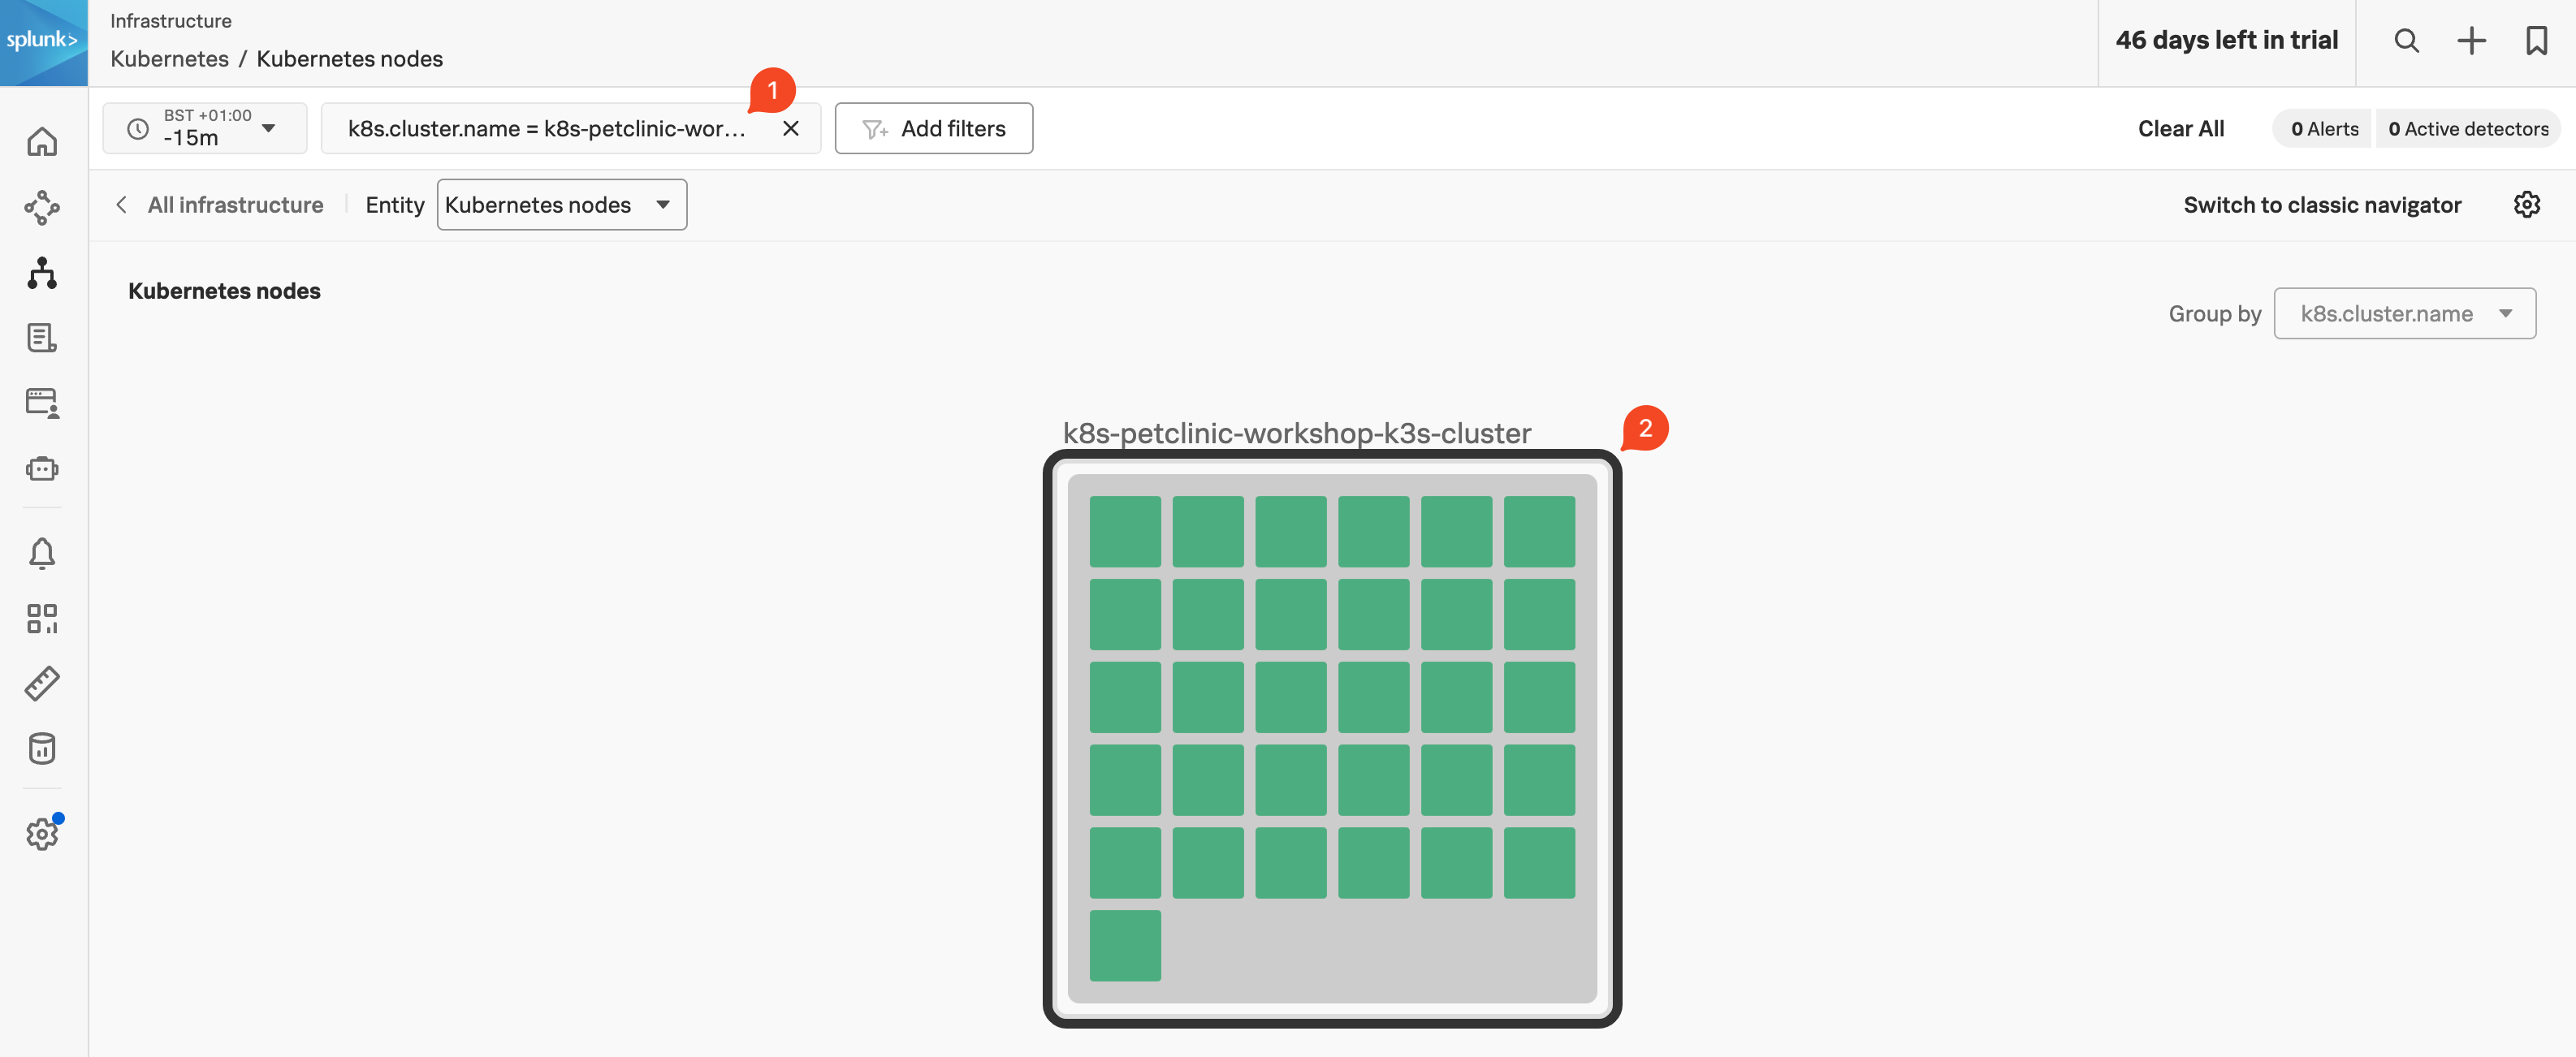
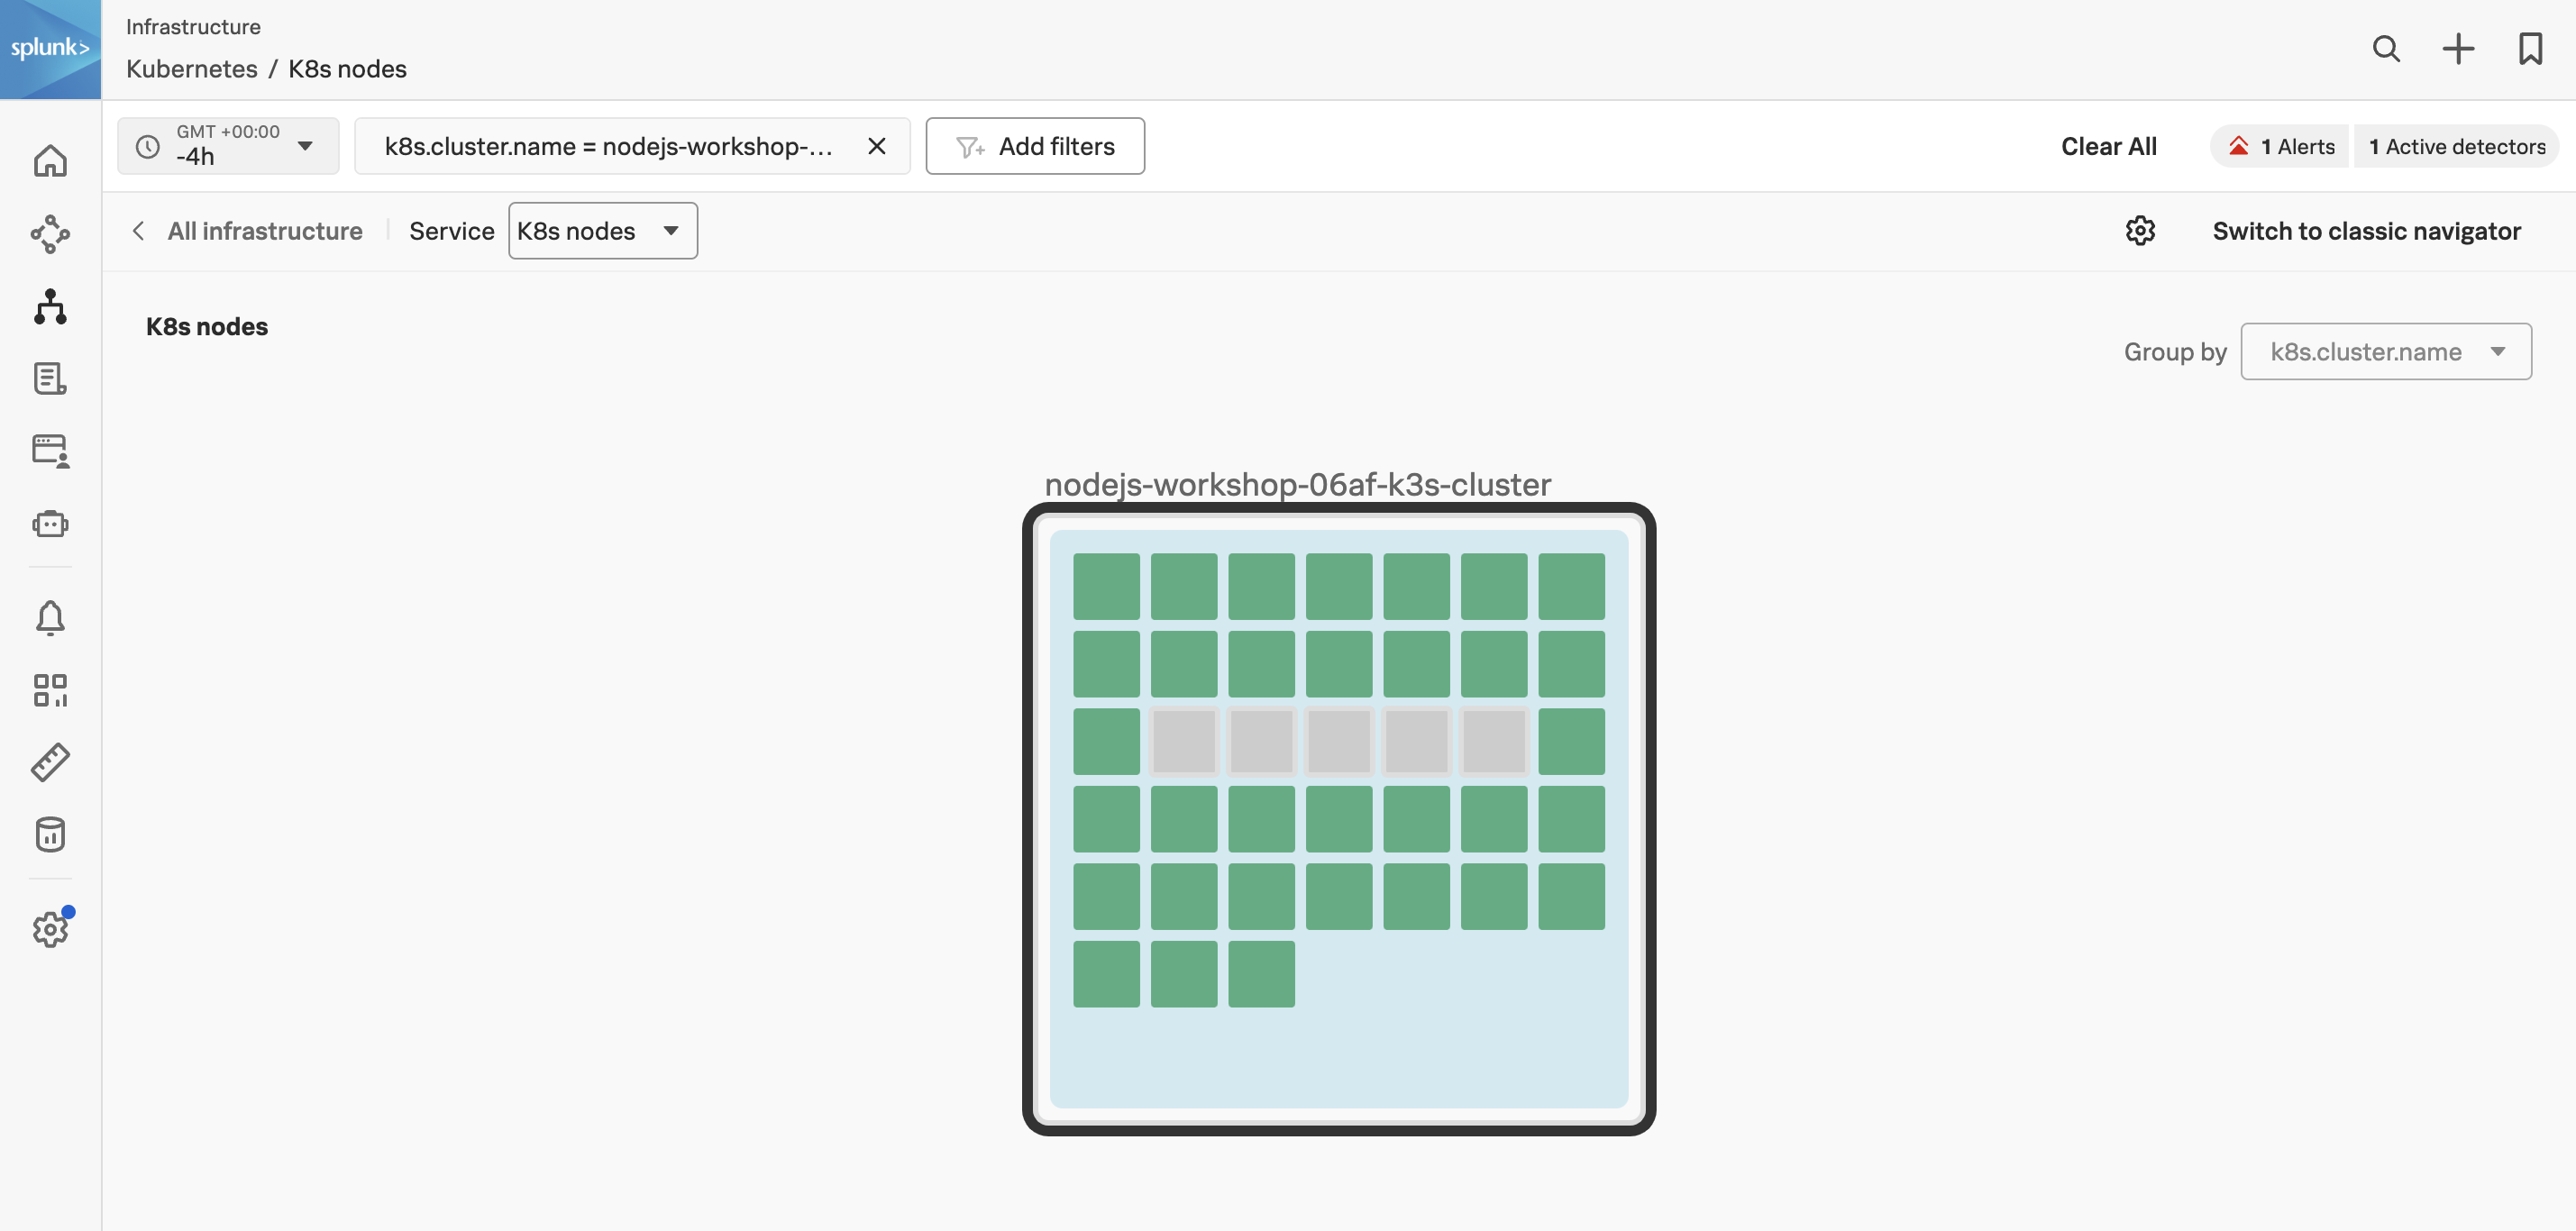
From the left-hand menu click on Infrastructure and select Kubernetes, then select the Kubernetes nodes pane. Once you are in the Kubernetes nodes view, change the Time filter from -4h to the last 15 minutes (-15m) to focus on the latest data.
Next, click Add filters (next to the Time filter) and add the filter k8s.cluster.name(1). Type or select the cluster name of your workshop instance (you can get the unique part from your cluster name by using the INSTANCE from the output from the shell script you ran earlier). You can also select your cluster by clicking on its image in the cluster pane. You will now only have your cluster visible (2).
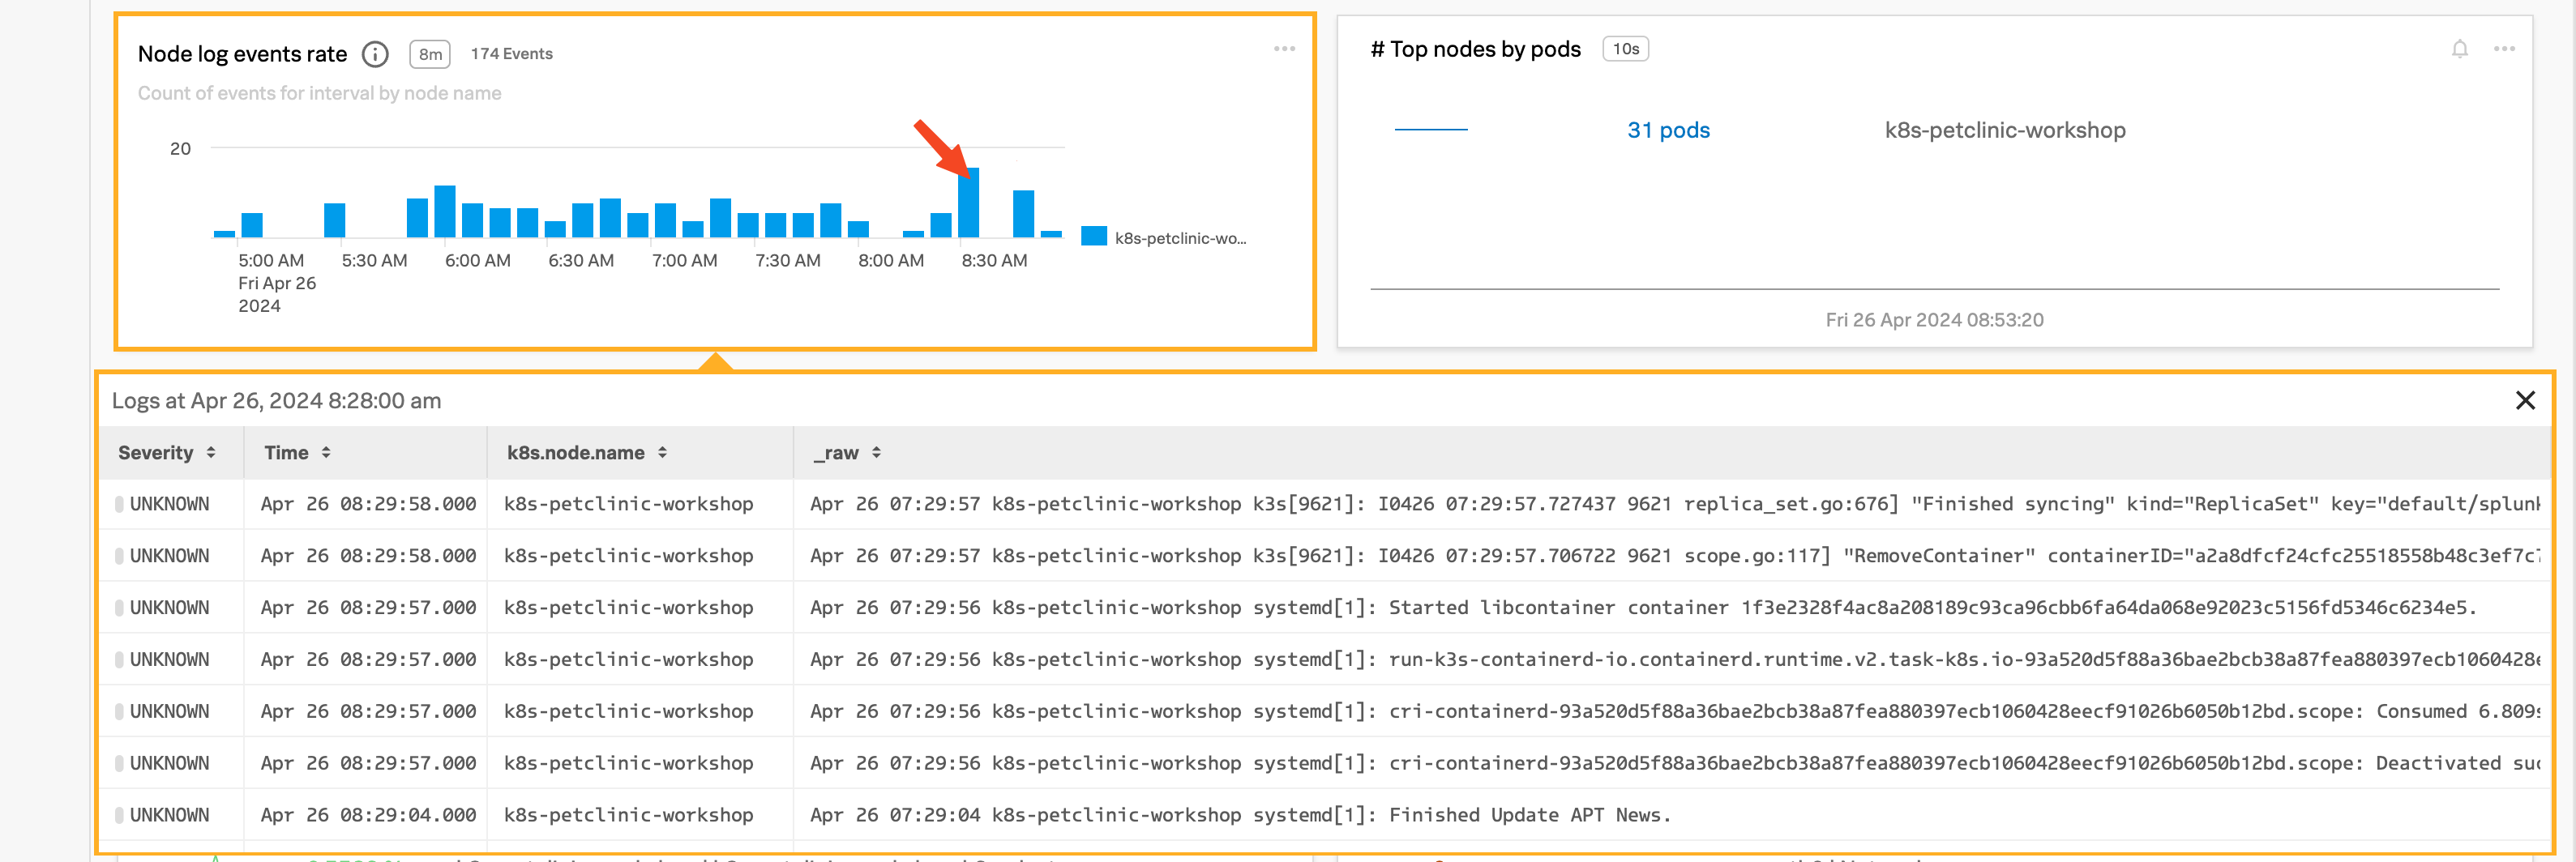
Scroll down the page to see the metrics coming in from your cluster. Locate the Node log events rate chart and click on a vertical bar to see the log entries coming in from your cluster.
Subsections of Verify Kubernetes Cluster metrics
Verify the PetClinic Website
To test the application you need to obtain the public IP address of the instance you are running on. You can do this by running the following command:
curl http://ifconfig.me
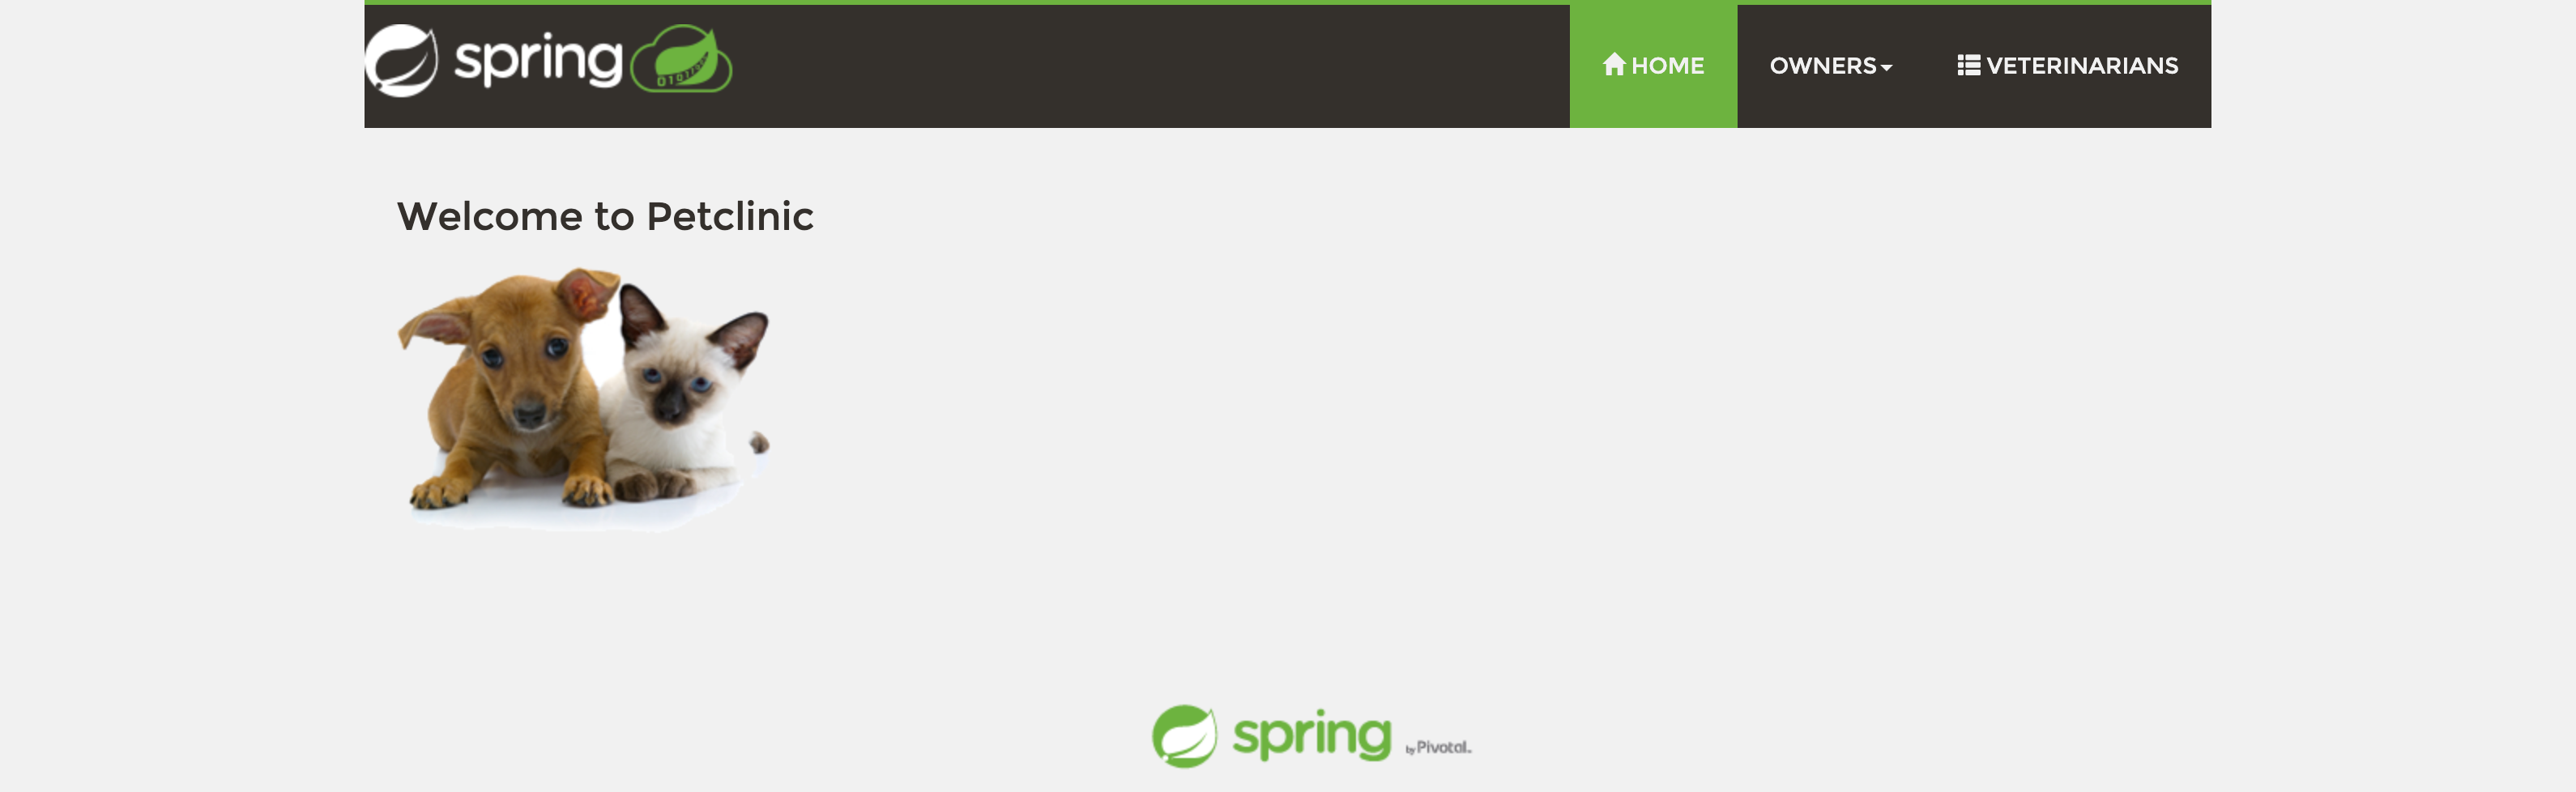
You can validate if the application is running by visiting http://<IP_ADDRESS>:81 (replace <IP_ADDRESS> with the IP address you obtained above). You should see the PetClinic application running.
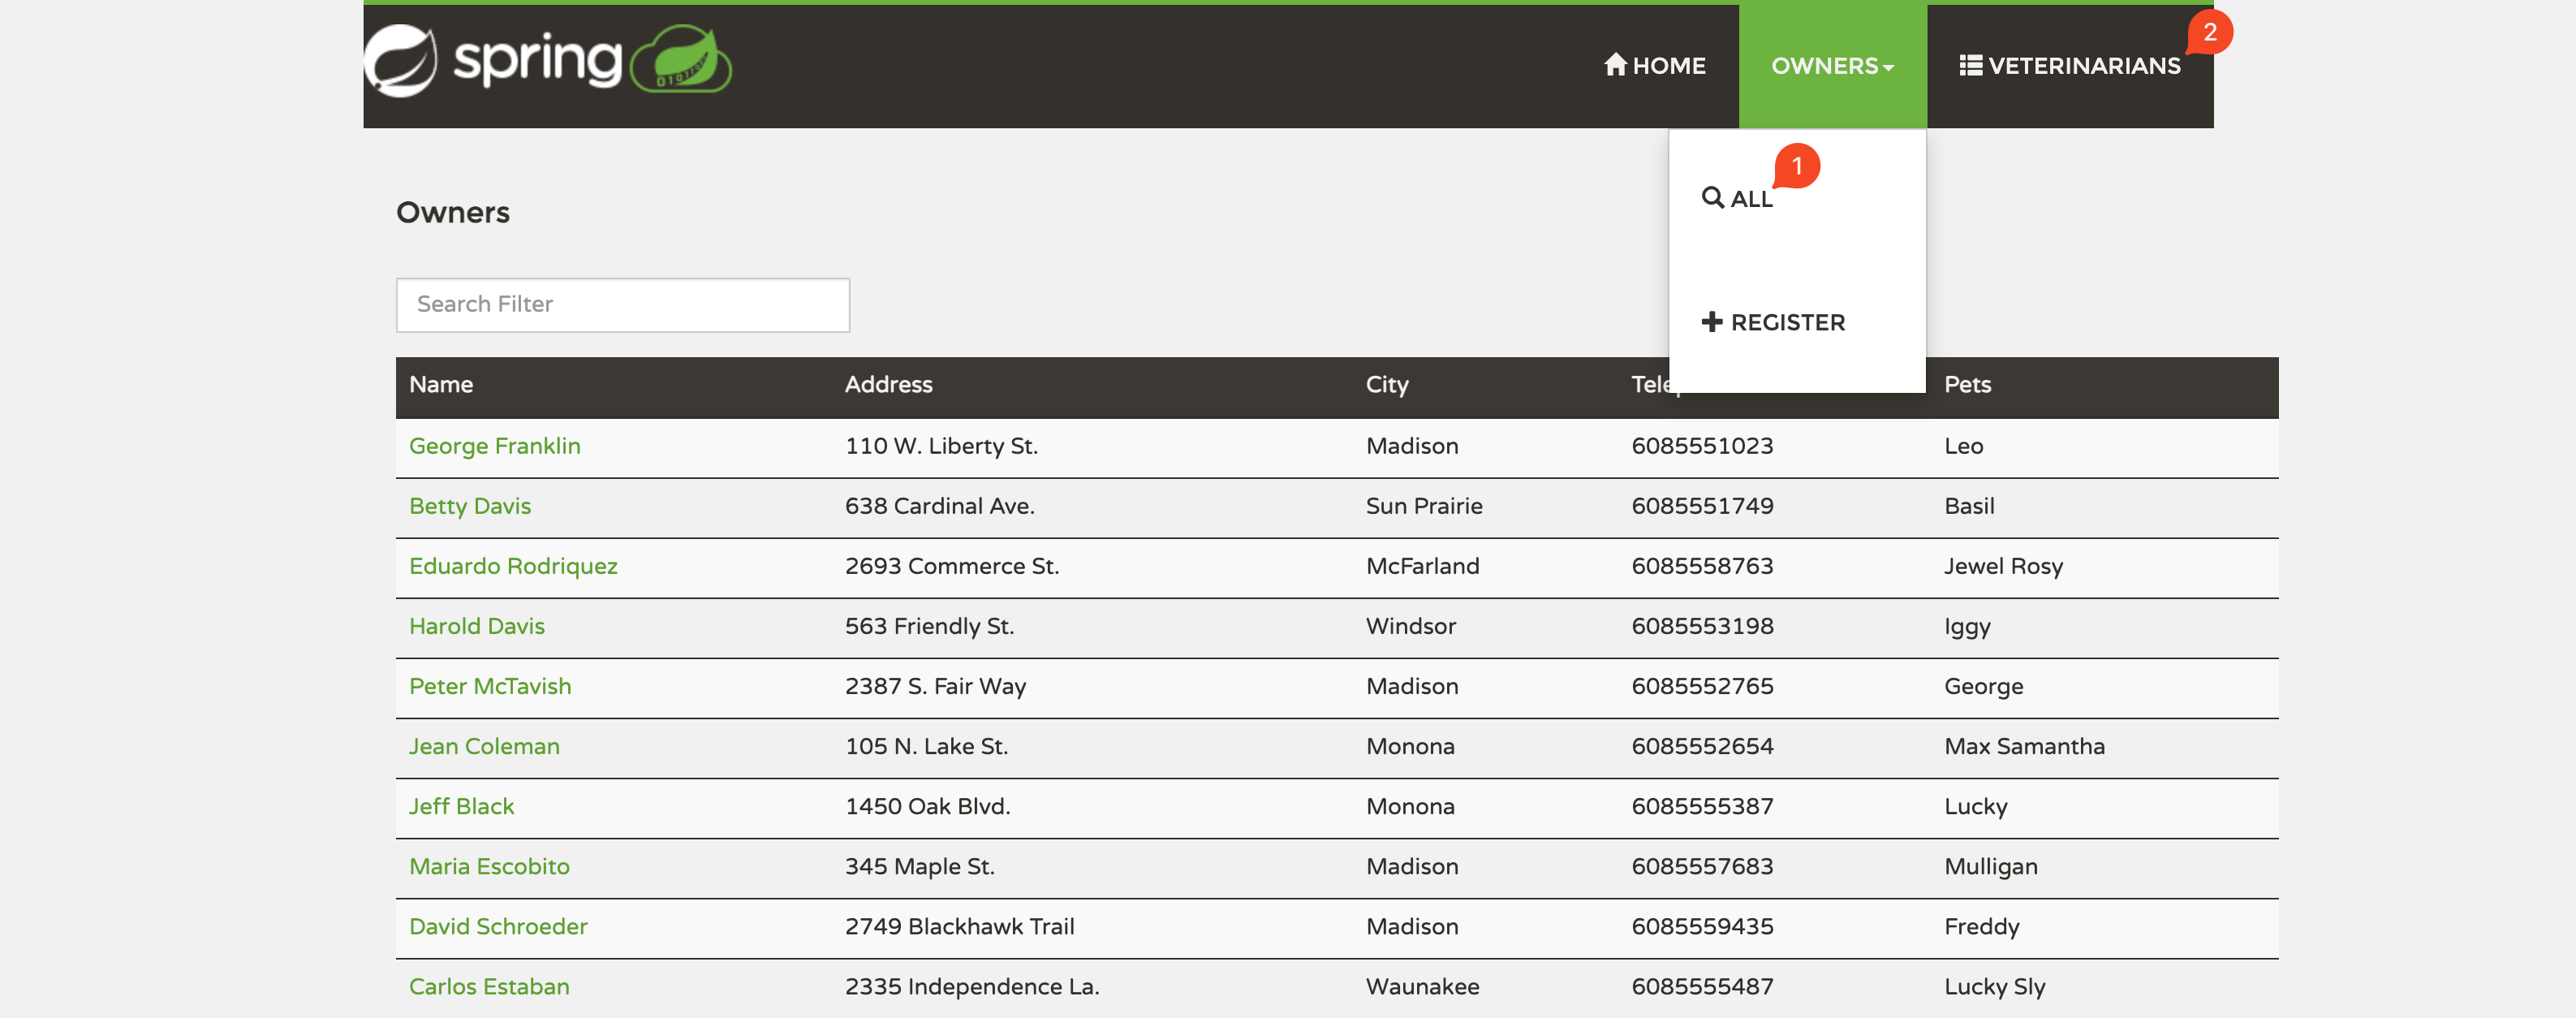
Make sure the application is working correctly by visiting the All Owners(1) and Veterinarians(2) tabs, you should get a list of names in each case.
Note
As each service needs to start up and synchronize with the database, it may take a few minutes for the application to fully start up.
Setting up automatic discovery and configuration for APM
10 minutes
In this section we will enable automatic discovery and configuration for the Java services running in Kubernetes. This means that the OpenTelemetry Collector will look for Pod annotations that indicate that the Java application should be instrumented with the Splunk OpenTelemetry Java agent. This will allow us to get traces, spans, and profiling data from the Java services running on the cluster.
automatic discovery and configuration
It is important to understand that automatic discovery and configuration is designed to get trace, span & profiling data out of your application, without requiring code changes or recompilation.
This is a great way to get started with APM, but it is not a replacement for manual instrumentation. Manual instrumentation allows you to add custom spans, tags, and logs to your application, which can provide more context and detail to your traces.
For Java applications the OpenTelemetry Collector will look for the annotation instrumentation.opentelemetry.io/inject-java.
The annotation can have the value set true or to the namespace/daemonset of the OpenTelemetry Collector e.g. default/splunk-otel-collector. This allows working across namespaces and what we will use in this workshop.
Using the deployment.yaml
If you want your Pods to send traces automatically, you can add the annotation to the deployment.yaml as shown below. This will add the instrumentation library during the initial deployment. To speed things up we have done that for the following Pods:
Subsections of Setting up automatic discovery and configuration for APM
Patching the Deployment
To configure automatic discovery and configuration the deployments need to be patched to add the instrumentation annotation. Once patched, the OpenTelemetry Collector will inject the automatic discovery and configuration library and the Pods will be restarted in order to start sending traces and profiling data. First, confirm that the api-gateway does not have the splunk-otel-java image.
Next, enable the Java automatic discovery and configuration for all of the services by adding the annotation to the deployments. The following command will patch the all deployments. This will trigger the OpenTelemetry Operator to inject the splunk-otel-java image into the Pods:
kubectl get deployments -l app.kubernetes.io/part-of=spring-petclinic -o name | xargs -I % kubectl patch % -p "{\"spec\": {\"template\":{\"metadata\":{\"annotations\":{\"instrumentation.opentelemetry.io/inject-java\":\"default/splunk-otel-collector\"}}}}}"
deployment.apps/config-server patched (no change)
deployment.apps/admin-server patched (no change)
deployment.apps/customers-service patched
deployment.apps/visits-service patched
deployment.apps/discovery-server patched (no change)
deployment.apps/vets-service patched
deployment.apps/api-gateway patched
There will be no change for the config-server, discovery-server and admin-server as these have already been patched.
To check the container image(s) of the api-gateway pod again, run the following command:
A new image has been added to the api-gateway which will pull splunk-otel-java from ghcr.io (if you see two api-gateway containers, the original one is probably still terminating, so give it a few seconds).
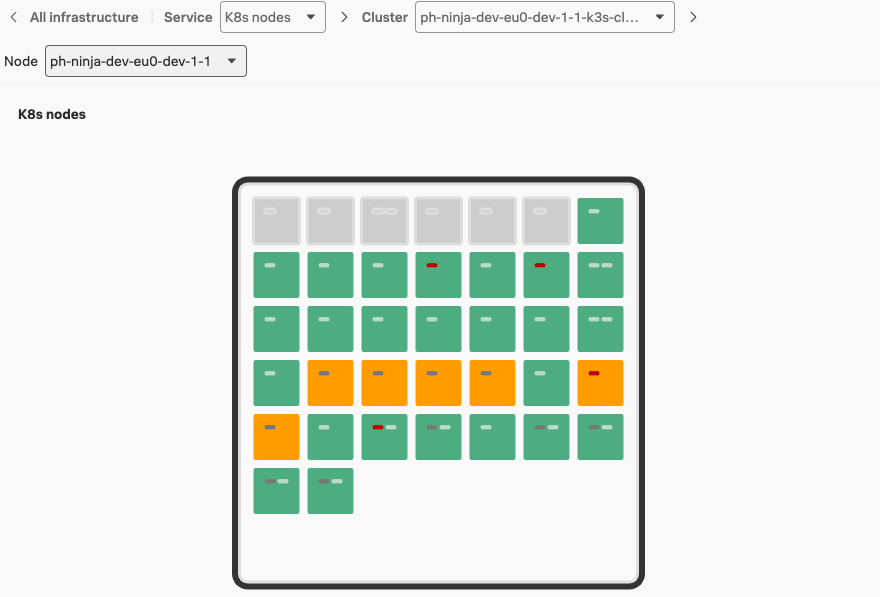
Navigate back to the Kubernetes Navigator in Splunk Observability Cloud. After a couple of minutes you will see that the Pods are being restarted by the operator and the automatic discovery and configuration container will be added. This will look similar to the screenshot below:
Wait for the Pods to turn green in the Kubernetes Navigator, then go tho the next section.
Viewing the data in Splunk APM
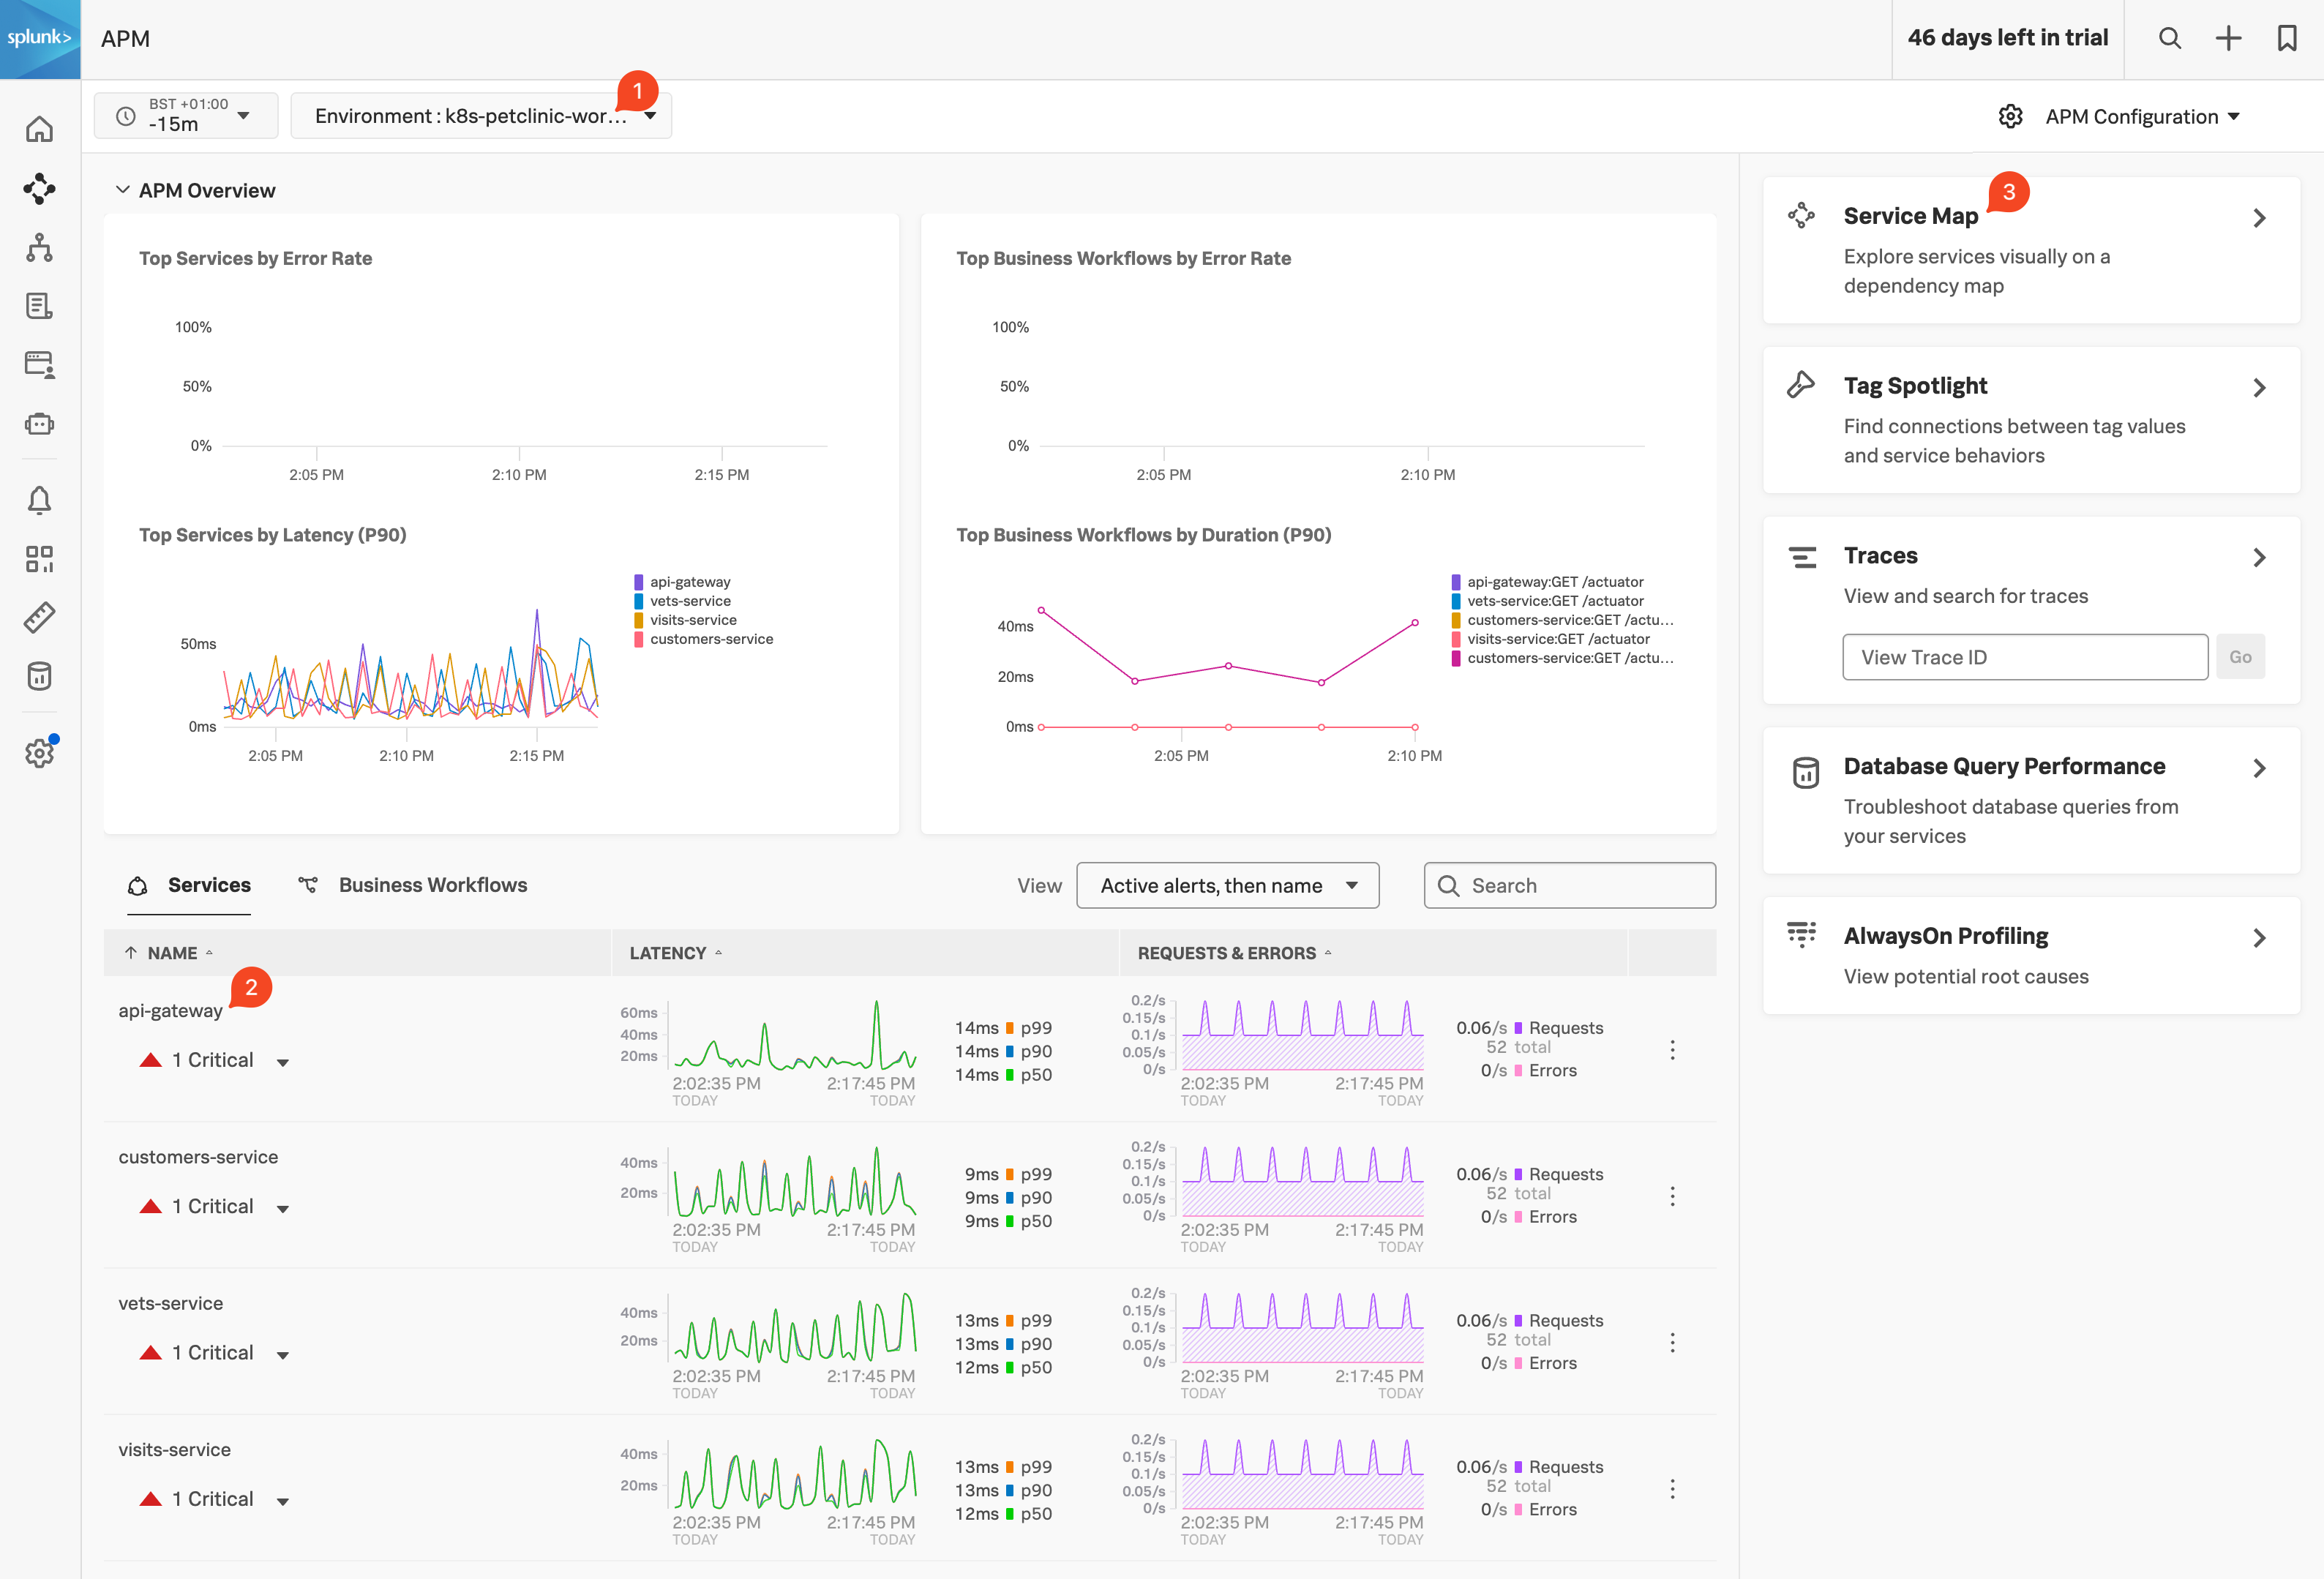
Log in to Splunk Observability Cloud, from the left-hand menu click on APM to see the data generated by the traces from the newly instrumented services. Change the Environment filter (1) to the name of your workshop instance in the dropdown box (this will be <INSTANCE>-workshop where INSTANCE is the value from the shell script you ran earlier) and make sure it is the only one selected.
You will see the name (2) of the api-gateway service and metrics in the Latency and Request & Errors charts (you can ignore the Critical Alert, as it is caused by the sudden request increase generated by the load generator). You will also see the rest of the services appear.
Once you see the Customer service, Vets service and Visits services like show in the screenshot above, let’s click on the Service Map(3) pane to get ready for the next section.
APM Features
15 minutes
As we have seen in the previous section, once you enable automatic discovery and configuration on your services, traces are sent to Splunk Observability Cloud.
With these traces, Splunk will automatically generate Service Maps and RED Metrics. These are the first steps in understanding the behavior of your services and how they interact with each other.
In this next section, we are going to examine the traces themselves and what information they provide to help you understand the behavior of your services all without touching your code.
Subsections of APM Features
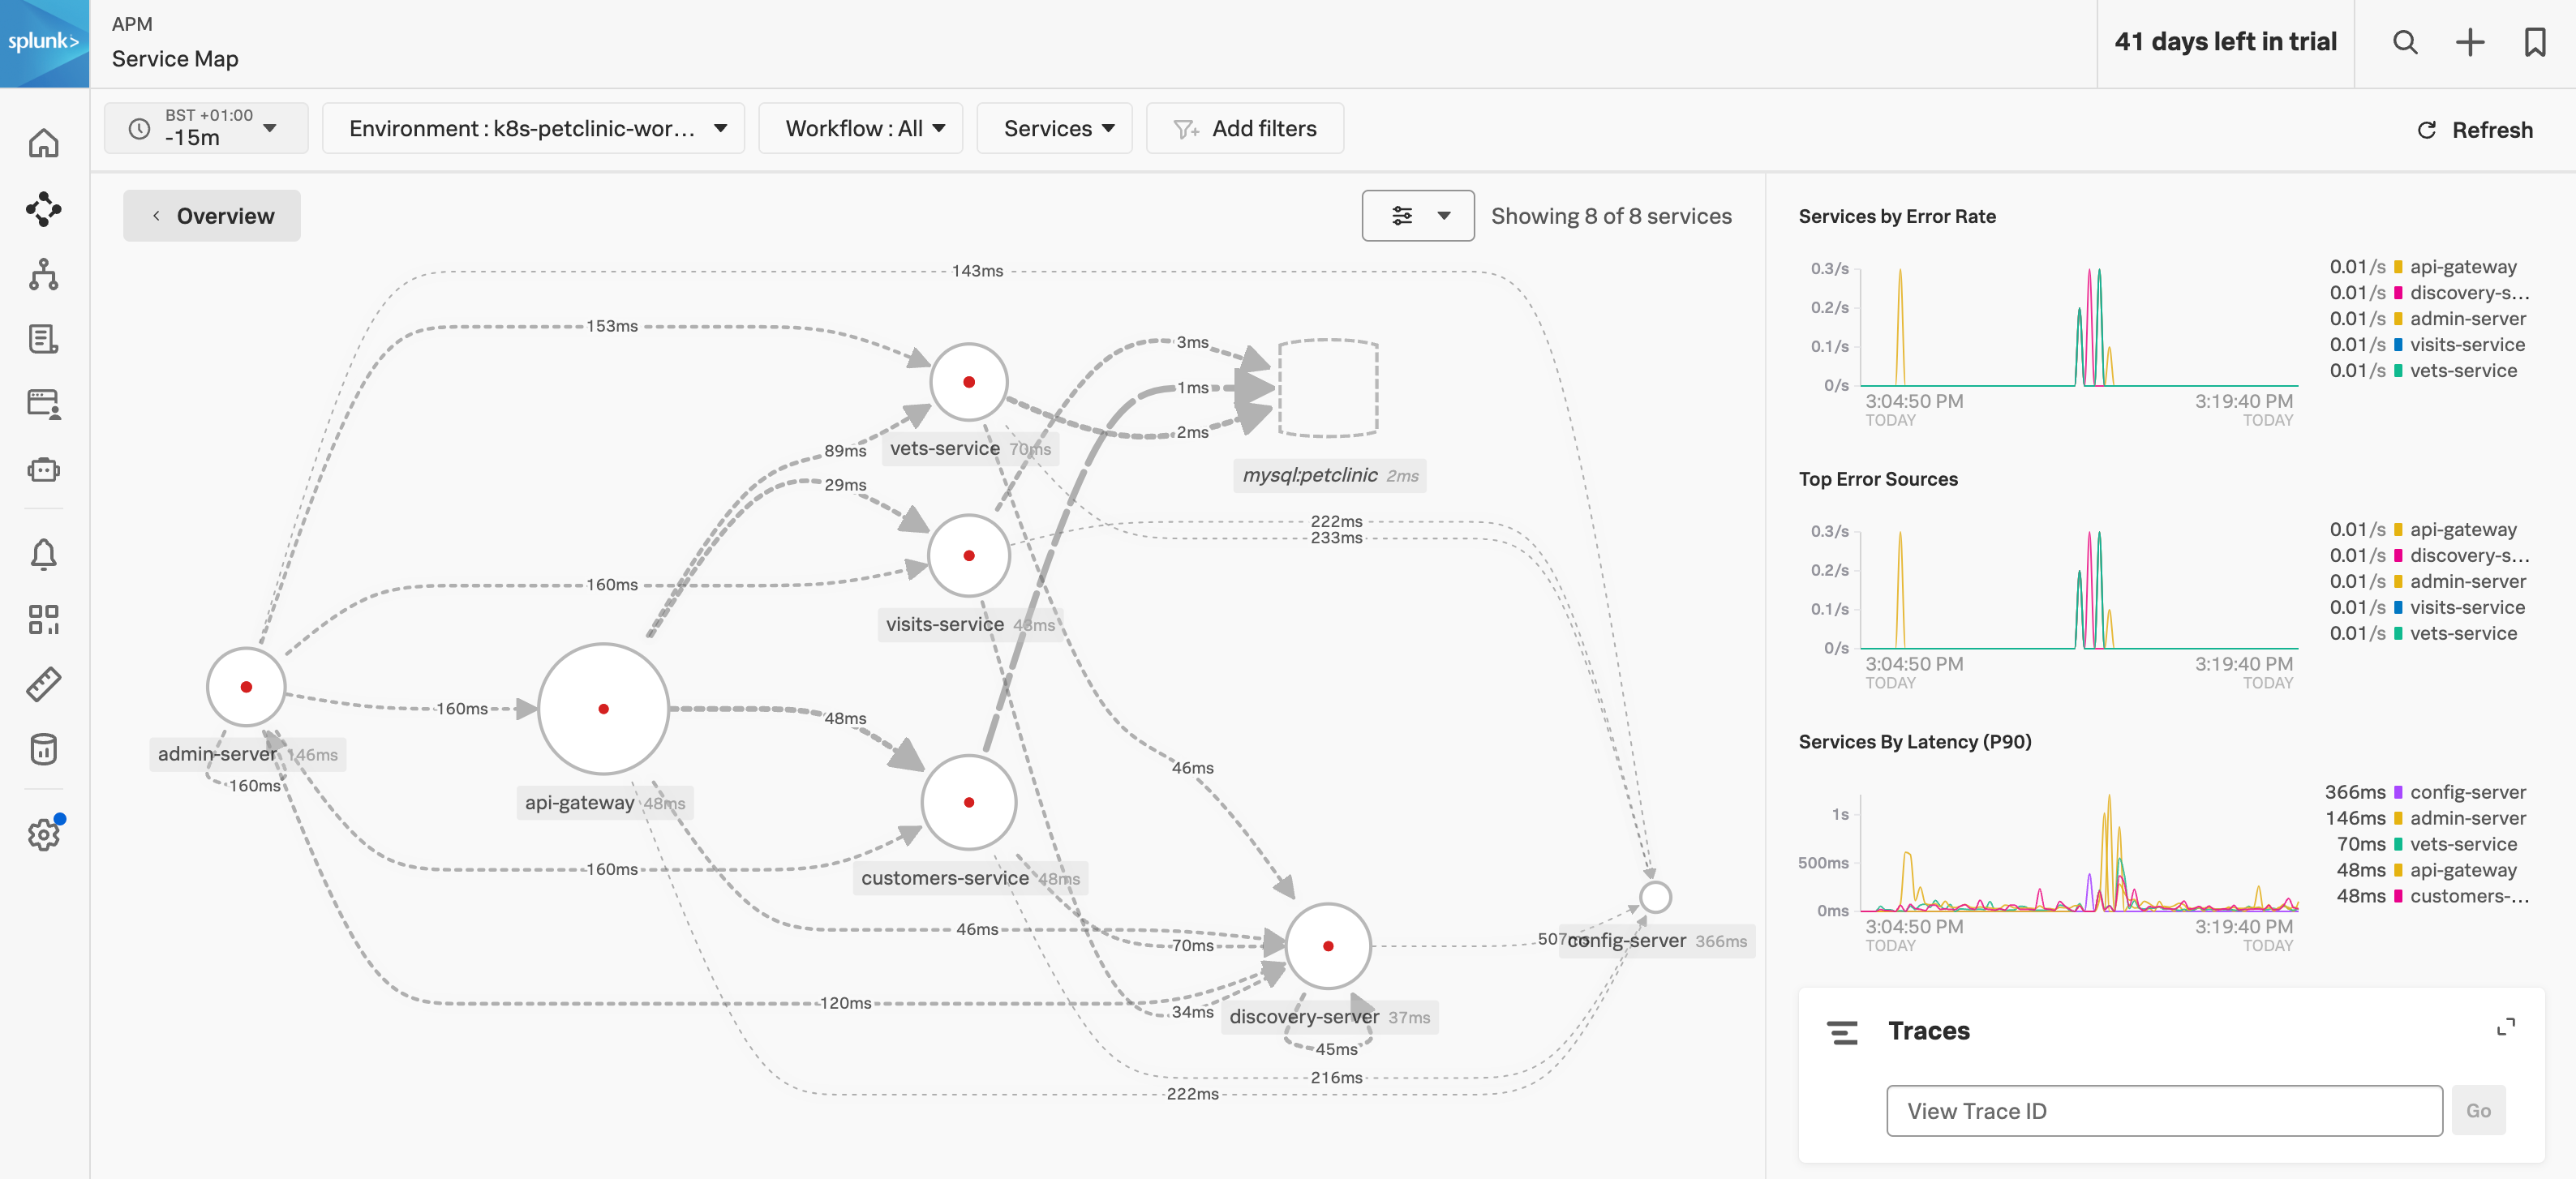
APM Service Map
The above map shows all the interactions between all of the services. The map may still be in an interim state as it will take the Petclinic Microservice application a few minutes to start up and fully synchronize. Reducing the time filter to a custom time of 2 minutes will help. The initial startup-related errors (red dots) will eventually disappear.
Next, let’s examine the metrics that are available for each service that is instrumented and visit the request, error, and duration (RED) metrics Dashboard
For this exercise we are going to use a common scenario you would use if the service operation was showing high latency, or errors for example.
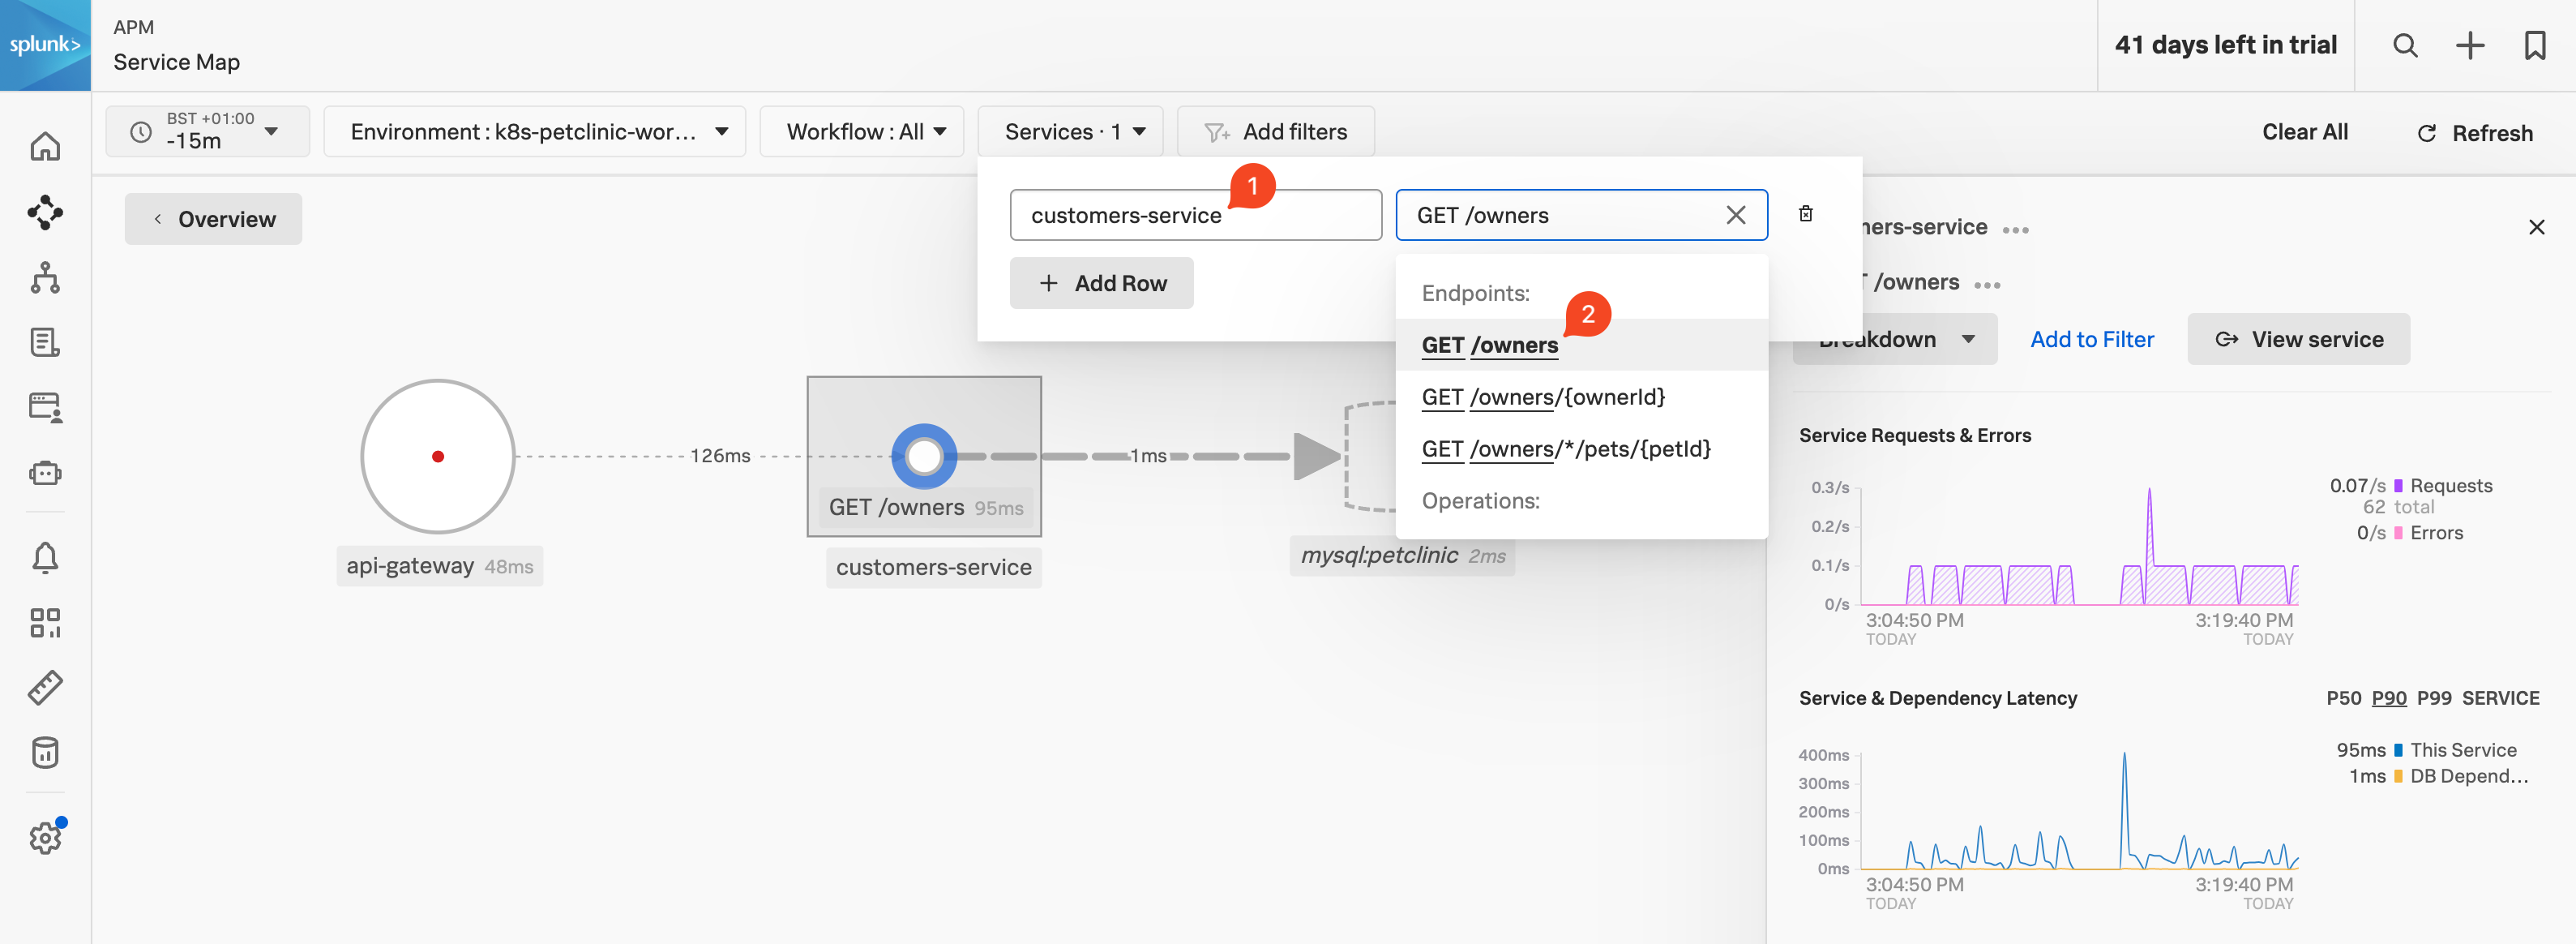
Select (click) on the Customer Service in the Dependency map (1), then make sure the customers-service is selected in the Services dropdown box (2). Next, select GET /Owners from the Operations dropdown (3)**.
This should give you the workflow with a filter on GET /owners(1) as shown below.
APM Trace
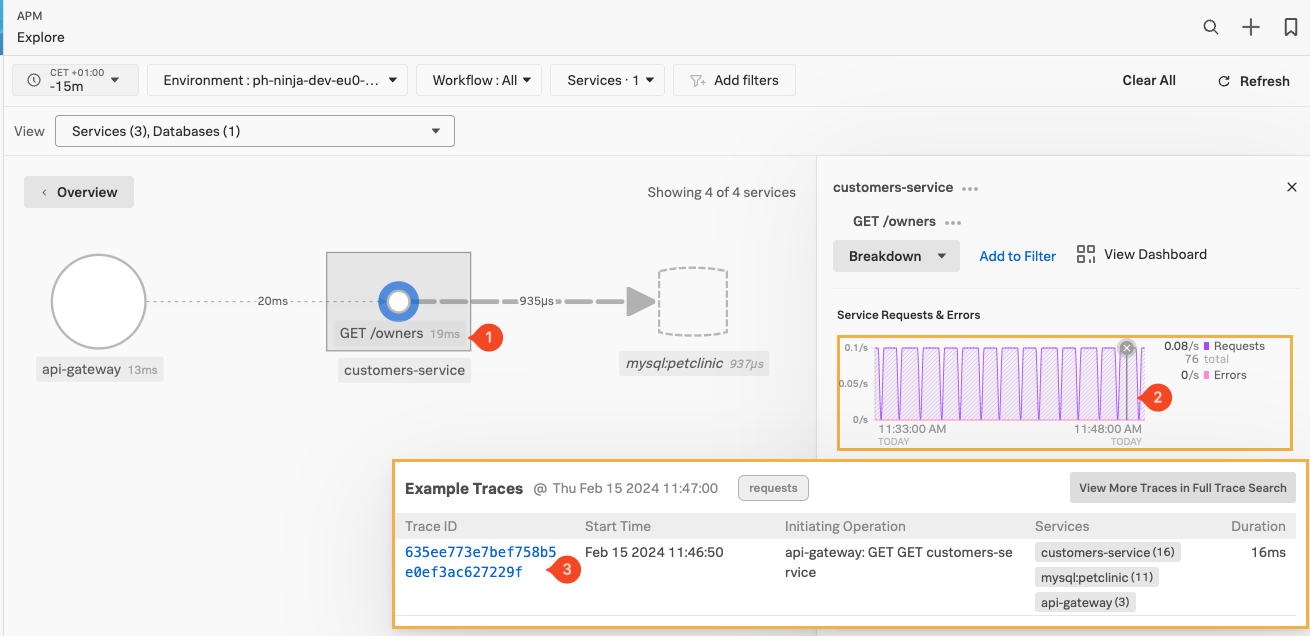
To pick a trace, select a line in the Service Requests & Errors chart (2), when the dot appears click to get a list of sample traces:
Once you have the list of sample traces, click on the blue (3) Trace ID Link (make sure it has the same three services mentioned in the Service Column.)
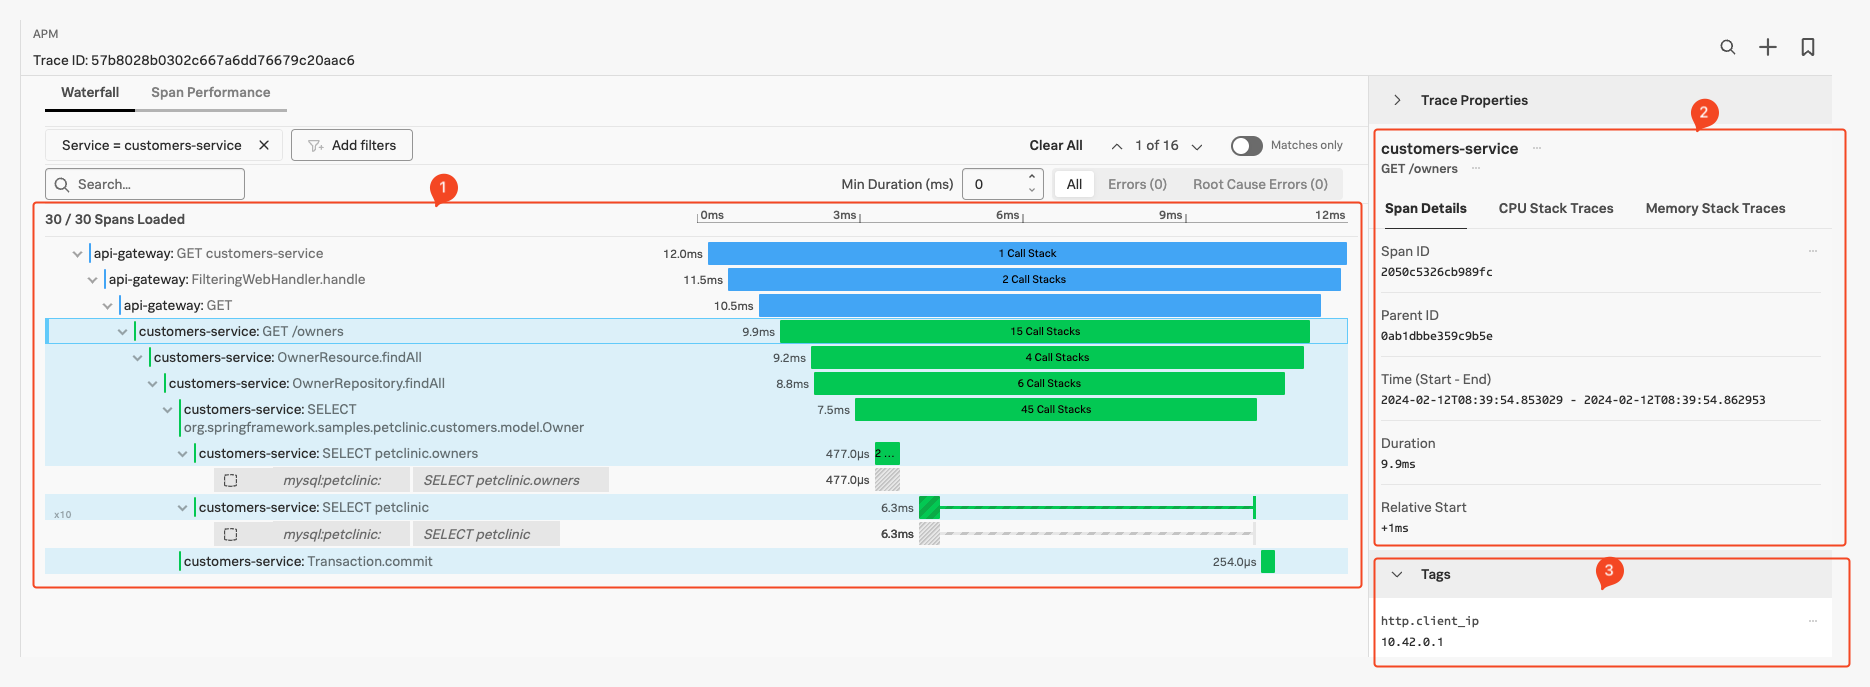
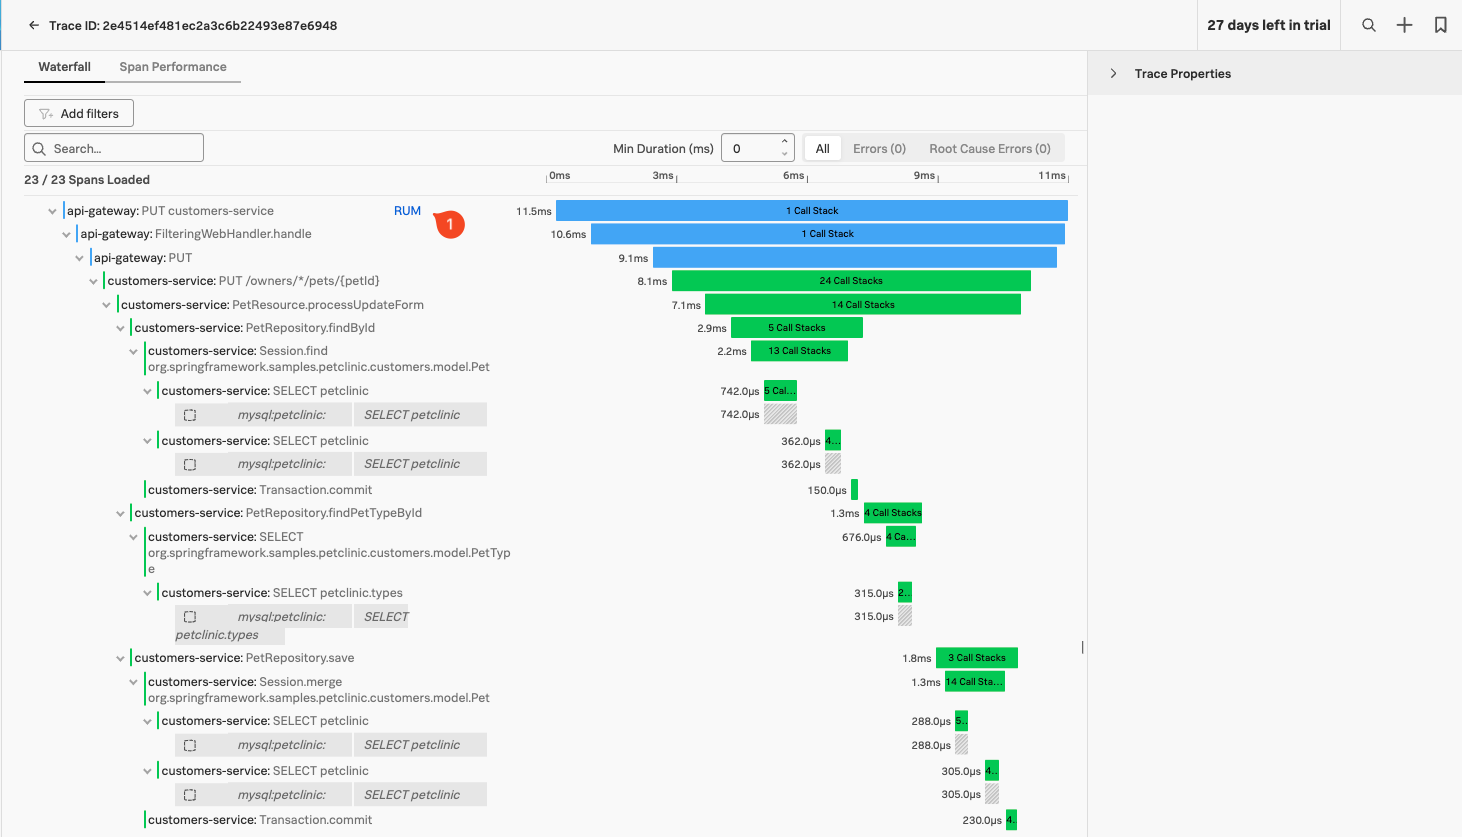
This brings us the the Trace selected in the Waterfall view:
Here we find several sections:
The actual Waterfall Pane (1), where you see the trace and all the instrumented functions visible as spans, with their duration representation and order/relationship showing.
The Trace Info Pane (2), by default, shows the selected Span information (highlighted with a box around the Span in the Waterfall Pane).
The Span Pane (3), here you can find all the Tags that have been sent in the selected Span, You can scroll down to see all of them.
The process Pane, with tags related to the process that created the Span (scroll down to see as it is not in the screenshot).
The Trace Properties at the top of the right-hand pane by default is collapsed as shown.
APM Span
While we examine our spans, let’s look at several features that you get out of the box without code modifications when using automatic discovery and configuration on top of tracing:
Due to the fact there are several different routes
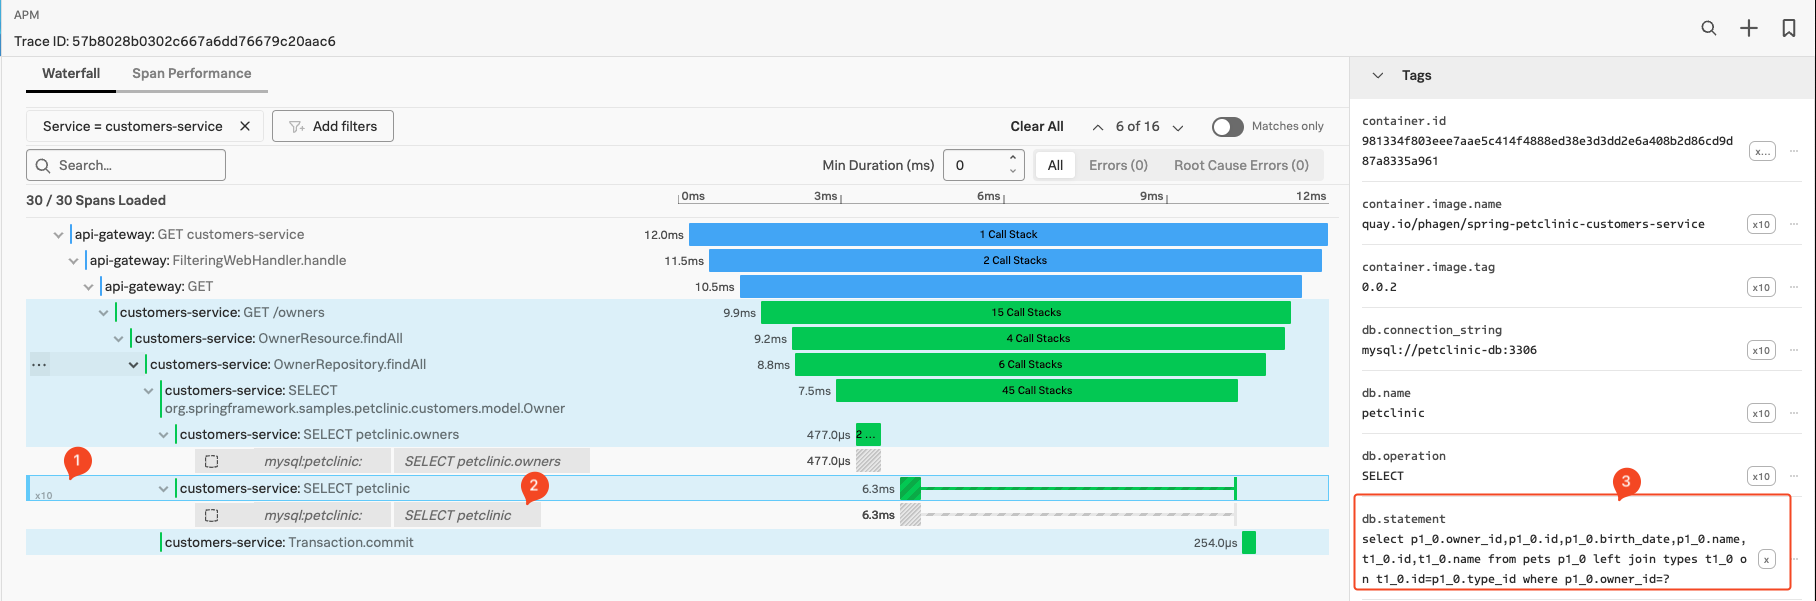
First, in the Waterfall Pane, make sure the customers-service:SELECT petclinic.owners or similar span is selected as shown in the screenshot below:
The basic latency information is shown as a bar for the instrumented function or call, in our example, it took 6.3 Milliseconds.
Several similar Spans (1), are only visible if the span is repeated multiple times. In this case, there are 10 repeats in our example. (You can show/hide them all by clicking on the 10x and all spans will show in order)
Inferred Services: Calls made to external systems that are not instrumented, show up as a grey ‘inferred’ span. The Inferred Service or span in our case here is a call to the Mysql Database mysql:petclinic SELECT petclinic(2) as shown above our selected span.
Span Tags: In the Tag Pane, standard tags produced by the automatic discovery and configuration. In this case, the span is calling a Database, so it includes the db.statement tag (3). This tag will hold the DB query statement and is used by the Database call performed during this span. This will be used by the DB-Query Performance feature. We look at DB-Query Performance in the next section.
Always-on Profiling: IF the system is configured to and has captured Profiling data during a Span life cycle, it will show the number of Call Stacks captured in the Spans timeline (15 Call Stacks for the customers-service:SELECT petclinic.owners Span shown above).
We will look at Profiling in the next section.
Service Centric View
Splunk APM provide Service Centric Views that provide engineers a deep understanding of service performance in one centralized view. Now, across every service, engineers can quickly identify errors or bottlenecks from a service’s underlying infrastructure, pinpoint performance degradations from new deployments, and visualize the health of every third party dependency.
To see this dashboard for the api-gateway, make sure you have the api-gateway service selected in the Service Map, then click on the *View Service button in the top of the right-hand pane. This will bring you to the Service Centric View dashboard:
This view, which is available for each of your instrumented services, offers an overview of Service metrics, Runtime metrics and Infrastructure metrics.
You can select the *Back function of you browser to go back to the previous view.
Always-On Profiling & DB Query Performance
15 minutes
As we have seen in the previous chapter, you can trace your interactions between the various services using APM without touching your code, which will allow you to identify issues faster.
However, besides tracing automatic discovery and configuration offers additional features out of the box that can help you find issues even faster. In this section we are going to look at two of them:
Always-on Profiling and Java Metrics
Database Query Performance
If you want to dive deeper into Always-on Profiling or DB-Query performance, we have a separate Ninja Workshop called Debug Problems in Microservices that you can follow.
Subsections of Always-On Profiling & DB Query Performance
Always-On Profiling & Metrics
When we installed the Splunk Distribution of the OpenTelemetry Collector using the Helm chart earlier, we configured it to enable AlwaysOn Profiling and Metrics. This means that the collector will automatically generate CPU and Memory profiles for the application and send them to Splunk Observability Cloud.
When you deploy the PetClinic application and set the annotation, the collector automatically detects the application and instruments it for traces and profiling. We can verify this by examining the startup logs of one of the Java containers we are instrumenting by running the following script:
The logs should show what flags were picked up by the Java automatic discovery and configuration:
. ~/workshop/petclinic/scripts/get_logs.sh
2024/02/15 09:42:00 Problem with dial: dial tcp 10.43.104.25:8761: connect: connection refused. Sleeping 1s
2024/02/15 09:42:01 Problem with dial: dial tcp 10.43.104.25:8761: connect: connection refused. Sleeping 1s
2024/02/15 09:42:02 Connected to tcp://discovery-server:8761
Picked up JAVA_TOOL_OPTIONS:  -javaagent:/otel-auto-instrumentation-java/javaagent.jar
Picked up _JAVA_OPTIONS: -Dspring.profiles.active=docker,mysql -Dsplunk.profiler.call.stack.interval=150
OpenJDK 64-Bit Server VM warning: Sharing is only supported for boot loader classes because bootstrap classpath has been appended
[otel.javaagent 2024-02-15 09:42:03:056 +0000] [main] INFO io.opentelemetry.javaagent.tooling.VersionLogger - opentelemetry-javaagent - version: splunk-1.30.1-otel-1.32.1
[otel.javaagent 2024-02-15 09:42:03:768 +0000] [main] INFO com.splunk.javaagent.shaded.io.micrometer.core.instrument.push.PushMeterRegistry - publishing metrics for SignalFxMeterRegistry every 30s
[otel.javaagent 2024-02-15 09:42:07:478 +0000] [main] INFO com.splunk.opentelemetry.profiler.ConfigurationLogger - -----------------------
[otel.javaagent 2024-02-15 09:42:07:478 +0000] [main] INFO com.splunk.opentelemetry.profiler.ConfigurationLogger - Profiler configuration:
[otel.javaagent 2024-02-15 09:42:07:480 +0000] [main] INFO com.splunk.opentelemetry.profiler.ConfigurationLogger -                  splunk.profiler.enabled : true
[otel.javaagent 2024-02-15 09:42:07:505 +0000] [main] INFO com.splunk.opentelemetry.profiler.ConfigurationLogger -                splunk.profiler.directory : /tmp
[otel.javaagent 2024-02-15 09:42:07:505 +0000] [main] INFO com.splunk.opentelemetry.profiler.ConfigurationLogger -       splunk.profiler.recording.duration : 20s
[otel.javaagent 2024-02-15 09:42:07:506 +0000] [main] INFO com.splunk.opentelemetry.profiler.ConfigurationLogger -               splunk.profiler.keep-files : false
[otel.javaagent 2024-02-15 09:42:07:510 +0000] [main] INFO com.splunk.opentelemetry.profiler.ConfigurationLogger -            splunk.profiler.logs-endpoint : http://10.13.2.38:4317
[otel.javaagent 2024-02-15 09:42:07:513 +0000] [main] INFO com.splunk.opentelemetry.profiler.ConfigurationLogger -              otel.exporter.otlp.endpoint : http://10.13.2.38:4317
[otel.javaagent 2024-02-15 09:42:07:513 +0000] [main] INFO com.splunk.opentelemetry.profiler.ConfigurationLogger -           splunk.profiler.memory.enabled : true
[otel.javaagent 2024-02-15 09:42:07:515 +0000] [main] INFO com.splunk.opentelemetry.profiler.ConfigurationLogger -             splunk.profiler.tlab.enabled : true
[otel.javaagent 2024-02-15 09:42:07:516 +0000] [main] INFO com.splunk.opentelemetry.profiler.ConfigurationLogger -        splunk.profiler.memory.event.rate : 150/s
[otel.javaagent 2024-02-15 09:42:07:516 +0000] [main] INFO com.splunk.opentelemetry.profiler.ConfigurationLogger -      splunk.profiler.call.stack.interval : PT0.15S
[otel.javaagent 2024-02-15 09:42:07:517 +0000] [main] INFO com.splunk.opentelemetry.profiler.ConfigurationLogger -  splunk.profiler.include.internal.stacks : false
[otel.javaagent 2024-02-15 09:42:07:517 +0000] [main] INFO com.splunk.opentelemetry.profiler.ConfigurationLogger -      splunk.profiler.tracing.stacks.only : false
[otel.javaagent 2024-02-15 09:42:07:517 +0000] [main] INFO com.splunk.opentelemetry.profiler.ConfigurationLogger - -----------------------
[otel.javaagent 2024-02-15 09:42:07:518 +0000] [main] INFO com.splunk.opentelemetry.profiler.JfrActivator - Profiler is active.
We are interested in the section written by the com.splunk.opentelemetry.profiler.ConfigurationLogger or the Profiling Configuration.
We can see the various settings you can control, some that are useful depending on your use case like the splunk.profiler.directory - The location where the agent writes the call stacks before sending them to Splunk. This may be different depending on how you configure your containers.
Another parameter you may want to change is splunk.profiler.call.stack.interval This is how often the system takes a CPU Stack trace. You may want to reduce this if you have short spans like we have in our application. (we kept the default as the spans in this demo application are extremely short, so Span may not always have a CPU Call Stack related to it.)
You can find how to set these parameters here. Below, is how you set a higher collection rate for call stack in your deployment.yaml, exactly how to pass any JAVA option to the Java application running in your container:
If you don’t see those lines as a result of the script, the startup may have taken too long and generated too many connection errors, try looking at the logs directly with kubectl or the k9s utility that is installed.
Always-On Profiling in the Trace Waterfall
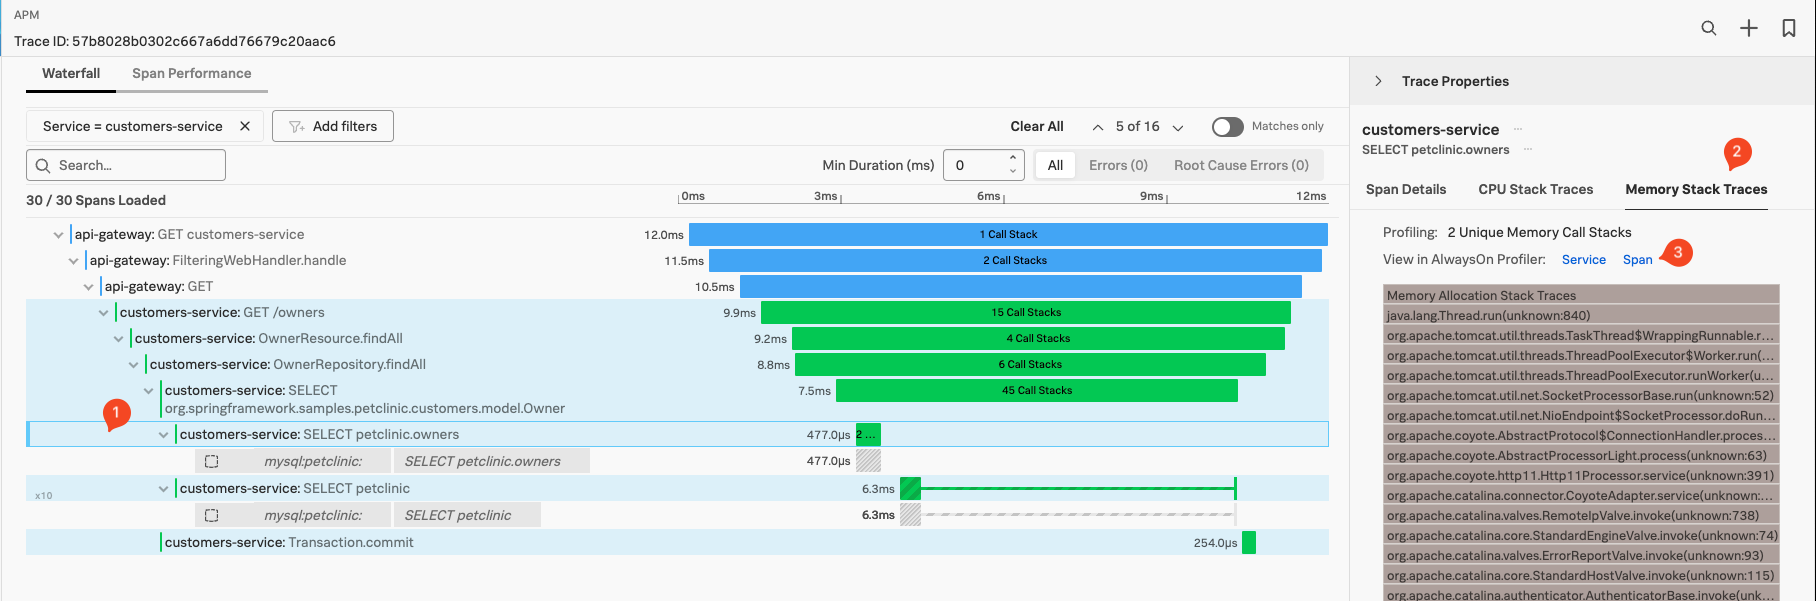
Make sure you have your original (or similar) Trace & Span (1) selected in the APM Waterfall view and select Memory Stack Traces (2) from the right-hand pane:
The pane should show you the Memory Stack Trace Flame Graph (3), you can scroll down and/or make the pane for a better view by dragging the right side of the pane.
As AlwaysOn Profiling is constantly taking snapshots, or stack traces, of your application’s code and reading through thousands of stack traces is not practical, AlwaysOn Profiling aggregates and summarizes profiling data, providing a convenient way to explore Call Stacks in a view called the Flame Graph. It represents a summary of all stack traces captured from your application. You can use the Flame Graph to discover which lines of code might be causing performance issues and to confirm whether the changes you make to the code have the intended effect.
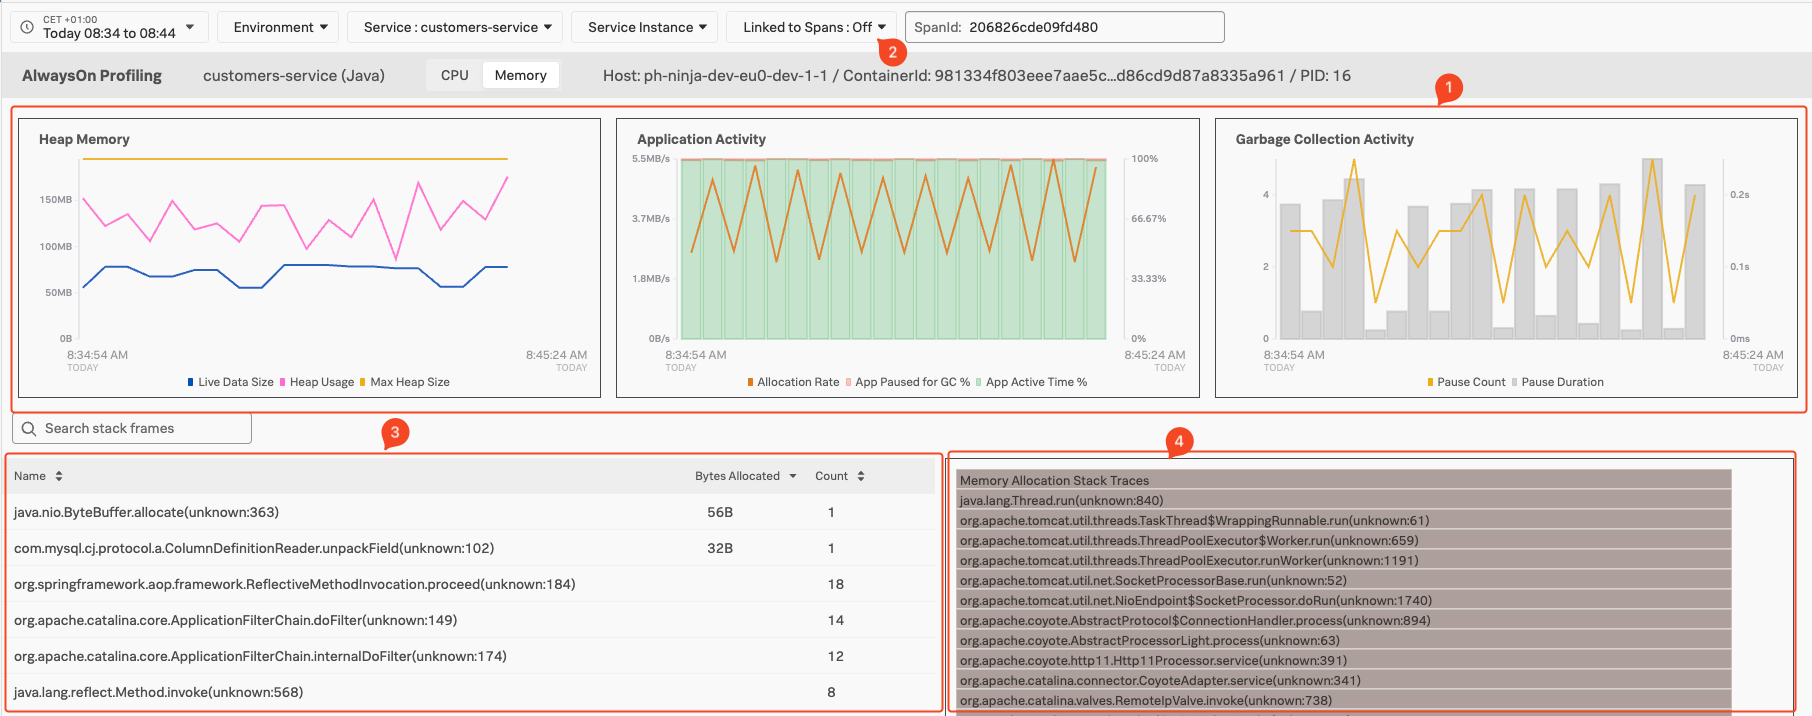
To dive deeper into the Always-on Profiling, select Span (3) in the Profiling Pane under Memory Stack Traces
This will bring you to the Always-on Profiling main screen, with the Memory view pre-selected:
Java Memory Metric Charts (1), Allow you to Monitor Heap Memory, Application Activity like Memory Allocation Rate and Garbage Collecting Metrics.
Ability to focus/see metrics and Stack Traces only related to the Span (2), This will filter out background activities running in the Java application if required.
Java Function calls identified. (3), allowing you to drill down into the Methods called from that function.
The Flame Graph (4), with the visualization of hierarchy based on the stack traces of the profiled service.
For further investigation the UI let’s you grab the actual stack trace, so you can use in your coding platform to go to the actual lines of code used at this point (depending of course on your preferred Coding platform)
Database Query Performance
With Database Query Performance, you can monitor the impact of your database queries on service availability directly in Splunk APM. This way, you can quickly identify long-running, unoptimized, or heavy queries and mitigate issues they might be causing, without having to instrument your databases.
To look at the performance of your database queries, make sure you are on the APM Explore page either by going back in the browser or navigating to the APM section in the Menu bar, then click on the Explore tile.
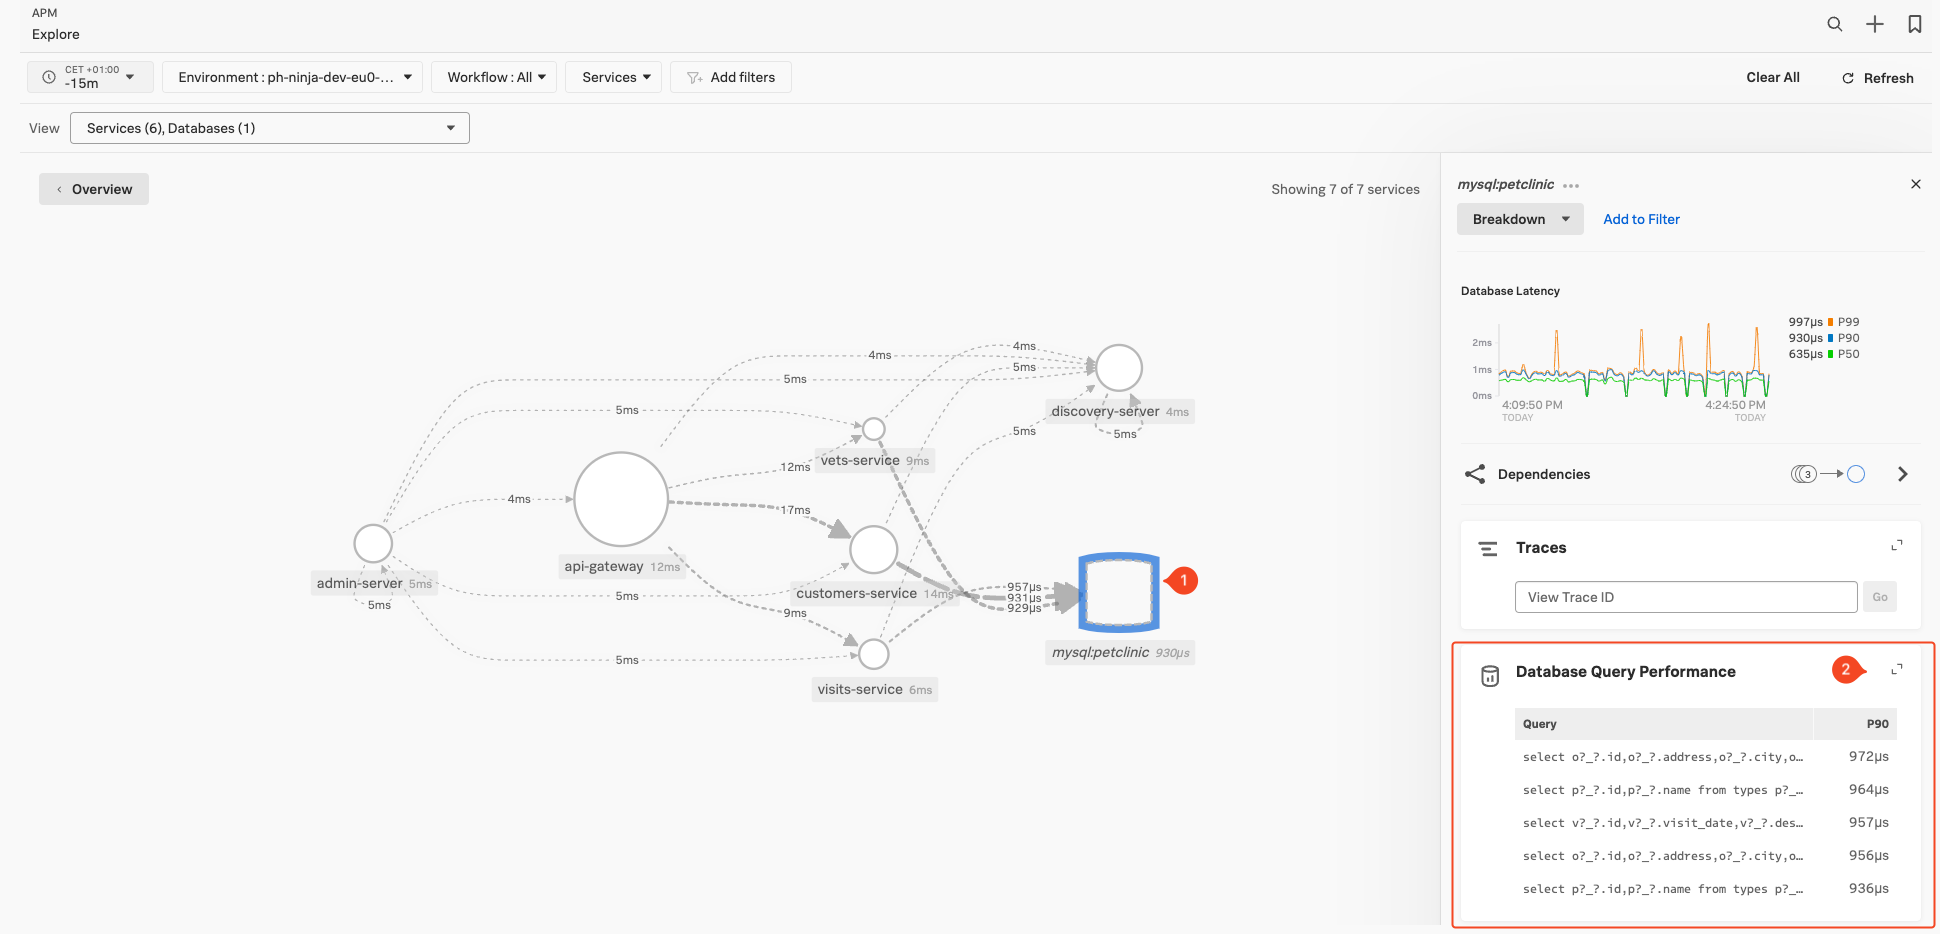
Select the inferred database service mysql:petclinic Inferred Database server in the Dependency map (1), then scroll the right-hand pane to find the Database Query Performance Pane (2).
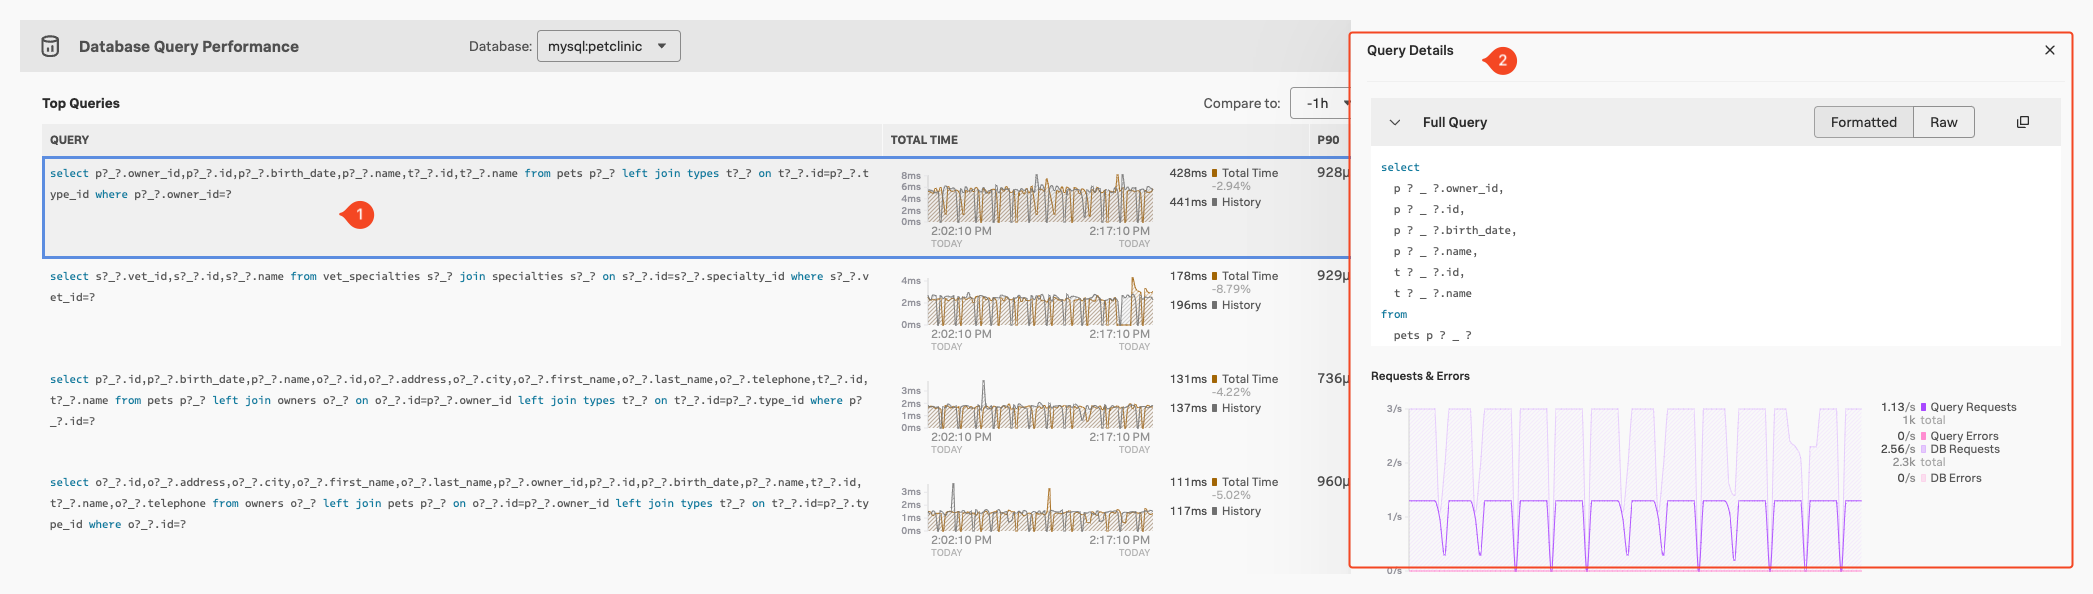
If the service you have selected in the map is indeed an (inferred) database server, this pane will populate with the top 90% (P90) database calls based on duration. To dive deeper into the db-query performance function click somewhere on the word Database Query Performance at the top of the pane.
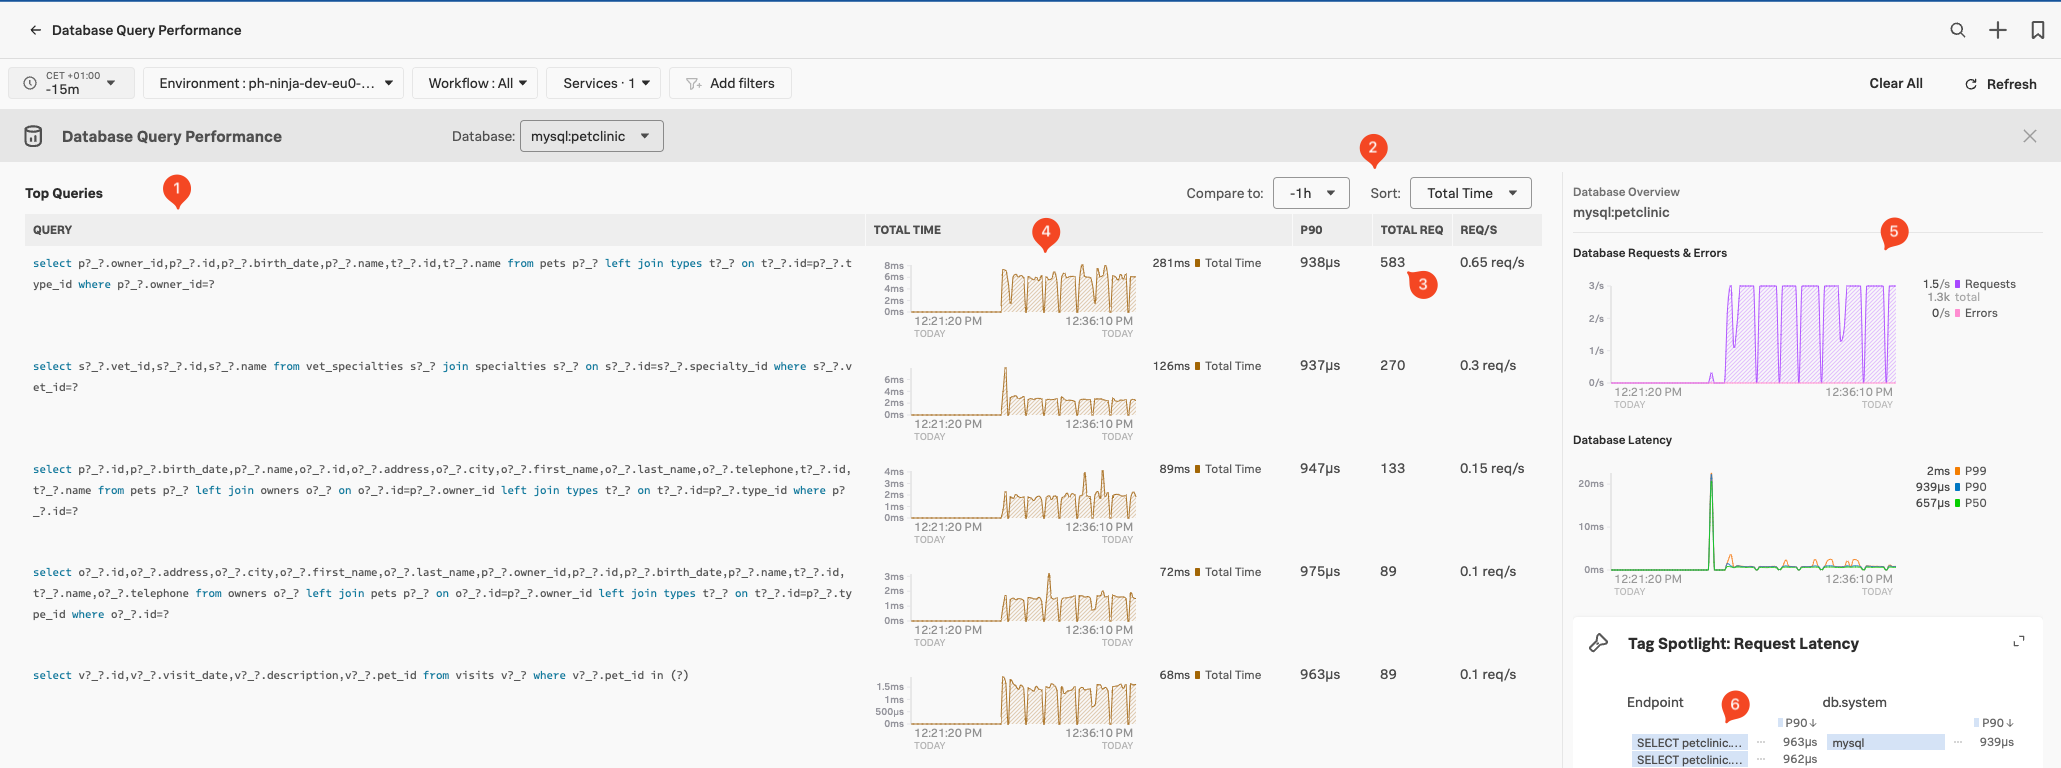
This will bring us to the DB-query Performance overview screen:
Database Query Normalization
By default, Splunk APM instrumentation sanitizes database queries to remove or mask sensible data, such as secrets or personally identifiable information (PII) from the db.statements. You can find how to turn off database query normalization here.
This screen will show us all the Database queries (1) done towards our database from your application, based on the Traces & Spans sent to the Splunk Observability Cloud. Note that you can compare them across a time block or sort them on Total Time, P90 Latency & Requests (2).
For each Database query in the list, we see the highest latency, the total number of calls during the time window and the number of requests per second (3). This allows you to identify places where you might optimize your queries.
You can select traces containing Database Calls via the two charts in the right-hand pane (5). Use the Tag Spotlight pane (6) to drill down what tags are related to the database calls, based on endpoints or tags.
If you click on a specific Query (1) you get a detailed query Details pane appears (2), which you can use for more detailed investigations:
Log Observer
10 minutes
Up until this point, there have been no code changes, yet tracing, profiling and Database Query Performance data is being sent to Splunk Observability Cloud.
Next we will work with the Splunk Log Observer to the mix to obtain log data from the Spring PetClinic application.
The Splunk OpenTelemetry Collector automatically collects logs from the Spring PetClinic application and sends them to Splunk Observability Cloud using the OTLP exporter, annotating the log events with trace_id, span_id and trace flags.
The Splunk Log Observer is then used to view the logs and with the changes to the log format the platform can automatically correlate log information with services and traces.
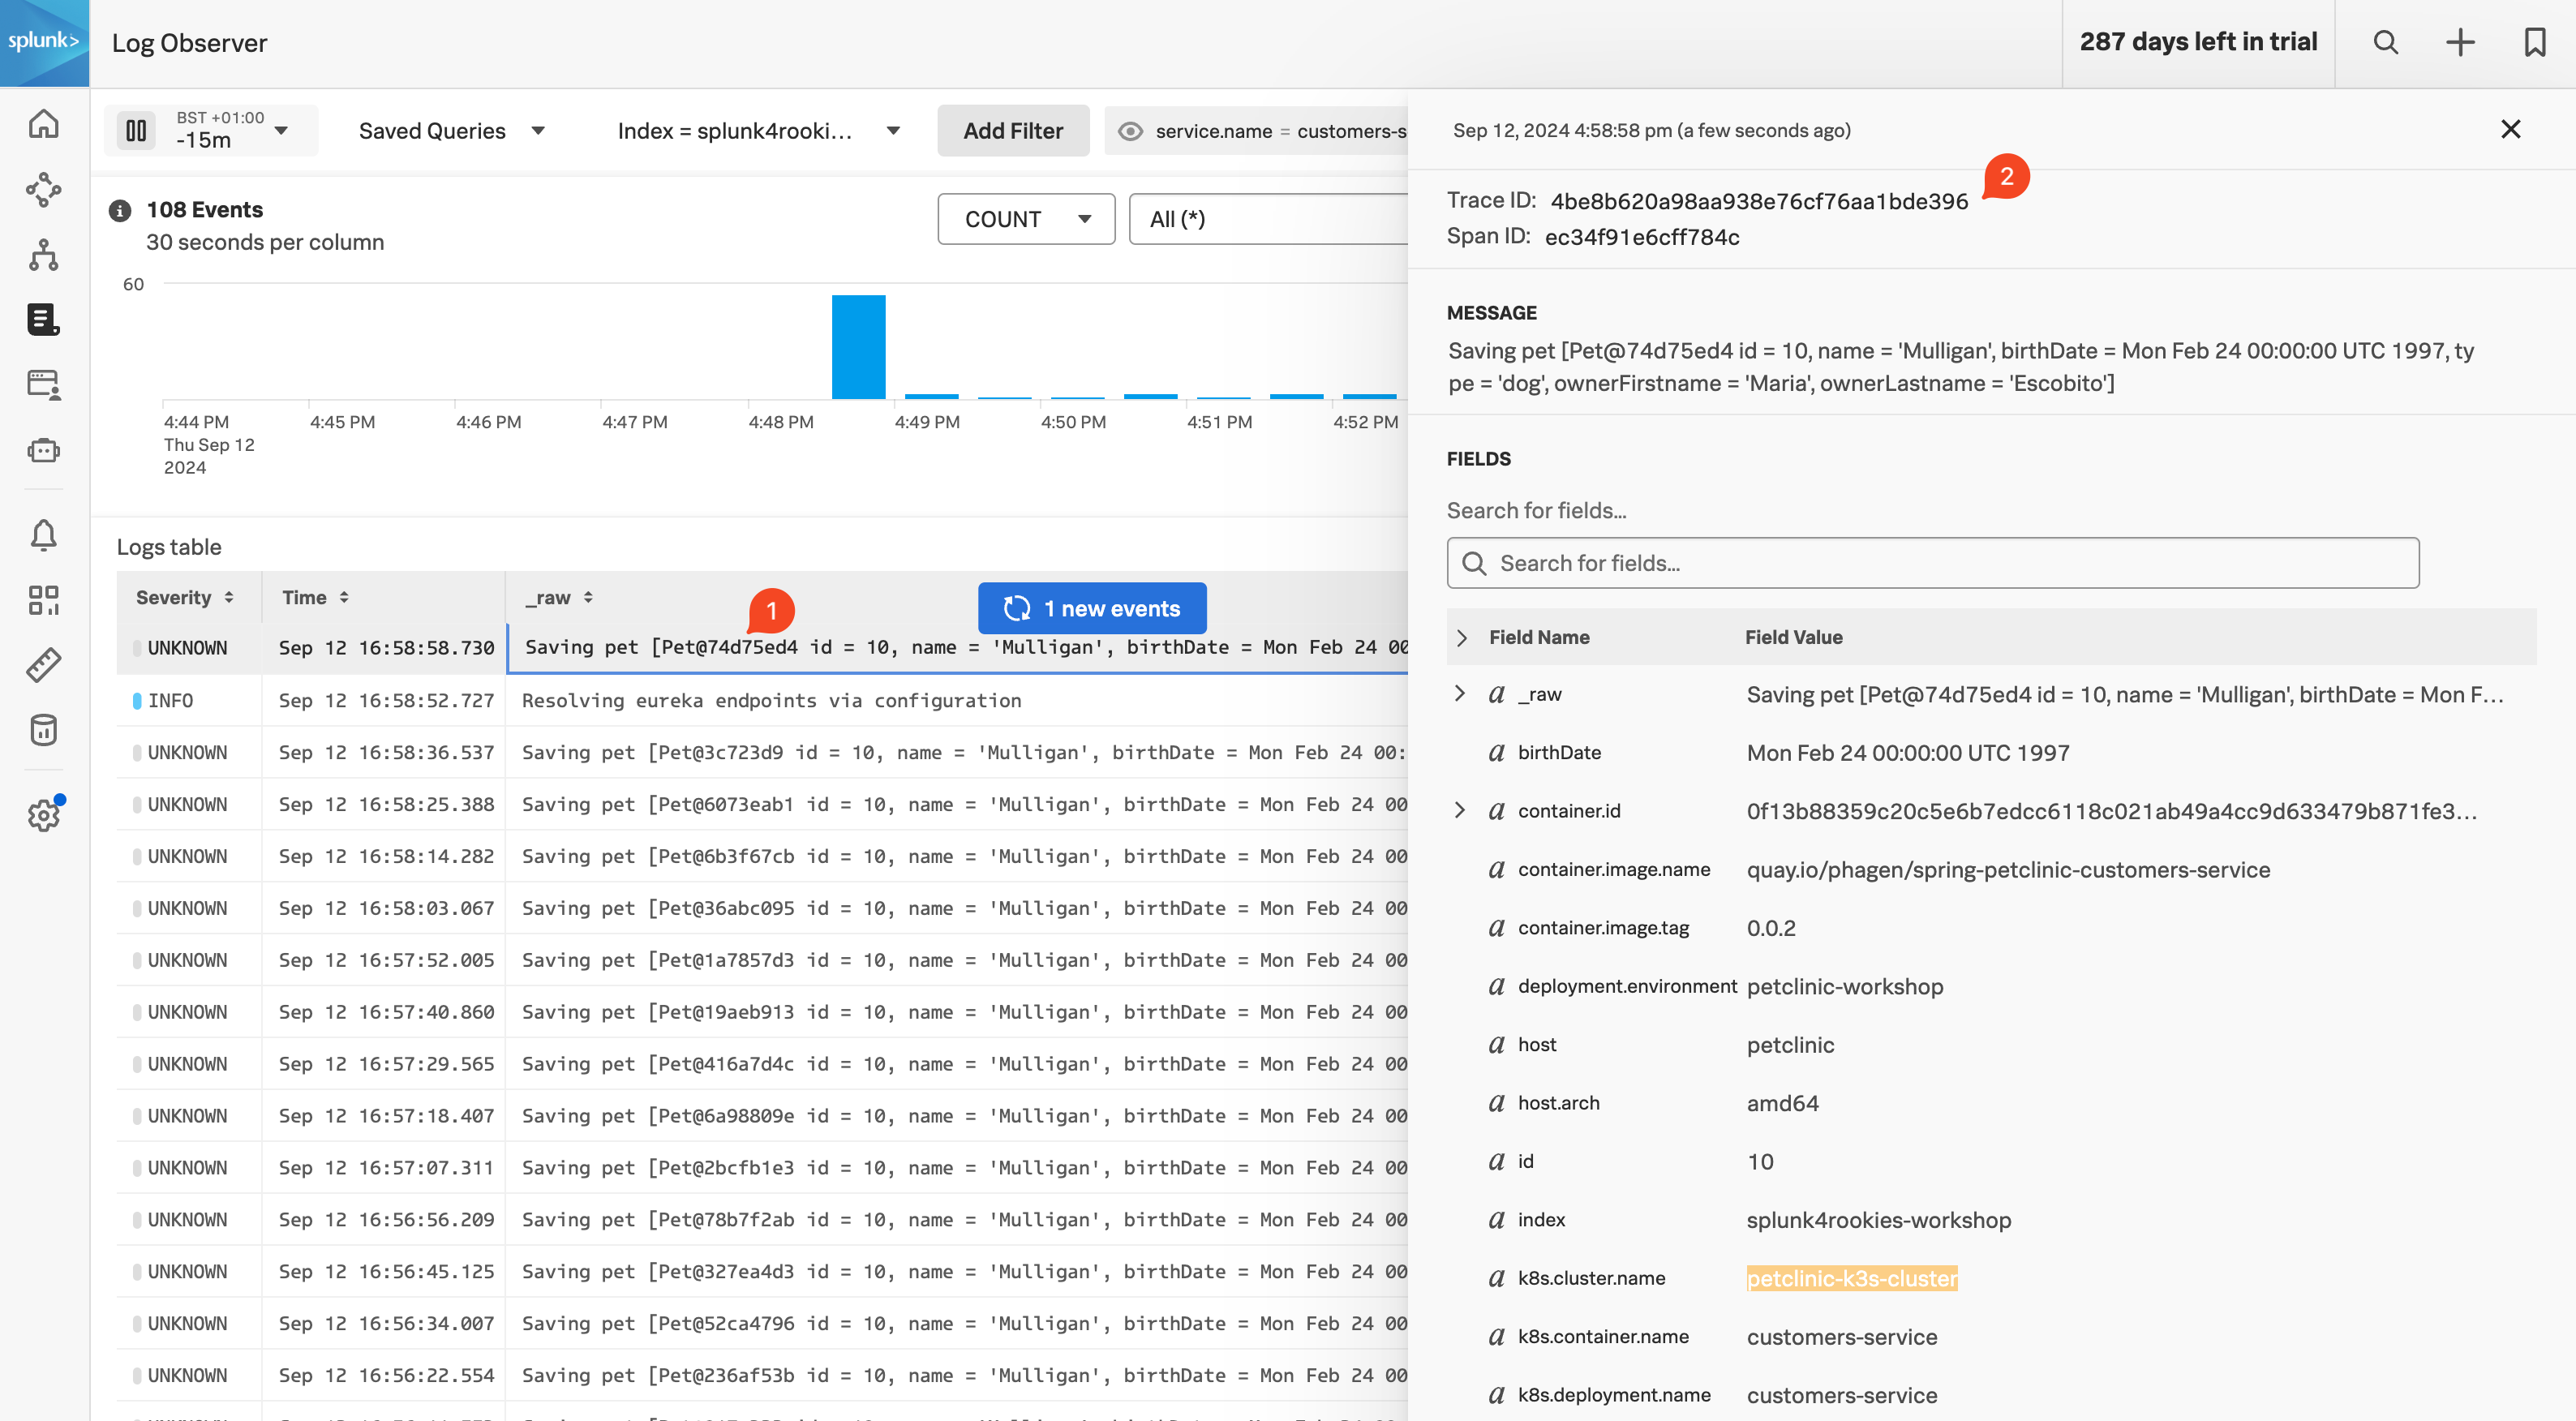
In order to see logs click on the Log Observer in the left-hand menu. Once in Log Observer please ensure Index on the filter bar is set to splunk4rookies-workshop.
Next, click Add Filter and search for the field deployment.environment, select your workshop instance and click = (to include). You will now see only the log messages from your PetClinic application.
Next search for the field service.name, select the value customers-service and click = (to include). Now the log entries will be reduced to show the entries from your customers-service only.
Click on an entry with an injected trace_id (1). A side pane will open where you can see the detailed information, including the relevant trace and span IDs (2).
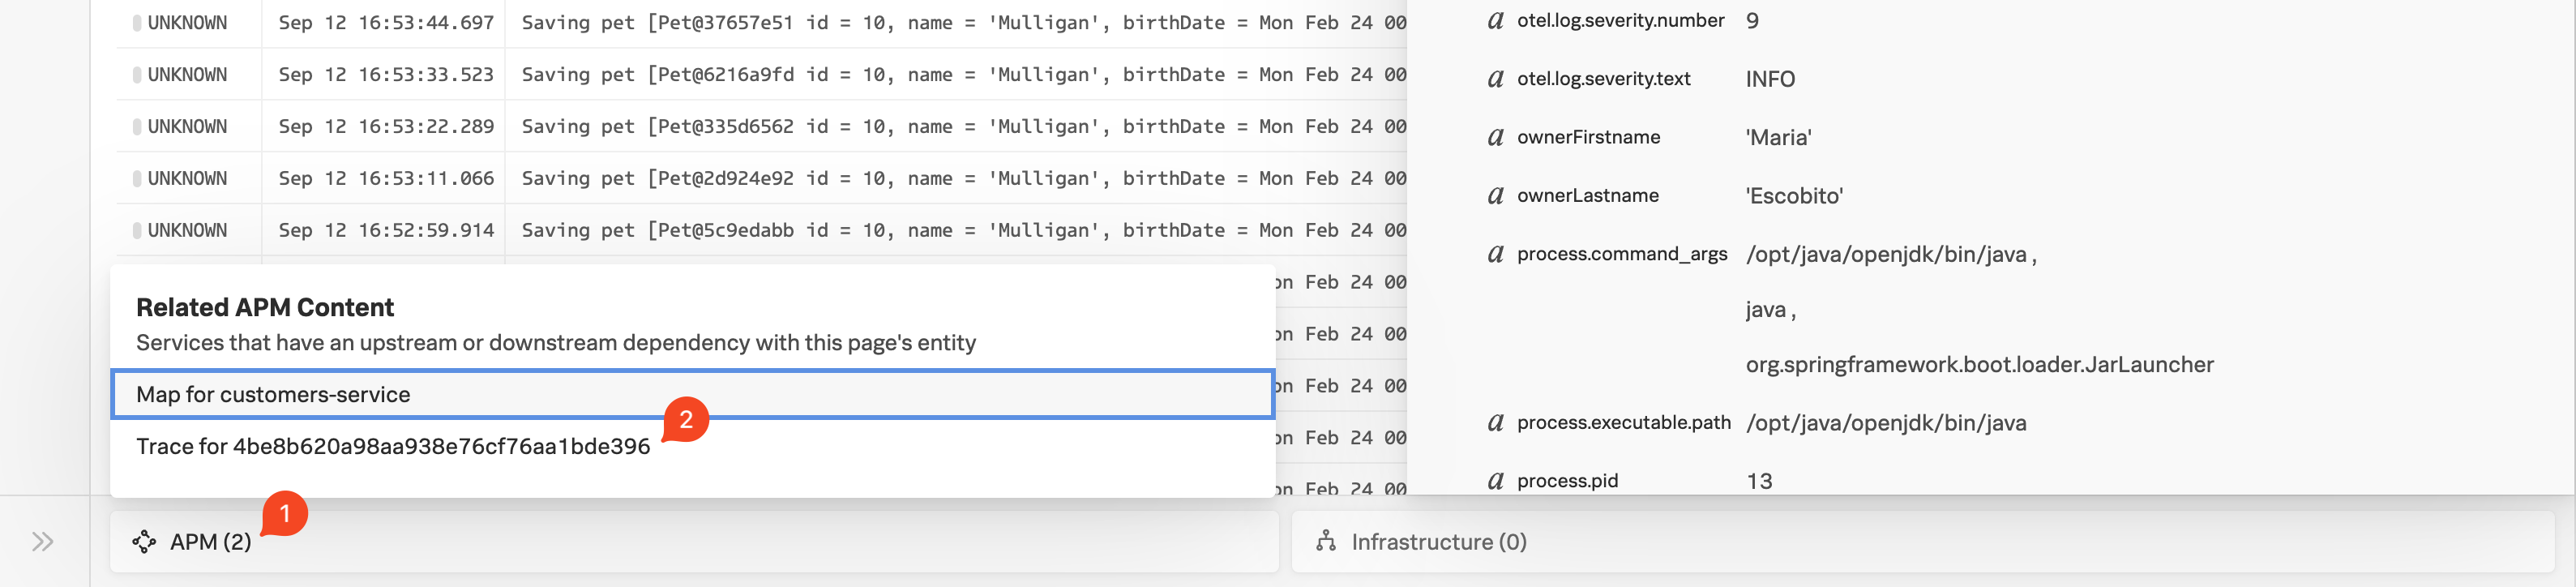
Related Content
In the bottom pane is where any related content will be reported. In the screenshot below you can see that APM has found a trace that is related to this log line (1):
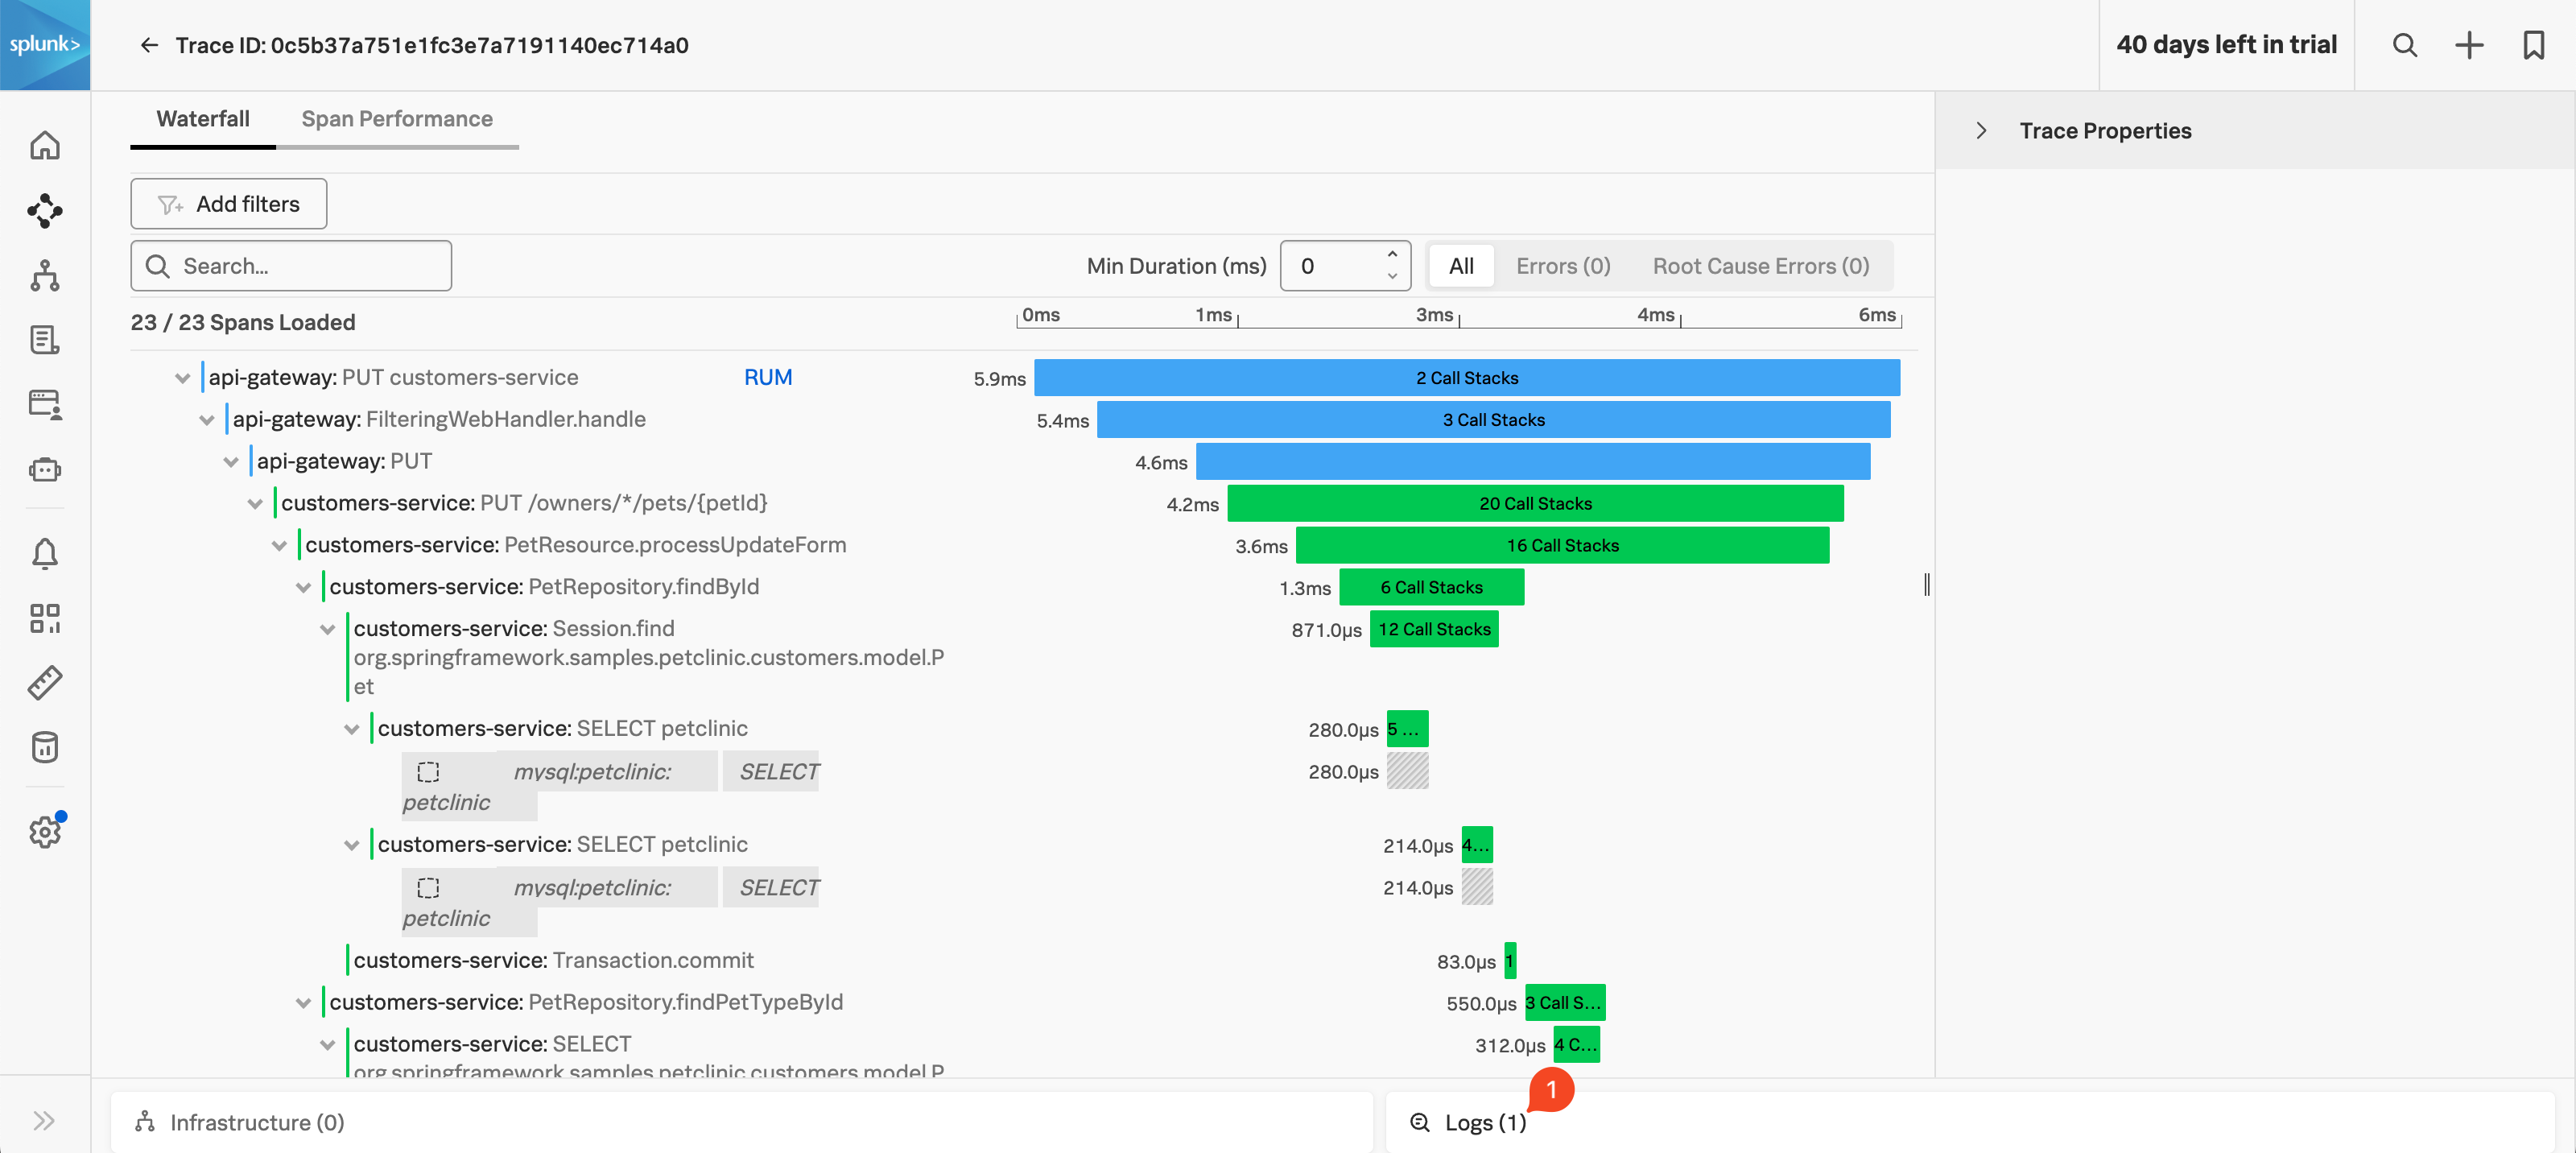
By clicking on Trace for 4be8b620a98aa938e76cf76aa1bde396(2) will take us to the waterfall in APM for this specific trace that this log line was generated from:
Note that you now have Related Content pane for Logs appear (1). Clicking on this will take you back to Log Observer and will display all the log lines that are part of this trace.
Real User Monitoring
10 minutes
To enable Real User Monitoring (RUM) instrumentation for your application, you need to add the Open Telemetry Javascript https://github.com/signalfx/splunk-otel-js-web snippet to your code.
The Spring PetClinic application uses a single HTML page as the “index” page, that is reused across all pages of the application. This is the perfect location to insert the Splunk RUM Instrumentation Library as it will be loaded for all pages automatically.
The following snippet is inserted into the section of the index.html page:
<scriptsrc="/static/env.js"></script><scriptsrc="https://cdn.signalfx.com/o11y-gdi-rum/latest/splunk-otel-web.js"crossorigin="anonymous"></script><scriptsrc="https://cdn.signalfx.com/o11y-gdi-rum/latest/splunk-otel-web-session-recorder.js"crossorigin="anonymous"></script><script>varrealm=env.RUM_REALM;console.log('Realm:',realm);varauth=env.RUM_AUTH;varappName=env.RUM_APP_NAME;varenvironmentName=env.RUM_ENVIRONMENTif(realm&&auth){SplunkRum.init({realm:realm,rumAccessToken:auth,applicationName:appName,deploymentEnvironment:environmentName,version:'1.0.0',});SplunkSessionRecorder.init({app:appName,realm:realm,rumAccessToken:auth});constProvider=SplunkRum.provider;vartracer=Provider.getTracer('appModuleLoader');}else{// Realm or auth is empty, provide default values or skip initialization
console.log("Realm or auth is empty. Skipping Splunk Rum initialization.");}</script>
The above snippet of code has already been added to index.html in the repository you cloned earlier, but it is not yet activated, we will do that in the next section.
If you want you can verify the snippet, we added to the index.html by viewing the file:
more ~/spring-petclinic-microservices/spring-petclinic-api-gateway/src/main/resources/static/index.html
<!DOCTYPE html>

<html ng-app="petClinicApp" lang="en">

<head>
    <meta http-equiv="Content-Type" content="text/html; charset=UTF-8"/>
    <meta charset="utf-8"/>
    <meta http-equiv="X-UA-Compatible" content="IE=edge"/>
    <meta name="viewport" content="width=device-width, initial-scale=1, user-scalable=0, minimal-ui"/>
    <!-- The above 4 meta tags *must* come first in the head; any other head content must come *after* these tags -->

    <link rel="shortcut icon" type="image/x-icon" href="/images/favicon.png"/>

    <title>PetClinic :: a Spring Framework demonstration</title>
    <link rel="stylesheet" href="/webjars/bootstrap/css/bootstrap.min.css"/>
    <link rel="stylesheet" href="/css/petclinic.css"/>

    <script src="/webjars/jquery/jquery.min.js"></script>
    <script src="/webjars/bootstrap/js/bootstrap.min.js"></script>

    <script src="/webjars/angularjs/angular.min.js"></script>
    <script src="/webjars/angular-ui-router/angular-ui-router.min.js"></script>
    <!-- Section added for  RUM -->
    <script src="/scripts/env.js"></script>
    <script src="https://cdn.signalfx.com/o11y-gdi-rum/latest/splunk-otel-web.js" crossorigin="anonymous"></script>
    <script src="https://cdn.signalfx.com/o11y-gdi-rum/latest/splunk-otel-web-session-recorder.js" crossorigin="anonymous"></script>
    <script>
        var realm = env.RUM_REALM;
        console.log('Realm:', realm);
        var auth = env.RUM_AUTH;
        var appName = env.RUM_APP_NAME;
        var environmentName = env.RUM_ENVIRONMENT
        if (realm && auth) {
            SplunkRum.init({
                realm: realm,
                rumAccessToken: auth,
                applicationName: appName,
                deploymentEnvironment: environmentName,
                version: '1.0.0',
            });

            SplunkSessionRecorder.init({
                app: appName,
                realm: realm,
                rumAccessToken: auth
            });
            const Provider = SplunkRum.provider;
            var tracer=Provider.getTracer('appModuleLoader');
        } else {
        // Realm or auth is empty, provide default values or skip initialization
        console.log("Realm or auth is empty. Skipping Splunk Rum initialization.");
        }
    </script>
     <!-- Section added for  RUM -->
    <script src="/scripts/app.js"></script>
Subsections of Real User Monitoring
Rebuild PetClinic with RUM enabled
At the top of the previous code snippet, there is a reference to the file /static/env.js, which contains/sets the variables used by RUM, currently these are not configured and therefore no RUM traces are currently being sent.
Run the script that will update variables to enable RUM traces so they are viewable in Splunk Observability Cloud. Note, that the env.js script contains a deliberate JavaScript error, that will be picked up in RUM:
As soon as the container is pushed into the repository, just restart the api-gateway to apply the changes:
kubectl rollout restart deployment api-gateway
deployment.apps/api-gateway restarted
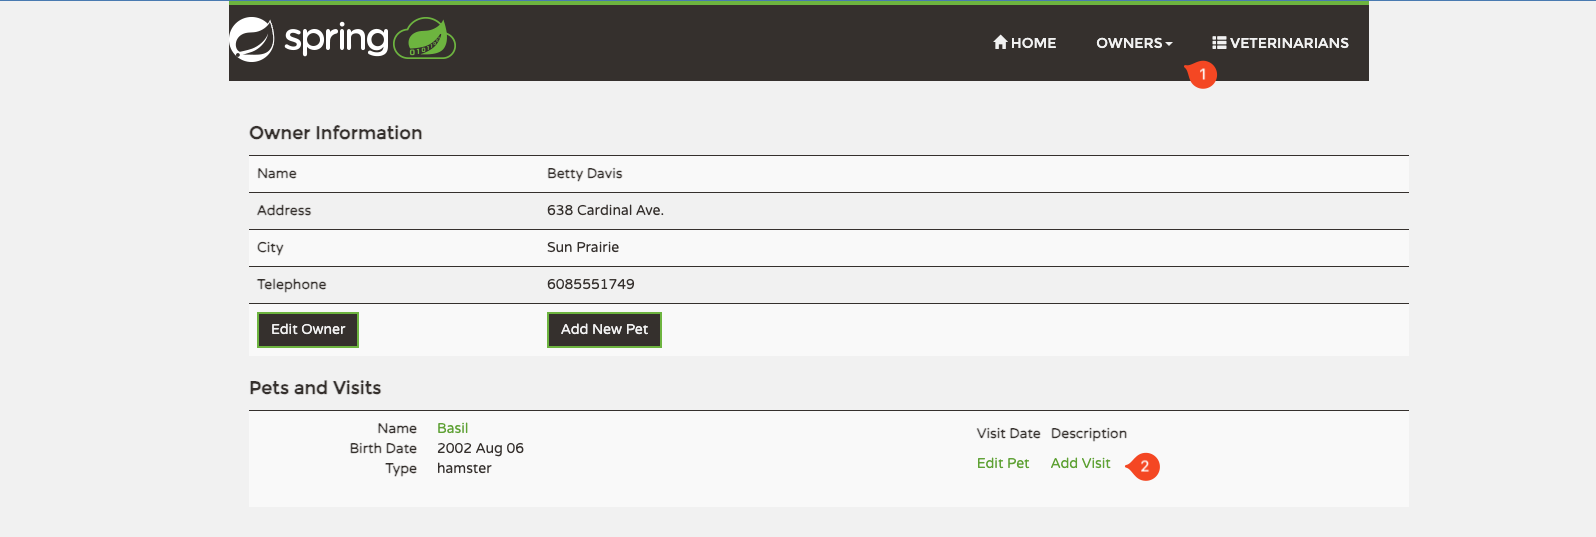
Validate that the application is running by visiting http://<IP_ADDRESS>:81 (replace <IP_ADDRESS> with the IP address you obtained above). Make sure the application is working correctly by visiting the All Owners(1) and select an owner, then add a visit(2). We will use this action when checking RUM
If you want, you can access this website on your phone/tablet as well as this data will also show up in RUM.
Select the RUM view for the Petclinic App
Once RUM has been configured and you have added a visit for a pet, you can log in to Splunk Observability Cloud and verify that RUM traces are flowing in.
Lets start a quick high level tour into RUM by clicking RUM in the left-hand menu. Then change the Environment filter (1) to the name of your workshop instance from the dropdown box, it will be <INSTANCE>-workshop(1) (where INSTANCE is the value from the shell script you ran earlier). Make sure it is the only one selected.
Then change the App(2) dropdown box to the name of your app, it will be <INSTANCE>-store
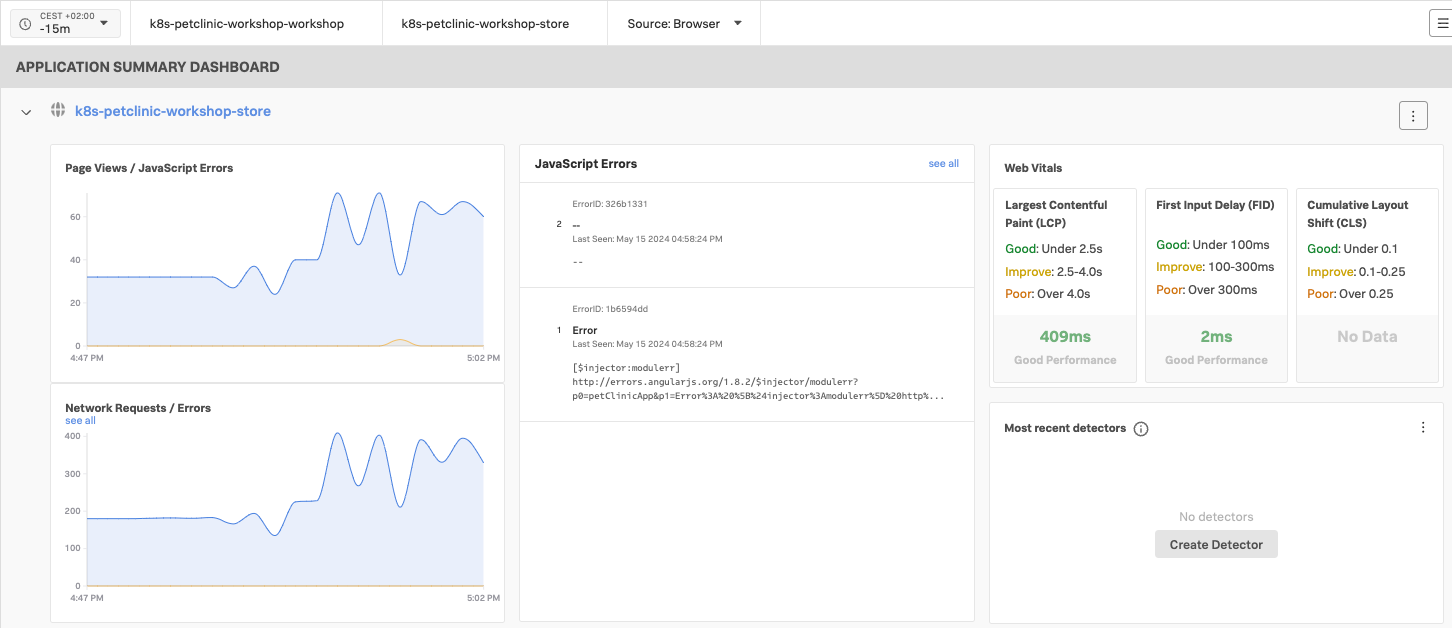
Once you have selected your Environment and App, you will see an overview page showing the RUM status of your App (if your Summary Dashboard is just a single row of numbers, you are looking at the condensed view. You can expand it by clicking on the > in front of the Application name). If any JavaScript error occurred they will show up as shown below:
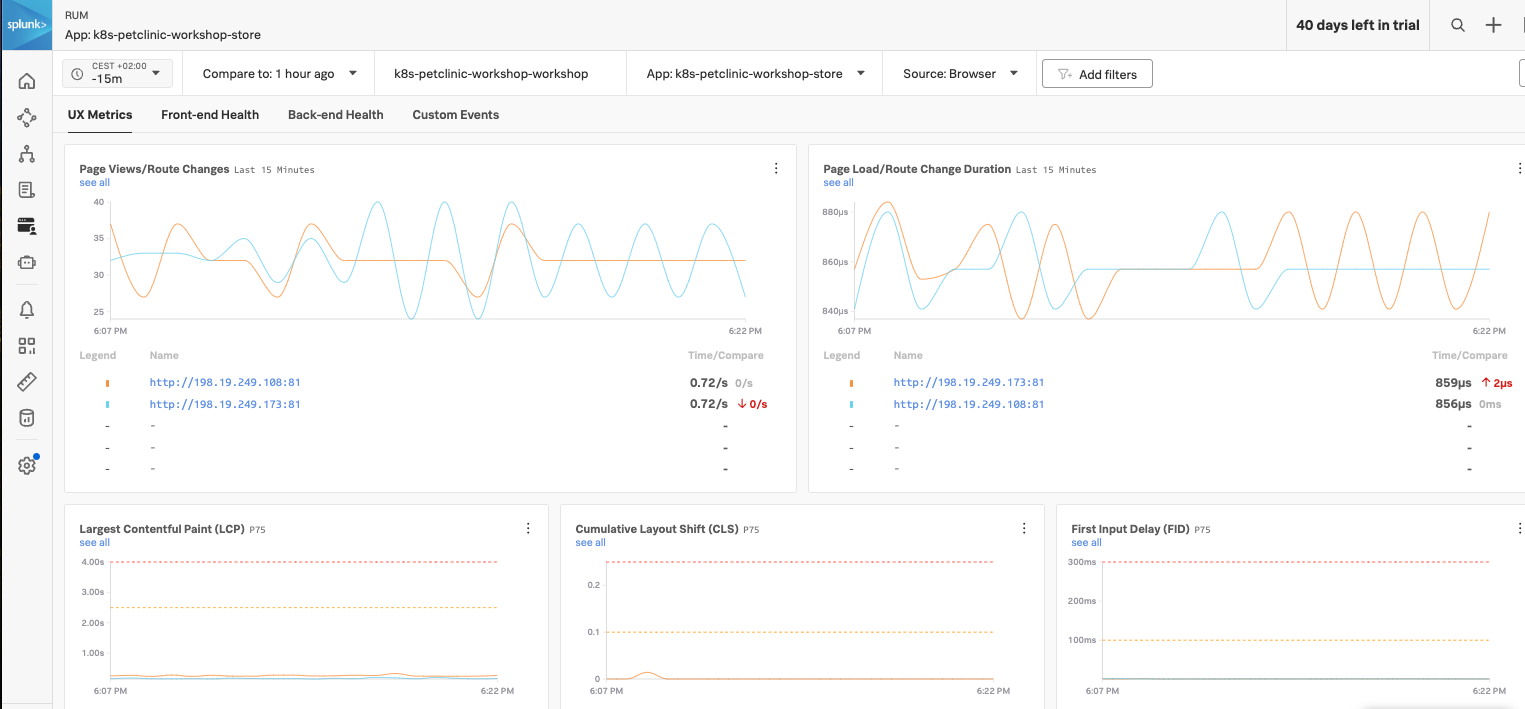
To continue, click on the blue link (with your workshop name) to get to the details page, this will bring up a new dashboard view breaking down the interactions by UX Metrics, Front-end Health, Back-end Health and Custom Events and comparing them to historic metrics (1 hour by default).
Normally you have only one line inside the first chart, Click on the link that relates to your Petclinic shop,
http://198.19.249.62 in our example:
This will bring us to the Tag Spotlight page:
RUM trace Waterfall view & linking to APM
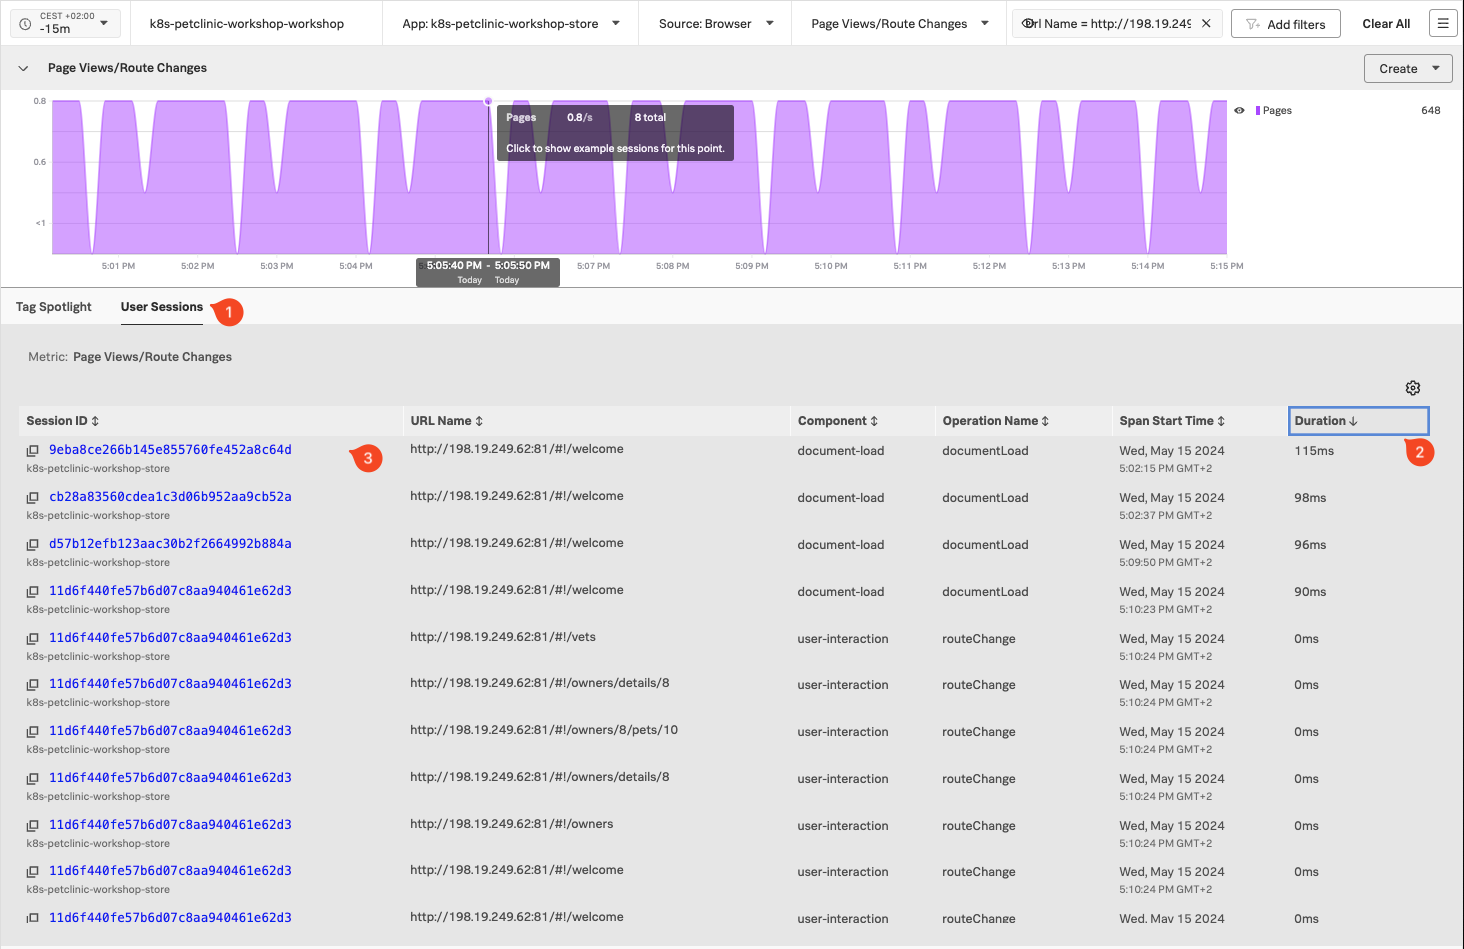
In the TAG Spotlight view, you are presented with all the tags associated with the RUM data. Tags are key-value pairs that are used to identify the data. In this case, the tags are automatically generated by the OpenTelemetry instrumentation. The tags are used to filter the data and to create the charts and tables. The Tag Spotlight view allows you detect trends in behavior and to drill down into a user session.
Click on User Sessions (1), this will show you the list of user session that occurred during the time window.
We want to look at one of the session , so click on Duration(2) to sort on duration, and make sure you click on the link of one of the longer ones (3):
RUM trace Waterfall view & linking to APM
We are now looking at the RUM Trace waterfall, this will tell you what happened during the session on the user device as they visited the page of our petclinic application.
If you scroll down the waterfall find click on the Vets segment on the right (1), you see a list of action that occurred during the handling of the Vets request. Note, that the HTTP request have a blue APM link before the return code. Pick one, and click on the APM link. This will show you the APM info for this Ser vice call to our Microservices in Kubernetes.
Note , that there give you the information what happened during action in the Microservices, and if you want to drill down to verify what happened with the request, click on the Trace ID url.
This will show you the trace related to your request from RUM:
You can see that the entry point into your service now has a RUM (1) related content link added, allowing you to return back to your RUM session after you validated what happened in your Microservices.
Workshop Wrap-up 🎁
Congratulations, you have completed the Get the Most Out of Your Existing Kubernetes Java Applications Using Automatic Discovery and Configuration With OpenTelemetry workshop.
Today, you have learnt how easy it is to add Tracing, Code Profiling and Database Query Performance to your existing Java application in Kubernetes.
You immediately improved the observability of the application and infrastructure with out touching a line of code or configuration using Automatic Discovery and Configuration.
You also learnt that with simple configuration changes you can add even more observability (logging and RUM) to the application in order to provide end-to-end observability.
NodeJS Zero-Config Workshop
30 minutesAuthor
Robert Castley
The goal is to walk through the basic steps to configure the following components of the Splunk Observability Cloud platform:
Splunk Infrastructure Monitoring (IM)
Splunk Zero Configuration Auto Instrumentation for NodeJS (APM)
AlwaysOn Profiling
Splunk Log Observer (LO)
We will deploy the OpenTelemetry Astronomy Shop application in Kubernetes, which contains two NodeJS services (Frontend & Payment Service). Once the application and the OpenTelemetry Connector are up and running, we will start seeing metrics, traces and logs via the Zero Configuration Auto Instrumentation for NodeJS that will be used by the Splunk Observability Cloud platform to provide insights into the application.
Prerequisites
Outbound SSH access to port 2222.
Outbound HTTP access to port 8083.
Familiarity with the bash shell and vi/vim editor.
To not conflict with other workshops, we will deploy the OpenTelemetry Demo in a separate namespace called otel-demo. To create the namespace, run the following command:
kubectl create namespace otel-demo
2. Deploy the OpenTelemetry Demo
Next, change to the directory containing the OpenTelemetry Demo application:
cd ~/workshop/apm
Deploy the OpenTelemetry Demo application:
kubectl apply -n otel-demo -f otel-demo.yaml
serviceaccount/opentelemetry-demo created
service/opentelemetry-demo-adservice created
service/opentelemetry-demo-cartservice created
service/opentelemetry-demo-checkoutservice created
service/opentelemetry-demo-currencyservice created
service/opentelemetry-demo-emailservice created
service/opentelemetry-demo-featureflagservice created
service/opentelemetry-demo-ffspostgres created
service/opentelemetry-demo-frontend created
service/opentelemetry-demo-kafka created
service/opentelemetry-demo-loadgenerator created
service/opentelemetry-demo-paymentservice created
service/opentelemetry-demo-productcatalogservice created
service/opentelemetry-demo-quoteservice created
service/opentelemetry-demo-recommendationservice created
service/opentelemetry-demo-redis created
service/opentelemetry-demo-shippingservice created
deployment.apps/opentelemetry-demo-accountingservice created
deployment.apps/opentelemetry-demo-adservice created
deployment.apps/opentelemetry-demo-cartservice created
deployment.apps/opentelemetry-demo-checkoutservice created
deployment.apps/opentelemetry-demo-currencyservice created
deployment.apps/opentelemetry-demo-emailservice created
deployment.apps/opentelemetry-demo-featureflagservice created
deployment.apps/opentelemetry-demo-ffspostgres created
deployment.apps/opentelemetry-demo-frauddetectionservice created
deployment.apps/opentelemetry-demo-frontend created
deployment.apps/opentelemetry-demo-kafka created
deployment.apps/opentelemetry-demo-loadgenerator created
deployment.apps/opentelemetry-demo-paymentservice created
deployment.apps/opentelemetry-demo-productcatalogservice created
deployment.apps/opentelemetry-demo-quoteservice created
deployment.apps/opentelemetry-demo-recommendationservice created
deployment.apps/opentelemetry-demo-redis created
deployment.apps/opentelemetry-demo-shippingservice created
Once the application is deployed, we need to wait for the pods to be in a Running state. To check the status of the pods, run the following command:
Obtain the public IP address of the instance you are running on. You can do this by running the following command:
curl ifconfig.me
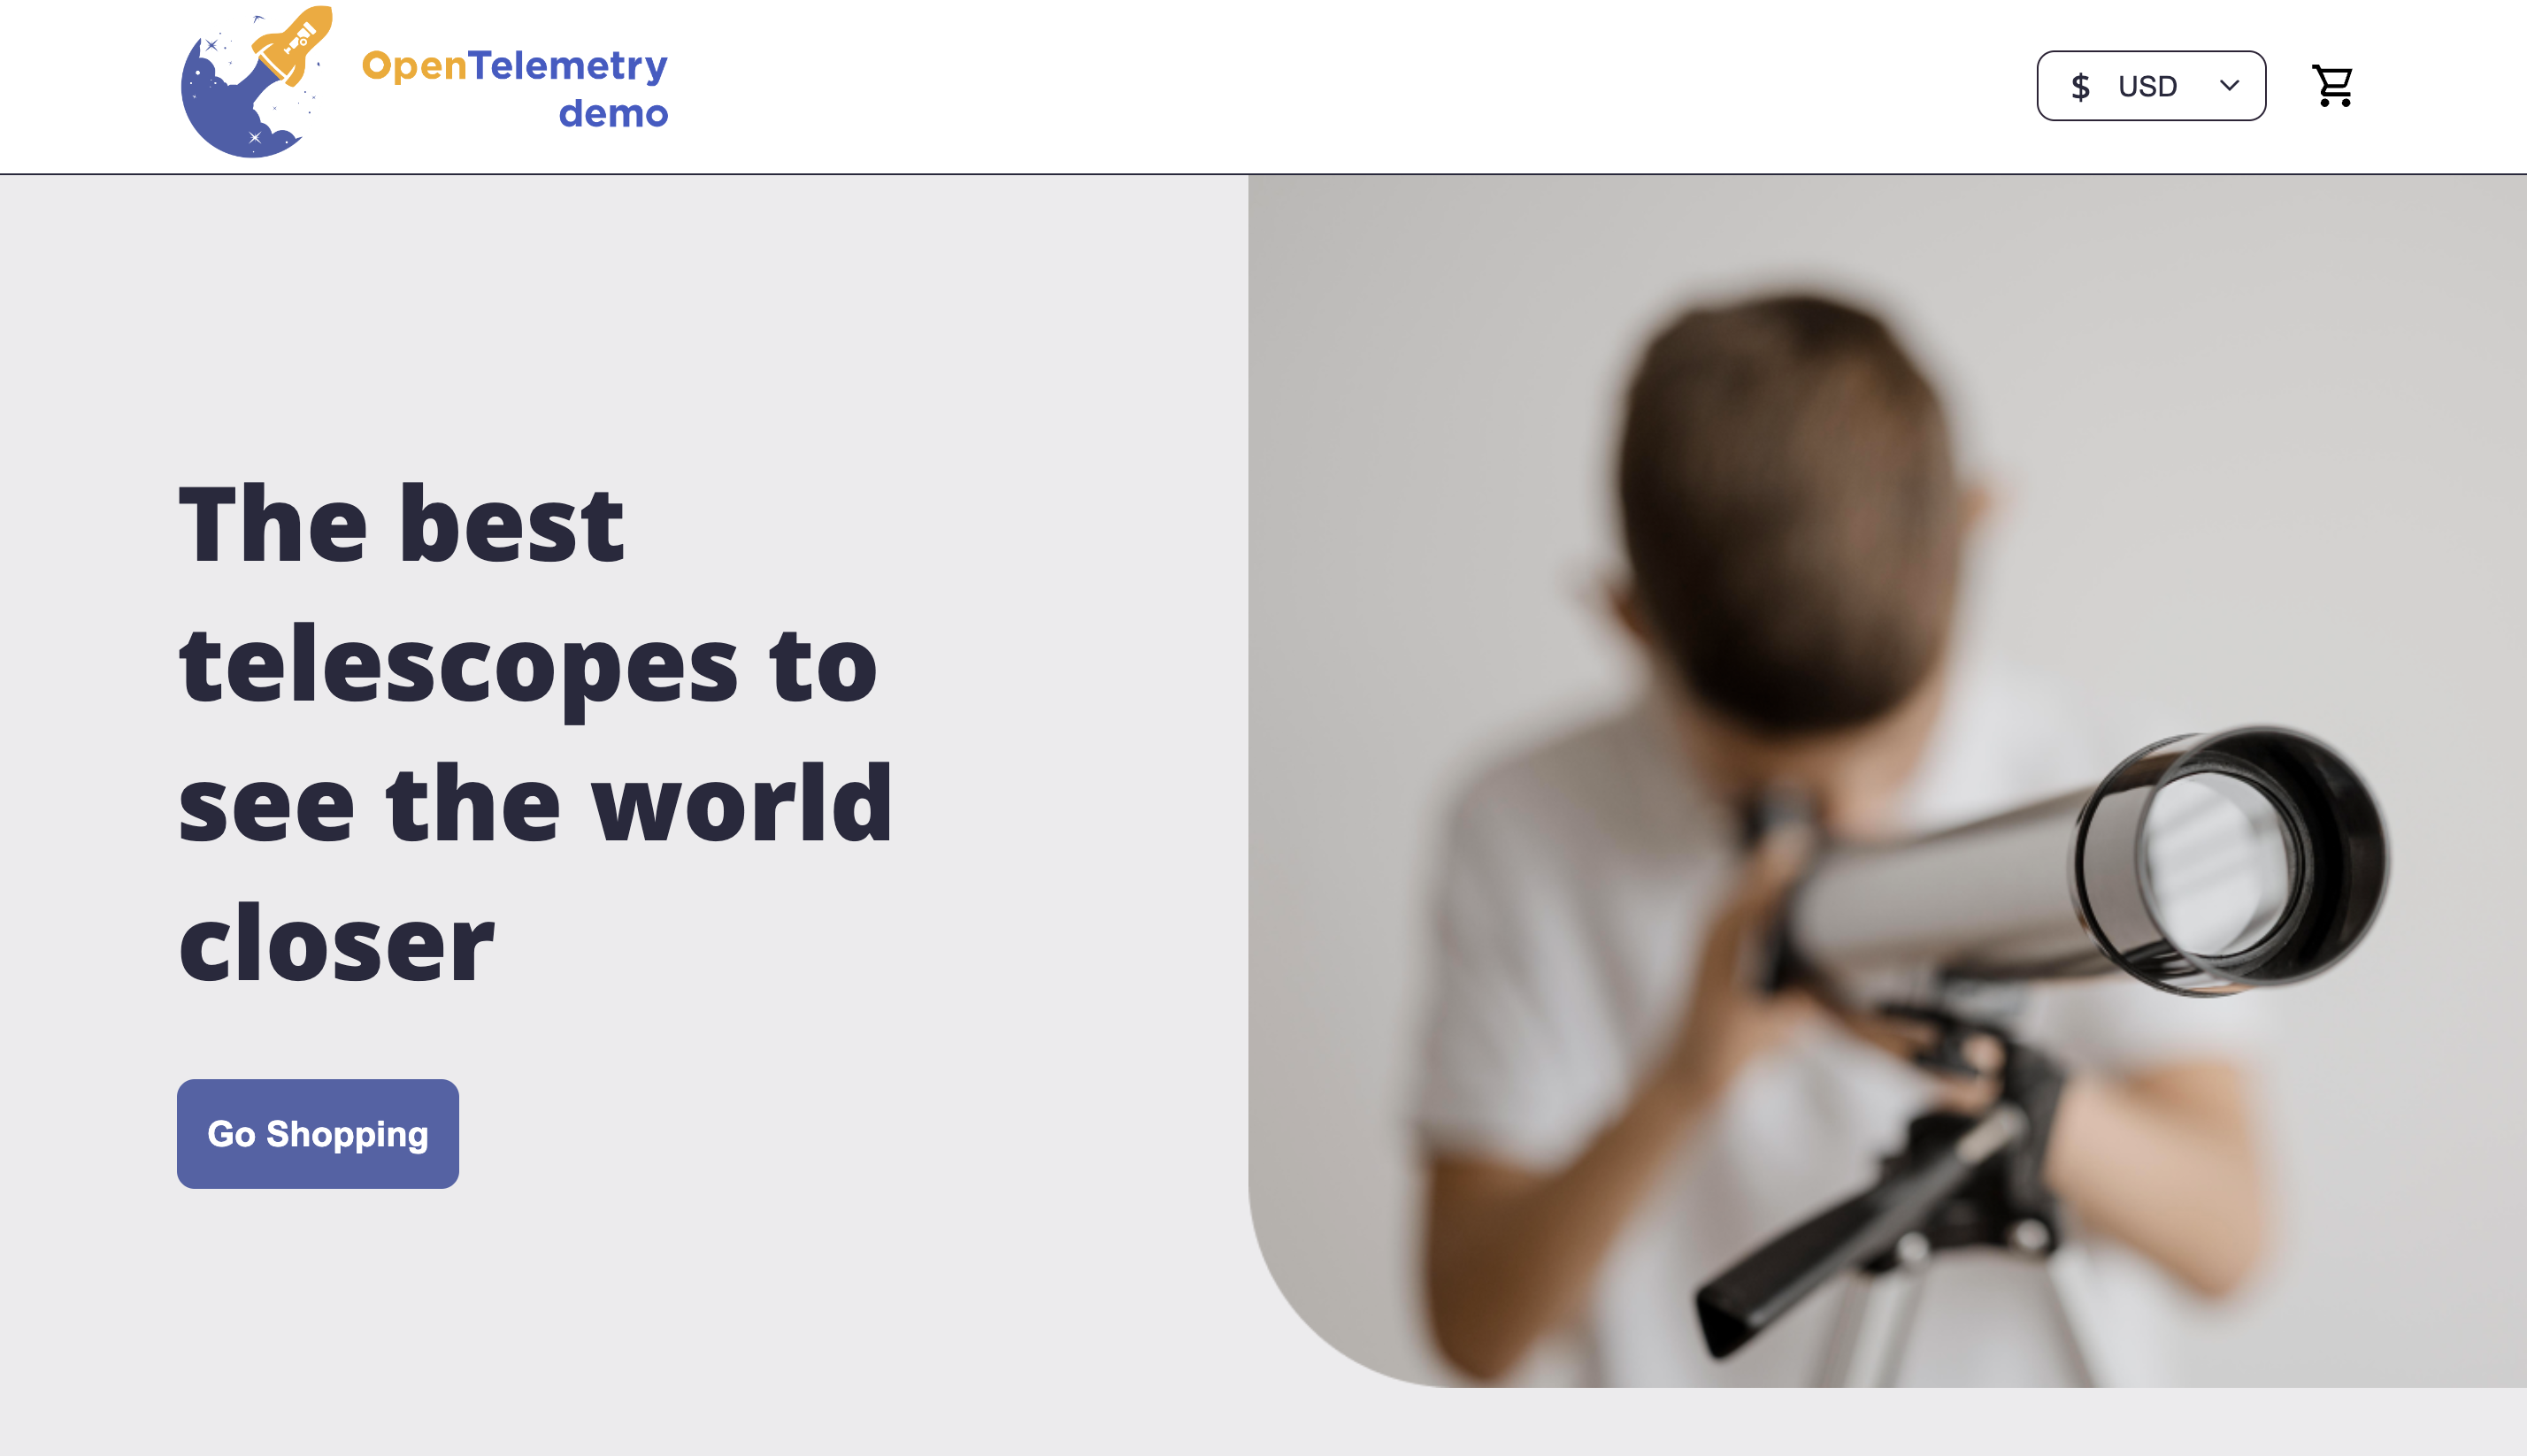
Once the port-forward is running, you can access the application by opening a browser and navigating to http://<public IP address>:8083. You should see the following:
Once you have confirmed the application is running, you can close the port-forward by pressing ctrl + c.
Next, we will deploy the OpenTelemetry Collector.
Installing the OpenTelemetry Collector
1. Introduction
Delete any existing OpenTelemetry Collectors
If you have completed any other Observability workshops, please ensure you delete the collector running in Kubernetes before continuing. This can be done by running the following command:
helm delete splunk-otel-collector
2. Confirm environment variables
To ensure your instance is configured correctly, we need to confirm that the required environment variables for this workshop are set correctly. In your terminal run the following command:
env
In the output check the following environment variables are present and have values set:
ACCESS_TOKEN
REALM
RUM_TOKEN
HEC_TOKEN
HEC_URL
For this workshop, all of the above are required. If any are missing, please contact your instructor.
3. Install the OpenTelemetry Collector
We can then go ahead and install the Collector. Some additional parameters are passed to the helm install command, they are:
--set="operator.enabled=true" - Enabled the Splunk OpenTelemetry Collector Operator for Kubernetes.
--set="certmanager.enabled=true" - The cert-manager adds certificates and certificate issuers as resource types in Kubernetes clusters and simplifies the process of obtaining, renewing and using those certificates.
--set="splunkObservability.profilingEnabled=true" - Enables CPU/Memory profiling for supported languages.
Once the installation is completed, you can navigate to the Kubernetes Navigator to see the data from your host.
Click on Add filters select k8s.cluster.name and select the cluster of your workshop instance.
You can determine your instance name from the command prompt in your terminal session:
echo$INSTANCE
Once you see data flowing for your host, we are then ready to get started with the APM component.
Zero Configuration - Frontend Service
1. Patching the Frontend service
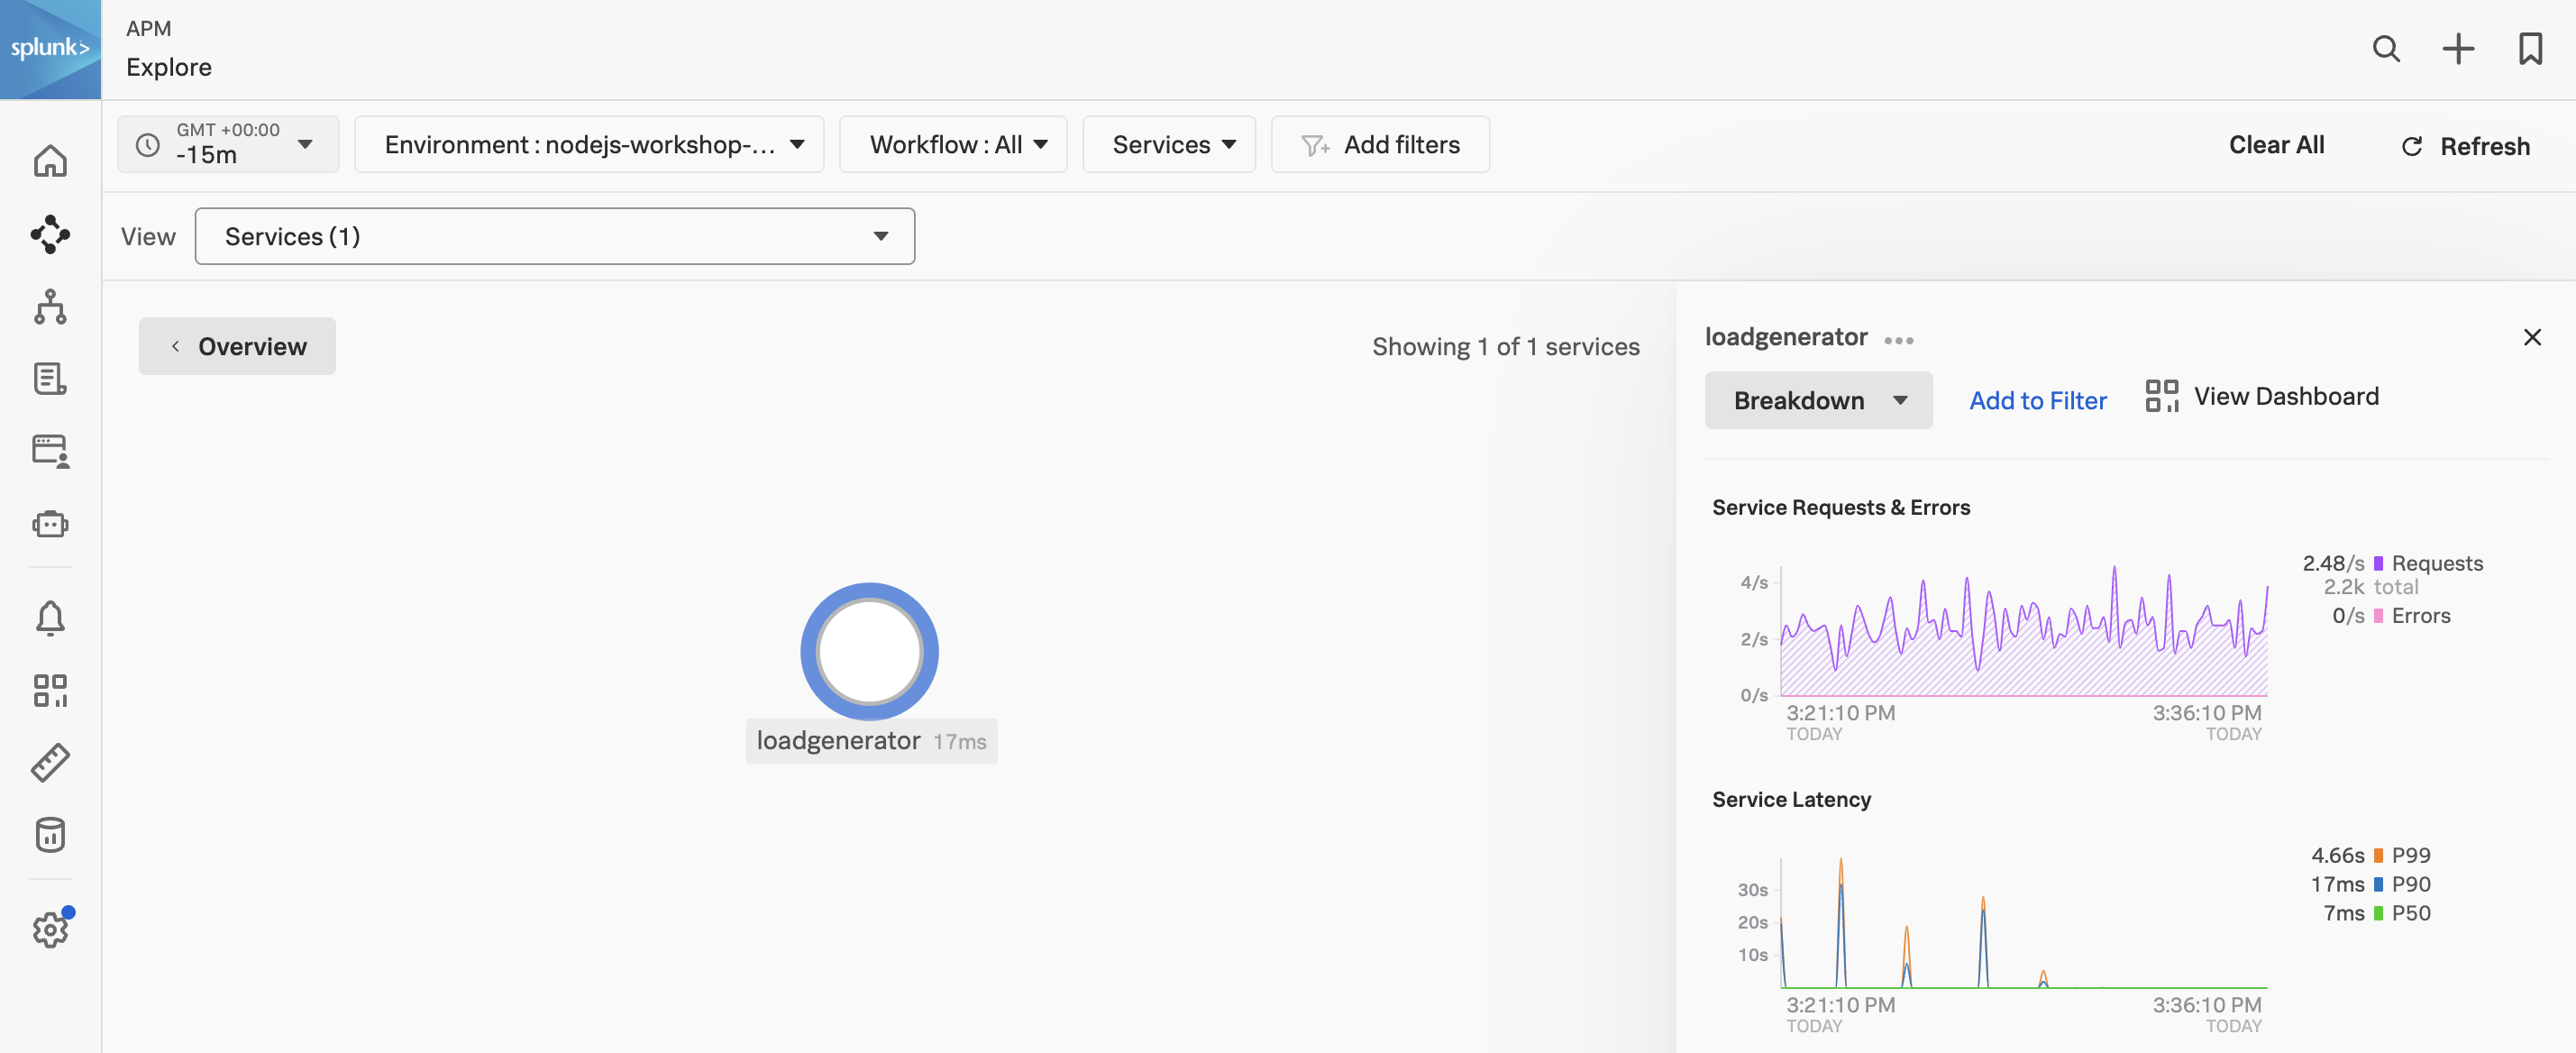
First, confirm that you can see your environment in APM. There should be a service called loadgenerator displayed in the Service map.
Next, we will patch the frontend deployment with an annotation to inject the NodeJS auto instrumentation. This will allow us to see the frontend service in APM. Note, that at this point we have not edited any code.
This will cause the opentelemetry-demo-frontend pod to restart.
The annotation value default/splunk-otel-collector refers to the instrumentation configuration named splunk-otel-collector in the default namespace.
If the chart is not installed in the default namespace, modify the annotation value to be {chart_namespace}/splunk-otel-collector.
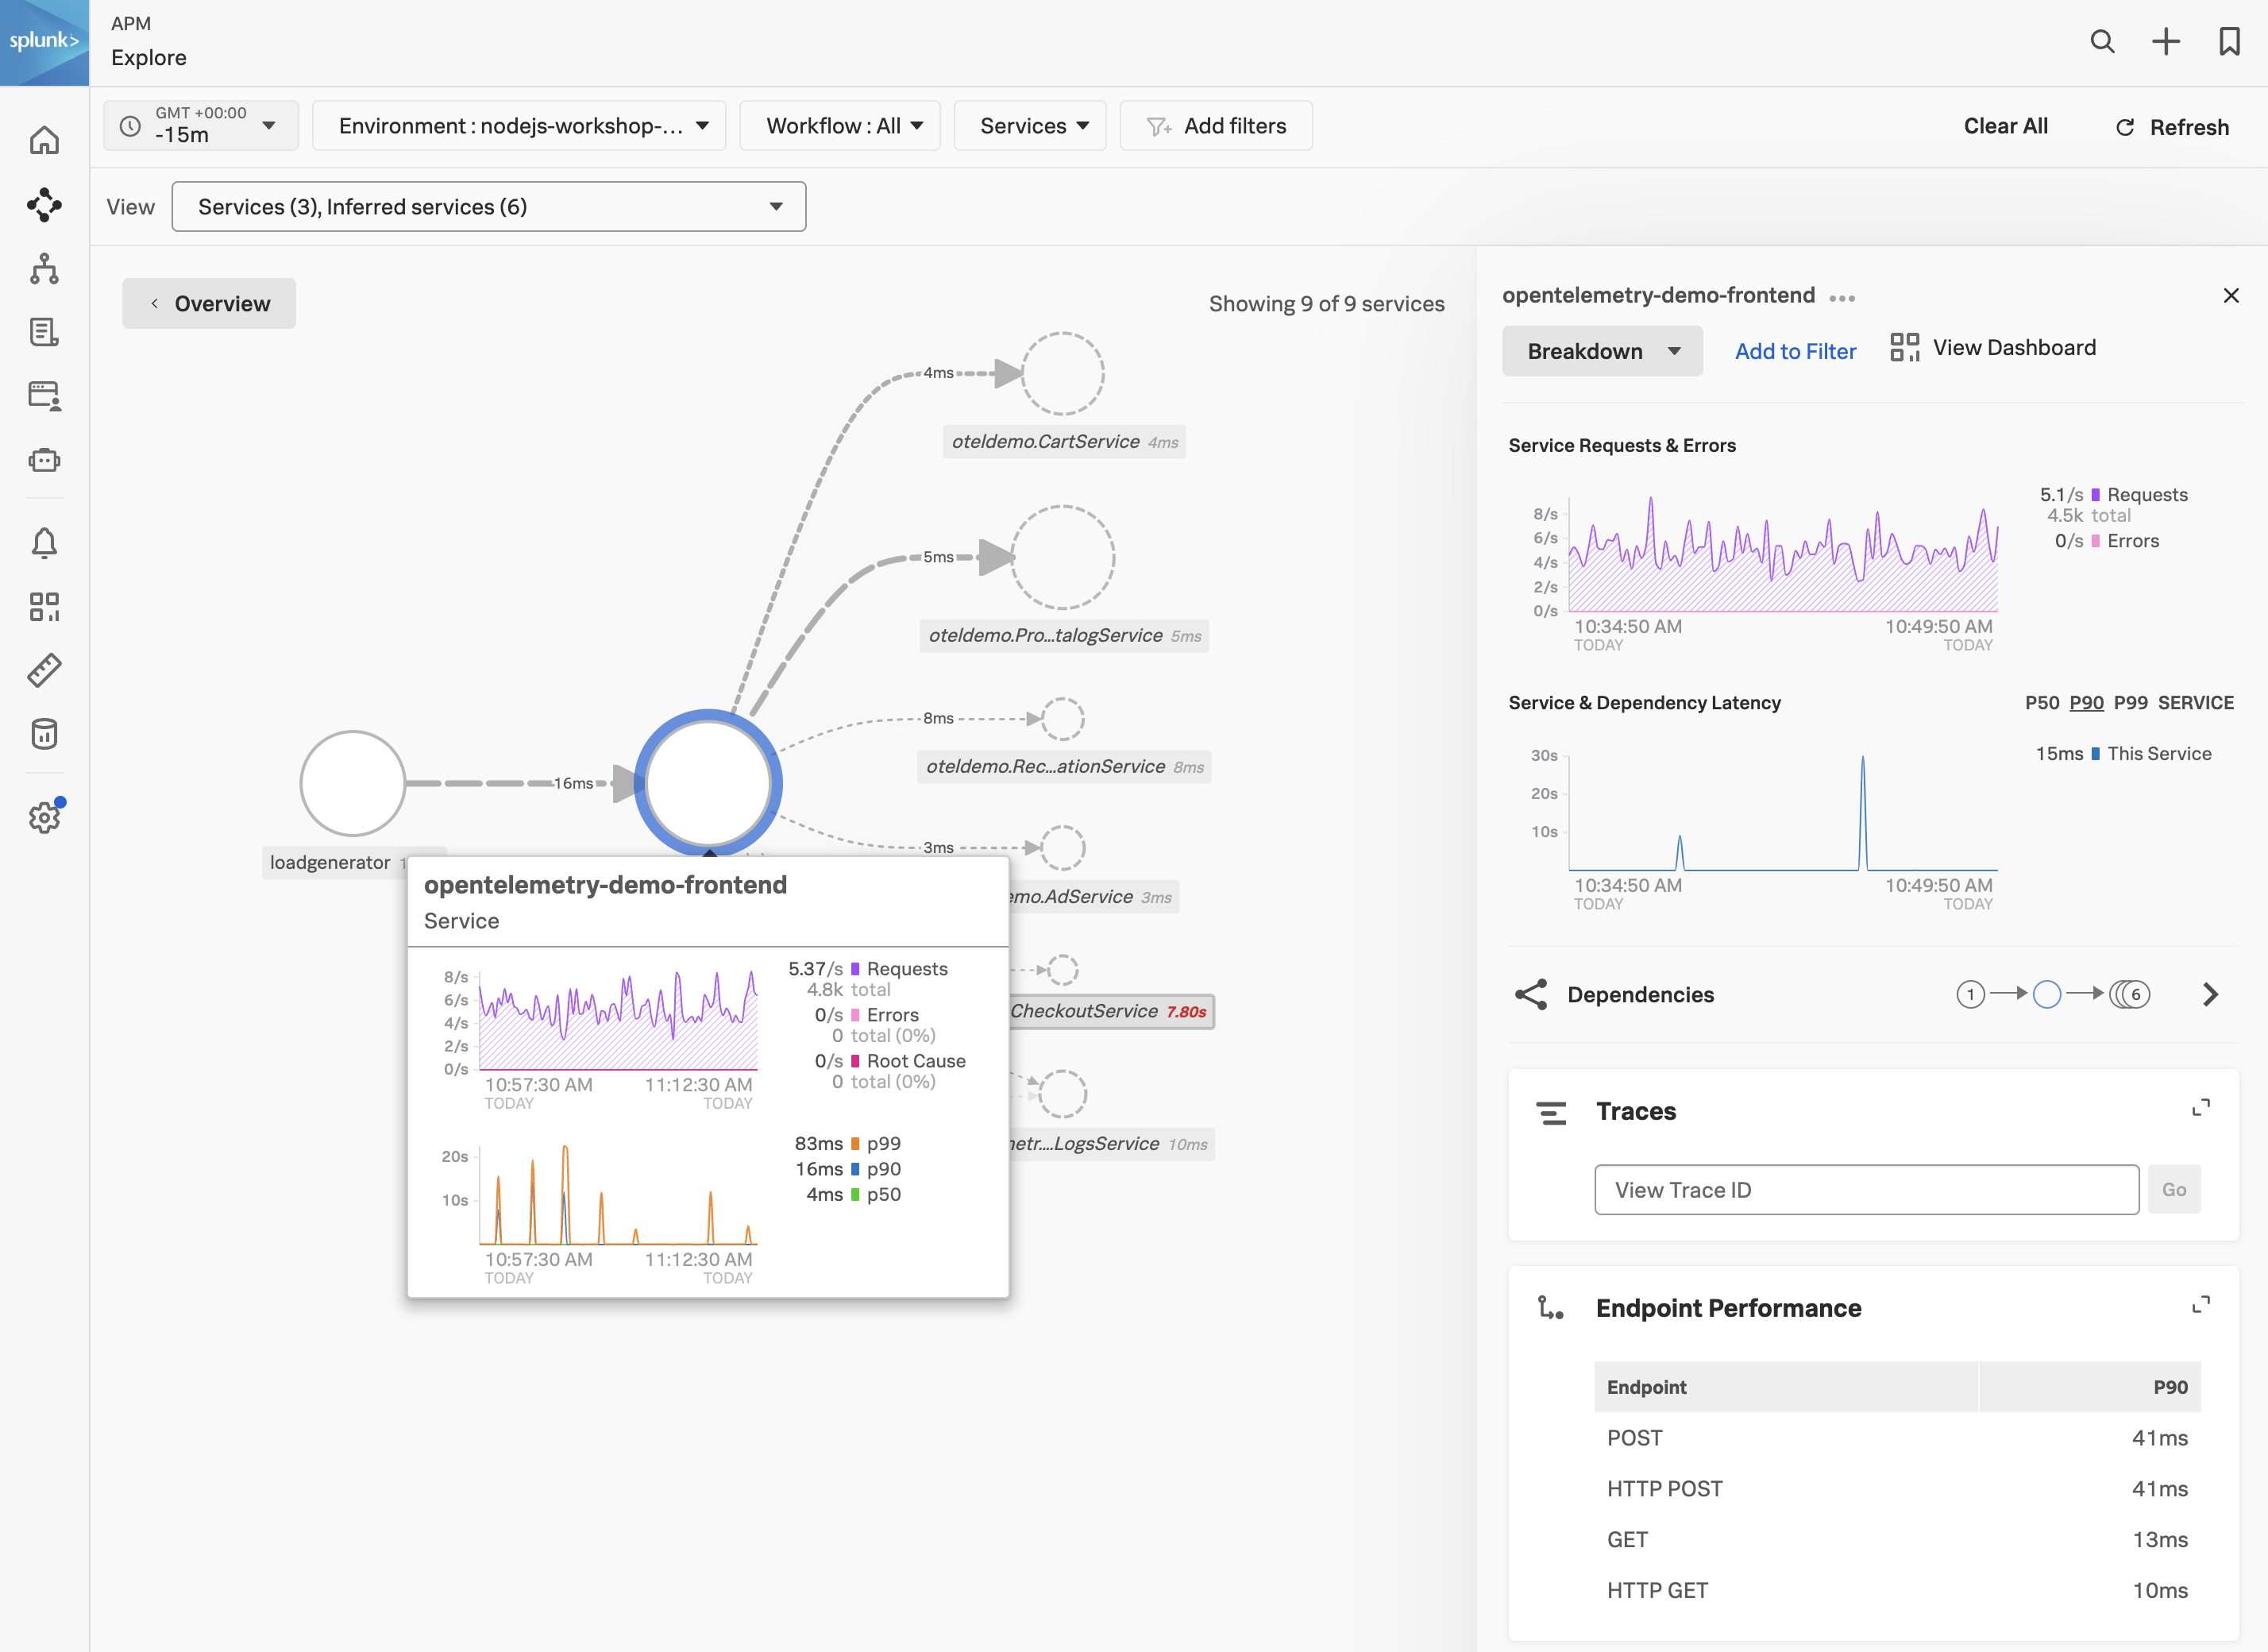
After a few minutes, you should see the frontend service in APM.
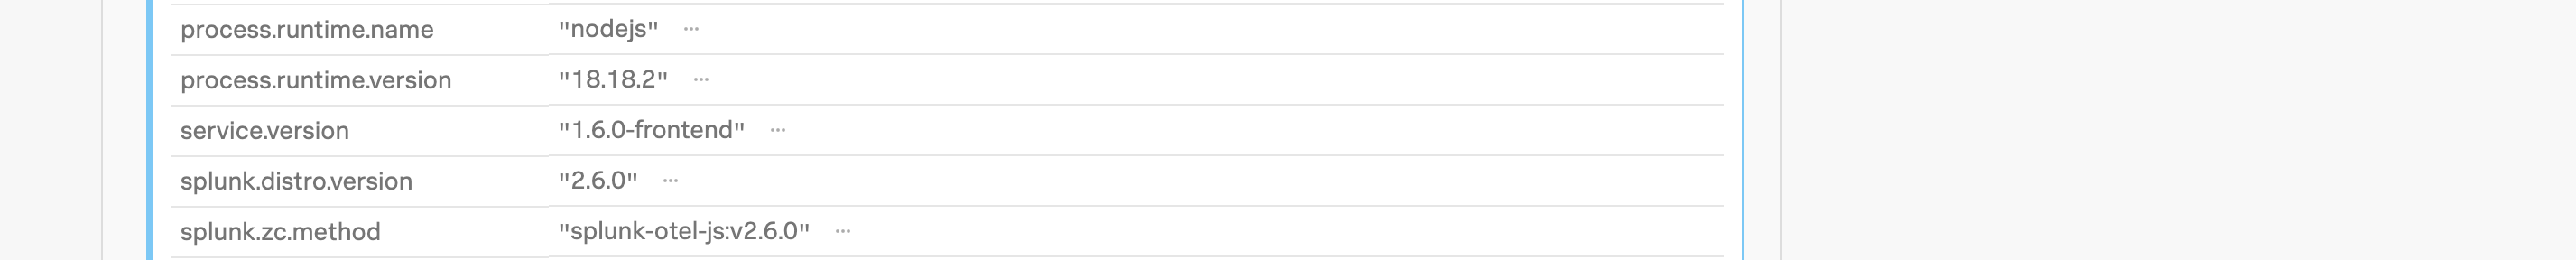
With the frontend service highlighted, click on the Traces tab to see the traces for the service. Select one of the traces and confirm that the trace contains metadata confirming that the Splunk Zero-Configuration Auto-Instrumentation for NodeJS is being used.
Zero Configuration - Payment Service
1. Patching the Payment Service
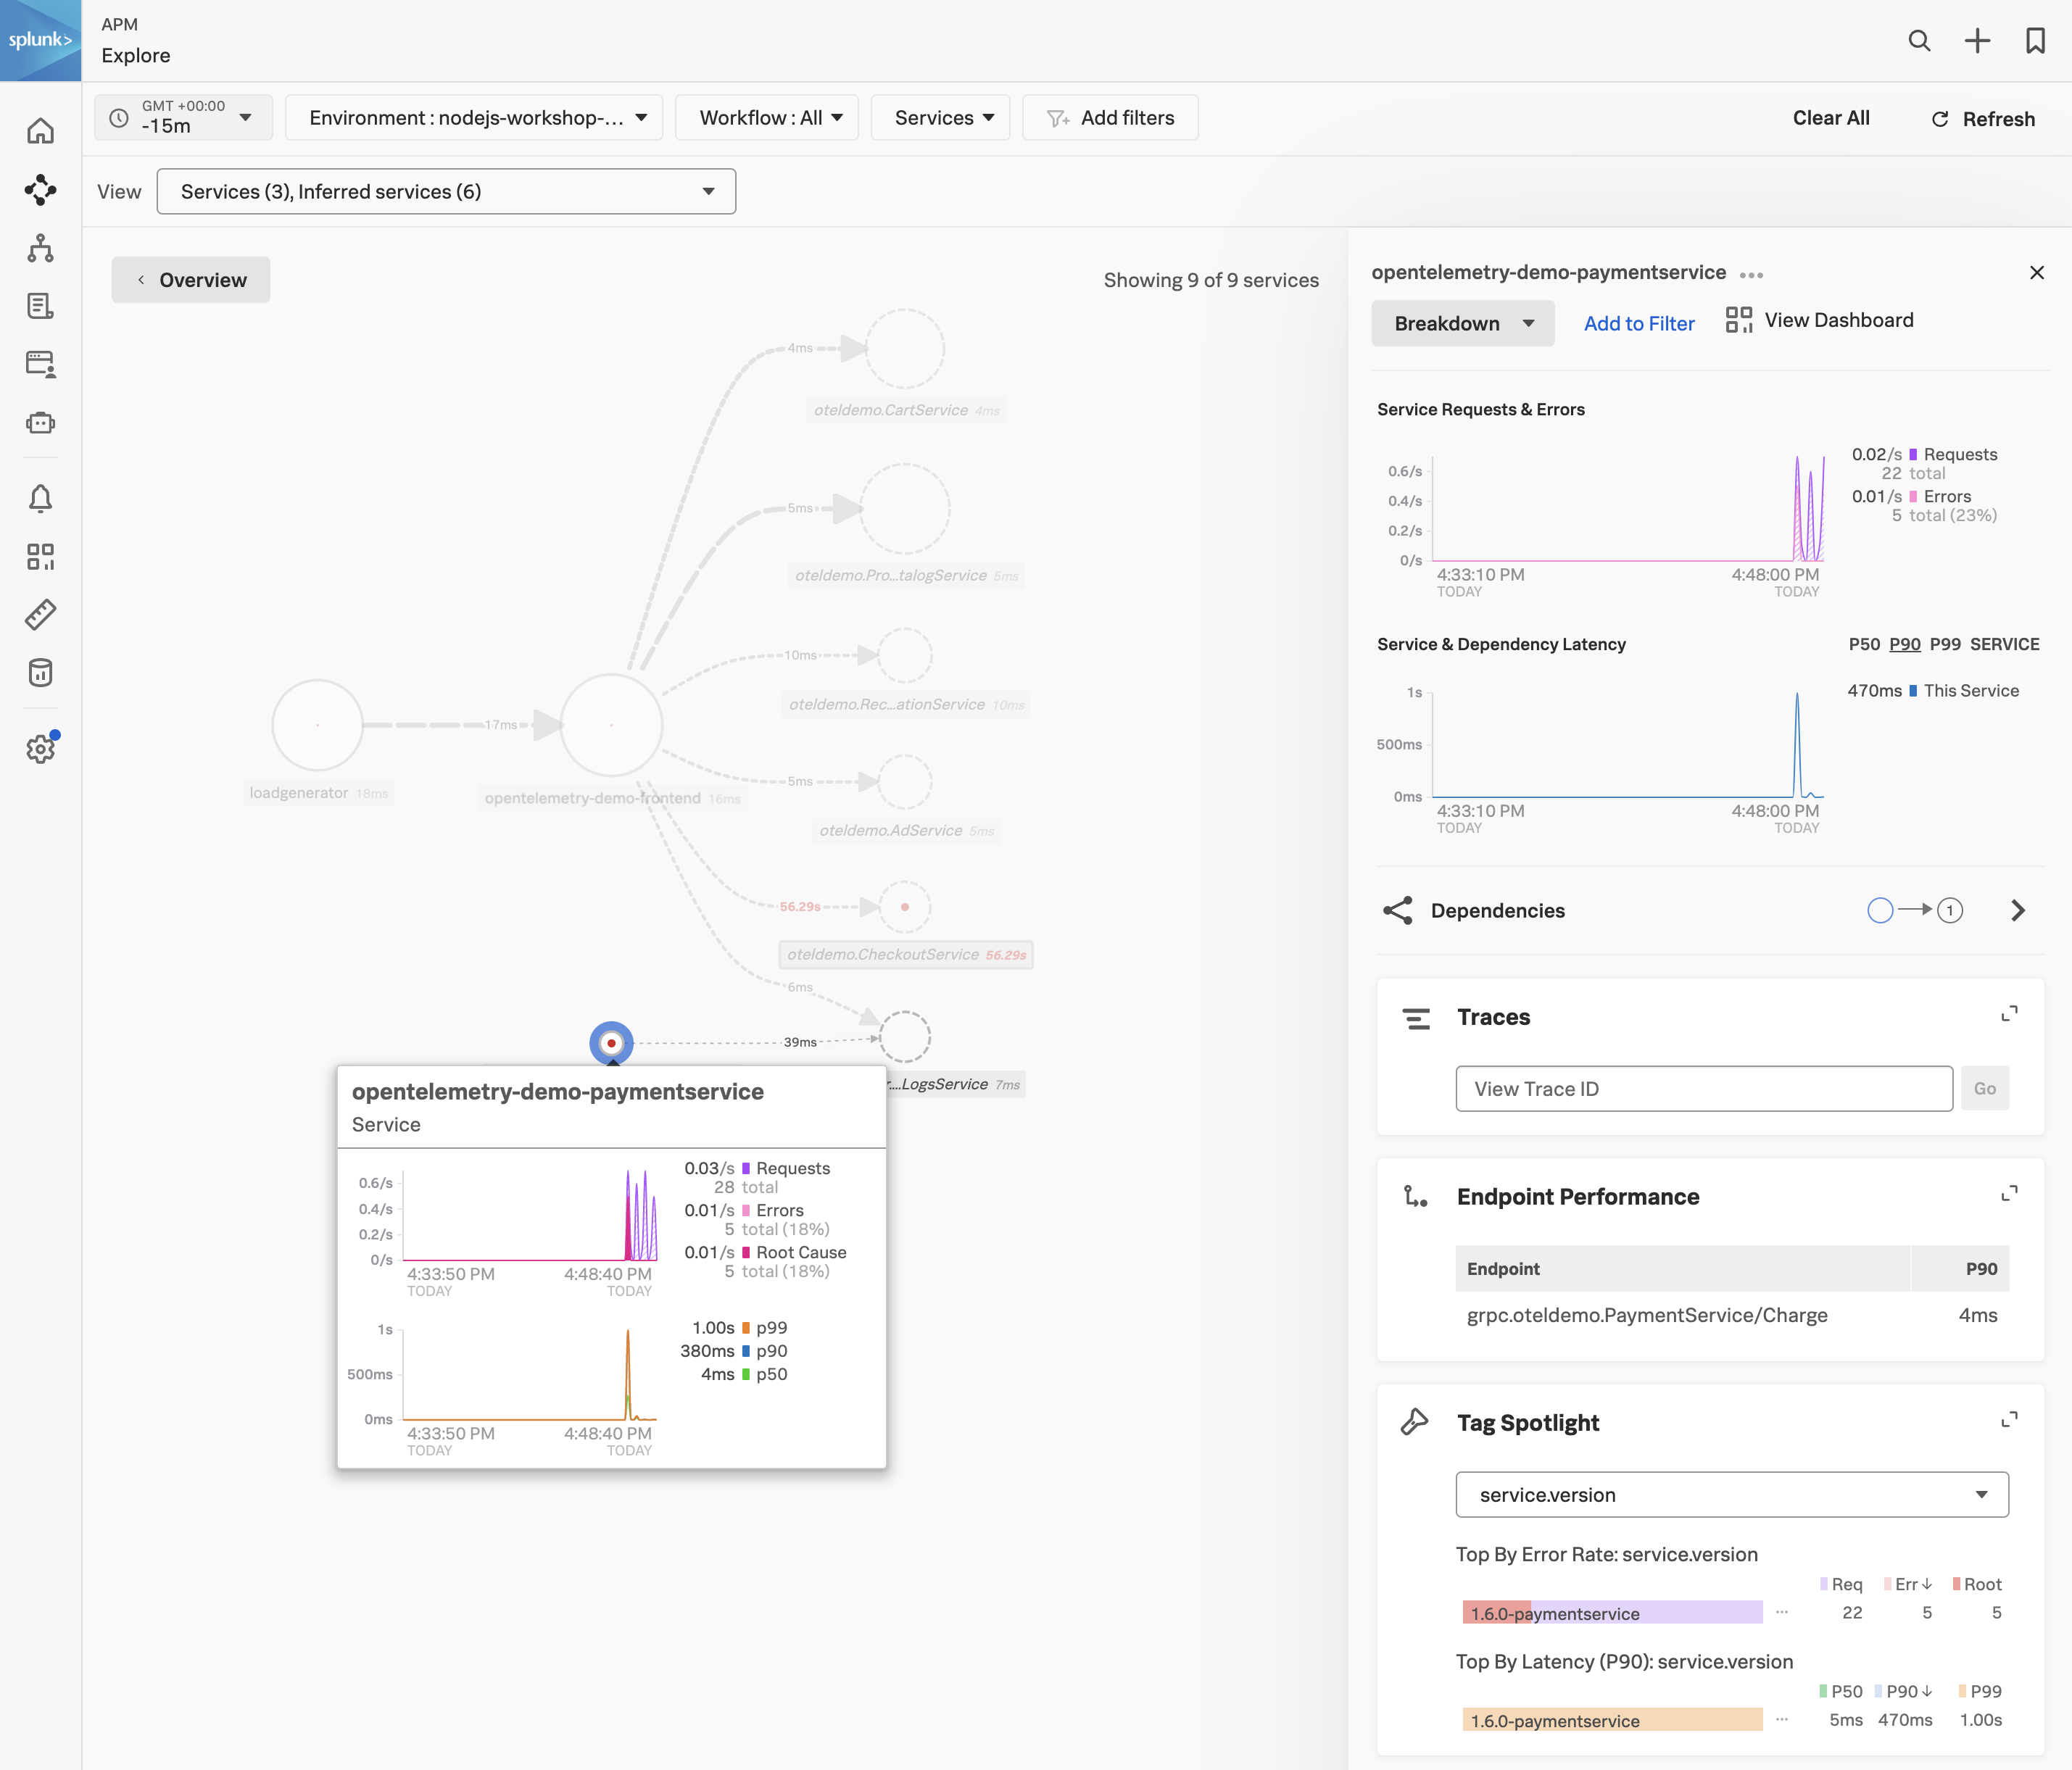
Finally, we will patch the paymentservice deployment with an annotation to inject the NodeJS auto instrumentation. This will allow us to see the paymentservice service in APM.
This will cause the opentelemetry-demo-paymentservice pod to restart and after a few minutes, you should see the paymentservice service in APM.
Code Profiling - Payment Service
1. AlwaysOn Profiling for the Payment Service
AlwaysOn Profiling is a feature of the Splunk Distribution of OpenTelemetry Collector that allows you to collect CPU and Memory profiling data for your services without having to modify your code. This is useful for troubleshooting performance issues in your services. Here are some of the benefits of AlwaysOn Profiling:
Perform continuous profiling of your applications. The profiler is always on once you activate it.
Collect code performance context and link it to trace data.
Explore memory usage and garbage collection of your application.
Analyze code bottlenecks that impact service performance.
Identify inefficiencies that increase the need for scaling up cloud resources.
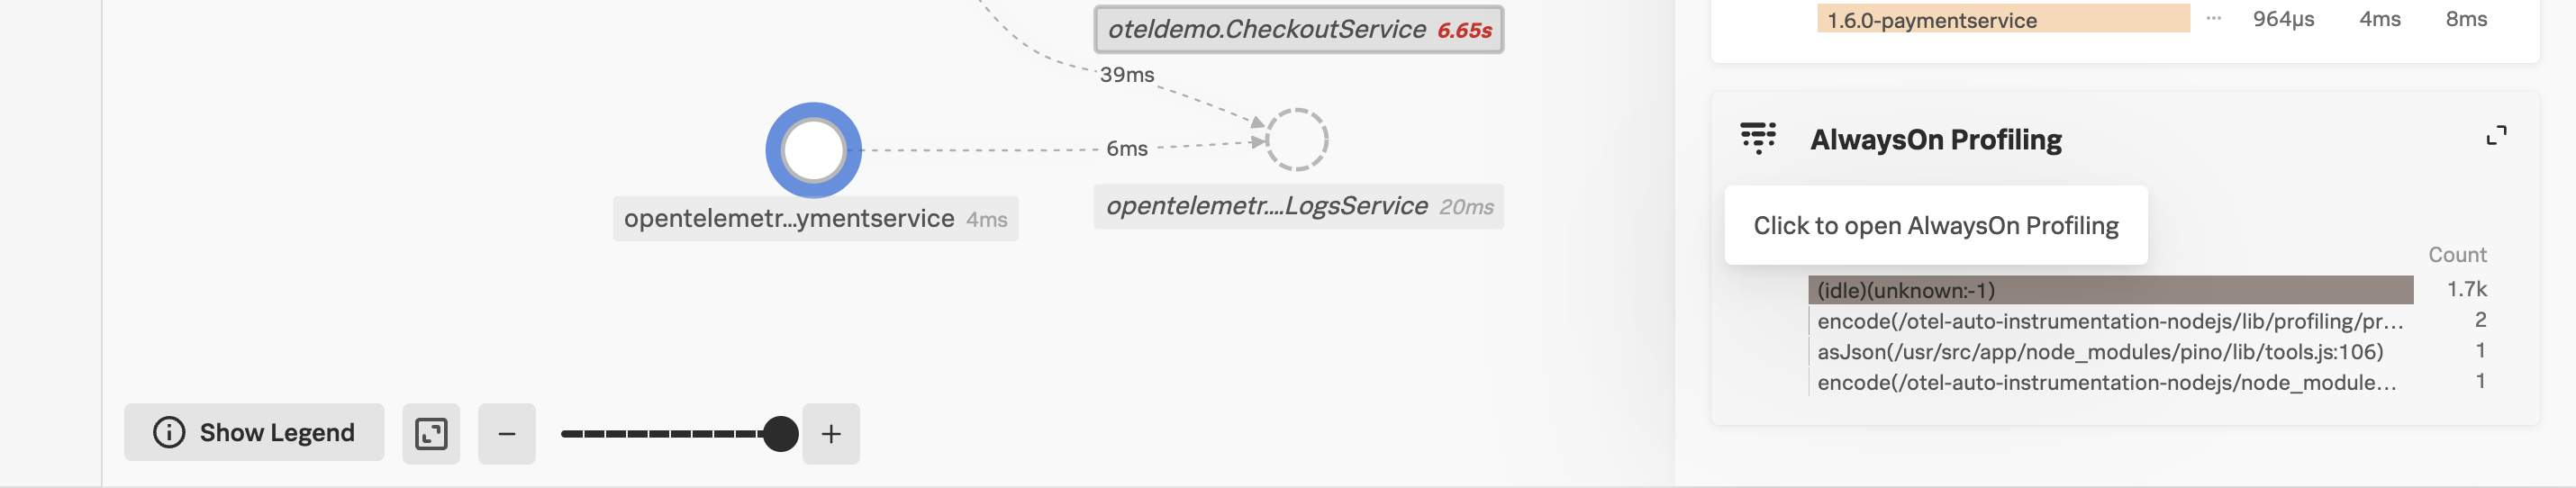
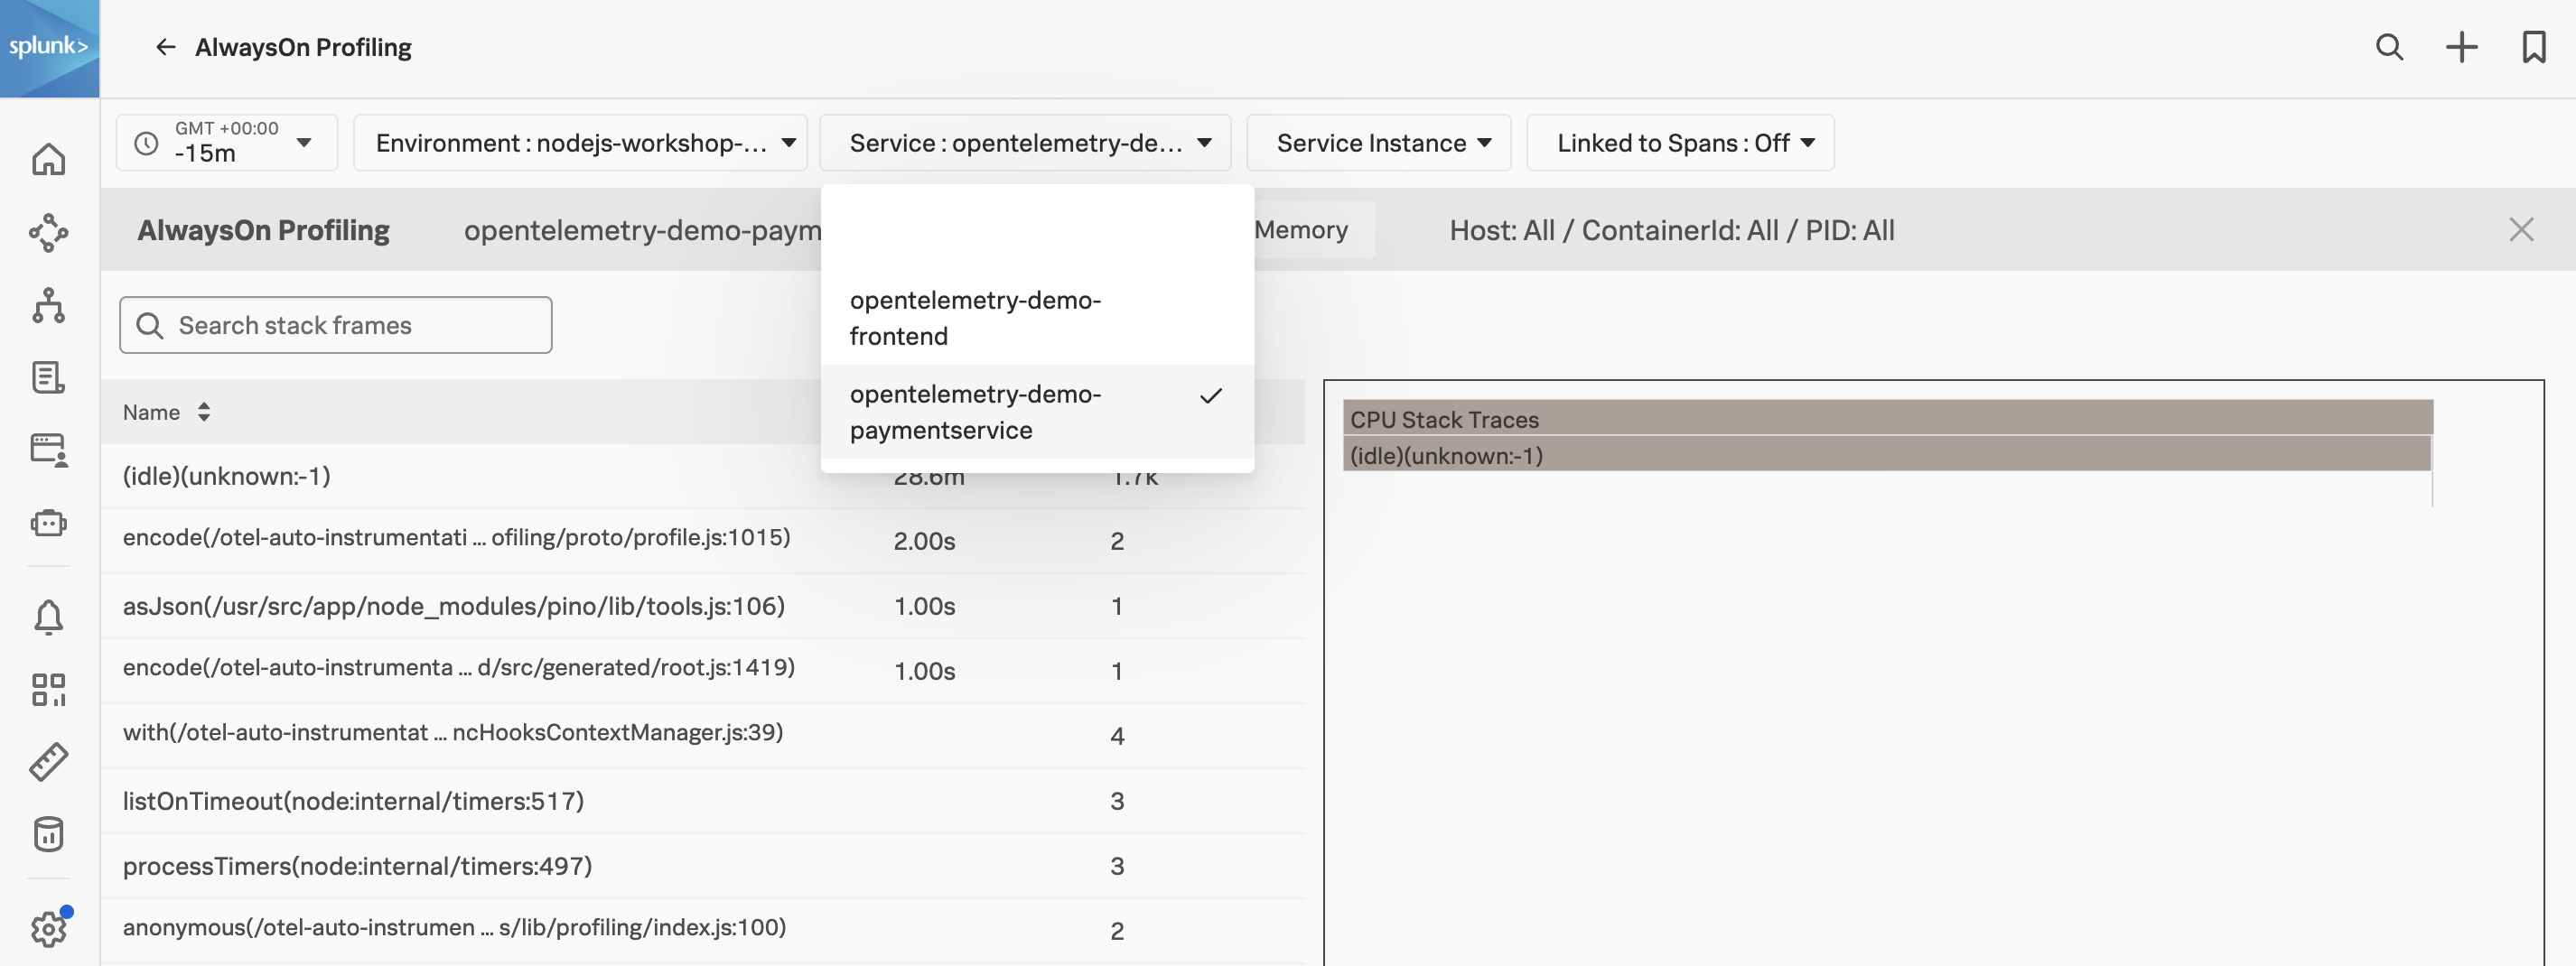
With the opentelemetry-demo-paymentservice selected, click on AlwaysOn Profiling to view the code profiling data for the service.
Here you can see the CPU and Memory profiling data for the paymentservice service. You can also see the CPU and Memory profiling data for the frontend service by selecting the opentelemetry-demofrontend service from the Service dropdown.
Logs - Payment Service
1. Viewing the logs for the Payment Service
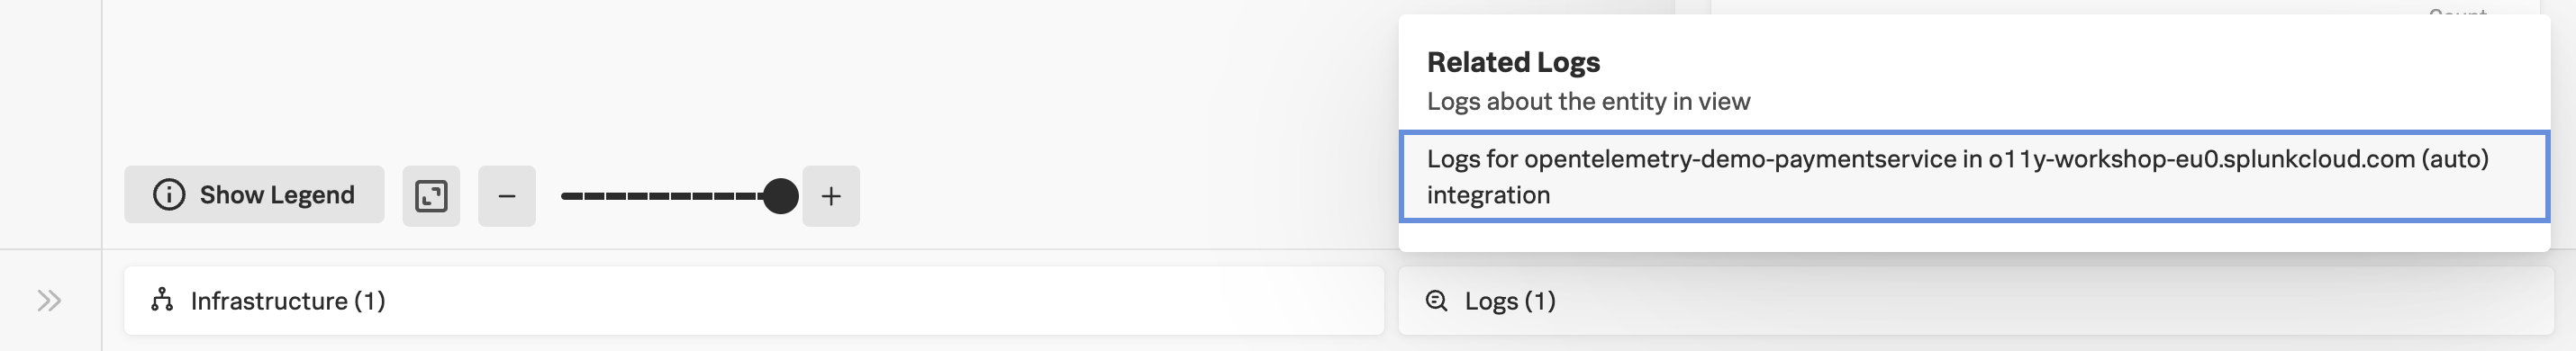
Navigate back to APM from the main menu and under Services click on opentelemetry-demo-paymentservice. This will open up the Service map for the paymentservice service only.
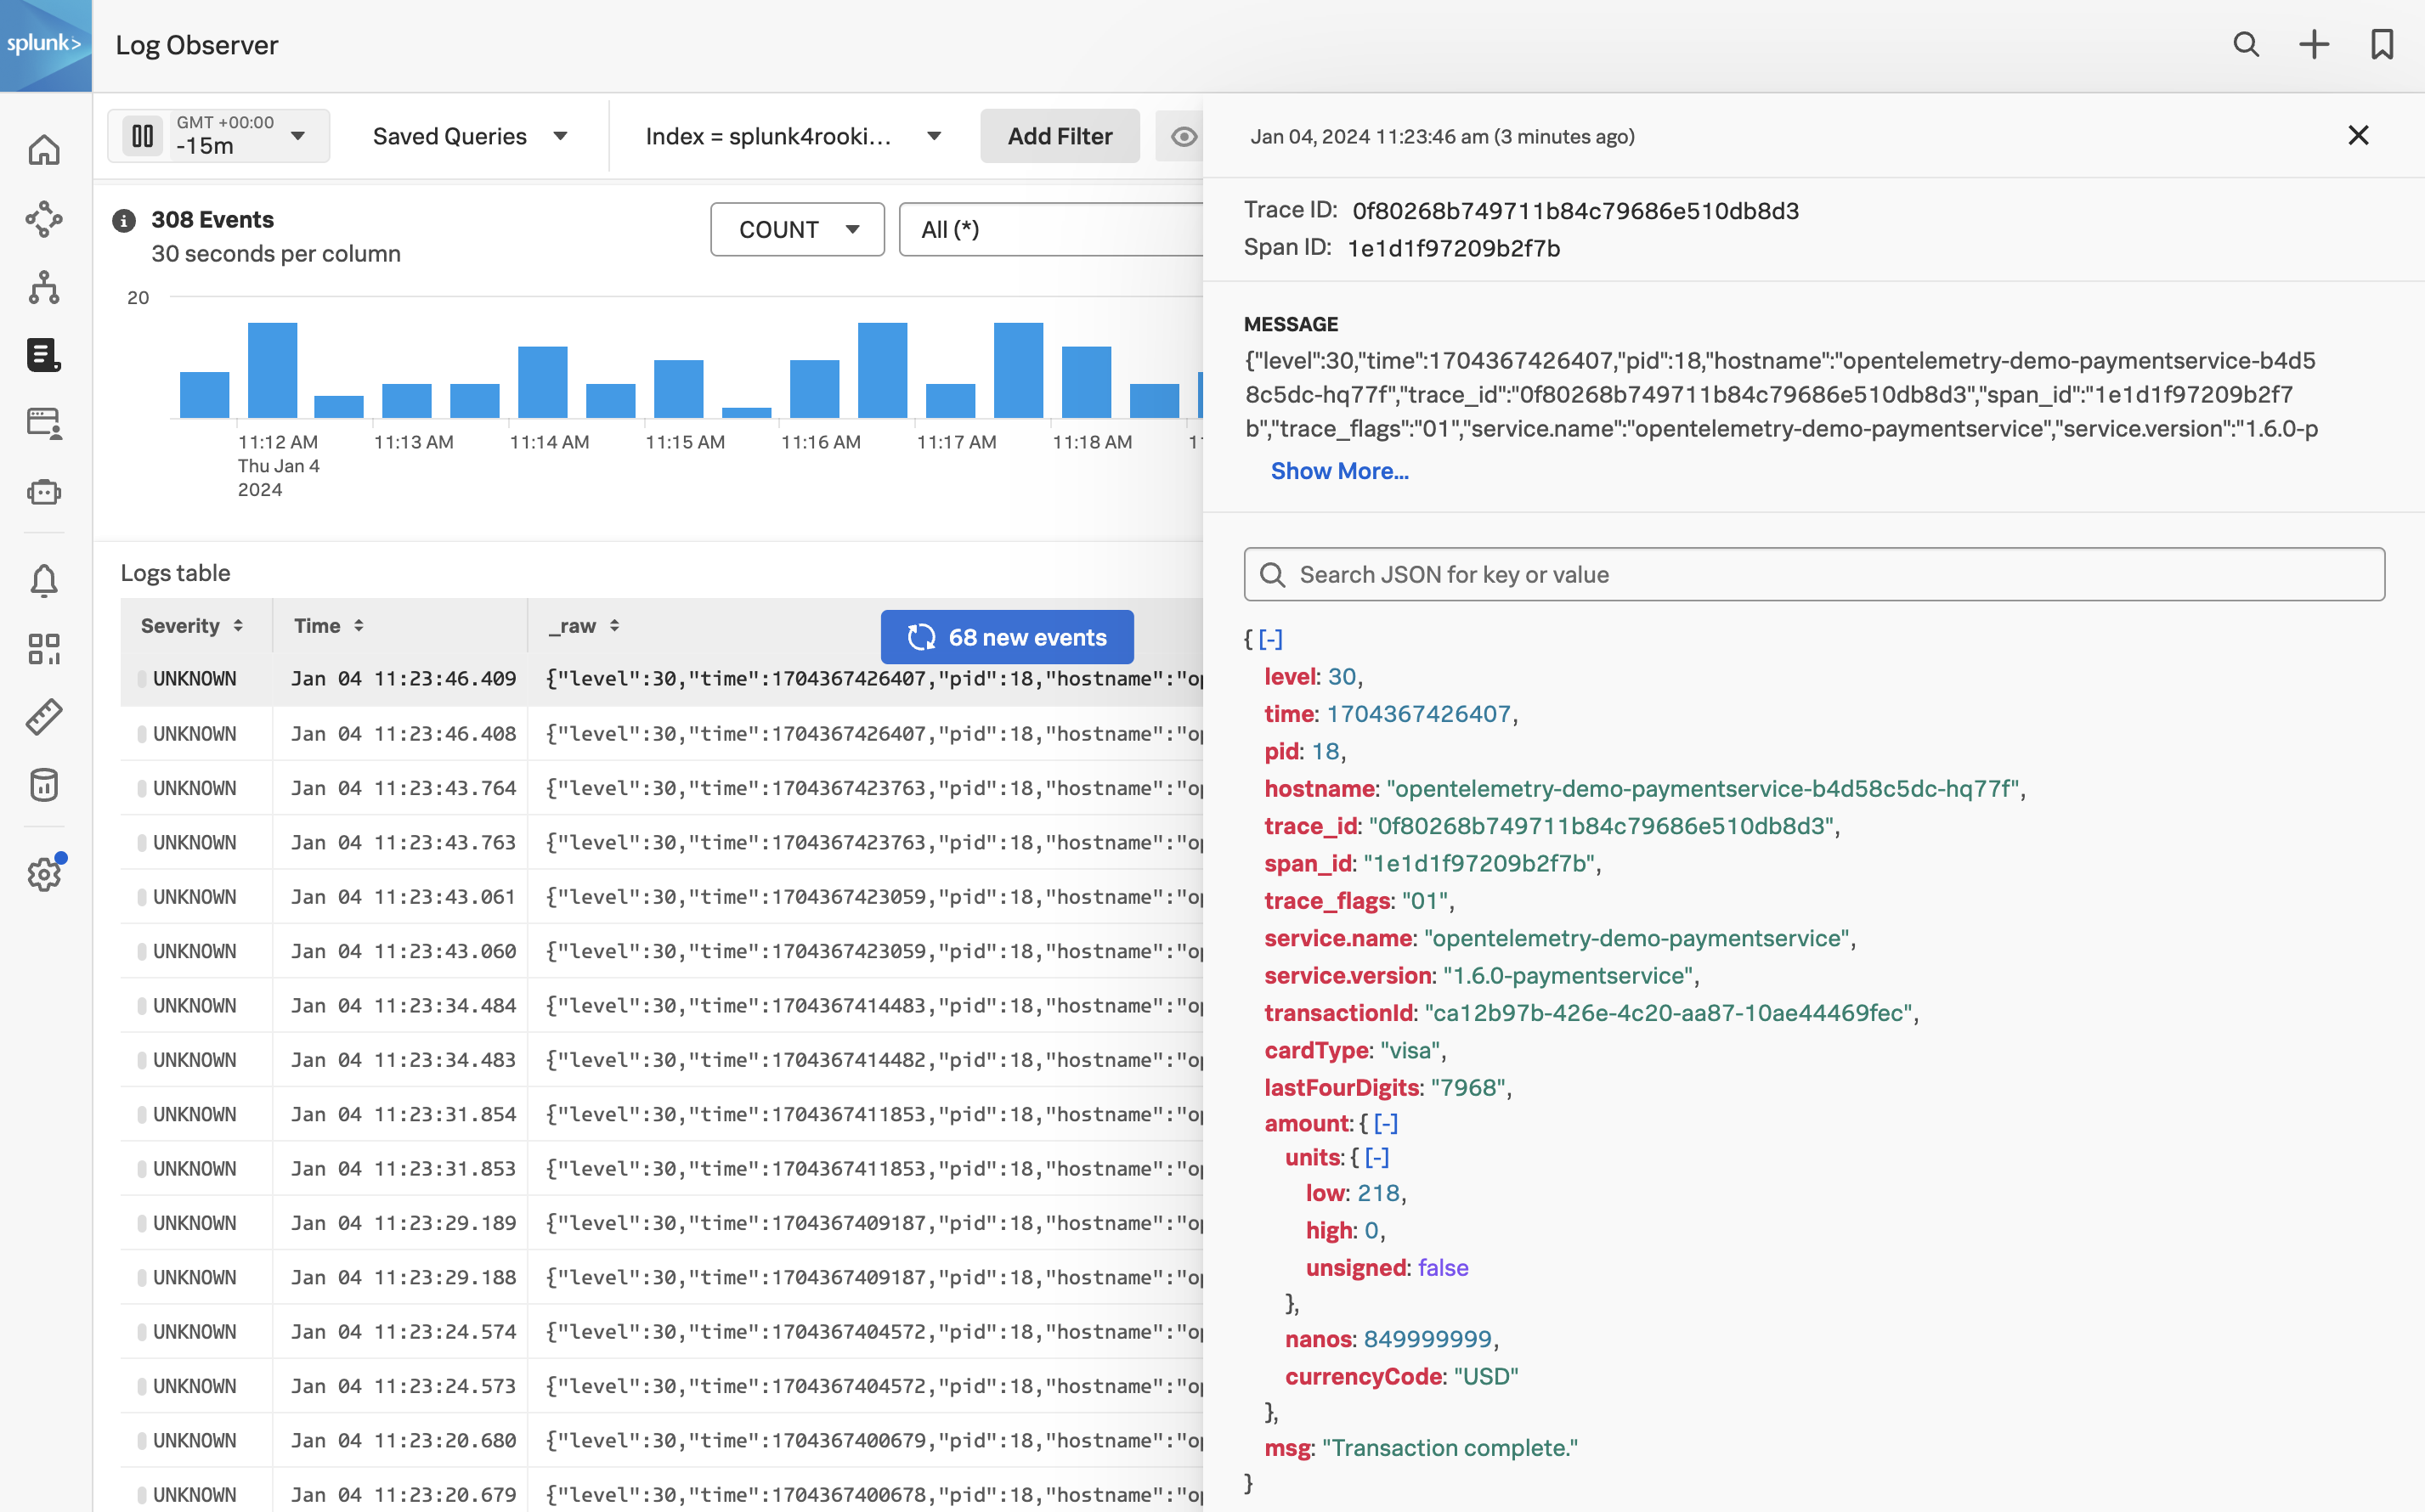
At the bottom of the page, click on the Logs(1) tab to view the logs for the paymentservice service.
Once in Log Observer select one of the log entries to view the metadata for the log entry.