Monitoring Horizontal Pod Autoscaling in Kubernetes
45 minutesAuthor
Robert Castley
This workshop will equip you with a basic understanding of monitoring Kubernetes using the Splunk OpenTelemetry Collector. During the workshop, you will deploy PHP/Apache and a load generator.
You will learn about OpenTelemetry Receivers, Kubernetes Namespaces, ReplicaSets, Kubernetes Horizontal Pod AutoScaling and how to monitor all this using the Splunk Observability Cloud. The main learnings from the workshop will be a better understanding of the Kubernetes Navigator (and Dashboards) in Splunk Observability Cloud as well as seeing Kubernetes metrics, events and Detectors.
For this workshop, Splunk has prepared an Ubuntu Linux instance in AWS/EC2 all pre-configured for you.
To get access to the instance that you will be using in the workshop, please visit the URL provided by the workshop leader.
Subsections of Monitoring Horizontal Pod Autoscaling in Kubernetes
Deploying the OpenTelemetry Collector in Kubernetes using a NameSpace
1. Kubernetes Navigator 2.0 UI
We will be starting this workshop using the new Kubernetes Navigator so please check that you are already using the new Navigator.
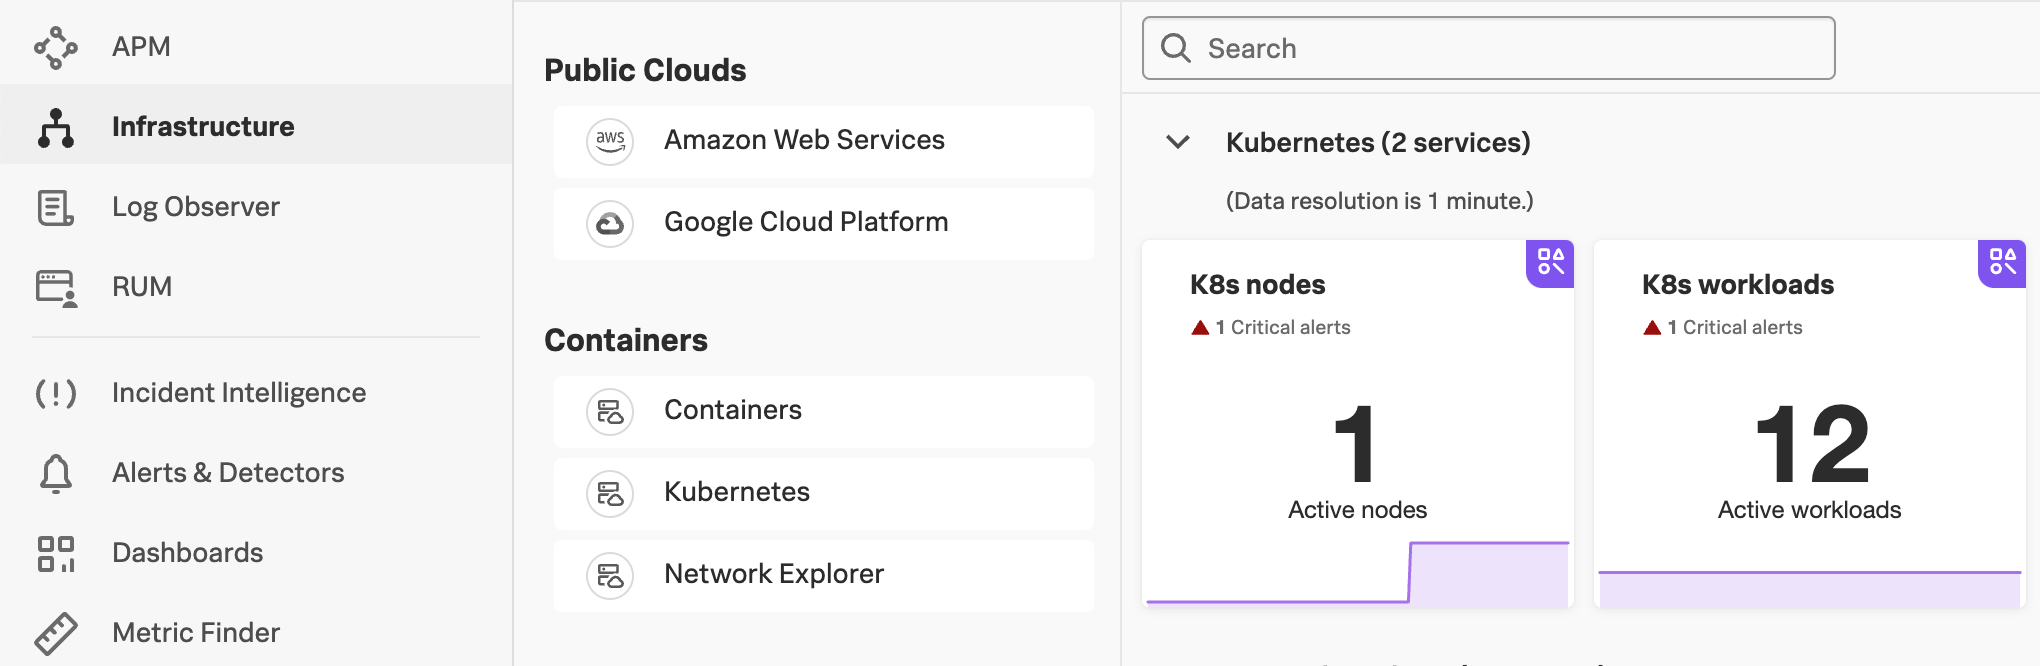
When you select Infrastructure from the main menu on the left, followed by selecting Kubernetes, you should see two service panes (K8s nodes and K8s workloads) for Kubernetes, similar to the ones below:
2. Connect to EC2 instance
You will be able to connect to the workshop instance by using SSH from your Mac, Linux or Windows device. Open the link to the sheet provided by your instructor. This sheet contains the IP addresses and the password for the workshop instances.
Info
Your workshop instance has been pre-configured with the correct Access Token and Realm for this workshop. There is no need for you to configure these.
3. Install Splunk OTel using Helm
Install the OpenTelemetry Collector using the Splunk Helm chart. First, add the Splunk Helm chart repository and update.
Using ACCESS_TOKEN=<REDACTED>
Using REALM=eu0
"splunk-otel-collector-chart" has been added to your repositories
Using ACCESS_TOKEN=<REDACTED>
Using REALM=eu0
Hang tight while we grab the latest from your chart repositories...
...Successfully got an update from the "splunk-otel-collector-chart" chart repository
Update Complete. ⎈Happy Helming!⎈
Install the OpenTelemetry Collector Helm with the following commands, do NOT edit this:
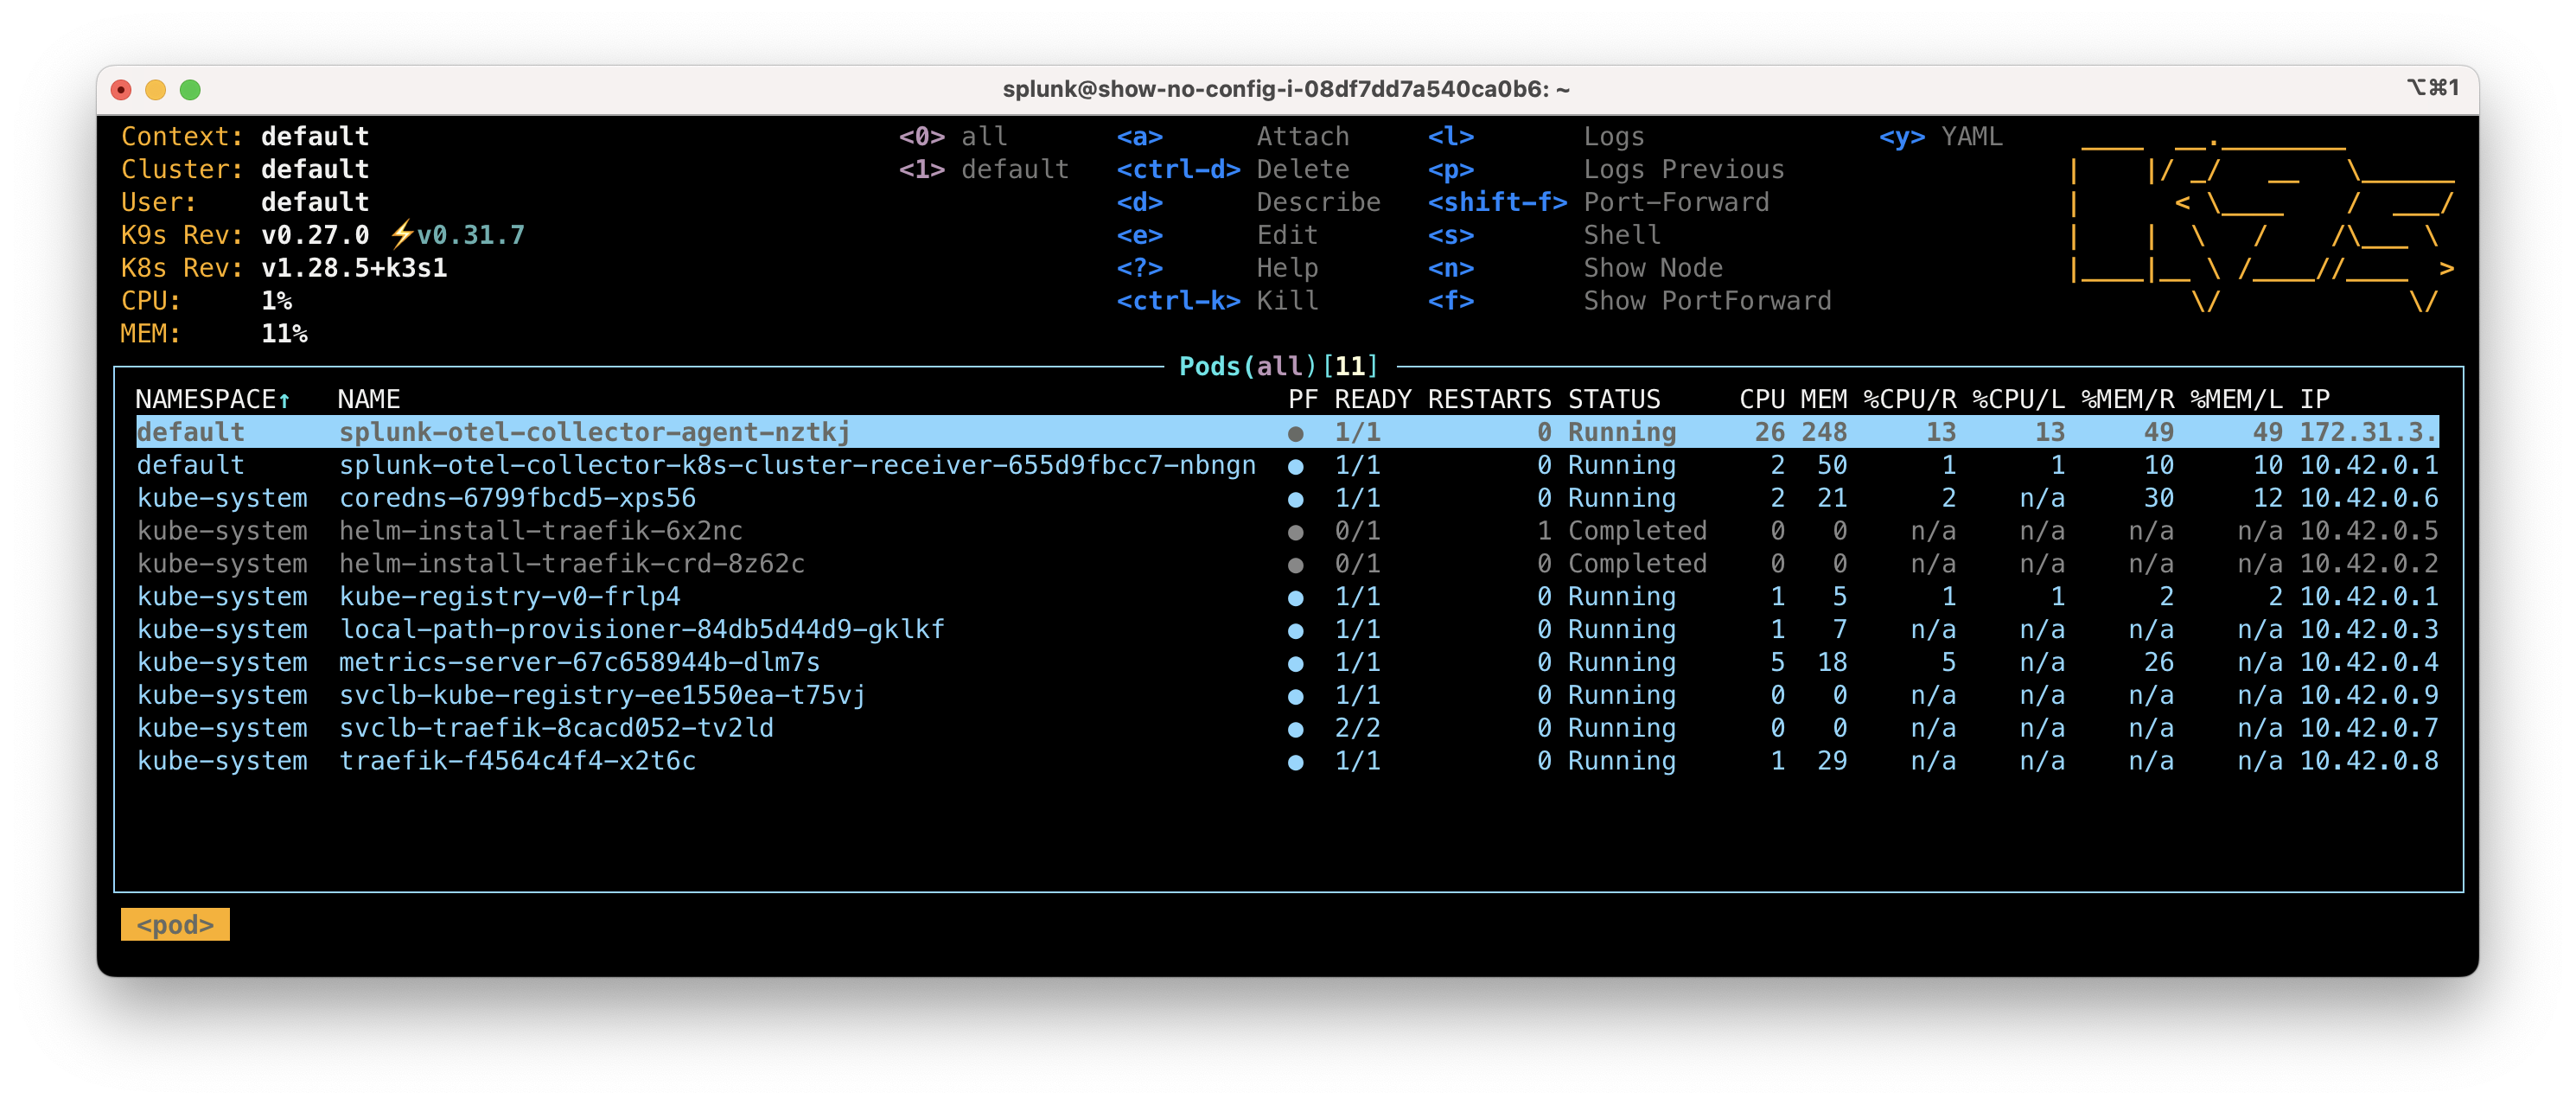
You can monitor the progress of the deployment by running kubectl get pods which should typically report that the new pods are up and running after about 30 seconds.
Ensure the status is reported as Running before continuing.
kubectl get pods
NAME                                                          READY   STATUS    RESTARTS   AGE
splunk-otel-collector-agent-pvstb                             2/2     Running   0          19s
splunk-otel-collector-k8s-cluster-receiver-6c454894f8-mqs8n   1/1     Running   0          19s
Use the label set by the helm install to tail logs (You will need to press ctrl + c to exit).
If you make an error installing the Splunk OpenTelemetry Collector you can start over by deleting the installation using:
helm delete splunk-otel-collector
Tour of the Kubernetes Navigator
1. Cluster vs Workload View
The Kubernetes Navigator offers you two separate use cases to view your Kubernetes data.
The K8s workloads are focusing on providing information in regards to workloads a.k.a. your deployments.
The K8s nodes are focusing on providing insight into the performance of clusters, nodes, pods and containers.
You will initially select either view depending on your need (you can switch between the view on the fly if required). The most common one we will use in this workshop is the workload view and we will focus on that specifically.
1.1 Finding your K8s Cluster Name
Your first task is to identify and find your cluster. The cluster will be named as determined by the preconfigured environment variable INSTANCE. To confirm the cluster name enter the following command in your terminal:
echo$INSTANCE-k3s-cluster
Please make a note of your cluster name as you will need this later in the workshop for filtering.
2. Workloads & Workload Details Pane
Go to the Infrastructure page in the Observability UI and select Kubernetes, this will offer you a set of Kubernetes services, one of them being the K8s workloads pane.
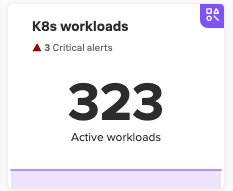
The pane will show a tiny graph giving you a bird’s eye view of the load being handled across those Workloads. Also, if there are any alerts for one of the workloads, you will see a small alert indicator as shown in the image below.
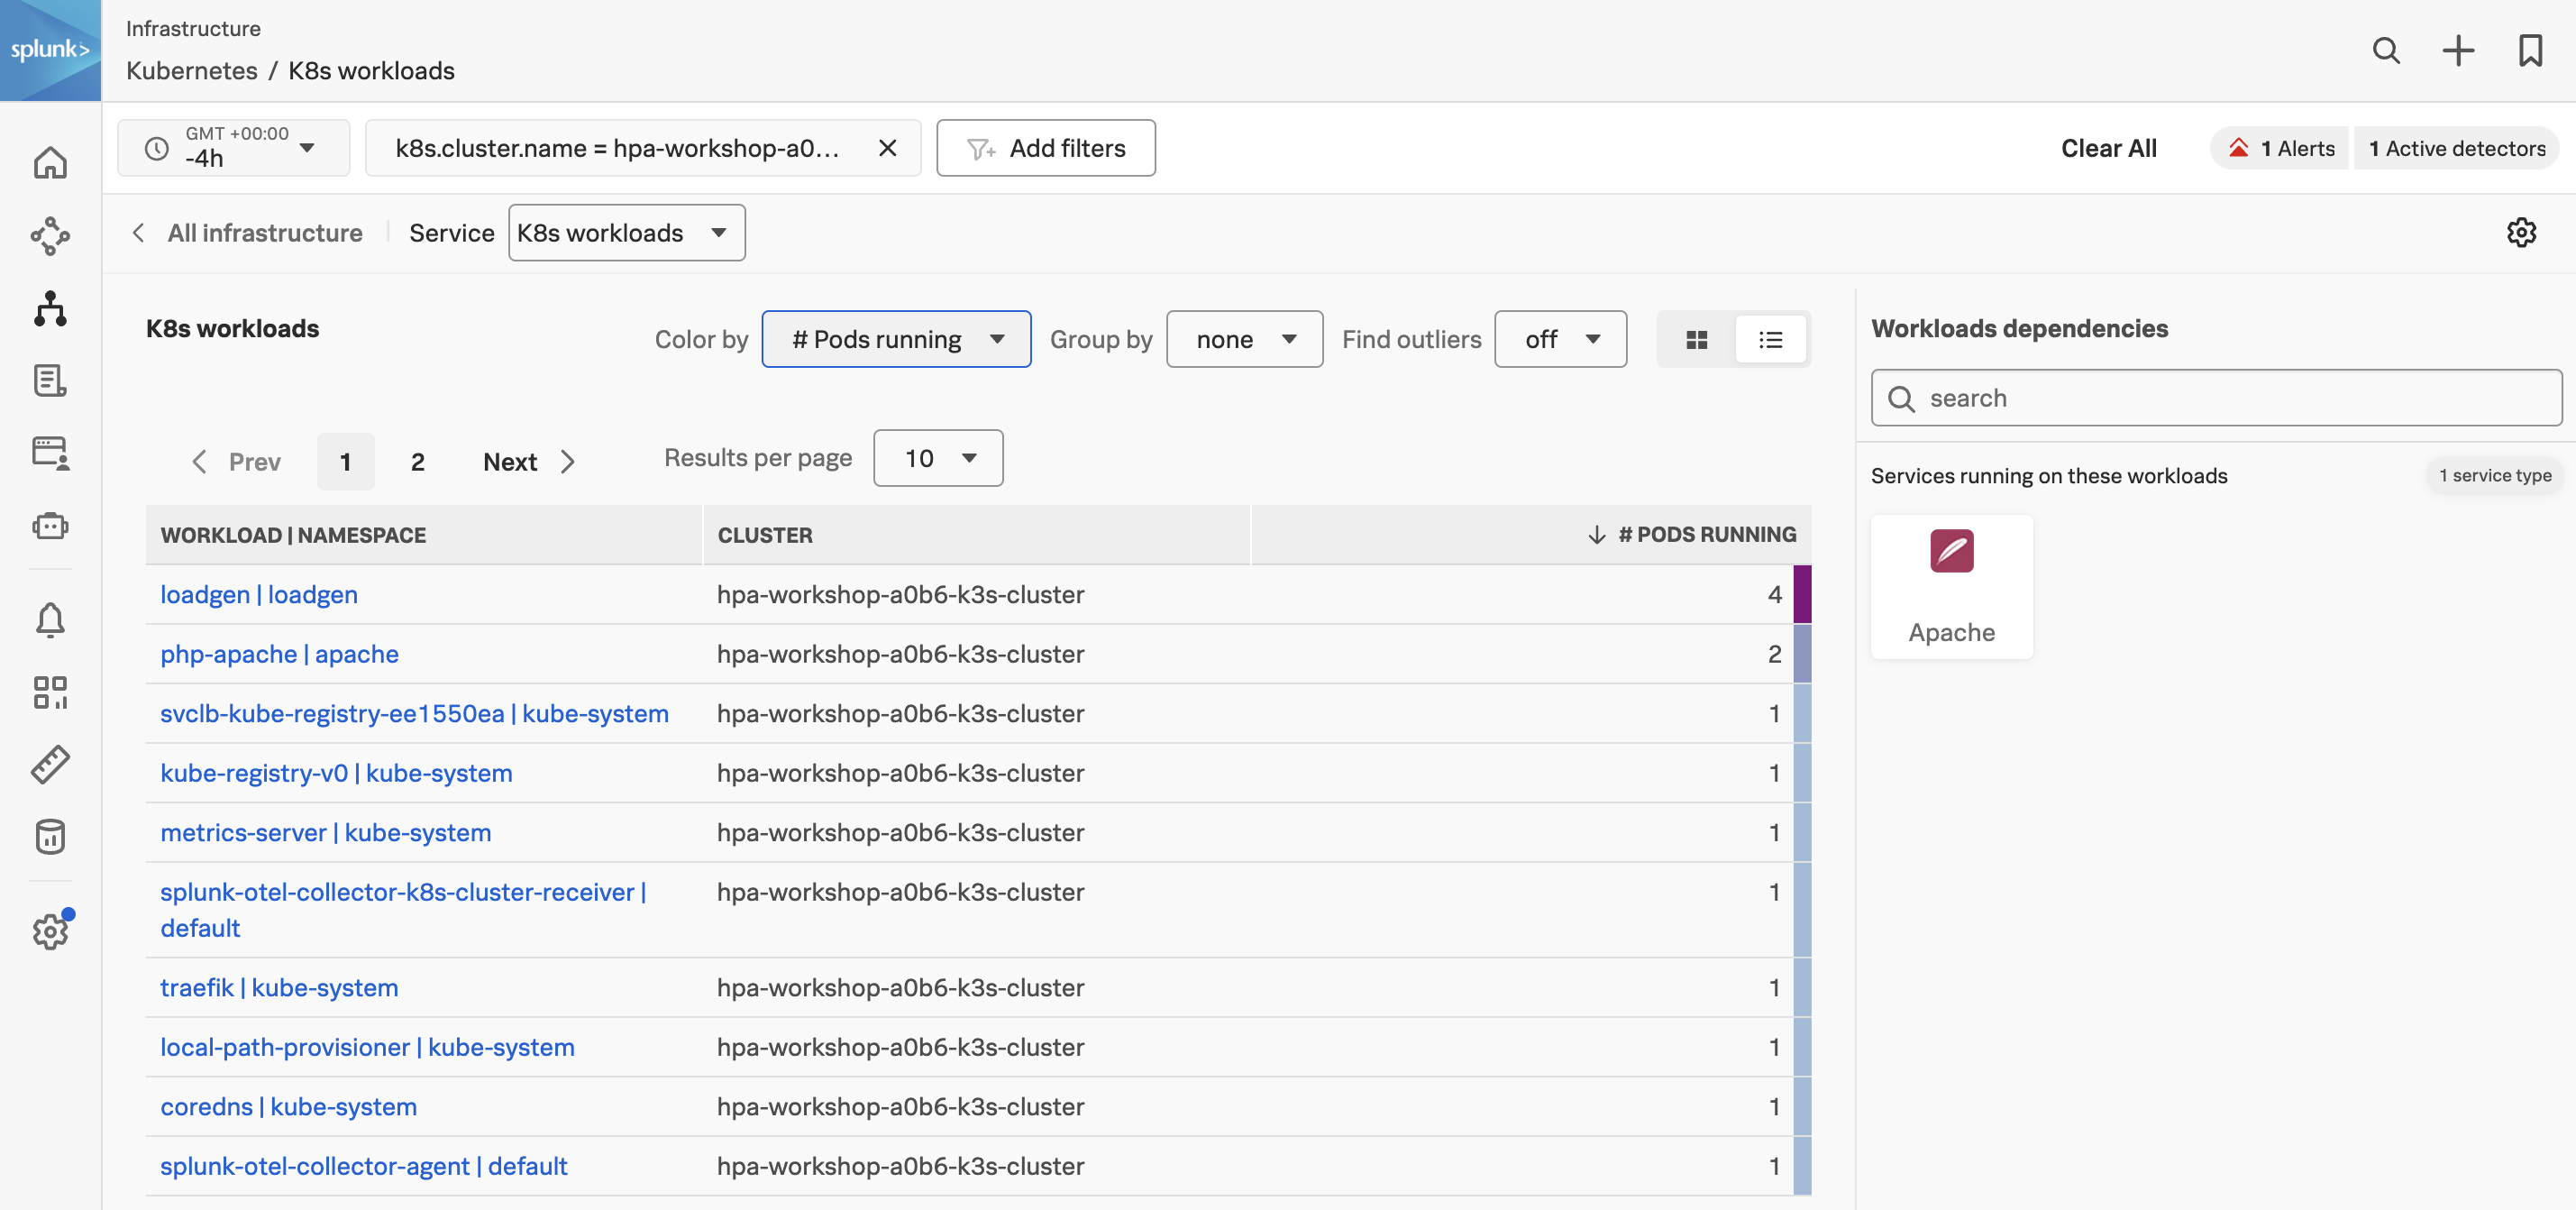
Click on the K8s workloads pane and you will be taken to the workload view.
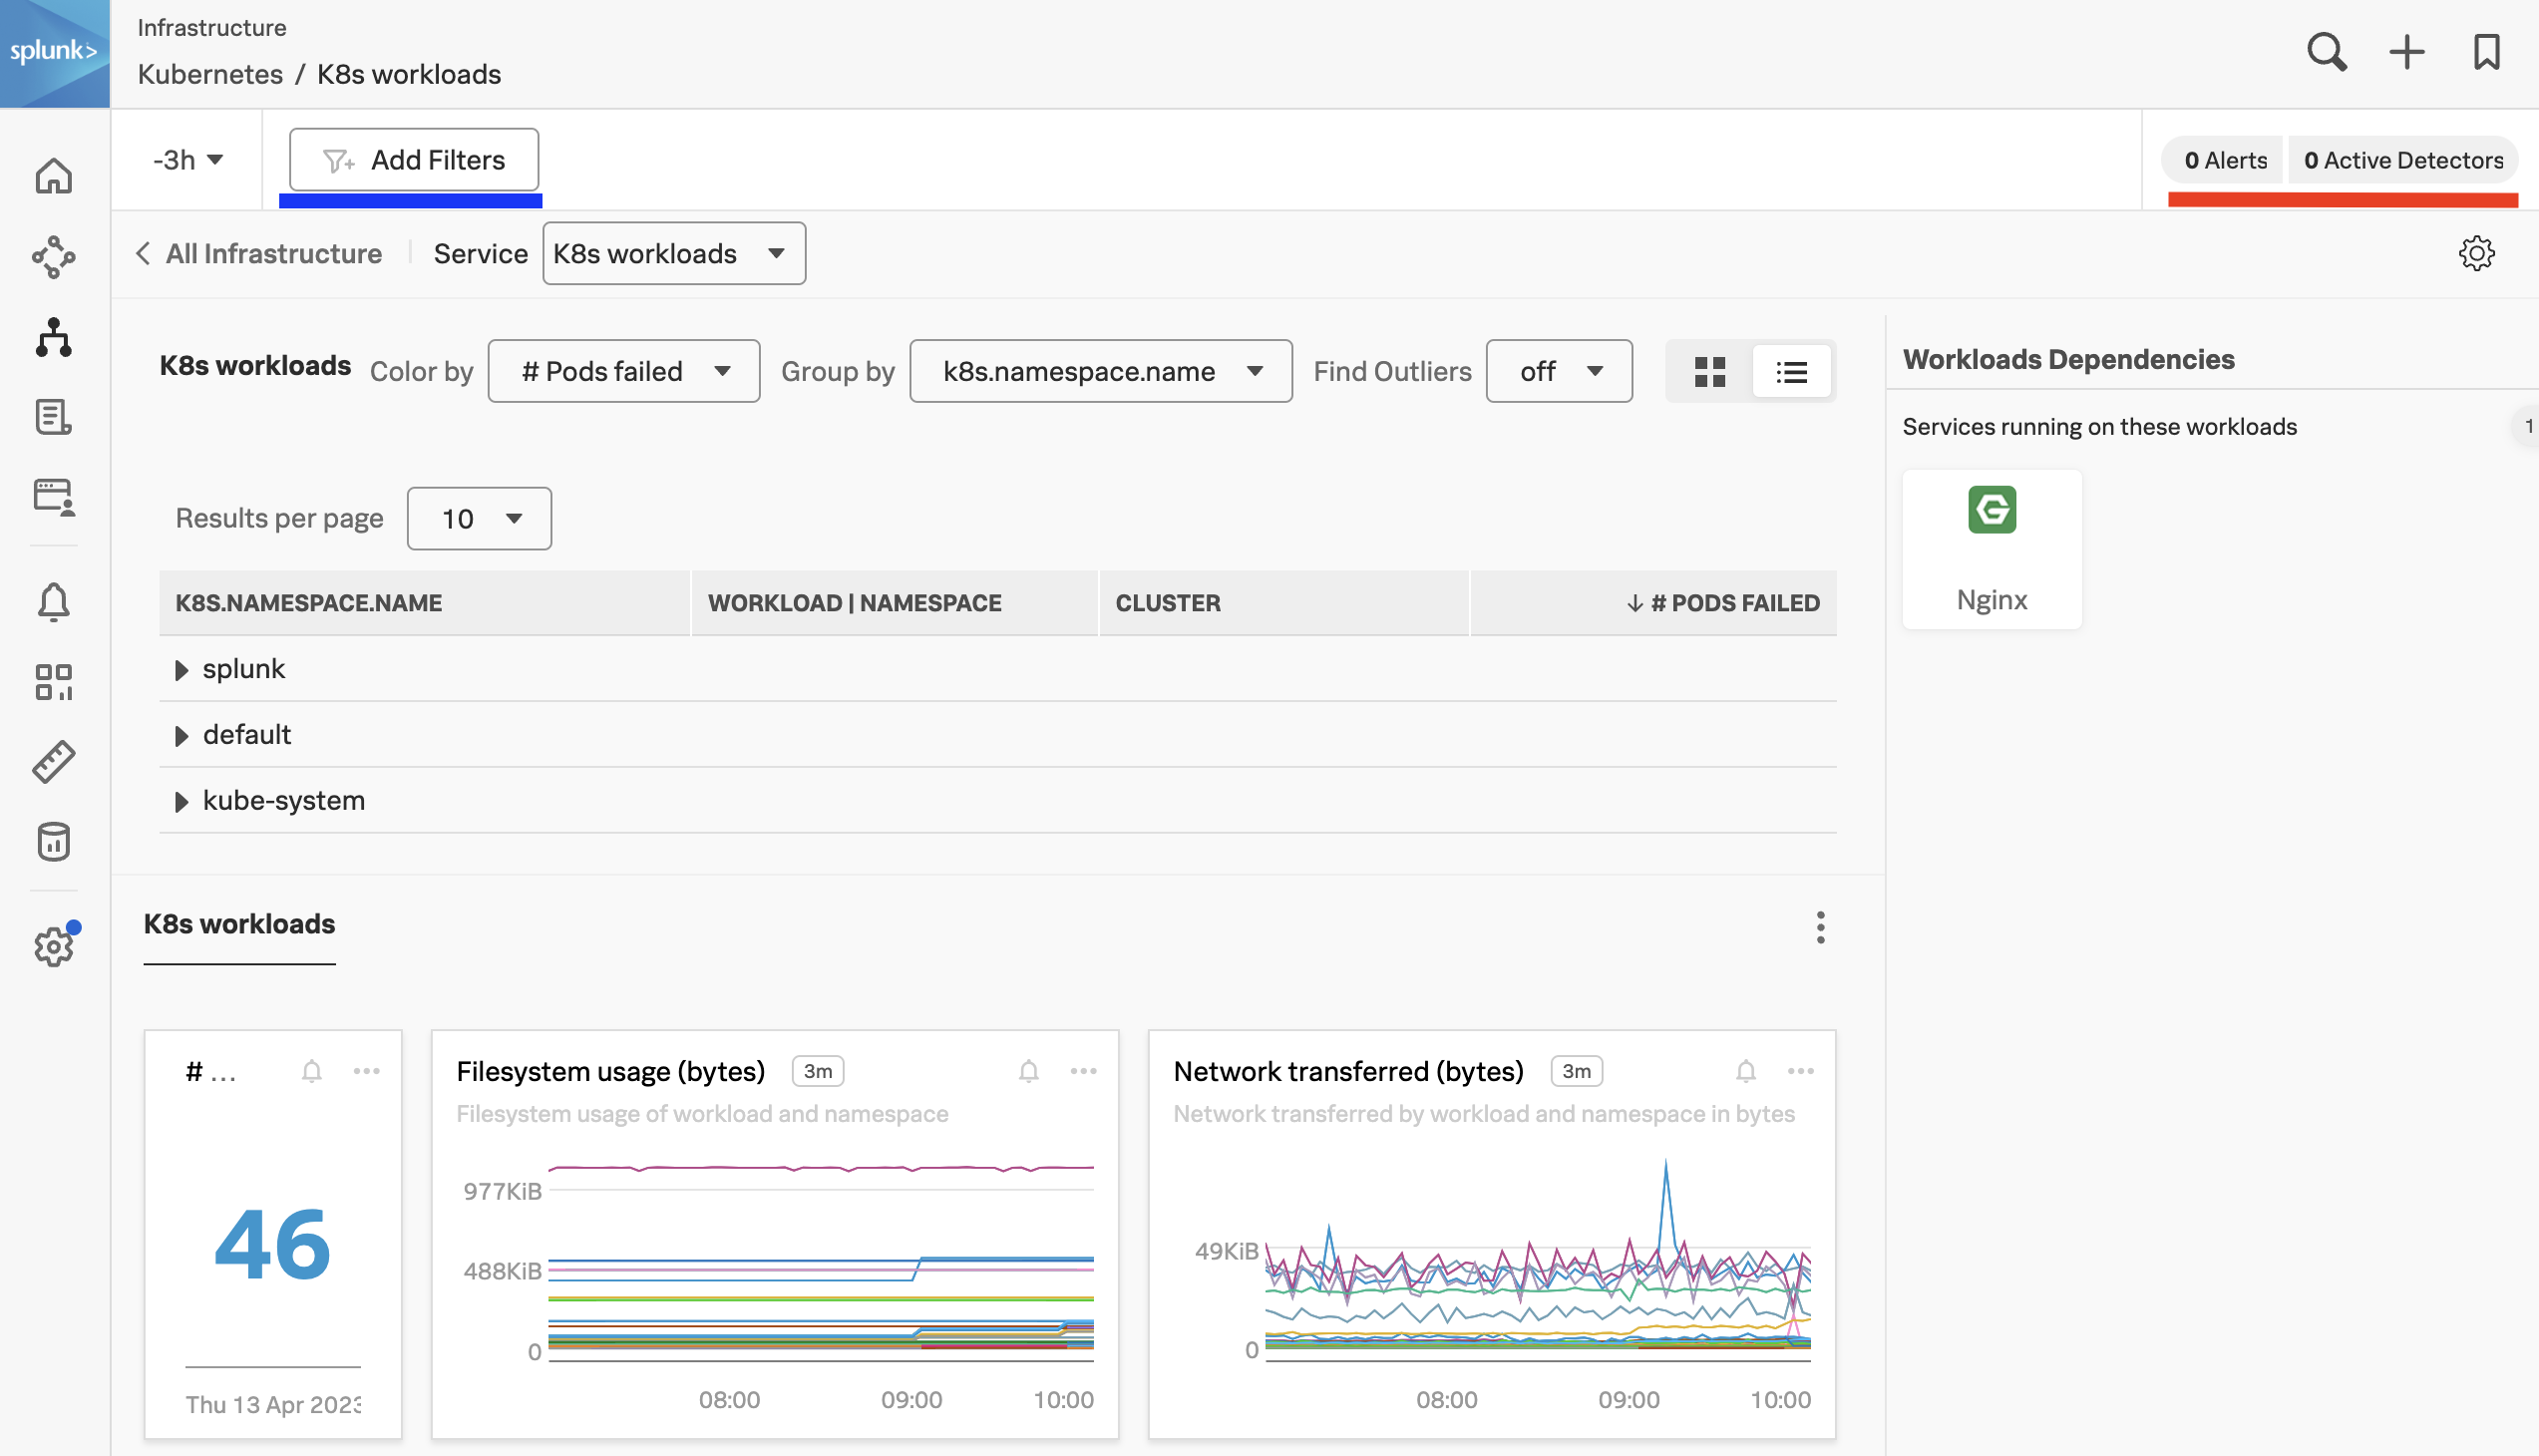
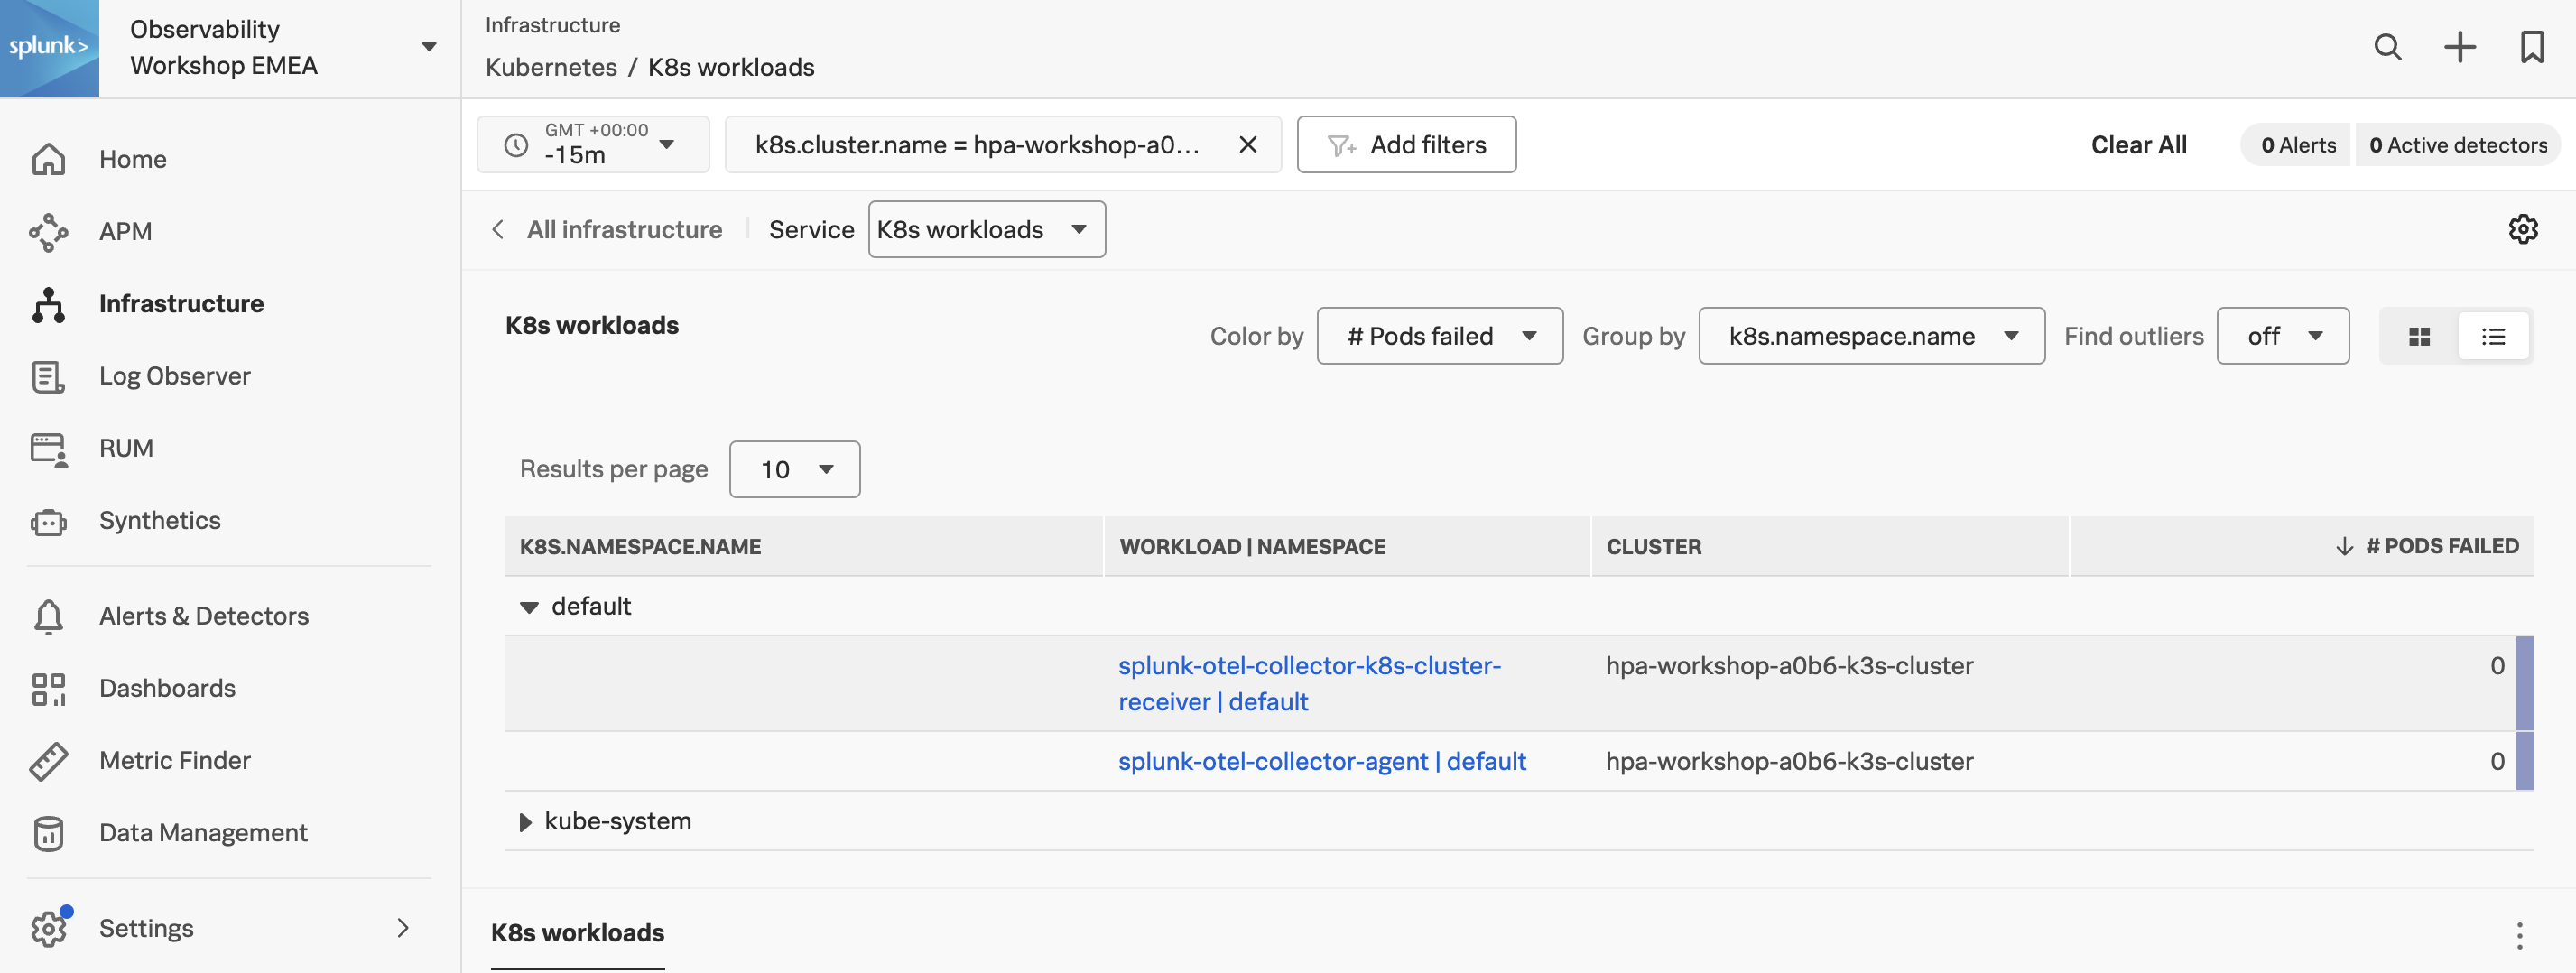
Initially, you will see all the workloads for all clusters that are reported into your Observability Cloud Org. If an alert has fired for any of the workloads, it will be highlighted on the top right (as marked with a red stripe) in the image below. You can go directly to the alert by clicking it to expand it.
Now, let’s find your cluster by filtering on the field k8s.cluster.name in the filter toolbar (as marked with a blue stripe).
Note
You can enter a partial name into the search box, such as emea-ws-7*, to quickly find your Cluster.
Also, it’s a very good idea to switch the default time from the default -4h back to the last 15 minutes (-15m).
You should now just see information for your own cluster.
Workshop Question
How many workloads are running & how many namespaces are in your Cluster?
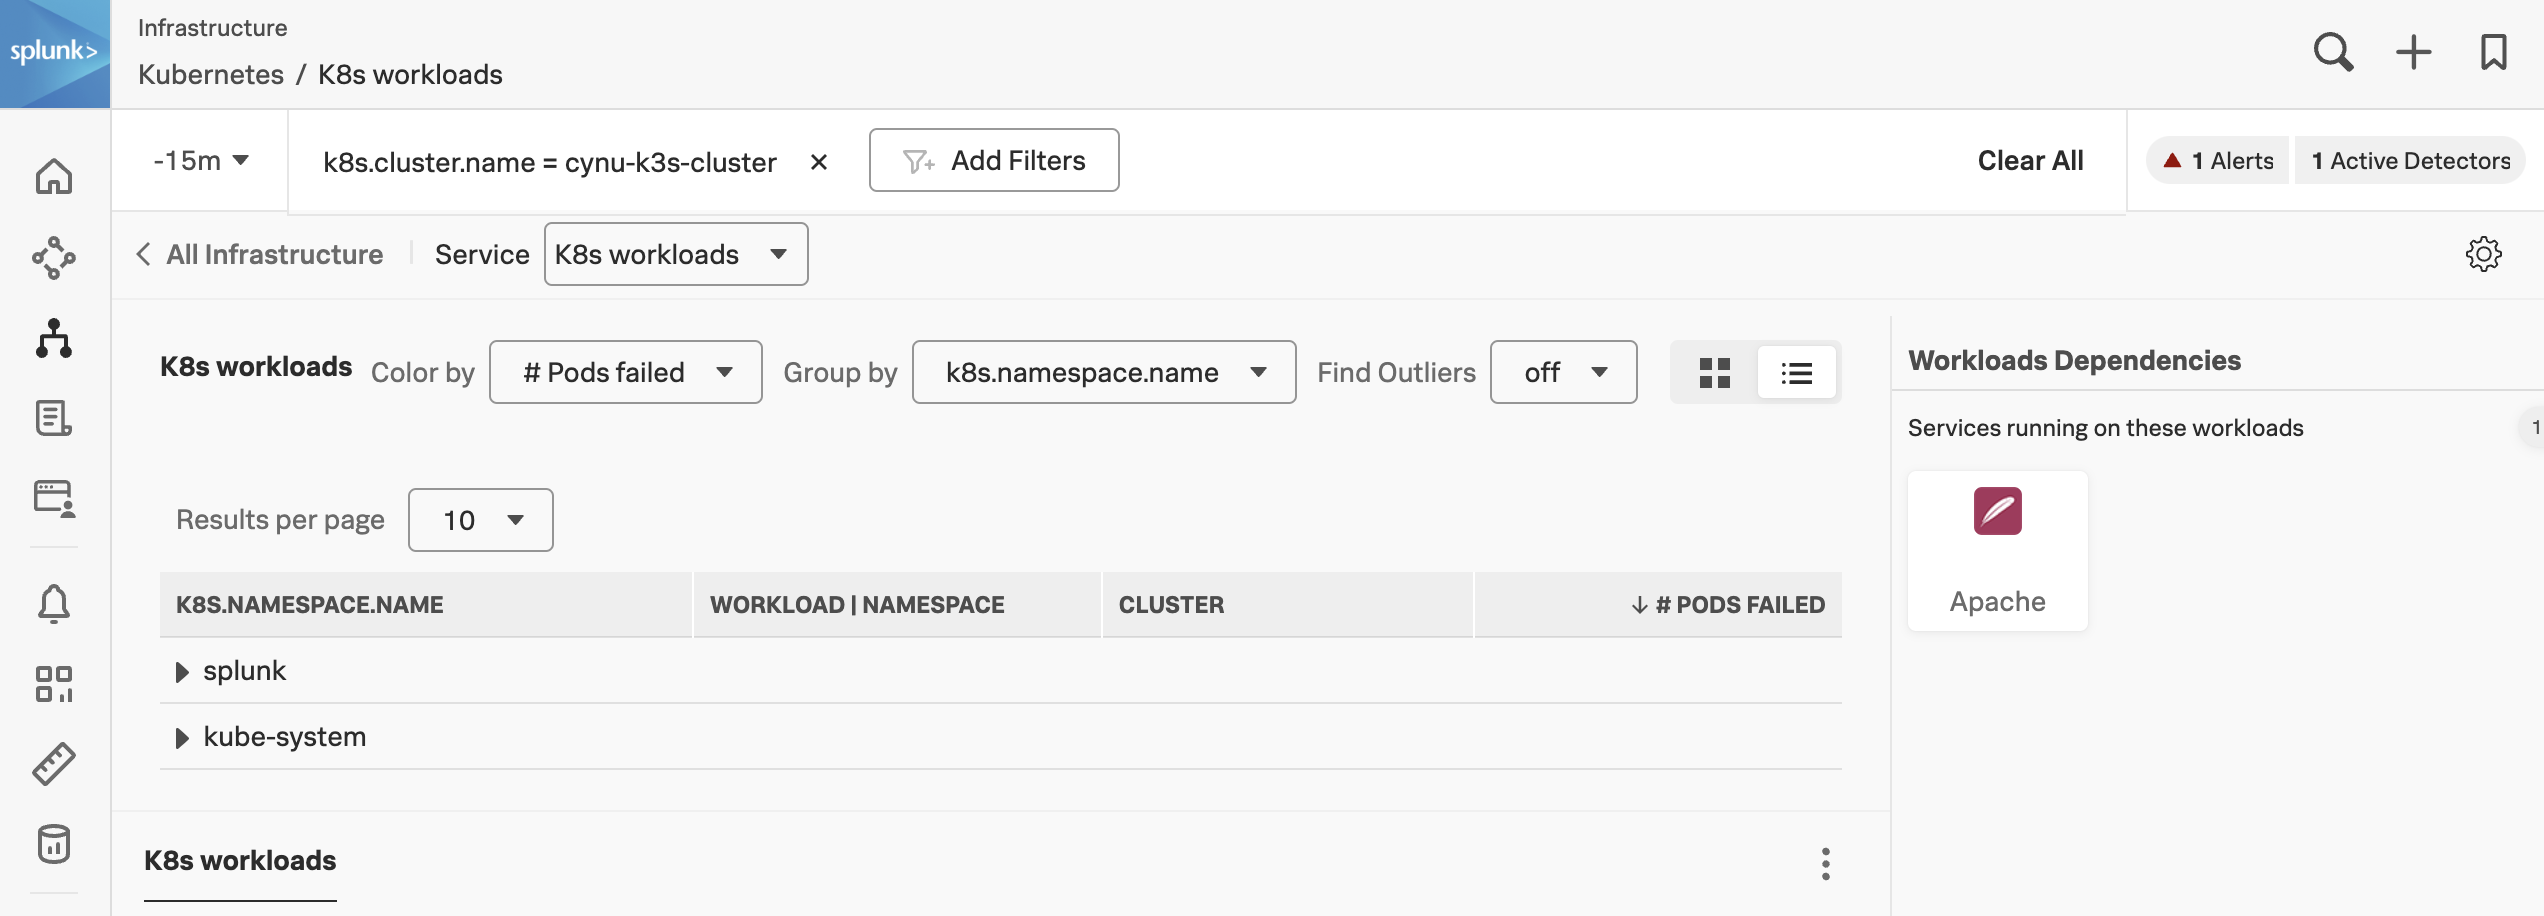
2.1 Using the Navigator Selection Chart
The K8s workloads table is a common feature used across most of the Navigators and will offer you a list view of the data you are viewing. In our case, it shows a list of Pods Failed grouped by k8s.namespace.name.
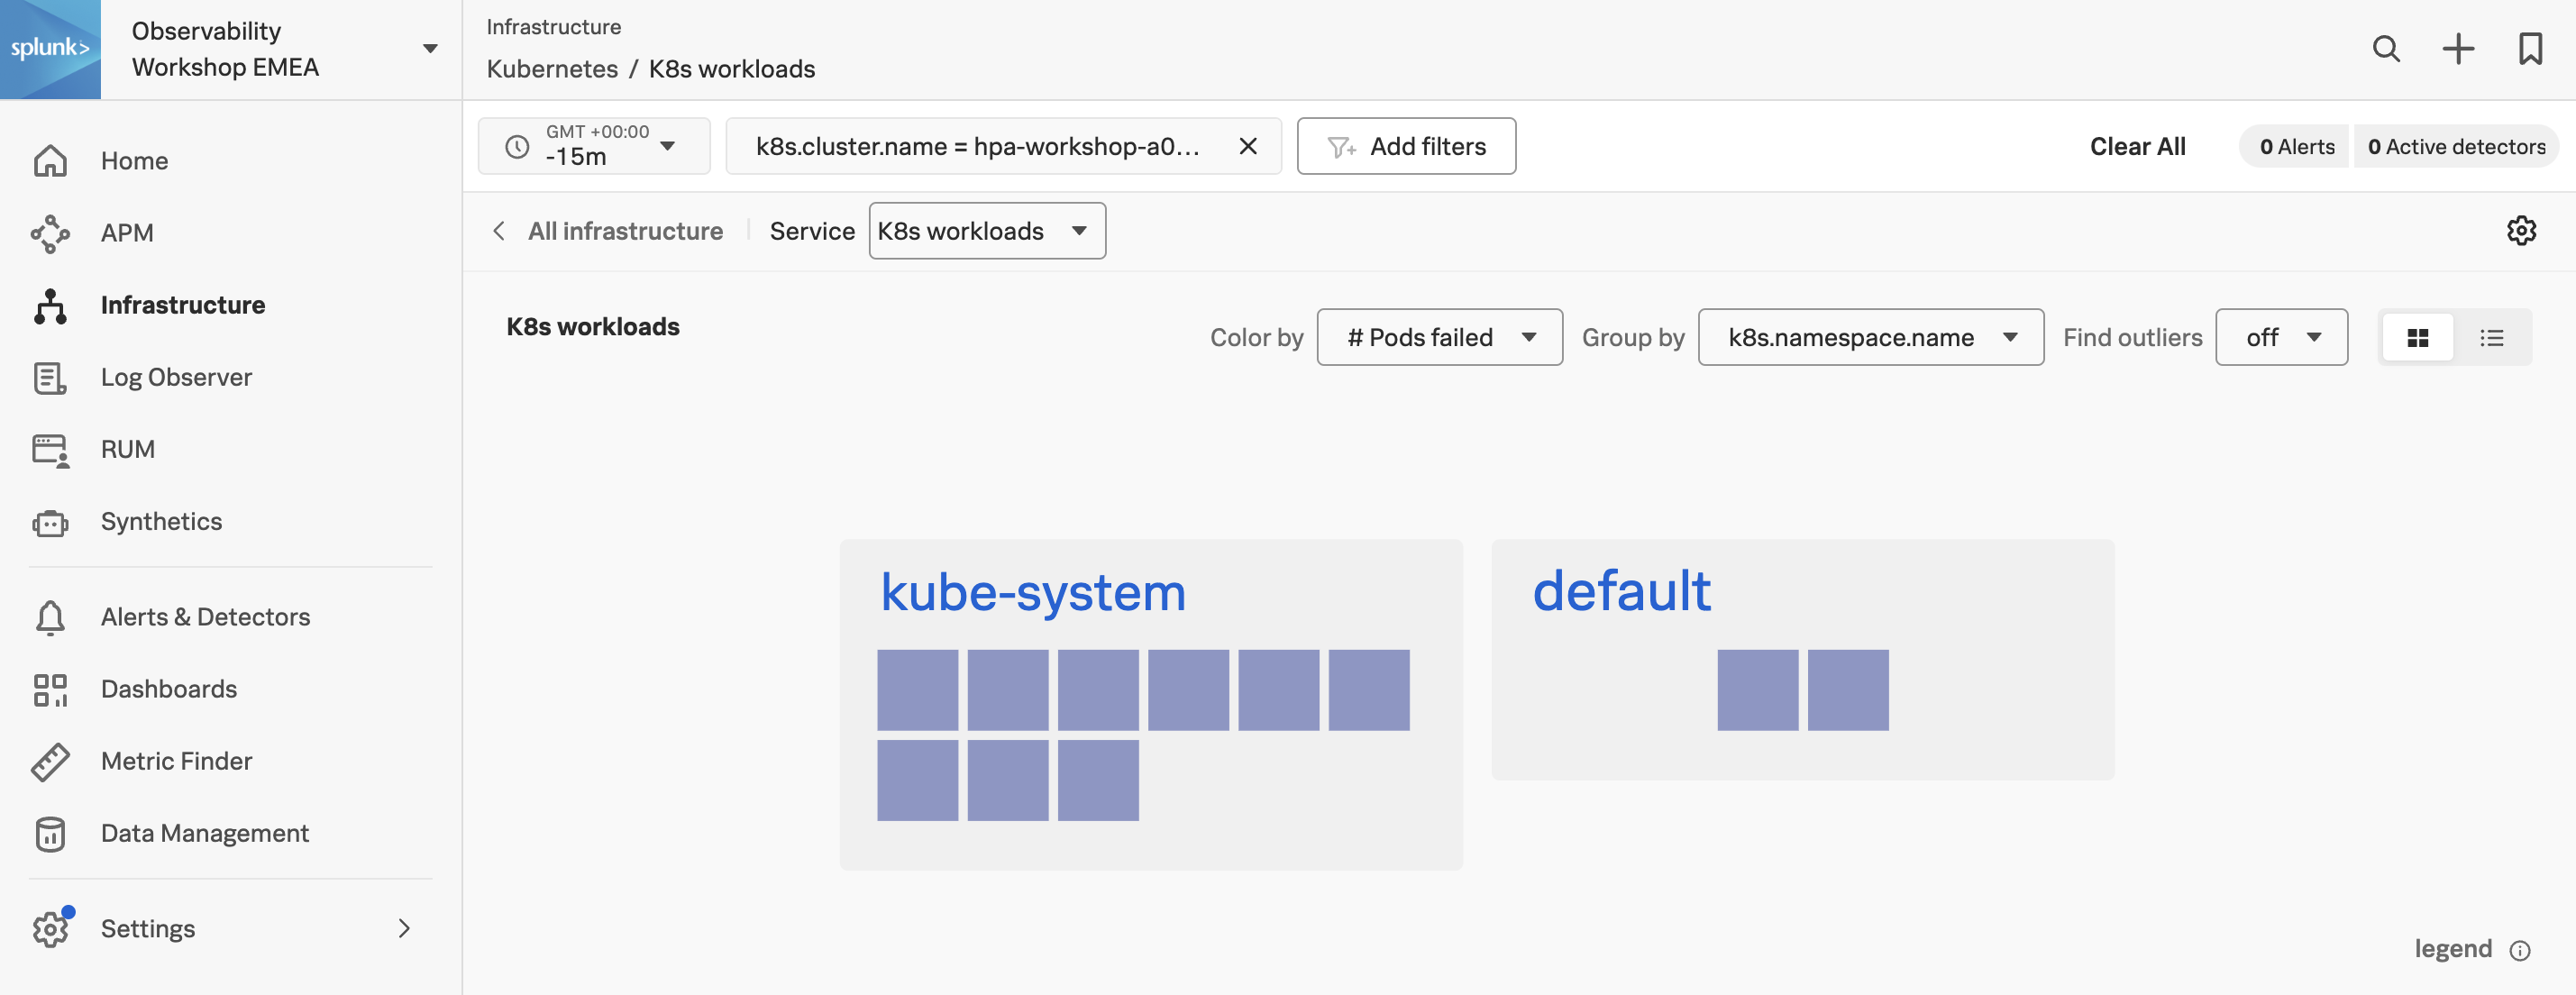
Now let’s change the list view to a heat map view by selecting either the Heat map icon or the List icon in the upper-right corner of the screen (as marked with the purple line).
Changing this option will result in the following visualization:
In this view, you will note that each workload is now a colored square. These squares will change color according to the Color by option you selected, as marked by the first green line in the image above. The colors give a visual indication of health and/or usage. You can check the meaning by hovering over the legend exclamation icon
bottom right of the heatmaps.
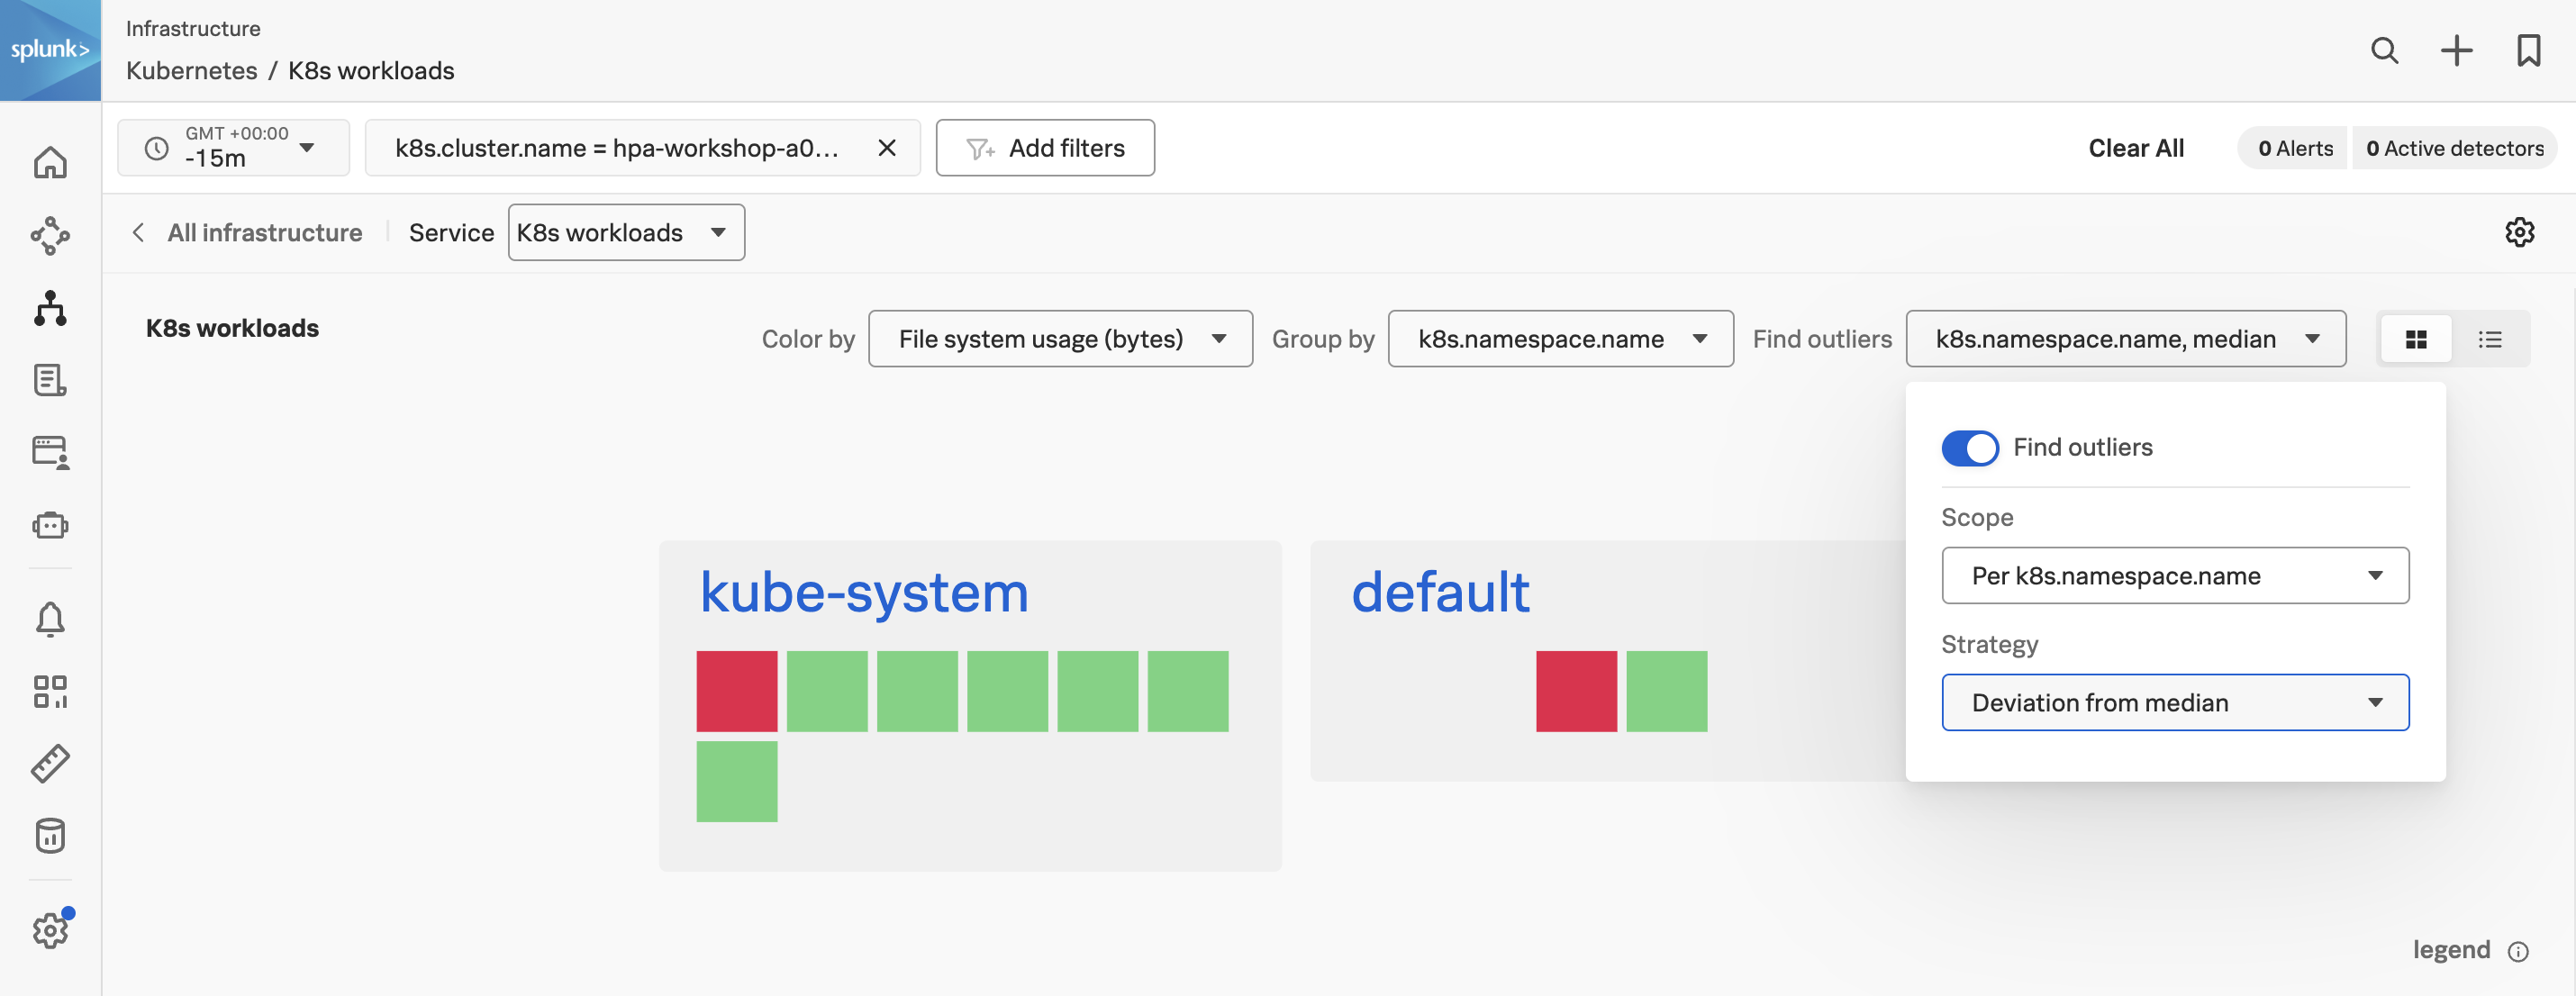
Another valuable option in this screen is Find Outliers which provides historical analytics of your clusters based on what is selected in the Color by dropdown.
Now, let’s select the File system usage (bytes) from the Color by drop-down box, then click on the Find outliers drop-down as marked by a yellow line in the above image and make sure you change the Scope in the dialog to Per k8s.namespace.name and Deviation from Median as below:
The Find Outliers view is very useful when you need to view a selection of your workloads (or any service depending on the Navigator used) and quickly need to figure out if something has changed.
It will give you fast insight into items (workloads in our case) that are performing differently (both increased or decreased) which helps to make it easier to spot problems.
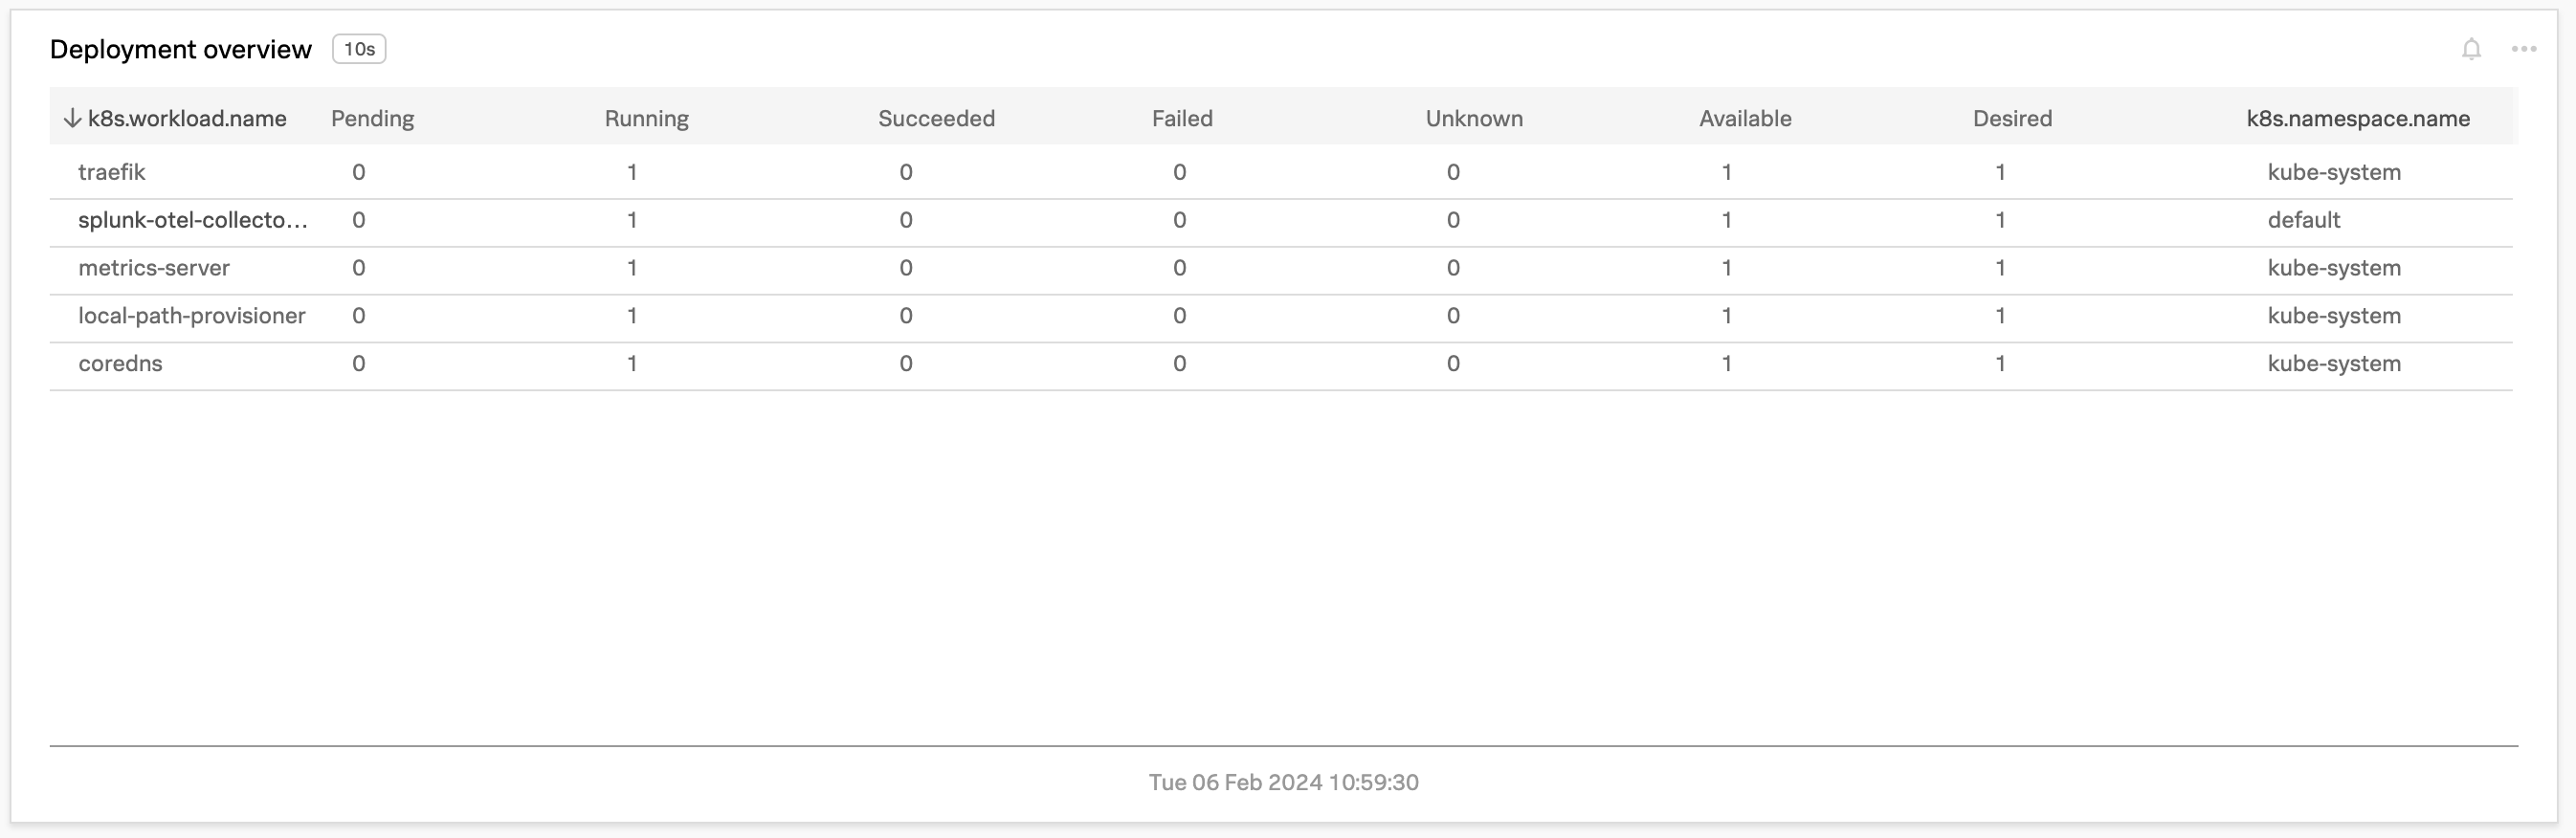
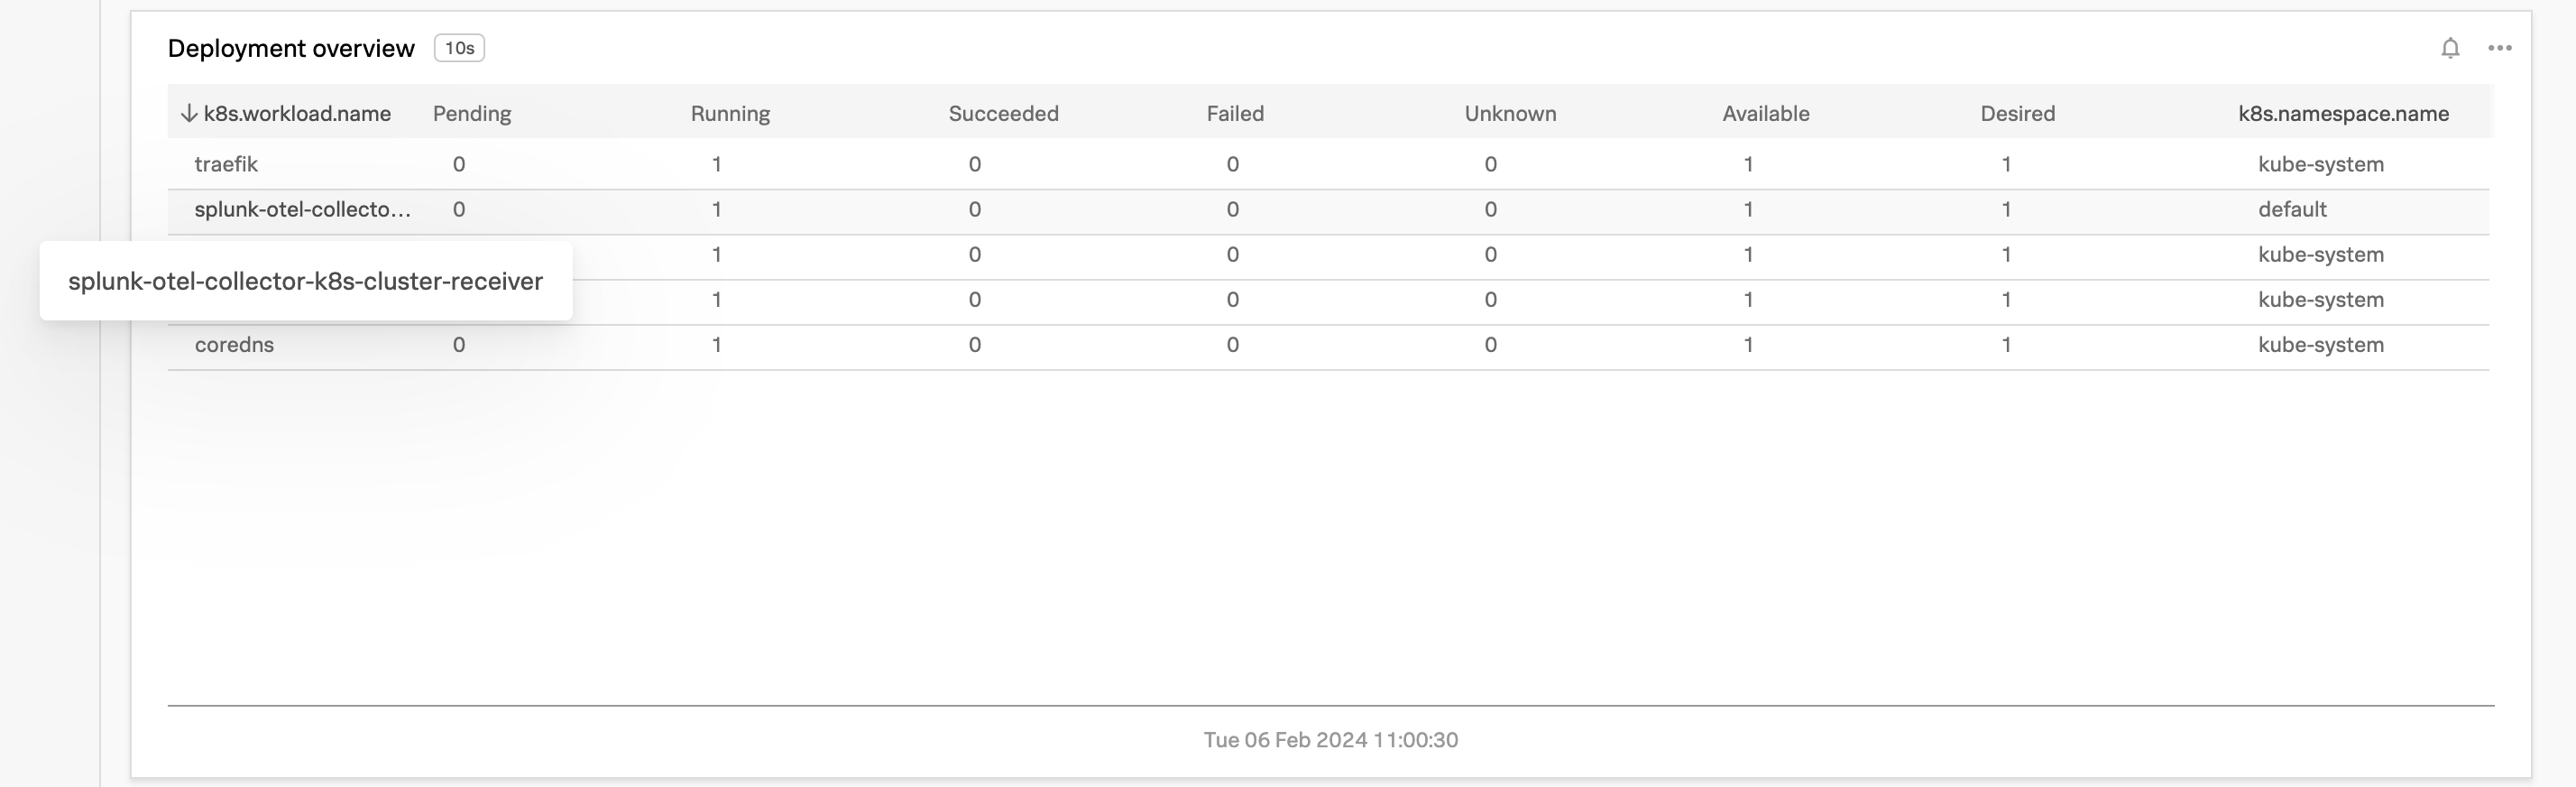
2.2 The Deployment Overview pane
The Deployment Overview pane gives you a quick insight into the status of your deployments. You can see at once if the pods of your deployments are Pending, Running, Succeeded, Failed or in an Unknown state.
Running: Pod is deployed and in a running state
Pending: Waiting to be deployed
Succeeded: Pod has been deployed and completed its job and is finished
Failed: Containers in the pod have run and returned some kind of error
Unknown: Kubernetes isn’t reporting any of the known states. (This may be during the starting or stopping of pods, for example).
You can expand the Workload name by hovering your mouse on it, in case the name is longer than the chart allows.
To filter to a specific workload, you can click on three dots … next to the workload name in the k8s.workload.name column and choose Filter from the dropdown box.
This will add the selected workload to your filters. It would then list a single workload in the default namespace.
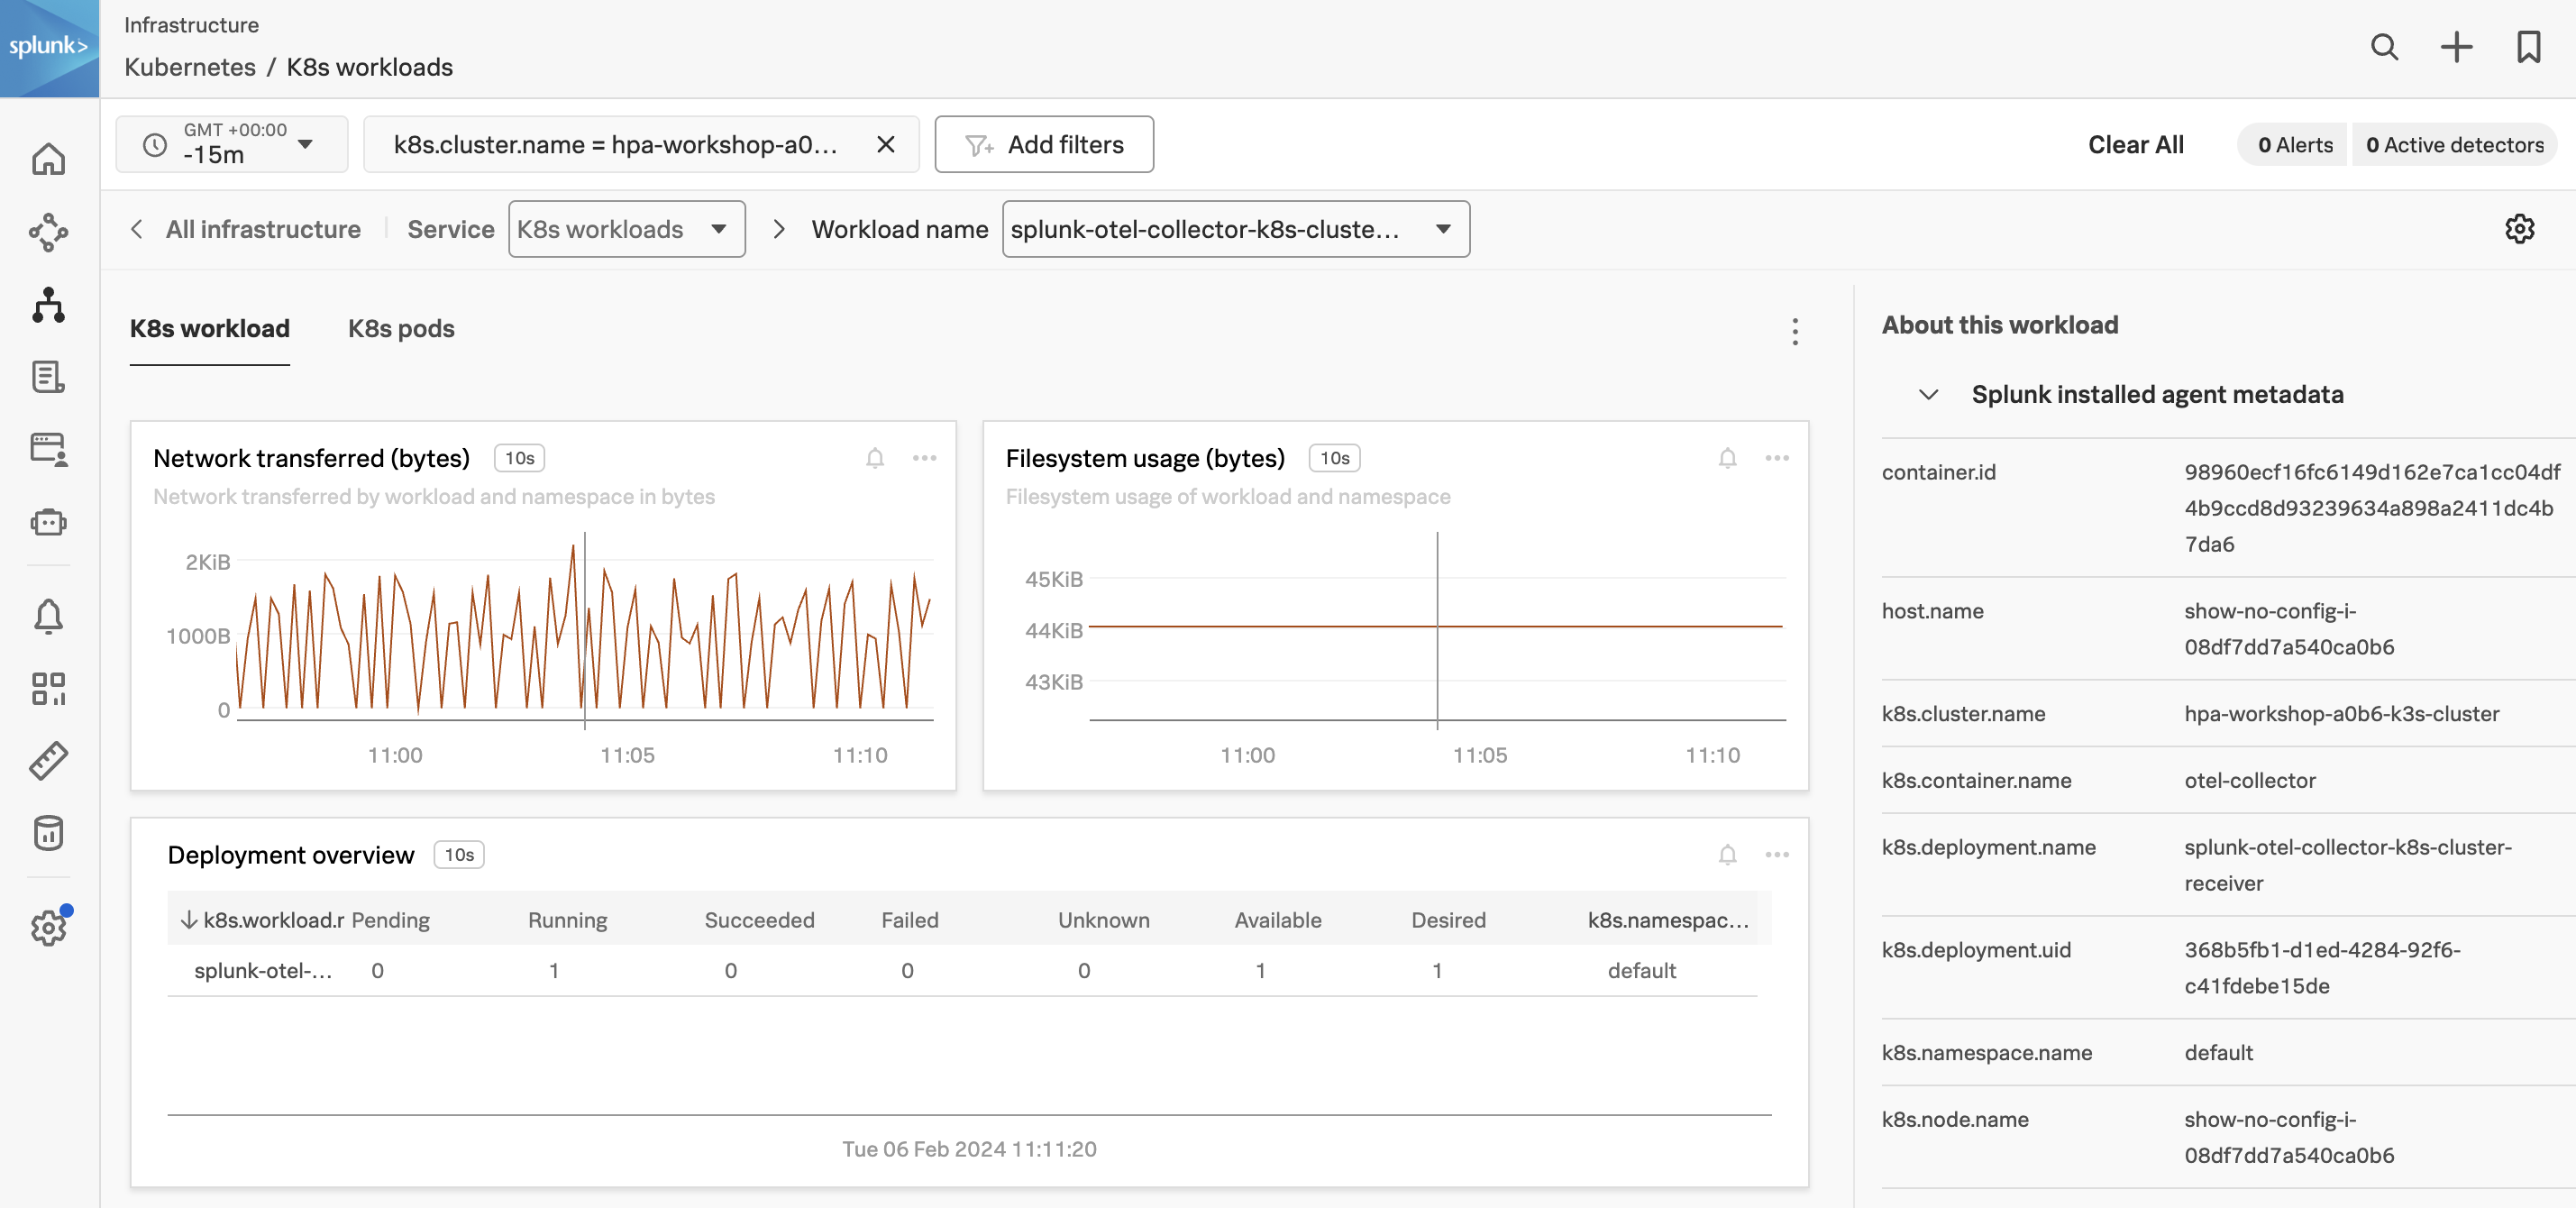
From the Heatmap above find the splunk-otel-collector-k8s-cluster-receiver in the default namespace and click on the square to see more information about the workload.
Workshop Question
What are the CPU request & CPU limit units for the otel-collector?
At this point, you can drill into the information of the pods, but that is outside the scope of this workshop.
3. Navigator Sidebar
Later in the workshop, you will deploy an Apache server into your cluster which will display an icon in the Navigator Sidebar.
In navigators for Kubernetes, you can track dependent services and containers in the navigator sidebar. To get the most out of the navigator sidebar you configure the services you want to track by configuring an extra dimension called service.name. For this workshop, we have already configured the extraDimensions in the collector configuration for monitoring Apache e.g.
extraDimensions:service.name:php-apache
The Navigator Sidebar will expand and a link to the discovered service will be added as seen in the image below:
This will allow for easy switching between Navigators. The same applies to your Apache server instance, it will have a Navigator Sidebar allowing you to quickly jump back to the Kubernetes Navigator.
Deploying PHP/Apache
1. Namespaces in Kubernetes
Most of our customers will make use of some kind of private or public cloud service to run Kubernetes. They often choose to have only a few large Kubernetes clusters as it is easier to manage centrally.
Namespaces are a way to organize these large Kubernetes clusters into virtual sub-clusters. This can be helpful when different teams or projects share a Kubernetes cluster as this will give them the easy ability to just see and work with their resources.
Any number of namespaces are supported within a cluster, each logically separated from others but with the ability to communicate with each other. Components are only visible when selecting a namespace or when adding the --all-namespaces flag to kubectl instead of allowing you to view just the components relevant to your project by selecting your namespace.
Most customers will want to install the applications into a separate namespace. This workshop will follow that best practice.
2. DNS and Services in Kubernetes
The Domain Name System (DNS) is a mechanism for linking various sorts of information with easy-to-remember names, such as IP addresses. Using a DNS system to translate request names into IP addresses makes it easy for end-users to reach their target domain name effortlessly.
Most Kubernetes clusters include an internal DNS service configured by default to offer a lightweight approach for service discovery. Even when Pods and Services are created, deleted, or shifted between nodes, built-in service discovery simplifies applications to identify and communicate with services on the Kubernetes clusters.
In short, the DNS system for Kubernetes will create a DNS entry for each Pod and Service. In general, a Pod has the following DNS resolution:
pod-name.my-namespace.pod.cluster-domain.example
For example, if a Pod in the default namespace has the Pod name my_pod, and the domain name for your cluster is cluster.local, then the Pod has a DNS name:
my_pod.default.pod.cluster.local
Any Pods exposed by a Service have the following DNS resolution available:
The above file contains an observation rule for Apache using the OTel receiver_creator. This receiver can instantiate other receivers at runtime based on whether observed endpoints match a configured rule.
The configured rules will be evaluated for each endpoint discovered. If the rule evaluates to true, then the receiver for that rule will be started as configured against the matched endpoint.
In the file above we tell the OpenTelemetry agent to look for Pods that match the name apache and have port 80 open. Once found, the agent will configure an Apache receiver to read Apache metrics from the configured URL. Note, the K8s DNS-based URL in the above YAML for the service.
To use the Apache configuration, you can upgrade the existing Splunk OpenTelemetry Collector Helm chart to use the otel-apache.yaml file with the following command:
The REVISION number of the deployment has changed, which is a helpful way to keep track of your changes.
Release "splunk-otel-collector" has been upgraded. Happy Helming!
NAME: splunk-otel-collector
LAST DEPLOYED: Tue Feb  6 11:17:15 2024
NAMESPACE: default
STATUS: deployed
REVISION: 2
TEST SUITE: None
5. Kubernetes ConfigMaps
A ConfigMap is an object in Kubernetes consisting of key-value pairs that can be injected into your application. With a ConfigMap, you can separate configuration from your Pods.
Using ConfigMap, you can prevent hardcoding configuration data. ConfigMaps are useful for storing and sharing non-sensitive, unencrypted configuration information.
The OpenTelemetry collector/agent uses ConfigMaps to store the configuration of the agent and the K8s Cluster receiver. You can/will always verify the current configuration of an agent after a change by running the following commands:
kubectl get cm
Workshop Question
How many ConfigMaps are used by the collector?
When you have a list of ConfigMaps from the namespace, select the one for the otel-agent and view it with the following command:
kubectl get cm splunk-otel-collector-otel-agent -o yaml
NOTE
The option -o yaml will output the content of the ConfigMap in a readable YAML format.
Workshop Question
Is the configuration from otel-apache.yaml visible in the ConfigMap for the collector agent?
6. Review PHP/Apache deployment YAML
Inspect the YAML file ~/workshop/k3s/php-apache.yaml and validate the contents using the following command:
cat ~/workshop/k3s/php-apache.yaml
This file contains the configuration for the PHP/Apache deployment and will create a new StatefulSet with a single replica of the PHP/Apache image.
A stateless application does not care which network it is using, and it does not need permanent storage. Examples of stateless apps may include web servers such as Apache, Nginx, or Tomcat.
What metrics for your Apache instance are being reported in the Apache Navigator?
Tip: Use the Navigator Sidebar and click on the service name.
Workshop Question
Using Log Observer what is the issue with the PHP/Apache deployment?
Tip: Adjust your filters to use: object = php-apache-svc and k8s.cluster.name = <your_cluster>.
Fix PHP/Apache Issue
1. Kubernetes Resources
Especially in Production Kubernetes Clusters, CPU and Memory are considered precious resources. Cluster Operators will normally require you to specify the amount of CPU and Memory your Pod or Service will require in the deployment, so they can have the Cluster automatically manage on which Node(s) your solution will be placed.
You do this by placing a Resource section in the deployment of your application/Pod
Example:
resources:limits:# Maximum amount of CPU & memory for peek usecpu:"8"# Maximum of 8 cores of CPU allowed at for peek usememory:"8Mi"# Maximum allowed 8Mb of memoryrequests:# Request are the expected amount of CPU & memory for normal usecpu:"6"# Requesting 4 cores of a CPUmemory:"4Mi"# Requesting 4Mb of memory
If your application or Pod will go over the limits set in your deployment, Kubernetes will kill and restart your Pod to protect the other applications on the Cluster.
Another scenario that you will run into is when there is not enough Memory or CPU on a Node. In that case, the Cluster will try to reschedule your Pod(s) on a different Node with more space.
If that fails, or if there is not enough space when you deploy your application, the Cluster will put your workload/deployment in schedule mode until there is enough room on any of the available Nodes to deploy the Pods according to their limits.
2. Fix PHP/Apache Deployment
Workshop Question
Before we start, let’s check the current status of the PHP/Apache deployment. Under Alerts & Detectors which detector has fired? Where else can you find this information?
To fix the PHP/Apache StatefulSet, edit ~/workshop/k3s/php-apache.yaml using the following commands to reduce the CPU resources:
vim ~/workshop/k3s/php-apache.yaml
Find the resources section and reduce the CPU limits to 1 and the CPU requests to 0.5:
Save the changes you have made. (Hint: Use Esc followed by :wq! to save your changes).
Now, we must delete the existing StatefulSet and re-create it. StatefulSets are immutable, so we must delete the existing one and re-create it with the new changes.
You can validate the changes have been applied by running the following command:
kubectl describe statefulset php-apache -n apache
Validate the Pod is now running in Splunk Observability Cloud.
Workshop Question
Is the Apache Web Servers dashboard showing any data now?
Tip: Don’t forget to use filters and time frames to narrow down your data.
Monitor the Apache web servers Navigator dashboard for a few minutes.
Workshop Question
What is happening with the # Hosts reporting chart?
4. Fix the memory issue
If you navigate back to the Apache dashboard, you will notice that metrics are no longer coming in. We have another resource issue and this time we are Out of Memory. Let’s edit the stateful set and increase the memory to what is shown in the image below:
kubectl edit will open the contents in the vi editor, use Esc followed by :wq! to save your changes.
Because StatefulSets are immutable, we must delete the existing Pod and let the StatefulSet re-create it with the new changes.
kubectl delete pod php-apache-0 -n apache
Validate the changes have been applied by running the following command:
kubectl describe statefulset php-apache -n apache
Deploy Load Generator
Now let’s apply some load against the php-apache pod. To do this, you will need to start a different Pod to act as a client. The container within the client Pod runs in an infinite loop, sending HTTP GETs to the php-apache service.
1. Review loadgen YAML
Inspect the YAML file ~/workshop/k3s/loadgen.yaml and validate the contents using the following command:
cat ~/workshop/k3s/loadgen.yaml
This file contains the configuration for the load generator and will create a new ReplicaSet with two replicas of the load generator image.
Once you have deployed the load generator, you can see the Pods running in the loadgen namespace. Use previous similar commands to check the status of the Pods from the command line.
Workshop Question
Which metrics in the Apache Navigator have now significantly increased?
4. Scale the load generator
A ReplicaSet is a process that runs multiple instances of a Pod and keeps the specified number of Pods constant. Its purpose is to maintain the specified number of Pod instances running in a cluster at any given time to prevent users from losing access to their application when a Pod fails or is inaccessible.
ReplicaSet helps bring up a new instance of a Pod when the existing one fails, scale it up when the running instances are not up to the specified number, and scale down or delete Pods if another instance with the same label is created. A ReplicaSet ensures that a specified number of Pod replicas are running continuously and helps with load-balancing in case of an increase in resource usage.
Let’s scale our ReplicaSet to 4 replicas using the following command:
Validate the replicas are running from both the command line and Splunk Observability Cloud:
kubectl get replicaset loadgen -n loadgen
Workshop Question
What impact can you see in the Apache Navigator?
Let the load generator run for around 2-3 minutes and keep observing the metrics in the Kubernetes Navigator and the Apache Navigator.
Setup Horizontal Pod Autoscaling (HPA)
In Kubernetes, a HorizontalPodAutoscaler automatically updates a workload resource (such as a Deployment or StatefulSet), to automatically scale the workload to match demand.
Horizontal scaling means that the response to increased load is to deploy more Pods. This is different from vertical scaling, which for Kubernetes would mean assigning more resources (for example: memory or CPU) to the Pods that are already running for the workload.
If the load decreases, and the number of Pods is above the configured minimum, the HorizontalPodAutoscaler instructs the workload resource (the Deployment, StatefulSet, or other similar resource) to scale back down.
1. Setup HPA
Inspect the ~/workshop/k3s/hpa.yaml file and validate the contents using the following command:
cat ~/workshop/k3s/hpa.yaml
This file contains the configuration for the Horizontal Pod Autoscaler and will create a new HPA for the php-apache deployment.
Once deployed, php-apache will autoscale when either the average CPU usage goes above 50% or the average memory usage for the deployment goes above 75%, with a minimum of 1 pod and a maximum of 4 pods.
kubectl apply -f ~/workshop/k3s/hpa.yaml
2. Validate HPA
kubectl get hpa -n apache
Go to the Workloads or Node Detail tab in Kubernetes and check the HPA deployment.
Workshop Question
How many additional php-apache-x pods have been created?
Workshop Question
Which metrics in the Apache Navigator have significantly increased again?
3. Increase the HPA replica count
Increase the maxReplicas to 8
kubectl edit hpa php-apache -n apache
Save the changes you have made. (Hint: Use Esc followed by :wq! to save your changes).