OpenTelemetry Collector Extensions

Now that we have the OpenTelemetry Collector installed, let’s take a look at extensions for the OpenTelemetry Collector. Extensions are optional and available primarily for tasks that do not involve processing telemetry data. Examples of extensions include health monitoring, service discovery, and data forwarding.

%%{
  init:{
    "theme": "base",
    "themeVariables": {
      "primaryColor": "#ffffff",
      "clusterBkg": "#eff2fb",
      "defaultLinkColor": "#333333"
    }
  }
}%%

flowchart LR;
    style E fill:#e20082,stroke:#333,stroke-width:4px,color:#fff
    subgraph Collector
    A[OTLP] --> M(Receivers)
    B[JAEGER] --> M(Receivers)
    C[Prometheus] --> M(Receivers)
    end
    subgraph Processors
    M(Receivers) --> H(Filters, Attributes, etc)
    E(Extensions)
    end
    subgraph Exporters
    H(Filters, Attributes, etc) --> S(OTLP)
    H(Filters, Attributes, etc) --> T(JAEGER)
    H(Filters, Attributes, etc) --> U(Prometheus)
    end
Last Modified Sep 19, 2024

Subsections of OpenTelemetry Collector Extensions

OpenTelemetry Collector Extensions

Health Check

Extensions are configured in the same config.yaml file that we referenced in the installation step. Let’s edit the config.yaml file and configure the extensions. Note that the pprof and zpages extensions are already configured in the default config.yaml file. For the purpose of this workshop, we will only be updating the health_check extension to expose the port on all network interfaces on which we can access the health of the collector.

sudo vi /etc/otelcol-contrib/config.yaml
extensions:
  health_check:
    endpoint: 0.0.0.0:13133

Start the collector:

otelcol-contrib --config=file:/etc/otelcol-contrib/config.yaml

This extension enables an HTTP URL that can be probed to check the status of the OpenTelemetry Collector. This extension can be used as a liveness and/or readiness probe on Kubernetes. To learn more about the curl command, check out the curl man page.

Open a new terminal session and SSH into your instance to run the following command:

curl http://localhost:13133
{"status":"Server available","upSince":"2023-04-27T10:11:22.153295874+01:00","uptime":"16m24.684476004s"}
Last Modified Sep 19, 2024

OpenTelemetry Collector Extensions

Performance Profiler

Performance Profiler extension enables the golang net/http/pprof endpoint. This is typically used by developers to collect performance profiles and investigate issues with the service. We will not be covering this in this workshop.

Last Modified Sep 19, 2024

OpenTelemetry Collector Extensions

zPages

zPages are an in-process alternative to external exporters. When included, they collect and aggregate tracing and metrics information in the background; this data is served on web pages when requested. zPages are an extremely useful diagnostic feature to ensure the collector is running as expected.

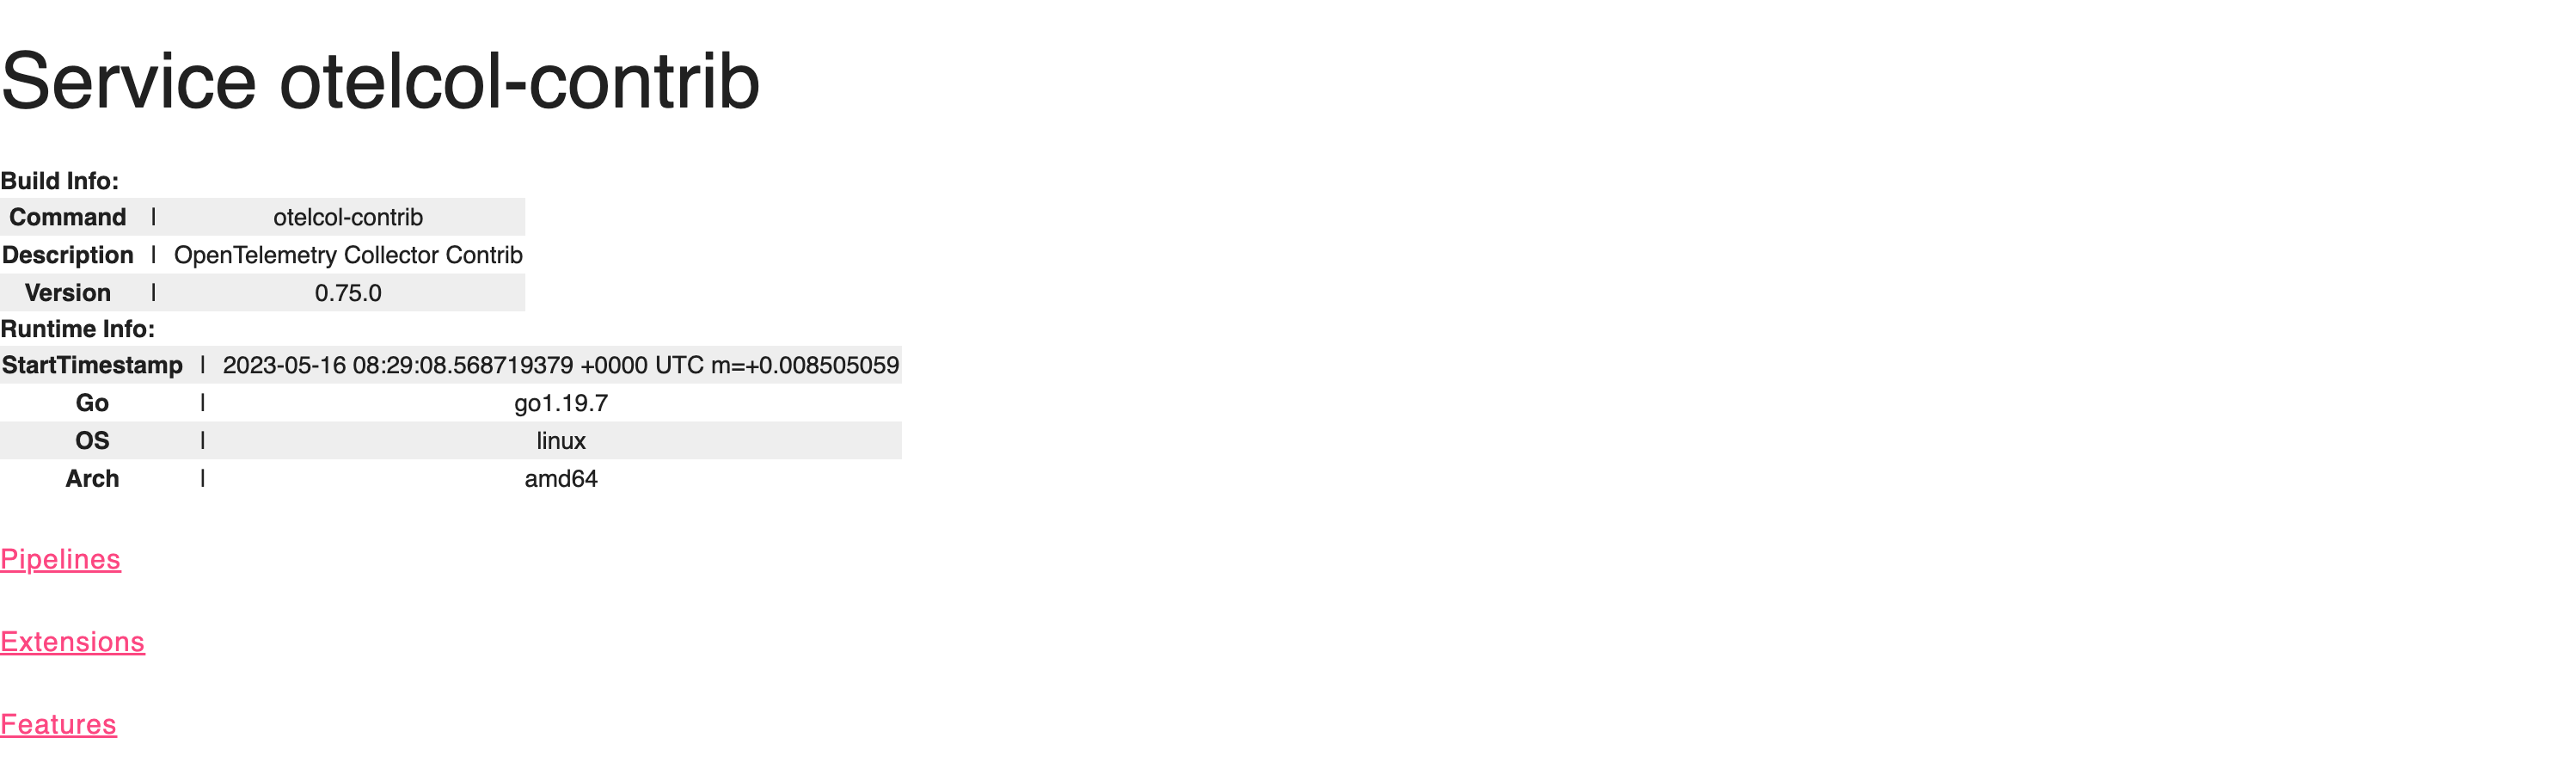
ServiceZ gives an overview of the collector services and quick access to the pipelinez, extensionz, and featurez zPages. The page also provides build and runtime information.

Example URL: http://localhost:55679/debug/servicez (change localhost to reflect your own environment).

ServiceZ ServiceZ

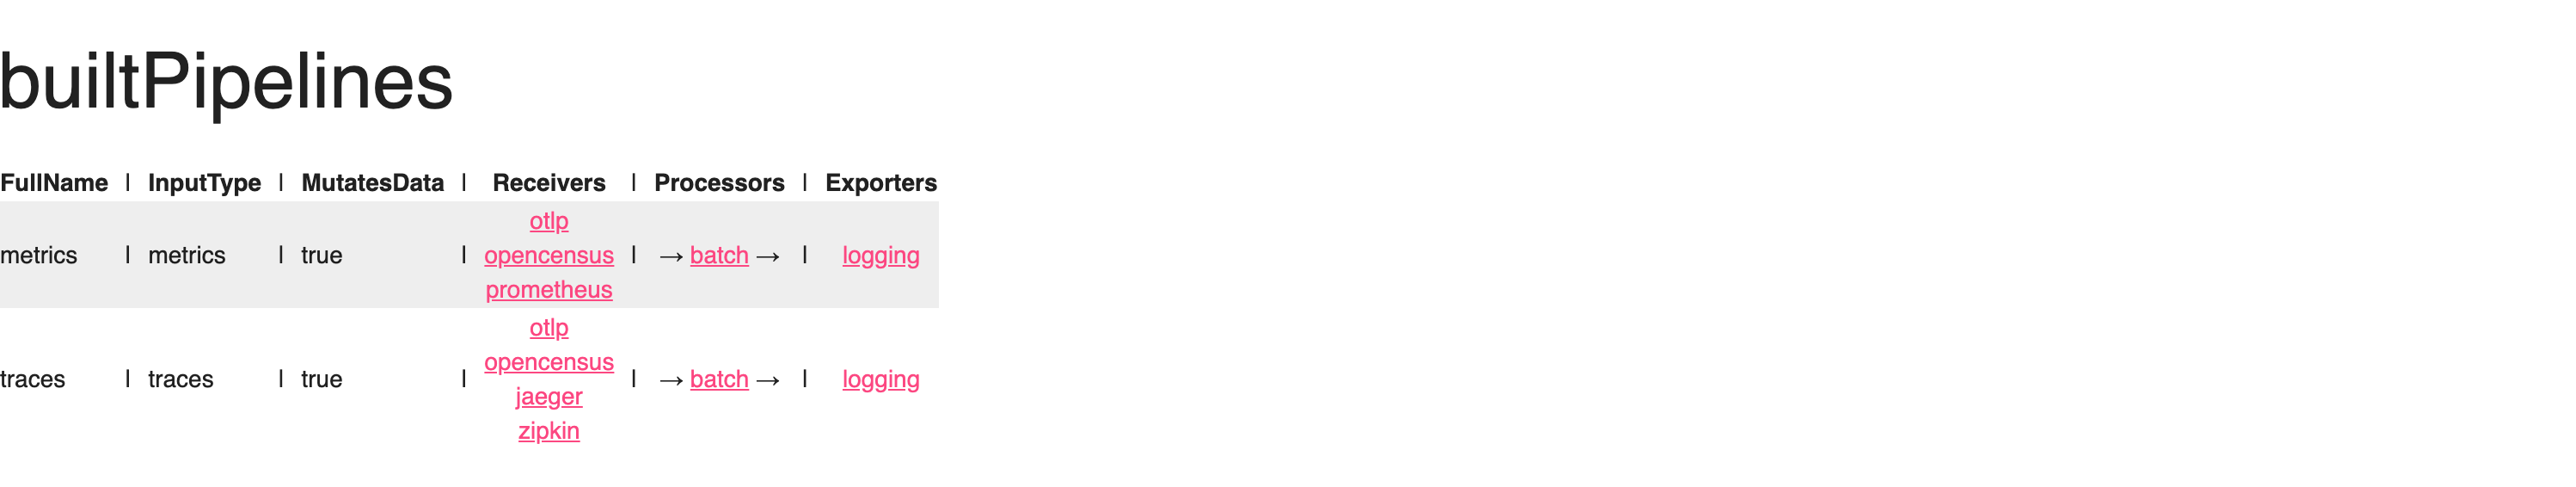
PipelineZ provides insights on the running pipelines running in the collector. You can find information on type, if data is mutated, and you can also see information on the receivers, processors and exporters that are used for each pipeline.

Example URL: http://localhost:55679/debug/pipelinez (change localhost to reflect your own environment).

PipelineZ PipelineZ

ExtensionZ shows the extensions that are active in the collector.

Example URL: http://localhost:55679/debug/extensionz (change localhost to reflect your own environment).

ExtensionZ ExtensionZ

Info

You can use your browser to access your environment emitting zPages information at (replace <insert_your_ip> with your IP address):


For this, we will need to validate that our distribution has the file_storage extension installed. This can be done by running the command otelcol-contrib components which should show results like:

# ... truncated for clarity
extensions:
  - file_storage
buildinfo:
    command: otelcol-contrib
    description: OpenTelemetry Collector Contrib
    version: 0.80.0
receivers:
    - prometheus_simple
    - apache
    - influxdb
    - purefa
    - purefb
    - receiver_creator
    - mongodbatlas
    - vcenter
    - snmp
    - expvar
    - jmx
    - kafka
    - skywalking
    - udplog
    - carbon
    - kafkametrics
    - memcached
    - prometheus
    - windowseventlog
    - zookeeper
    - otlp
    - awsecscontainermetrics
    - iis
    - mysql
    - nsxt
    - aerospike
    - elasticsearch
    - httpcheck
    - k8sobjects
    - mongodb
    - hostmetrics
    - signalfx
    - statsd
    - awsxray
    - cloudfoundry
    - collectd
    - couchdb
    - kubeletstats
    - jaeger
    - journald
    - riak
    - splunk_hec
    - active_directory_ds
    - awscloudwatch
    - sqlquery
    - windowsperfcounters
    - flinkmetrics
    - googlecloudpubsub
    - podman_stats
    - wavefront
    - k8s_events
    - postgresql
    - rabbitmq
    - sapm
    - sqlserver
    - redis
    - solace
    - tcplog
    - awscontainerinsightreceiver
    - awsfirehose
    - bigip
    - filelog
    - googlecloudspanner
    - cloudflare
    - docker_stats
    - k8s_cluster
    - pulsar
    - zipkin
    - nginx
    - opencensus
    - azureeventhub
    - datadog
    - fluentforward
    - otlpjsonfile
    - syslog
processors:
    - resource
    - batch
    - cumulativetodelta
    - groupbyattrs
    - groupbytrace
    - k8sattributes
    - experimental_metricsgeneration
    - metricstransform
    - routing
    - attributes
    - datadog
    - deltatorate
    - spanmetrics
    - span
    - memory_limiter
    - redaction
    - resourcedetection
    - servicegraph
    - transform
    - filter
    - probabilistic_sampler
    - tail_sampling
exporters:
    - otlp
    - carbon
    - datadog
    - f5cloud
    - kafka
    - mezmo
    - skywalking
    - awsxray
    - dynatrace
    - loki
    - prometheus
    - logging
    - azuredataexplorer
    - azuremonitor
    - instana
    - jaeger
    - loadbalancing
    - sentry
    - splunk_hec
    - tanzuobservability
    - zipkin
    - alibabacloud_logservice
    - clickhouse
    - file
    - googlecloud
    - prometheusremotewrite
    - awscloudwatchlogs
    - googlecloudpubsub
    - jaeger_thrift
    - logzio
    - sapm
    - sumologic
    - otlphttp
    - googlemanagedprometheus
    - opencensus
    - awskinesis
    - coralogix
    - influxdb
    - logicmonitor
    - signalfx
    - tencentcloud_logservice
    - awsemf
    - elasticsearch
    - pulsar
extensions:
    - zpages
    - bearertokenauth
    - oidc
    - host_observer
    - sigv4auth
    - file_storage
    - memory_ballast
    - health_check
    - oauth2client
    - awsproxy
    - http_forwarder
    - jaegerremotesampling
    - k8s_observer
    - pprof
    - asapclient
    - basicauth
    - headers_setter

This extension provides exporters the ability to queue data to disk in the event that exporter is unable to send data to the configured endpoint.

In order to configure the extension, you will need to update your config to include the information below. First, be sure to create a /tmp/otel-data directory and give it read/write permissions:

extensions:
...
  file_storage:
    directory: /tmp/otel-data
    timeout: 10s
    compaction:
      directory: /tmp/otel-data
      on_start: true
      on_rebound: true
      rebound_needed_threshold_mib: 5
      rebound_trigger_threshold_mib: 3

# ... truncated for clarity

service:
  extensions: [health_check, pprof, zpages, file_storage]

Why queue data to disk?

This allows the collector to weather network interruptions (and even collector restarts) to ensure data is sent to the upstream provider.

Considerations for queuing data to disk?

There is a potential that this could impact data throughput performance due to disk performance.

References

  1. https://community.splunk.com/t5/Community-Blog/Data-Persistence-in-the-OpenTelemetry-Collector/ba-p/624583
  2. https://github.com/open-telemetry/opentelemetry-collector-contrib/tree/main/extension/storage/filestorage

Configuration Check-in

Now that we’ve covered extensions, let’s check our configuration changes.


 1
 2
 3
 4
 5
 6
 7
 8
 9
10
11
12
13
14
15
16
17
18
19
20
21
22
23
24
25
26
27
28
29
30
31
32
33
34
35
36
37
38
39
40
41
42
43
44
45
46
47
48
49
50
51
52
53
54
55
56
extensions:
  health_check:
    endpoint: 0.0.0.0:13133
  pprof:
    endpoint: 0.0.0.0:1777
  zpages:
    endpoint: 0.0.0.0:55679

receivers:
  otlp:
    protocols:
      grpc:
      http:

  opencensus:

  # Collect own metrics
  prometheus:
    config:
      scrape_configs:
      - job_name: 'otel-collector'
        scrape_interval: 10s
        static_configs:
        - targets: ['0.0.0.0:8888']

  jaeger:
    protocols:
      grpc:
      thrift_binary:
      thrift_compact:
      thrift_http:

  zipkin:

processors:
  batch:

exporters:
  logging:
    verbosity: detailed

service:

  pipelines:

    traces:
      receivers: [otlp, opencensus, jaeger, zipkin]
      processors: [batch]
      exporters: [logging]

    metrics:
      receivers: [otlp, opencensus, prometheus]
      processors: [batch]
      exporters: [logging]

  extensions: [health_check, pprof, zpages]

Now that we have reviewed extensions, let’s dive into the data pipeline portion of the workshop. A pipeline defines a path the data follows in the Collector starting from reception, moving to further processing or modification, and finally exiting the Collector via exporters.

The data pipeline in the OpenTelemetry Collector is made up of receivers, processors, and exporters. We will first start with receivers.