OpenTelemetry Collector Receivers

Welcome to the receiver portion of the workshop! This is the starting point of the data pipeline of the OpenTelemetry Collector. Let’s dive in.

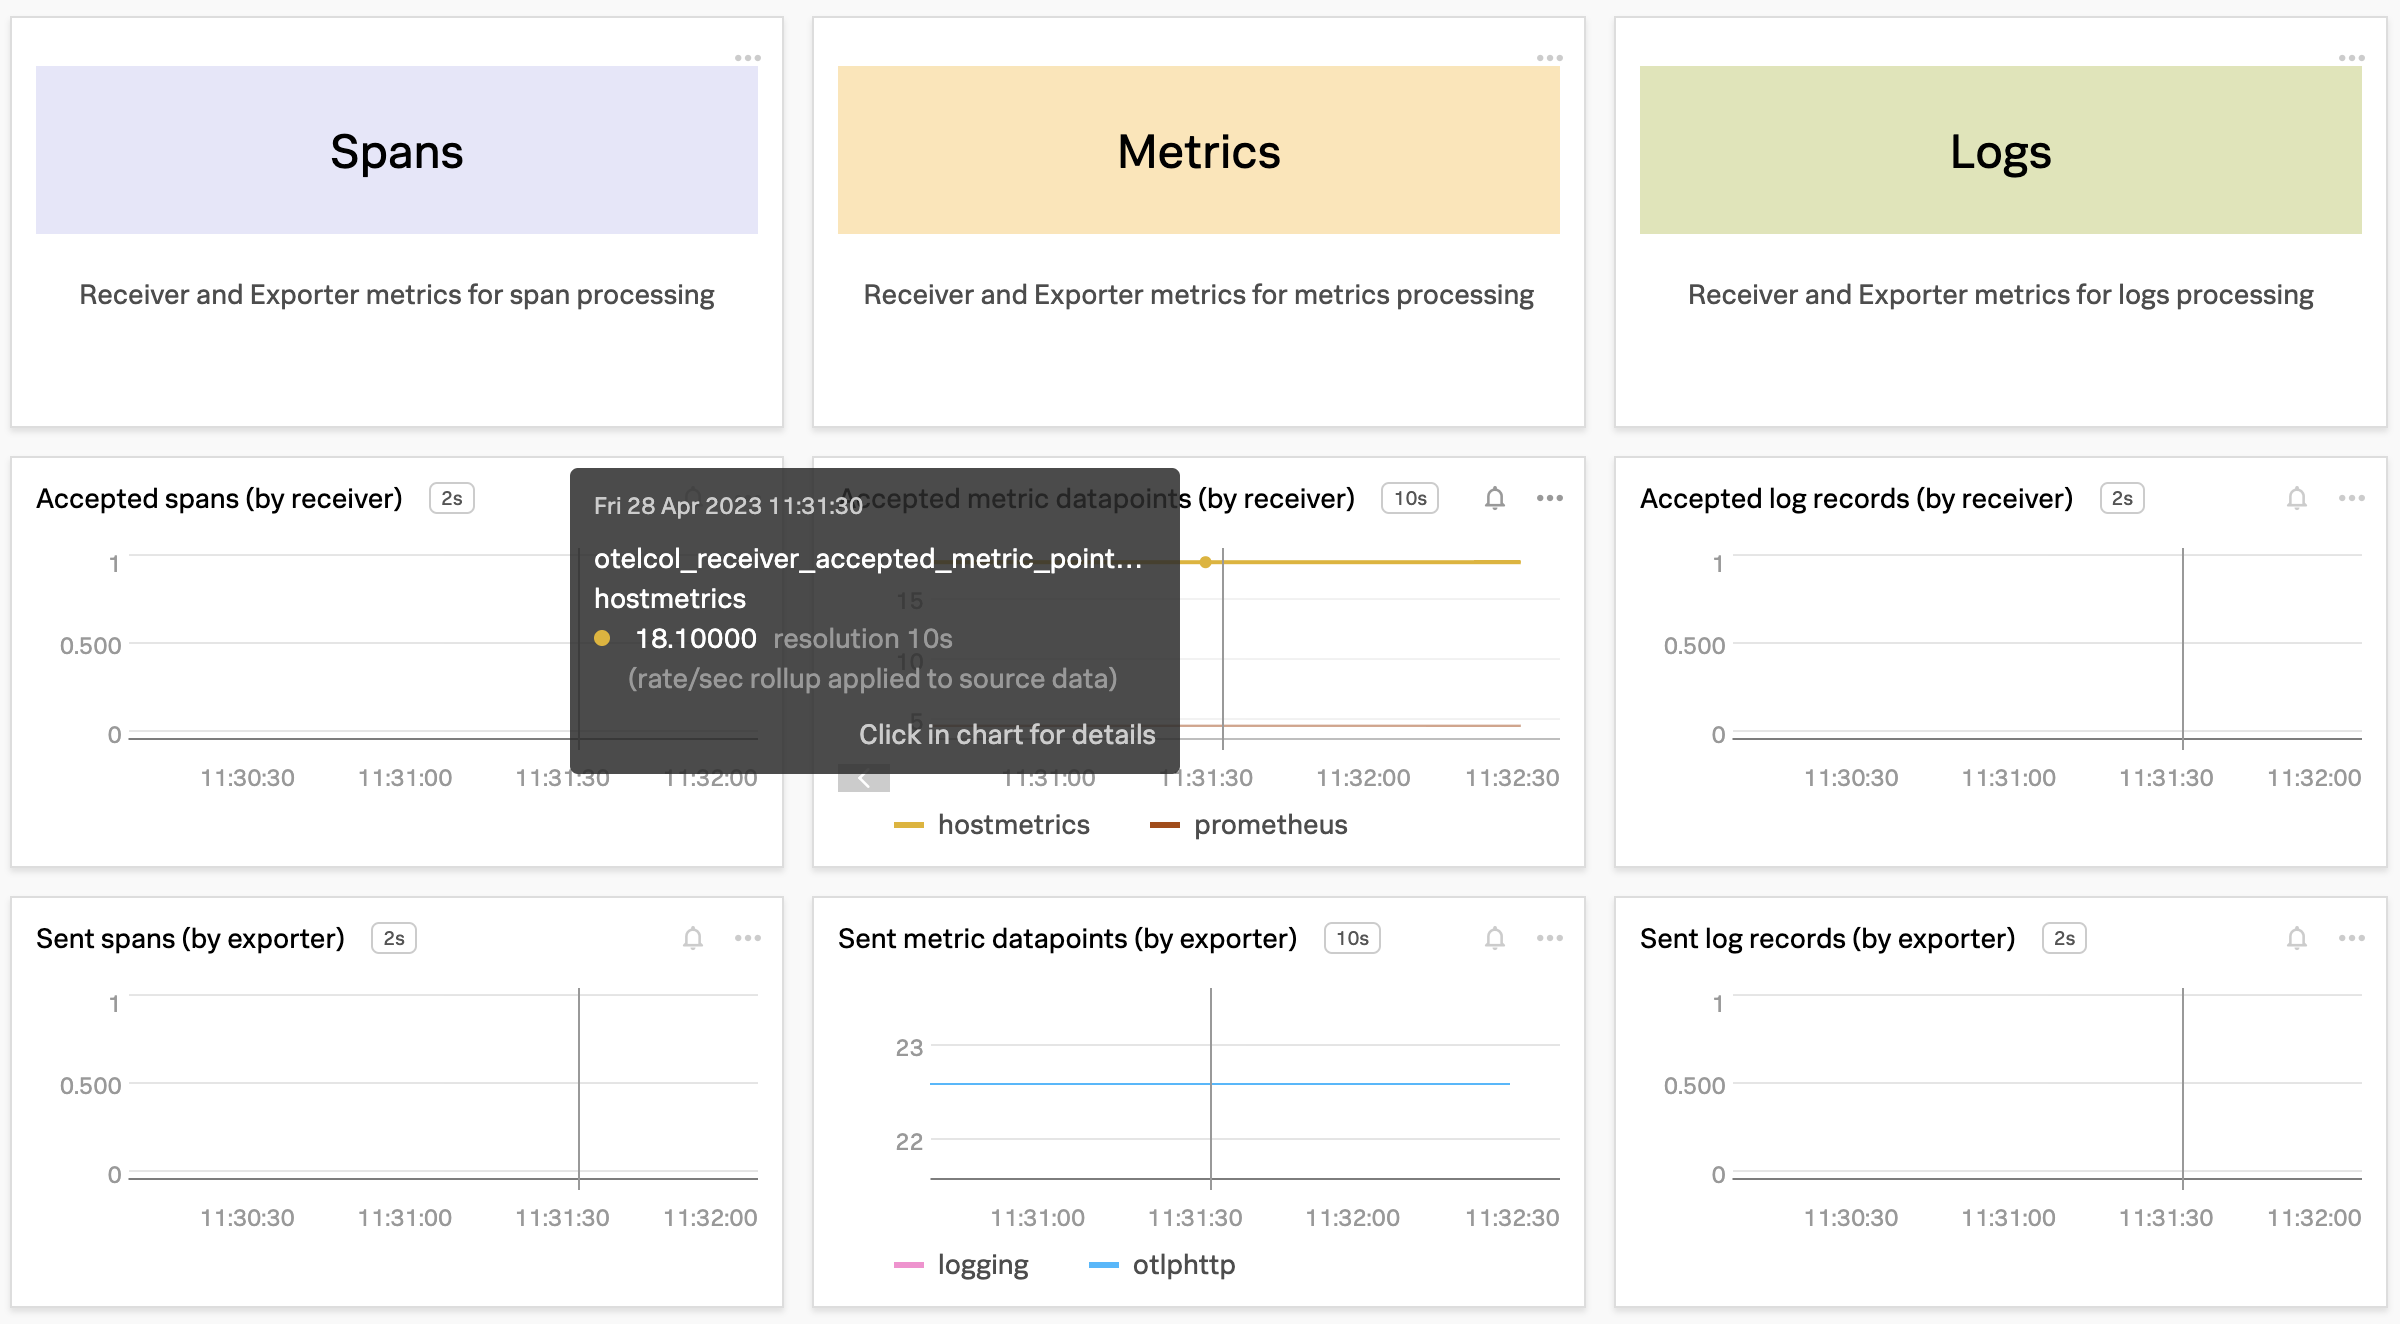
A receiver, which can be push or pull based, is how data gets into the Collector. Receivers may support one or more data sources. Generally, a receiver accepts data in a specified format, translates it into the internal format and passes it to processors and exporters defined in the applicable pipelines.

%%{
  init:{
    "theme":"base",
    "themeVariables": {
      "primaryColor": "#ffffff",
      "clusterBkg": "#eff2fb",
      "defaultLinkColor": "#333333"
    }
  }
}%%

flowchart LR;
    style M fill:#e20082,stroke:#333,stroke-width:4px,color:#fff
    subgraph Collector
    A[OTLP] --> M(Receivers)
    B[JAEGER] --> M(Receivers)
    C[Prometheus] --> M(Receivers)
    end
    subgraph Processors
    M(Receivers) --> H(Filters, Attributes, etc)
    E(Extensions)
    end
    subgraph Exporters
    H(Filters, Attributes, etc) --> S(OTLP)
    H(Filters, Attributes, etc) --> T(JAEGER)
    H(Filters, Attributes, etc) --> U(Prometheus)
    end
Last Modified Sep 19, 2024

Subsections of OpenTelemetry Collector Receivers

OpenTelemetry Collector Receivers

Host Metrics Receiver

The Host Metrics Receiver generates metrics about the host system scraped from various sources. This is intended to be used when the collector is deployed as an agent which is what we will be doing in this workshop.

Let’s update the /etc/otel-contrib/config.yaml file and configure the hostmetrics receiver. Insert the following YAML under the receivers section, taking care to indent by two spaces.

sudo vi /etc/otelcol-contrib/config.yaml
receivers:
  hostmetrics:
    collection_interval: 10s
    scrapers:
      # CPU utilization metrics
      cpu:
      # Disk I/O metrics
      disk:
      # File System utilization metrics
      filesystem:
      # Memory utilization metrics
      memory:
      # Network interface I/O metrics & TCP connection metrics
      network:
      # CPU load metrics
      load:
      # Paging/Swap space utilization and I/O metrics
      paging:
      # Process count metrics
      processes:
      # Per process CPU, Memory and Disk I/O metrics. Disabled by default.
      # process:
Last Modified Sep 19, 2024

OpenTelemetry Collector Receivers

Prometheus Receiver

You will also notice another receiver called prometheus. Prometheus is an open-source toolkit used by the OpenTelemetry Collector. This receiver is used to scrape metrics from the OpenTelemetry Collector itself. These metrics can then be used to monitor the health of the collector.

Let’s modify the prometheus receiver to clearly show that it is for collecting metrics from the collector itself. By changing the name of the receiver from prometheus to prometheus/internal, it is now much clearer as to what that receiver is doing. Update the configuration file to look like this:

prometheus/internal:
  config:
    scrape_configs:
    - job_name: 'otel-collector'
      scrape_interval: 10s
      static_configs:
      - targets: ['0.0.0.0:8888']

Example Dashboard - Prometheus metrics

The following screenshot shows an example dashboard of spme of the metrics the Prometheus internal receiver collects from the OpenTelemetry Collector. Here, we can see accepted and sent spans, metrics and log records.

Note

The following screenshot is an out-of-the-box (OOTB) dashboard from Splunk Observability Cloud that allows you to easily monitor your Splunk OpenTelemetry Collector install base.

otel-charts otel-charts

Last Modified Sep 19, 2024

OpenTelemetry Collector Receivers

Other Receivers

You will notice in the default configuration there are other receivers: otlp, opencensus, jaeger and zipkin. These are used to receive telemetry data from other sources. We will not be covering these receivers in this workshop and they can be left as they are.


To help observe short lived tasks like docker containers, kubernetes pods, or ssh sessions, we can use the receiver creator with observer extensions to create a new receiver as these services start up.

What do we need?

In order to start using the receiver creator and its associated observer extensions, they will need to be part of your collector build manifest.

See installation for the details.

Things to consider?

Some short lived tasks may require additional configuration such as username, and password. These values can be referenced via environment variables, or use a scheme expand syntax such as ${file:./path/to/database/password}. Please adhere to your organisation’s secret practices when taking this route.

The Ninja Zone

There are only two things needed for this ninja zone:

  1. Make sure you have added receiver creater and observer extensions to the builder manifest.
  2. Create the config that can be used to match against discovered endpoints.

To create the templated configurations, you can do the following:

receiver_creator:
  watch_observers: [host_observer]
  receivers:
    redis:
      rule: type == "port" && port == 6379
      config:
        password: ${env:HOST_REDIS_PASSWORD}

For more examples, refer to these receiver creator’s examples.


Configuration Check-in

We’ve now covered receivers, so let’s now check our configuration changes.


 1
 2
 3
 4
 5
 6
 7
 8
 9
10
11
12
13
14
15
16
17
18
19
20
21
22
23
24
25
26
27
28
29
30
31
32
33
34
35
36
37
38
39
40
41
42
43
44
45
46
47
48
49
50
51
52
53
54
55
56
57
58
59
60
61
62
63
64
65
66
67
68
69
70
71
72
73
74
75
76
77
extensions:
  health_check:
    endpoint: 0.0.0.0:13133
  pprof:
    endpoint: 0.0.0.0:1777
  zpages:
    endpoint: 0.0.0.0:55679

receivers:
  hostmetrics:
    collection_interval: 10s
    scrapers:
      # CPU utilization metrics
      cpu:
      # Disk I/O metrics
      disk:
      # File System utilization metrics
      filesystem:
      # Memory utilization metrics
      memory:
      # Network interface I/O metrics & TCP connection metrics
      network:
      # CPU load metrics
      load:
      # Paging/Swap space utilization and I/O metrics
      paging:
      # Process count metrics
      processes:
      # Per process CPU, Memory and Disk I/O metrics. Disabled by default.
      # process:
  otlp:
    protocols:
      grpc:
      http:

  opencensus:

  # Collect own metrics
  prometheus/internal:
    config:
      scrape_configs:
      - job_name: 'otel-collector'
        scrape_interval: 10s
        static_configs:
        - targets: ['0.0.0.0:8888']

  jaeger:
    protocols:
      grpc:
      thrift_binary:
      thrift_compact:
      thrift_http:

  zipkin:

processors:
  batch:

exporters:
  logging:
    verbosity: detailed

service:

  pipelines:

    traces:
      receivers: [otlp, opencensus, jaeger, zipkin]
      processors: [batch]
      exporters: [logging]

    metrics:
      receivers: [otlp, opencensus, prometheus/internal]
      processors: [batch]
      exporters: [logging]

  extensions: [health_check, pprof, zpages]

Now that we have reviewed how data gets into the OpenTelemetry Collector through receivers, let’s now take a look at how the Collector processes the received data.

Warning

As the /etc/otelcol-contrib/config.yaml is not complete, please do not attempt to restart the collector at this point.