The Service section is used to configure what components are enabled in the Collector based on the configuration found in the receivers, processors, exporters, and extensions sections.
Info
If a component is configured, but not defined within the Service section then it is not enabled.
The service section consists of three sub-sections:
extensions
pipelines
telemetry
In the default configuration, the extension section has been configured to enable health_check, pprof and zpages, which we configured in the Extensions module earlier.
service:extensions:[health_check, pprof, zpages]
So lets configure our Metric Pipeline!
Subsections of OpenTelemetry Collector Service
OpenTelemetry Collector Service
Hostmetrics Receiver
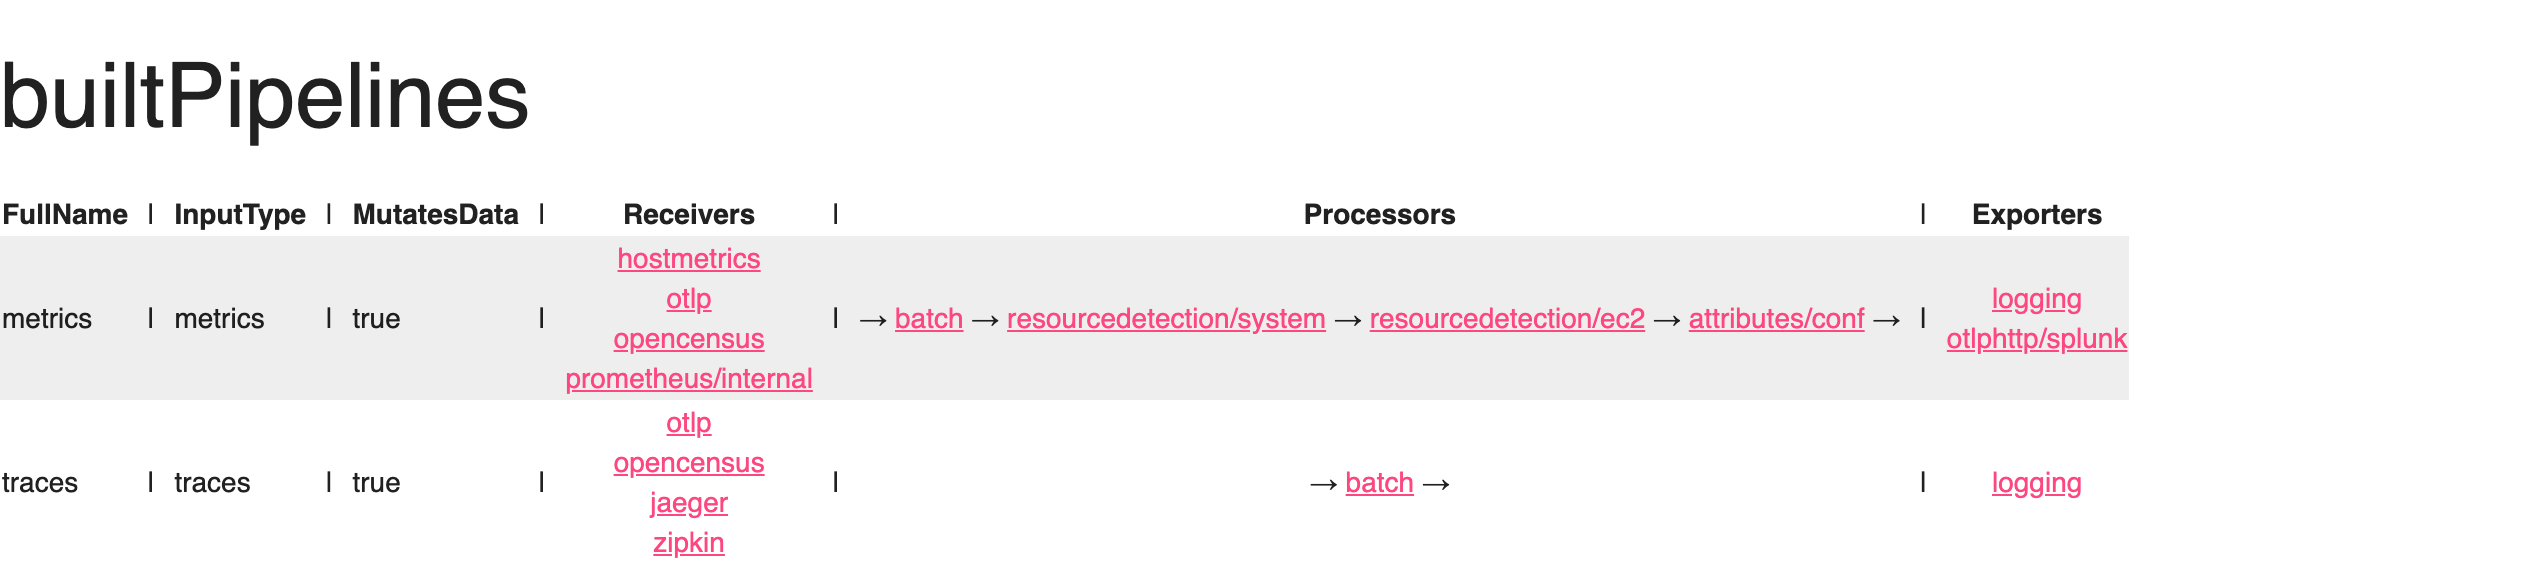
If you recall from the Receivers portion of the workshop, we defined the Host Metrics Receiver to generate metrics about the host system, which are scraped from various sources. To enable the receiver, we must include the hostmetrics receiver in the metrics pipeline.
In the metrics pipeline, add hostmetrics to the metrics receivers section.
Earlier in the workshop, we also renamed the prometheus receiver to reflect that is was collecting metrics internal to the collector, renaming it to prometheus/internal.
We now need to enable the prometheus/internal receiver under the metrics pipeline. Update the receivers section to include prometheus/internal under the metrics pipeline:
We also added resourcedetection/system and resourcedetection/ec2 processors so that the collector can capture the instance hostname and AWS/EC2 metadata. We now need to enable these two processors under the metrics pipeline.
Update the processors section to include resourcedetection/system and resourcedetection/ec2 under the metrics pipeline:
Also in the Processors section of this workshop, we added the attributes/conf processor so that the collector will insert a new attribute called participant.name to all the metrics. We now need to enable this under the metrics pipeline.
Update the processors section to include attributes/conf under the metrics pipeline:
In the Exporters section of the workshop, we configured the otlphttp exporter to send metrics to Splunk Observability Cloud. We now need to enable this under the metrics pipeline.
Update the exporters section to include otlphttp/splunk under the metrics pipeline:
The collector captures internal signals about its behavior this also includes additional signals from running components.
The reason for this is that components that make decisions about the flow of data need a way to surface that information
as metrics or traces.
Why monitor the collector?
This is somewhat of a chicken and egg problem of, “Who is watching the watcher?”, but it is important that we can surface this information. Another interesting part of the collector’s history is that it existed before the Go metrics’ SDK was considered stable so the collector exposes a Prometheus endpoint to provide this functionality for the time being.
Considerations
Monitoring the internal usage of each running collector in your organization can contribute a significant amount of new Metric Time Series (MTS). The Splunk distribution has curated these metrics for you and would be able to help forecast the expected increases.
The Ninja Zone
To expose the internal observability of the collector, some additional settings can be adjusted:
service:telemetry:logs:level:<info|warn|error>development:<true|false>encoding:<console|json>disable_caller:<true|false>disable_stacktrace:<true|false>output_paths:[<stdout|stderr>, paths...]error_output_paths:[<stdout|stderr>, paths...]initial_fields:key:valuemetrics:level:<none|basic|normal|detailed># Address binds the promethues endpoint to scrapeaddress:<hostname:port>
extensions:health_check:endpoint:0.0.0.0:13133pprof:endpoint:0.0.0.0:1777zpages:endpoint:0.0.0.0:55679receivers:hostmetrics:collection_interval:10sscrapers:# CPU utilization metricscpu:# Disk I/O metricsdisk:# File System utilization metricsfilesystem:# Memory utilization metricsmemory:# Network interface I/O metrics & TCP connection metricsnetwork:# CPU load metricsload:# Paging/Swap space utilization and I/O metricspaging:# Process count metricsprocesses:# Per process CPU, Memory and Disk I/O metrics. Disabled by default.# process:otlp:protocols:grpc:http:opencensus:# Collect own metricsprometheus/internal:config:scrape_configs:- job_name:'otel-collector'scrape_interval:10sstatic_configs:- targets:['0.0.0.0:8888']jaeger:protocols:grpc:thrift_binary:thrift_compact:thrift_http:zipkin:processors:batch:resourcedetection/system:detectors:[system]system:hostname_sources:[os]resourcedetection/ec2:detectors:[ec2]attributes/conf:actions:- key:participant.nameaction:insertvalue:"INSERT_YOUR_NAME_HERE"exporters:logging:verbosity:normalotlphttp/splunk:metrics_endpoint:https://ingest.${env:REALM}.signalfx.com/v2/datapoint/otlpheaders:X-SF-TOKEN:${env:ACCESS_TOKEN}service:pipelines:traces:receivers:[otlp, opencensus, jaeger, zipkin]processors:[batch]exporters:[logging]metrics:receivers:[hostmetrics, otlp, opencensus, prometheus/internal]processors:[batch, resourcedetection/system, resourcedetection/ec2, attributes/conf] exporters:[logging, otlphttp/splunk]extensions:[health_check, pprof, zpages]
Tip
It is recommended that you validate your configuration file before restarting the collector. You can do this by using the built-in validate command: