Making Your Observability Cloud Native With OpenTelemetry

1 hour   Author Robert Castley

Abstract

Organizations getting started with OpenTelemetry may begin by sending data directly to an observability backend. While this works well for initial testing, using the OpenTelemetry collector as part of your observability architecture provides numerous benefits and is recommended for any production deployment.

In this workshop, we will be focusing on using the OpenTelemetry collector and starting with the fundamentals of configuring the receivers, processors, and exporters ready to use with Splunk Observability Cloud. The journey will take attendees from novices to being able to start adding custom components to help solve for their business observability needs for their distributed platform.

Ninja Sections

Throughout the workshop there will be expandable Ninja Sections, these will be more hands on and go into further technical detail that you can explore within the workshop or in your own time.

Please note that the content in these sections may go out of date due to the frequent development being made to the OpenTelemetry project. Links will be provided in the event details are out of sync, please let us know if you spot something that needs updating.


By completing this workshop you will officially be an OpenTelemetry Collector Ninja!


Target Audience

This interactive workshop is for developers and system administrators who are interested in learning more about architecture and deployment of the OpenTelemetry Collector.

Prerequisites

  • Attendees should have a basic understanding of data collection
  • Command line and vim/vi experience.
  • A instance/host/VM running Ubuntu 20.04 LTS or 22.04 LTS.
    • Minimum requirements are an AWS/EC2 t2.micro (1 CPU, 1GB RAM, 8GB Storage)

Learning Objectives

By the end of this talk, attendees will be able to:

  • Understand the components of OpenTelemetry
  • Use receivers, processors, and exporters to collect and analyze data
  • Identify the benefits of using OpenTelemetry
  • Build a custom component to solve their business needs

OpenTelemetry Architecture

%%{
  init:{
    "theme":"base",
    "themeVariables": {
      "primaryColor": "#ffffff",
      "clusterBkg": "#eff2fb",
      "defaultLinkColor": "#333333"
    }
  }
}%%

flowchart LR;
    subgraph Collector
    A[OTLP] --> M(Receivers)
    B[JAEGER] --> M(Receivers)
    C[Prometheus] --> M(Receivers)
    end
    subgraph Processors
    M(Receivers) --> H(Filters, Attributes, etc)
    E(Extensions)
    end
    subgraph Exporters
    H(Filters, Attributes, etc) --> S(OTLP)
    H(Filters, Attributes, etc) --> T(JAEGER)
    H(Filters, Attributes, etc) --> U(Prometheus)
    end
Last Modified Sep 19, 2024

Subsections of Making Your Observability Cloud Native With OpenTelemetry

Installing OpenTelemetry Collector Contrib

Download the OpenTelemetry Collector Contrib distribution

The first step in installing the Open Telemetry Collector is downloading it. For our lab, we will use the wget command to download the .deb package from the OpenTelemetry Github repository.

Obtain the .deb package for your platform from the OpenTelemetry Collector Contrib releases page

wget https://github.com/open-telemetry/opentelemetry-collector-releases/releases/download/v0.96.0/otelcol-contrib_0.96.0_linux_amd64.deb

Install the OpenTelemetry Collector Contrib distribution

Install the .deb package using dpkg. Take a look at the dpkg Output tab below to see what the example output of a successful install will look like:

sudo dpkg -i otelcol-contrib_0.96.0_linux_amd64.deb
Selecting previously unselected package otelcol-contrib.
(Reading database ... 64218 files and directories currently installed.)
Preparing to unpack otelcol-contrib_0.96.0_linux_amd64.deb ...
Unpacking otelcol-contrib (0.96.0) ...
Setting up otelcol-contrib (0.96.0) ...
Created symlink /etc/systemd/system/multi-user.target.wants/otelcol-contrib.service → /lib/systemd/system/otelcol-contrib.service.
Last Modified Sep 19, 2024

Subsections of Installing OpenTelemetry Collector Contrib

Installing OpenTelemetry Collector Contrib

Confirm the Collector is running

The collector should now be running. We will verify this as root using systemctl command. To exit the status just press q.

sudo systemctl status otelcol-contrib
● otelcol-contrib.service - OpenTelemetry Collector Contrib
     Loaded: loaded (/lib/systemd/system/otelcol-contrib.service; enabled; vendor preset: enabled)
     Active: active (running) since Tue 2023-05-16 08:23:23 UTC; 25s ago
   Main PID: 1415 (otelcol-contrib)
      Tasks: 5 (limit: 1141)
     Memory: 22.2M
        CPU: 125ms
     CGroup: /system.slice/otelcol-contrib.service
             └─1415 /usr/bin/otelcol-contrib --config=/etc/otelcol-contrib/config.yaml

May 16 08:23:39 ip-10-0-9-125 otelcol-contrib[1415]: NumberDataPoints #0
May 16 08:23:39 ip-10-0-9-125 otelcol-contrib[1415]: Data point attributes:
May 16 08:23:39 ip-10-0-9-125 otelcol-contrib[1415]:      -> exporter: Str(logging)
May 16 08:23:39 ip-10-0-9-125 otelcol-contrib[1415]:      -> service_instance_id: Str(df8a57f4-abdc-46b9-a847-acd62db1001f)
May 16 08:23:39 ip-10-0-9-125 otelcol-contrib[1415]:      -> service_name: Str(otelcol-contrib)
May 16 08:23:39 ip-10-0-9-125 otelcol-contrib[1415]:      -> service_version: Str(0.75.0)
May 16 08:23:39 ip-10-0-9-125 otelcol-contrib[1415]: StartTimestamp: 2023-05-16 08:23:39.006 +0000 UTC
May 16 08:23:39 ip-10-0-9-125 otelcol-contrib[1415]: Timestamp: 2023-05-16 08:23:39.006 +0000 UTC
May 16 08:23:39 ip-10-0-9-125 otelcol-contrib[1415]: Value: 0.000000
May 16 08:23:39 ip-10-0-9-125 otelcol-contrib[1415]:         {"kind": "exporter", "data_type": "metrics", "name": "logging"}

Because we will be making multiple configuration file changes, setting environment variables and restarting the collector, we need to stop the collector service and disable it from starting on boot.

sudo systemctl stop otelcol-contrib && sudo systemctl disable otelcol-contrib

For this part we will require the following installed on your system:

  • Golang (latest version)

    cd /tmp
    wget https://golang.org/dl/go1.20.linux-amd64.tar.gz
    sudo tar -C /usr/local -xzf go1.20.linux-amd64.tar.gz

    Edit .profile and add the following environment variables:

    export GOROOT=/usr/local/go
    export GOPATH=$HOME/go
    export PATH=$GOPATH/bin:$GOROOT/bin:$PATH

    Renew your shell session:

    source ~/.profile

    Check Go version:

    go version
  • ocb installed

    • Download the ocb binary from the project releases and run the following commands:

      mv ocb_0.80.0_darwin_arm64 /usr/bin/ocb
      chmod 755 /usr/bin/ocb

      An alternative approach would be to use the golang tool chain to build the binary locally by doing:

      go install go.opentelemetry.io/collector/cmd/builder@v0.80.0
      mv $(go env GOPATH)/bin/builder /usr/bin/ocb
  • (Optional) Docker

Why build your own collector?

The default distribution of the collector (core and contrib) either contains too much or too little in what they have to offer.

It is also not advised to run the contrib collector in your production environments due to the amount of components installed which more than likely are not needed by your deployment.

Benefits of building your own collector?

When creating your own collector binaries, (commonly referred to as distribution), means you build what you need.

The benefits of this are:

  1. Smaller sized binaries
  2. Can use existing go scanners for vulnerabilities
  3. Include internal components that can tie in with your organization

Considerations for building your collector?

Now, this would not be a 🥷 Ninja zone if it didn’t come with some drawbacks:

  1. Go experience is recommended if not required
  2. No Splunk support
  3. Responsibility for distribution and lifecycle management

It is important to note that the project is working towards stability but it does not mean changes made will not break your workflow. The team at Splunk provides increased support and a higher level of stability so they can provide a curated experience helping you with your deployment needs.

The Ninja Zone

Once you have all the required tools installed to get started, you will need to create a new file named otelcol-builder.yaml and we will follow this directory structure:

.
└── otelcol-builder.yaml

Once we have the file created, we need to add a list of components for it to install with some additional metadata.

For this example, we are going to create a builder manifest that will install only the components we need for the introduction config:

dist:
  name: otelcol-ninja
  description: A custom build of the Open Telemetry Collector
  output_path: ./dist

extensions:
- gomod: go.opentelemetry.io/collector/extension/ballastextension v0.80.0
- gomod: go.opentelemetry.io/collector/extension/zpagesextension  v0.80.0
- gomod: github.com/open-telemetry/opentelemetry-collector-contrib/extension/httpforwarder v0.80.0
- gomod: github.com/open-telemetry/opentelemetry-collector-contrib/extension/healthcheckextension v0.80.0

exporters:
- gomod: go.opentelemetry.io/collector/exporter/loggingexporter v0.80.0
- gomod: go.opentelemetry.io/collector/exporter/otlpexporter v0.80.0
- gomod: github.com/open-telemetry/opentelemetry-collector-contrib/exporter/splunkhecexporter v0.80.0
- gomod: github.com/open-telemetry/opentelemetry-collector-contrib/exporter/signalfxexporter v0.80.0
- gomod: github.com/open-telemetry/opentelemetry-collector-contrib/exporter/sapmexporter v0.80.0

processors:
- gomod: go.opentelemetry.io/collector/processor/batchprocessor v0.80.0
- gomod: go.opentelemetry.io/collector/processor/memorylimiterprocessor v0.80.0

receivers:
- gomod: go.opentelemetry.io/collector/receiver/otlpreceiver v0.80.0
- gomod: github.com/open-telemetry/opentelemetry-collector-contrib/receiver/hostmetricsreceiver v0.80.0
- gomod: github.com/open-telemetry/opentelemetry-collector-contrib/receiver/jaegerreceiver v0.80.0
- gomod: github.com/open-telemetry/opentelemetry-collector-contrib/receiver/prometheusreceiver v0.80.0
- gomod: github.com/open-telemetry/opentelemetry-collector-contrib/receiver/zipkinreceiver v0.80.0

Once the yaml file has been updated for the ocb, then run the following command:

ocb --config=otelcol-builder.yaml

Which leave you with the following directory structure:

├── dist
│   ├── components.go
│   ├── components_test.go
│   ├── go.mod
│   ├── go.sum
│   ├── main.go
│   ├── main_others.go
│   ├── main_windows.go
│   └── otelcol-ninja
└── otelcol-builder.yaml

References

  1. https://opentelemetry.io/docs/collector/custom-collector/

Default configuration

OpenTelemetry is configured through YAML files. These files have default configurations that we can modify to meet our needs. Let’s look at the default configuration that is supplied:

cat /etc/otelcol-contrib/config.yaml
 1
 2
 3
 4
 5
 6
 7
 8
 9
10
11
12
13
14
15
16
17
18
19
20
21
22
23
24
25
26
27
28
29
30
31
32
33
34
35
36
37
38
39
40
41
42
43
44
45
46
47
48
49
50
51
52
53
54
55
extensions:
  health_check:
  pprof:
    endpoint: 0.0.0.0:1777
  zpages:
    endpoint: 0.0.0.0:55679

receivers:
  otlp:
    protocols:
      grpc:
      http:

  opencensus:

  # Collect own metrics
  prometheus:
    config:
      scrape_configs:
      - job_name: 'otel-collector'
        scrape_interval: 10s
        static_configs:
        - targets: ['0.0.0.0:8888']

  jaeger:
    protocols:
      grpc:
      thrift_binary:
      thrift_compact:
      thrift_http:

  zipkin:

processors:
  batch:

exporters:
  logging:
    verbosity: detailed

service:

  pipelines:

    traces:
      receivers: [otlp, opencensus, jaeger, zipkin]
      processors: [batch]
      exporters: [logging]

    metrics:
      receivers: [otlp, opencensus, prometheus]
      processors: [batch]
      exporters: [logging]

  extensions: [health_check, pprof, zpages]

Congratulations! You have successfully downloaded and installed the OpenTelemetry Collector. You are well on your way to becoming an OTel Ninja. But first let’s walk through configuration files and different distributions of the OpenTelemetry Collector.

Note

Splunk does provide its own, fully supported, distribution of the OpenTelemetry Collector. This distribution is available to install from the Splunk GitHub Repository or via a wizard in Splunk Observability Cloud that will build out a simple installation script to copy and paste. This distribution includes many additional features and enhancements that are not available in the OpenTelemetry Collector Contrib distribution.

  • The Splunk Distribution of the OpenTelemetry Collector is production-tested; it is in use by the majority of customers in their production environments.
  • Customers that use our distribution can receive direct help from official Splunk support within SLAs.
  • Customers can use or migrate to the Splunk Distribution of the OpenTelemetry Collector without worrying about future breaking changes to its core configuration experience for metrics and traces collection (OpenTelemetry logs collection configuration is in beta). There may be breaking changes to the Collector’s metrics.

We will now walk through each section of the configuration file and modify it to send host metrics to Splunk Observability Cloud.

Last Modified Sep 19, 2024

OpenTelemetry Collector Extensions

Now that we have the OpenTelemetry Collector installed, let’s take a look at extensions for the OpenTelemetry Collector. Extensions are optional and available primarily for tasks that do not involve processing telemetry data. Examples of extensions include health monitoring, service discovery, and data forwarding.

%%{
  init:{
    "theme": "base",
    "themeVariables": {
      "primaryColor": "#ffffff",
      "clusterBkg": "#eff2fb",
      "defaultLinkColor": "#333333"
    }
  }
}%%

flowchart LR;
    style E fill:#e20082,stroke:#333,stroke-width:4px,color:#fff
    subgraph Collector
    A[OTLP] --> M(Receivers)
    B[JAEGER] --> M(Receivers)
    C[Prometheus] --> M(Receivers)
    end
    subgraph Processors
    M(Receivers) --> H(Filters, Attributes, etc)
    E(Extensions)
    end
    subgraph Exporters
    H(Filters, Attributes, etc) --> S(OTLP)
    H(Filters, Attributes, etc) --> T(JAEGER)
    H(Filters, Attributes, etc) --> U(Prometheus)
    end
Last Modified Sep 19, 2024

Subsections of OpenTelemetry Collector Extensions

OpenTelemetry Collector Extensions

Health Check

Extensions are configured in the same config.yaml file that we referenced in the installation step. Let’s edit the config.yaml file and configure the extensions. Note that the pprof and zpages extensions are already configured in the default config.yaml file. For the purpose of this workshop, we will only be updating the health_check extension to expose the port on all network interfaces on which we can access the health of the collector.

sudo vi /etc/otelcol-contrib/config.yaml
extensions:
  health_check:
    endpoint: 0.0.0.0:13133

Start the collector:

otelcol-contrib --config=file:/etc/otelcol-contrib/config.yaml

This extension enables an HTTP URL that can be probed to check the status of the OpenTelemetry Collector. This extension can be used as a liveness and/or readiness probe on Kubernetes. To learn more about the curl command, check out the curl man page.

Open a new terminal session and SSH into your instance to run the following command:

curl http://localhost:13133
{"status":"Server available","upSince":"2023-04-27T10:11:22.153295874+01:00","uptime":"16m24.684476004s"}
Last Modified Sep 19, 2024

OpenTelemetry Collector Extensions

Performance Profiler

Performance Profiler extension enables the golang net/http/pprof endpoint. This is typically used by developers to collect performance profiles and investigate issues with the service. We will not be covering this in this workshop.

Last Modified Sep 19, 2024

OpenTelemetry Collector Extensions

zPages

zPages are an in-process alternative to external exporters. When included, they collect and aggregate tracing and metrics information in the background; this data is served on web pages when requested. zPages are an extremely useful diagnostic feature to ensure the collector is running as expected.

ServiceZ gives an overview of the collector services and quick access to the pipelinez, extensionz, and featurez zPages. The page also provides build and runtime information.

Example URL: http://localhost:55679/debug/servicez (change localhost to reflect your own environment).

ServiceZ ServiceZ

PipelineZ provides insights on the running pipelines running in the collector. You can find information on type, if data is mutated, and you can also see information on the receivers, processors and exporters that are used for each pipeline.

Example URL: http://localhost:55679/debug/pipelinez (change localhost to reflect your own environment).

PipelineZ PipelineZ

ExtensionZ shows the extensions that are active in the collector.

Example URL: http://localhost:55679/debug/extensionz (change localhost to reflect your own environment).

ExtensionZ ExtensionZ

Info

You can use your browser to access your environment emitting zPages information at (replace <insert_your_ip> with your IP address):


For this, we will need to validate that our distribution has the file_storage extension installed. This can be done by running the command otelcol-contrib components which should show results like:

# ... truncated for clarity
extensions:
  - file_storage
buildinfo:
    command: otelcol-contrib
    description: OpenTelemetry Collector Contrib
    version: 0.80.0
receivers:
    - prometheus_simple
    - apache
    - influxdb
    - purefa
    - purefb
    - receiver_creator
    - mongodbatlas
    - vcenter
    - snmp
    - expvar
    - jmx
    - kafka
    - skywalking
    - udplog
    - carbon
    - kafkametrics
    - memcached
    - prometheus
    - windowseventlog
    - zookeeper
    - otlp
    - awsecscontainermetrics
    - iis
    - mysql
    - nsxt
    - aerospike
    - elasticsearch
    - httpcheck
    - k8sobjects
    - mongodb
    - hostmetrics
    - signalfx
    - statsd
    - awsxray
    - cloudfoundry
    - collectd
    - couchdb
    - kubeletstats
    - jaeger
    - journald
    - riak
    - splunk_hec
    - active_directory_ds
    - awscloudwatch
    - sqlquery
    - windowsperfcounters
    - flinkmetrics
    - googlecloudpubsub
    - podman_stats
    - wavefront
    - k8s_events
    - postgresql
    - rabbitmq
    - sapm
    - sqlserver
    - redis
    - solace
    - tcplog
    - awscontainerinsightreceiver
    - awsfirehose
    - bigip
    - filelog
    - googlecloudspanner
    - cloudflare
    - docker_stats
    - k8s_cluster
    - pulsar
    - zipkin
    - nginx
    - opencensus
    - azureeventhub
    - datadog
    - fluentforward
    - otlpjsonfile
    - syslog
processors:
    - resource
    - batch
    - cumulativetodelta
    - groupbyattrs
    - groupbytrace
    - k8sattributes
    - experimental_metricsgeneration
    - metricstransform
    - routing
    - attributes
    - datadog
    - deltatorate
    - spanmetrics
    - span
    - memory_limiter
    - redaction
    - resourcedetection
    - servicegraph
    - transform
    - filter
    - probabilistic_sampler
    - tail_sampling
exporters:
    - otlp
    - carbon
    - datadog
    - f5cloud
    - kafka
    - mezmo
    - skywalking
    - awsxray
    - dynatrace
    - loki
    - prometheus
    - logging
    - azuredataexplorer
    - azuremonitor
    - instana
    - jaeger
    - loadbalancing
    - sentry
    - splunk_hec
    - tanzuobservability
    - zipkin
    - alibabacloud_logservice
    - clickhouse
    - file
    - googlecloud
    - prometheusremotewrite
    - awscloudwatchlogs
    - googlecloudpubsub
    - jaeger_thrift
    - logzio
    - sapm
    - sumologic
    - otlphttp
    - googlemanagedprometheus
    - opencensus
    - awskinesis
    - coralogix
    - influxdb
    - logicmonitor
    - signalfx
    - tencentcloud_logservice
    - awsemf
    - elasticsearch
    - pulsar
extensions:
    - zpages
    - bearertokenauth
    - oidc
    - host_observer
    - sigv4auth
    - file_storage
    - memory_ballast
    - health_check
    - oauth2client
    - awsproxy
    - http_forwarder
    - jaegerremotesampling
    - k8s_observer
    - pprof
    - asapclient
    - basicauth
    - headers_setter

This extension provides exporters the ability to queue data to disk in the event that exporter is unable to send data to the configured endpoint.

In order to configure the extension, you will need to update your config to include the information below. First, be sure to create a /tmp/otel-data directory and give it read/write permissions:

extensions:
...
  file_storage:
    directory: /tmp/otel-data
    timeout: 10s
    compaction:
      directory: /tmp/otel-data
      on_start: true
      on_rebound: true
      rebound_needed_threshold_mib: 5
      rebound_trigger_threshold_mib: 3

# ... truncated for clarity

service:
  extensions: [health_check, pprof, zpages, file_storage]

Why queue data to disk?

This allows the collector to weather network interruptions (and even collector restarts) to ensure data is sent to the upstream provider.

Considerations for queuing data to disk?

There is a potential that this could impact data throughput performance due to disk performance.

References

  1. https://community.splunk.com/t5/Community-Blog/Data-Persistence-in-the-OpenTelemetry-Collector/ba-p/624583
  2. https://github.com/open-telemetry/opentelemetry-collector-contrib/tree/main/extension/storage/filestorage

Configuration Check-in

Now that we’ve covered extensions, let’s check our configuration changes.


 1
 2
 3
 4
 5
 6
 7
 8
 9
10
11
12
13
14
15
16
17
18
19
20
21
22
23
24
25
26
27
28
29
30
31
32
33
34
35
36
37
38
39
40
41
42
43
44
45
46
47
48
49
50
51
52
53
54
55
56
extensions:
  health_check:
    endpoint: 0.0.0.0:13133
  pprof:
    endpoint: 0.0.0.0:1777
  zpages:
    endpoint: 0.0.0.0:55679

receivers:
  otlp:
    protocols:
      grpc:
      http:

  opencensus:

  # Collect own metrics
  prometheus:
    config:
      scrape_configs:
      - job_name: 'otel-collector'
        scrape_interval: 10s
        static_configs:
        - targets: ['0.0.0.0:8888']

  jaeger:
    protocols:
      grpc:
      thrift_binary:
      thrift_compact:
      thrift_http:

  zipkin:

processors:
  batch:

exporters:
  logging:
    verbosity: detailed

service:

  pipelines:

    traces:
      receivers: [otlp, opencensus, jaeger, zipkin]
      processors: [batch]
      exporters: [logging]

    metrics:
      receivers: [otlp, opencensus, prometheus]
      processors: [batch]
      exporters: [logging]

  extensions: [health_check, pprof, zpages]

Now that we have reviewed extensions, let’s dive into the data pipeline portion of the workshop. A pipeline defines a path the data follows in the Collector starting from reception, moving to further processing or modification, and finally exiting the Collector via exporters.

The data pipeline in the OpenTelemetry Collector is made up of receivers, processors, and exporters. We will first start with receivers.

Last Modified Sep 19, 2024

OpenTelemetry Collector Receivers

Welcome to the receiver portion of the workshop! This is the starting point of the data pipeline of the OpenTelemetry Collector. Let’s dive in.

A receiver, which can be push or pull based, is how data gets into the Collector. Receivers may support one or more data sources. Generally, a receiver accepts data in a specified format, translates it into the internal format and passes it to processors and exporters defined in the applicable pipelines.

%%{
  init:{
    "theme":"base",
    "themeVariables": {
      "primaryColor": "#ffffff",
      "clusterBkg": "#eff2fb",
      "defaultLinkColor": "#333333"
    }
  }
}%%

flowchart LR;
    style M fill:#e20082,stroke:#333,stroke-width:4px,color:#fff
    subgraph Collector
    A[OTLP] --> M(Receivers)
    B[JAEGER] --> M(Receivers)
    C[Prometheus] --> M(Receivers)
    end
    subgraph Processors
    M(Receivers) --> H(Filters, Attributes, etc)
    E(Extensions)
    end
    subgraph Exporters
    H(Filters, Attributes, etc) --> S(OTLP)
    H(Filters, Attributes, etc) --> T(JAEGER)
    H(Filters, Attributes, etc) --> U(Prometheus)
    end
Last Modified Sep 19, 2024

Subsections of OpenTelemetry Collector Receivers

OpenTelemetry Collector Receivers

Host Metrics Receiver

The Host Metrics Receiver generates metrics about the host system scraped from various sources. This is intended to be used when the collector is deployed as an agent which is what we will be doing in this workshop.

Let’s update the /etc/otel-contrib/config.yaml file and configure the hostmetrics receiver. Insert the following YAML under the receivers section, taking care to indent by two spaces.

sudo vi /etc/otelcol-contrib/config.yaml
receivers:
  hostmetrics:
    collection_interval: 10s
    scrapers:
      # CPU utilization metrics
      cpu:
      # Disk I/O metrics
      disk:
      # File System utilization metrics
      filesystem:
      # Memory utilization metrics
      memory:
      # Network interface I/O metrics & TCP connection metrics
      network:
      # CPU load metrics
      load:
      # Paging/Swap space utilization and I/O metrics
      paging:
      # Process count metrics
      processes:
      # Per process CPU, Memory and Disk I/O metrics. Disabled by default.
      # process:
Last Modified Sep 19, 2024

OpenTelemetry Collector Receivers

Prometheus Receiver

You will also notice another receiver called prometheus. Prometheus is an open-source toolkit used by the OpenTelemetry Collector. This receiver is used to scrape metrics from the OpenTelemetry Collector itself. These metrics can then be used to monitor the health of the collector.

Let’s modify the prometheus receiver to clearly show that it is for collecting metrics from the collector itself. By changing the name of the receiver from prometheus to prometheus/internal, it is now much clearer as to what that receiver is doing. Update the configuration file to look like this:

prometheus/internal:
  config:
    scrape_configs:
    - job_name: 'otel-collector'
      scrape_interval: 10s
      static_configs:
      - targets: ['0.0.0.0:8888']

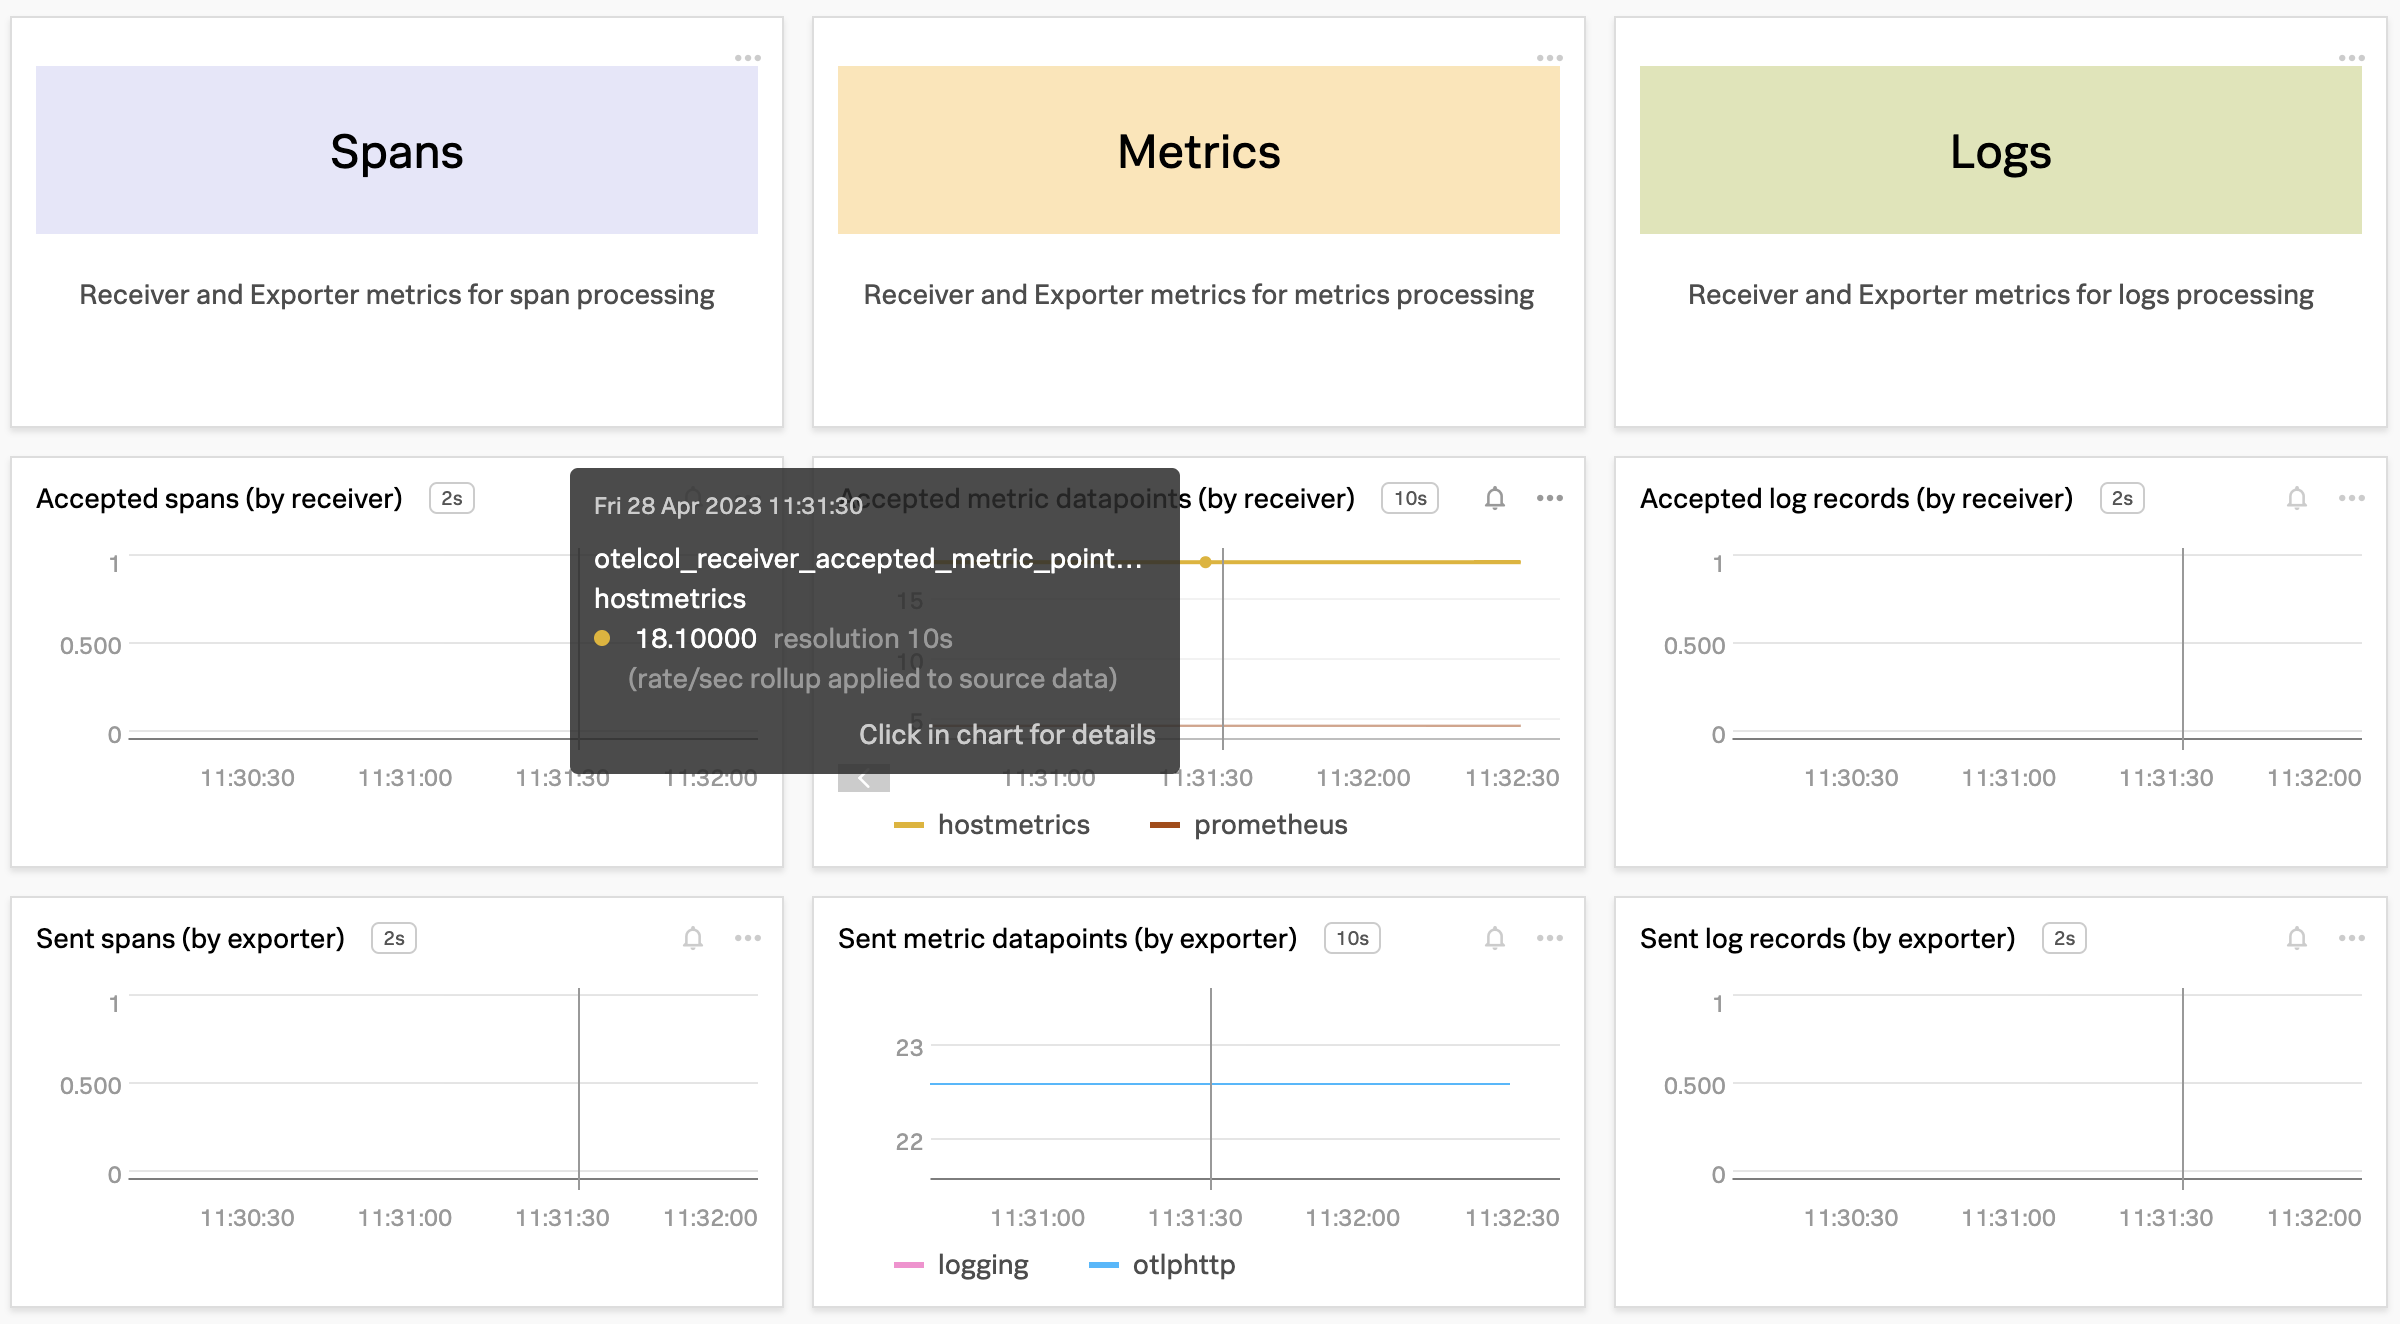
Example Dashboard - Prometheus metrics

The following screenshot shows an example dashboard of spme of the metrics the Prometheus internal receiver collects from the OpenTelemetry Collector. Here, we can see accepted and sent spans, metrics and log records.

Note

The following screenshot is an out-of-the-box (OOTB) dashboard from Splunk Observability Cloud that allows you to easily monitor your Splunk OpenTelemetry Collector install base.

otel-charts otel-charts

Last Modified Sep 19, 2024

OpenTelemetry Collector Receivers

Other Receivers

You will notice in the default configuration there are other receivers: otlp, opencensus, jaeger and zipkin. These are used to receive telemetry data from other sources. We will not be covering these receivers in this workshop and they can be left as they are.


To help observe short lived tasks like docker containers, kubernetes pods, or ssh sessions, we can use the receiver creator with observer extensions to create a new receiver as these services start up.

What do we need?

In order to start using the receiver creator and its associated observer extensions, they will need to be part of your collector build manifest.

See installation for the details.

Things to consider?

Some short lived tasks may require additional configuration such as username, and password. These values can be referenced via environment variables, or use a scheme expand syntax such as ${file:./path/to/database/password}. Please adhere to your organisation’s secret practices when taking this route.

The Ninja Zone

There are only two things needed for this ninja zone:

  1. Make sure you have added receiver creater and observer extensions to the builder manifest.
  2. Create the config that can be used to match against discovered endpoints.

To create the templated configurations, you can do the following:

receiver_creator:
  watch_observers: [host_observer]
  receivers:
    redis:
      rule: type == "port" && port == 6379
      config:
        password: ${env:HOST_REDIS_PASSWORD}

For more examples, refer to these receiver creator’s examples.


Configuration Check-in

We’ve now covered receivers, so let’s now check our configuration changes.


 1
 2
 3
 4
 5
 6
 7
 8
 9
10
11
12
13
14
15
16
17
18
19
20
21
22
23
24
25
26
27
28
29
30
31
32
33
34
35
36
37
38
39
40
41
42
43
44
45
46
47
48
49
50
51
52
53
54
55
56
57
58
59
60
61
62
63
64
65
66
67
68
69
70
71
72
73
74
75
76
77
extensions:
  health_check:
    endpoint: 0.0.0.0:13133
  pprof:
    endpoint: 0.0.0.0:1777
  zpages:
    endpoint: 0.0.0.0:55679

receivers:
  hostmetrics:
    collection_interval: 10s
    scrapers:
      # CPU utilization metrics
      cpu:
      # Disk I/O metrics
      disk:
      # File System utilization metrics
      filesystem:
      # Memory utilization metrics
      memory:
      # Network interface I/O metrics & TCP connection metrics
      network:
      # CPU load metrics
      load:
      # Paging/Swap space utilization and I/O metrics
      paging:
      # Process count metrics
      processes:
      # Per process CPU, Memory and Disk I/O metrics. Disabled by default.
      # process:
  otlp:
    protocols:
      grpc:
      http:

  opencensus:

  # Collect own metrics
  prometheus/internal:
    config:
      scrape_configs:
      - job_name: 'otel-collector'
        scrape_interval: 10s
        static_configs:
        - targets: ['0.0.0.0:8888']

  jaeger:
    protocols:
      grpc:
      thrift_binary:
      thrift_compact:
      thrift_http:

  zipkin:

processors:
  batch:

exporters:
  logging:
    verbosity: detailed

service:

  pipelines:

    traces:
      receivers: [otlp, opencensus, jaeger, zipkin]
      processors: [batch]
      exporters: [logging]

    metrics:
      receivers: [otlp, opencensus, prometheus/internal]
      processors: [batch]
      exporters: [logging]

  extensions: [health_check, pprof, zpages]

Now that we have reviewed how data gets into the OpenTelemetry Collector through receivers, let’s now take a look at how the Collector processes the received data.

Warning

As the /etc/otelcol-contrib/config.yaml is not complete, please do not attempt to restart the collector at this point.

Last Modified Sep 19, 2024

OpenTelemetry Collector Processors

Processors are run on data between being received and being exported. Processors are optional though some are recommended. There are a large number of processors included in the OpenTelemetry contrib Collector.

%%{
  init:{
    "theme":"base",
    "themeVariables": {
      "primaryColor": "#ffffff",
      "clusterBkg": "#eff2fb",
      "defaultLinkColor": "#333333"
    }
  }
}%%

flowchart LR;
    style Processors fill:#e20082,stroke:#333,stroke-width:4px,color:#fff
    subgraph Collector
    A[OTLP] --> M(Receivers)
    B[JAEGER] --> M(Receivers)
    C[Prometheus] --> M(Receivers)
    end
    subgraph Processors
    M(Receivers) --> H(Filters, Attributes, etc)
    E(Extensions)
    end
    subgraph Exporters
    H(Filters, Attributes, etc) --> S(OTLP)
    H(Filters, Attributes, etc) --> T(JAEGER)
    H(Filters, Attributes, etc) --> U(Prometheus)
    end
Last Modified Sep 19, 2024

Subsections of OpenTelemetry Collector Processors

OpenTelemetry Collector Processors

Batch Processor

By default, only the batch processor is enabled. This processor is used to batch up data before it is exported. This is useful for reducing the number of network calls made to exporters. For this workshop, we will inherit the following defaults which are hard-coded into the Collector:

  • send_batch_size (default = 8192): Number of spans, metric data points, or log records after which a batch will be sent regardless of the timeout. send_batch_size acts as a trigger and does not affect the size of the batch. If you need to enforce batch size limits sent to the next component in the pipeline see send_batch_max_size.
  • timeout (default = 200ms): Time duration after which a batch will be sent regardless of size. If set to zero, send_batch_size is ignored as data will be sent immediately, subject to only send_batch_max_size.
  • send_batch_max_size (default = 0): The upper limit of the batch size. 0 means no upper limit on the batch size. This property ensures that larger batches are split into smaller units. It must be greater than or equal to send_batch_size.

For more information on the Batch processor, see the Batch Processor documentation.

Last Modified Sep 19, 2024

OpenTelemetry Collector Processors

Resource Detection Processor

The resourcedetection processor can be used to detect resource information from the host and append or override the resource value in telemetry data with this information.

By default, the hostname is set to the FQDN if possible, otherwise, the hostname provided by the OS is used as a fallback. This logic can be changed from using using the hostname_sources configuration option. To avoid getting the FQDN and use the hostname provided by the OS, we will set the hostname_sources to os.

processors:
  batch:
  resourcedetection/system:
    detectors: [system]
    system:
      hostname_sources: [os]

If the workshop instance is running on an AWS/EC2 instance we can gather the following tags from the EC2 metadata API (this is not available on other platforms).

  • cloud.provider ("aws")
  • cloud.platform ("aws_ec2")
  • cloud.account.id
  • cloud.region
  • cloud.availability_zone
  • host.id
  • host.image.id
  • host.name
  • host.type

We will create another processor to append these tags to our metrics.

processors:
  batch:
  resourcedetection/system:
    detectors: [system]
    system:
      hostname_sources: [os]
  resourcedetection/ec2:
    detectors: [ec2]
Last Modified Sep 19, 2024

OpenTelemetry Collector Processors

Attributes Processor

The attributes processor modifies attributes of a span, log, or metric. This processor also supports the ability to filter and match input data to determine if they should be included or excluded for specified actions.

It takes a list of actions that are performed in the order specified in the config. The supported actions are:

  • insert: Inserts a new attribute in input data where the key does not already exist.
  • update: Updates an attribute in input data where the key does exist.
  • upsert: Performs insert or update. Inserts a new attribute in input data where the key does not already exist and updates an attribute in input data where the key does exist.
  • delete: Deletes an attribute from the input data.
  • hash: Hashes (SHA1) an existing attribute value.
  • extract: Extracts values using a regular expression rule from the input key to target keys specified in the rule. If a target key already exists, it will be overridden.

We are going to create an attributes processor to insert a new attribute to all our host metrics called participant.name with a value of your name e.g. marge_simpson.

Warning

Ensure you replace INSERT_YOUR_NAME_HERE with your name and also ensure you do not use spaces in your name.

Later on in the workshop, we will use this attribute to filter our metrics in Splunk Observability Cloud.

processors:
  batch:
  resourcedetection/system:
    detectors: [system]
    system:
      hostname_sources: [os]
  resourcedetection/ec2:
    detectors: [ec2]
  attributes/conf:
    actions:
      - key: participant.name
        action: insert
        value: "INSERT_YOUR_NAME_HERE"

One of the most recent additions to the collector was the notion of a connector, which allows you to join the output of one pipeline to the input of another pipeline.

An example of how this is beneficial is that some services emit metrics based on the amount of datapoints being exported, the number of logs containing an error status, or the amount of data being sent from one deployment environment. The count connector helps address this for you out of the box.

Why a connector instead of a processor?

A processor is limited in what additional data it can produce considering it has to pass on the data it has processed making it hard to expose additional information. Connectors do not have to emit the data they receive which means they provide an opportunity to create the insights we are after.

For example, a connector could be made to count the number of logs, metrics, and traces that do not have the deployment environment attribute.

A very simple example with the output of being able to break down data usage by deployment environment.

Considerations with connectors

A connector only accepts data exported from one pipeline and receiver by another pipeline, this means you may have to consider how you construct your collector config to take advantage of it.

References

  1. https://opentelemetry.io/docs/collector/configuration/#connectors
  2. https://github.com/open-telemetry/opentelemetry-collector-contrib/tree/main/connector/countconnector

Configuration Check-in

That’s processors covered, let’s check our configuration changes.


 1
 2
 3
 4
 5
 6
 7
 8
 9
10
11
12
13
14
15
16
17
18
19
20
21
22
23
24
25
26
27
28
29
30
31
32
33
34
35
36
37
38
39
40
41
42
43
44
45
46
47
48
49
50
51
52
53
54
55
56
57
58
59
60
61
62
63
64
65
66
67
68
69
70
71
72
73
74
75
76
77
78
79
80
81
82
83
84
85
86
87
88
extensions:
  health_check:
    endpoint: 0.0.0.0:13133
  pprof:
    endpoint: 0.0.0.0:1777
  zpages:
    endpoint: 0.0.0.0:55679

receivers:
  hostmetrics:
    collection_interval: 10s
    scrapers:
      # CPU utilization metrics
      cpu:
      # Disk I/O metrics
      disk:
      # File System utilization metrics
      filesystem:
      # Memory utilization metrics
      memory:
      # Network interface I/O metrics & TCP connection metrics
      network:
      # CPU load metrics
      load:
      # Paging/Swap space utilization and I/O metrics
      paging:
      # Process count metrics
      processes:
      # Per process CPU, Memory and Disk I/O metrics. Disabled by default.
      # process:
  otlp:
    protocols:
      grpc:
      http:

  opencensus:

  # Collect own metrics
  prometheus/internal:
    config:
      scrape_configs:
      - job_name: 'otel-collector'
        scrape_interval: 10s
        static_configs:
        - targets: ['0.0.0.0:8888']

  jaeger:
    protocols:
      grpc:
      thrift_binary:
      thrift_compact:
      thrift_http:

  zipkin:

processors:
  batch:
  resourcedetection/system:
    detectors: [system]
    system:
      hostname_sources: [os]
  resourcedetection/ec2:
    detectors: [ec2]
  attributes/conf:
    actions:
      - key: participant.name
        action: insert
        value: "INSERT_YOUR_NAME_HERE"

exporters:
  logging:
    verbosity: detailed

service:

  pipelines:

    traces:
      receivers: [otlp, opencensus, jaeger, zipkin]
      processors: [batch]
      exporters: [logging]

    metrics:
      receivers: [otlp, opencensus, prometheus]
      processors: [batch]
      exporters: [logging]

  extensions: [health_check, pprof, zpages]

Last Modified Sep 19, 2024

OpenTelemetry Collector Exporters

An exporter, which can be push or pull-based, is how you send data to one or more backends/destinations. Exporters may support one or more data sources.

For this workshop, we will be using the otlphttp exporter. The OpenTelemetry Protocol (OTLP) is a vendor-neutral, standardised protocol for transmitting telemetry data. The OTLP exporter sends data to a server that implements the OTLP protocol. The OTLP exporter supports both gRPC and HTTP/JSON protocols.

%%{
  init:{
    "theme":"base",
    "themeVariables": {
      "primaryColor": "#ffffff",
      "clusterBkg": "#eff2fb",
      "defaultLinkColor": "#333333"
    }
  }
}%%

flowchart LR;
    style Exporters fill:#e20082,stroke:#333,stroke-width:4px,color:#fff
    subgraph Collector
    A[OTLP] --> M(Receivers)
    B[JAEGER] --> M(Receivers)
    C[Prometheus] --> M(Receivers)
    end
    subgraph Processors
    M(Receivers) --> H(Filters, Attributes, etc)
    E(Extensions)
    end
    subgraph Exporters
    H(Filters, Attributes, etc) --> S(OTLP)
    H(Filters, Attributes, etc) --> T(JAEGER)
    H(Filters, Attributes, etc) --> U(Prometheus)
    end
Last Modified Sep 19, 2024

Subsections of OpenTelemetry Collector Exporters

OpenTelemetry Collector Exporters

OTLP HTTP Exporter

To send metrics over HTTP to Splunk Observability Cloud, we will need to configure the otlphttp exporter.

Let’s edit our /etc/otelcol-contrib/config.yaml file and configure the otlphttp exporter. Insert the following YAML under the exporters section, taking care to indent by two spaces e.g.

We will also change the verbosity of the logging exporter to prevent the disk from filling up. The default of detailed is very noisy.

exporters:
  logging:
    verbosity: normal
  otlphttp/splunk:

Next, we need to define the metrics_endpoint and configure the target URL.

Note

If you are an attendee at a Splunk-hosted workshop, the instance you are using has already been configured with a Realm environment variable. We will reference that environment variable in our configuration file. Otherwise, you will need to create a new environment variable and set the Realm e.g.

export REALM="us1"

The URL to use is https://ingest.${env:REALM}.signalfx.com/v2/datapoint/otlp. (Splunk has Realms in key geographical locations around the world for data residency).

The otlphttp exporter can also be configured to send traces and logs by defining a target URL for traces_endpoint and logs_endpoint respectively. Configuring these is outside the scope of this workshop.

exporters:
  logging:
    verbosity: normal
  otlphttp/splunk:
    metrics_endpoint: https://ingest.${env:REALM}.signalfx.com/v2/datapoint/otlp

By default, gzip compression is enabled for all endpoints. This can be disabled by setting compression: none in the exporter configuration. We will leave compression enabled for this workshop and accept the default as this is the most efficient way to send data.

To send metrics to Splunk Observability Cloud, we need to use an Access Token. This can be done by creating a new token in the Splunk Observability Cloud UI. For more information on how to create a token, see Create a token. The token needs to be of type INGEST.

Note

If you are an attendee at a Splunk-hosted workshop, the instance you are using has already been configured with an Access Token (which has been set as an environment variable). We will reference that environment variable in our configuration file. Otherwise, you will need to create a new token and set it as an environment variable e.g.

export ACCESS_TOKEN=<replace-with-your-token>

The token is defined in the configuration file by inserting X-SF-TOKEN: ${env:ACCESS_TOKEN} under a headers: section:

exporters:
  logging:
    verbosity: normal
  otlphttp/splunk:
    metrics_endpoint: https://ingest.${env:REALM}.signalfx.com/v2/datapoint/otlp
    headers:
      X-SF-TOKEN: ${env:ACCESS_TOKEN}

Configuration Check-in

Now that we’ve covered exporters, let’s check our configuration changes:


 1
 2
 3
 4
 5
 6
 7
 8
 9
10
11
12
13
14
15
16
17
18
19
20
21
22
23
24
25
26
27
28
29
30
31
32
33
34
35
36
37
38
39
40
41
42
43
44
45
46
47
48
49
50
51
52
53
54
55
56
57
58
59
60
61
62
63
64
65
66
67
68
69
70
71
72
73
74
75
76
77
78
79
80
81
82
83
84
85
86
87
88
89
90
91
92
extensions:
  health_check:
    endpoint: 0.0.0.0:13133
  pprof:
    endpoint: 0.0.0.0:1777
  zpages:
    endpoint: 0.0.0.0:55679

receivers:
  hostmetrics:
    collection_interval: 10s
    scrapers:
      # CPU utilization metrics
      cpu:
      # Disk I/O metrics
      disk:
      # File System utilization metrics
      filesystem:
      # Memory utilization metrics
      memory:
      # Network interface I/O metrics & TCP connection metrics
      network:
      # CPU load metrics
      load:
      # Paging/Swap space utilization and I/O metrics
      paging:
      # Process count metrics
      processes:
      # Per process CPU, Memory and Disk I/O metrics. Disabled by default.
      # process:
  otlp:
    protocols:
      grpc:
      http:

  opencensus:

  # Collect own metrics
  prometheus/internal:
    config:
      scrape_configs:
      - job_name: 'otel-collector'
        scrape_interval: 10s
        static_configs:
        - targets: ['0.0.0.0:8888']

  jaeger:
    protocols:
      grpc:
      thrift_binary:
      thrift_compact:
      thrift_http:

  zipkin:

processors:
  batch:
  resourcedetection/system:
    detectors: [system]
    system:
      hostname_sources: [os]
  resourcedetection/ec2:
    detectors: [ec2]
  attributes/conf:
    actions:
      - key: participant.name
        action: insert
        value: "INSERT_YOUR_NAME_HERE"

exporters:
  logging:
    verbosity: normal
  otlphttp/splunk:
    metrics_endpoint: https://ingest.${env:REALM}.signalfx.com/v2/datapoint/otlp
    headers:
      X-SF-TOKEN: ${env:ACCESS_TOKEN}

service:

  pipelines:

    traces:
      receivers: [otlp, opencensus, jaeger, zipkin]
      processors: [batch]
      exporters: [logging]

    metrics:
      receivers: [otlp, opencensus, prometheus]
      processors: [batch]
      exporters: [logging]

  extensions: [health_check, pprof, zpages]

Of course, you can easily configure the metrics_endpoint to point to any other solution that supports the OTLP protocol.

Next, we need to enable the receivers, processors and exporters we have just configured in the service section of the config.yaml.

Last Modified Sep 19, 2024

OpenTelemetry Collector Service

The Service section is used to configure what components are enabled in the Collector based on the configuration found in the receivers, processors, exporters, and extensions sections.

Info

If a component is configured, but not defined within the Service section then it is not enabled.

The service section consists of three sub-sections:

  • extensions
  • pipelines
  • telemetry

In the default configuration, the extension section has been configured to enable health_check, pprof and zpages, which we configured in the Extensions module earlier.

service:
  extensions: [health_check, pprof, zpages]

So lets configure our Metric Pipeline!

Last Modified Sep 19, 2024

Subsections of OpenTelemetry Collector Service

OpenTelemetry Collector Service

Hostmetrics Receiver

If you recall from the Receivers portion of the workshop, we defined the Host Metrics Receiver to generate metrics about the host system, which are scraped from various sources. To enable the receiver, we must include the hostmetrics receiver in the metrics pipeline.

In the metrics pipeline, add hostmetrics to the metrics receivers section.

service:

  pipelines:

    traces:
      receivers: [otlp, opencensus, jaeger, zipkin]
      processors: [batch]
      exporters: [logging]

    metrics:
      receivers: [hostmetrics, otlp, opencensus, prometheus]
      processors: [batch]
      exporters: [logging]
Last Modified Sep 19, 2024

OpenTelemetry Collector Service

Prometheus Internal Receiver

Earlier in the workshop, we also renamed the prometheus receiver to reflect that is was collecting metrics internal to the collector, renaming it to prometheus/internal.

We now need to enable the prometheus/internal receiver under the metrics pipeline. Update the receivers section to include prometheus/internal under the metrics pipeline:

service:

  pipelines:

    traces:
      receivers: [otlp, opencensus, jaeger, zipkin]
      processors: [batch]
      exporters: [logging]

    metrics:
      receivers: [hostmetrics, otlp, opencensus, prometheus/internal]
      processors: [batch]
      exporters: [logging]
Last Modified Sep 19, 2024

OpenTelemetry Collector Service

Resource Detection Processor

We also added resourcedetection/system and resourcedetection/ec2 processors so that the collector can capture the instance hostname and AWS/EC2 metadata. We now need to enable these two processors under the metrics pipeline.

Update the processors section to include resourcedetection/system and resourcedetection/ec2 under the metrics pipeline:

service:

  pipelines:

    traces:
      receivers: [otlp, opencensus, jaeger, zipkin]
      processors: [batch]
      exporters: [logging]

    metrics:
      receivers: [hostmetrics, otlp, opencensus, prometheus/internal]
      processors: [batch, resourcedetection/system, resourcedetection/ec2]
      exporters: [logging]
Last Modified Sep 19, 2024

OpenTelemetry Collector Service

Attributes Processor

Also in the Processors section of this workshop, we added the attributes/conf processor so that the collector will insert a new attribute called participant.name to all the metrics. We now need to enable this under the metrics pipeline.

Update the processors section to include attributes/conf under the metrics pipeline:

service:

  pipelines:

    traces:
      receivers: [otlp, opencensus, jaeger, zipkin]
      processors: [batch]
      exporters: [logging]

    metrics:
      receivers: [hostmetrics, otlp, opencensus, prometheus/internal]
      processors: [batch, resourcedetection/system, resourcedetection/ec2, attributes/conf]
      exporters: [logging]
Last Modified Sep 19, 2024

OpenTelemetry Collector Service

OTLP HTTP Exporter

In the Exporters section of the workshop, we configured the otlphttp exporter to send metrics to Splunk Observability Cloud. We now need to enable this under the metrics pipeline.

Update the exporters section to include otlphttp/splunk under the metrics pipeline:

service:

  pipelines:

    traces:
      receivers: [otlp, opencensus, jaeger, zipkin]
      processors: [batch]
      exporters: [logging]

    metrics:
      receivers: [hostmetrics, otlp, opencensus, prometheus/internal]
      processors: [batch, resourcedetection/system, resourcedetection/ec2, attributes/conf]
      exporters: [logging, otlphttp/splunk]

The collector captures internal signals about its behavior this also includes additional signals from running components. The reason for this is that components that make decisions about the flow of data need a way to surface that information as metrics or traces.

Why monitor the collector?

This is somewhat of a chicken and egg problem of, “Who is watching the watcher?”, but it is important that we can surface this information. Another interesting part of the collector’s history is that it existed before the Go metrics’ SDK was considered stable so the collector exposes a Prometheus endpoint to provide this functionality for the time being.

Considerations

Monitoring the internal usage of each running collector in your organization can contribute a significant amount of new Metric Time Series (MTS). The Splunk distribution has curated these metrics for you and would be able to help forecast the expected increases.

The Ninja Zone

To expose the internal observability of the collector, some additional settings can be adjusted:

service:
  telemetry:
    logs:
      level: <info|warn|error>
      development: <true|false>
      encoding: <console|json>
      disable_caller: <true|false>
      disable_stacktrace: <true|false>
      output_paths: [<stdout|stderr>, paths...]
      error_output_paths: [<stdout|stderr>, paths...]
      initial_fields:
        key: value
    metrics:
      level: <none|basic|normal|detailed>
      # Address binds the promethues endpoint to scrape
      address: <hostname:port>
service:
  telemetry:
    logs: 
      level: info
      encoding: json
      disable_stacktrace: true
      initial_fields:
        instance.name: ${env:INSTANCE}
    metrics:
      address: localhost:8888 

References

  1. https://opentelemetry.io/docs/collector/configuration/#service

Final configuration


 1
 2
 3
 4
 5
 6
 7
 8
 9
10
11
12
13
14
15
16
17
18
19
20
21
22
23
24
25
26
27
28
29
30
31
32
33
34
35
36
37
38
39
40
41
42
43
44
45
46
47
48
49
50
51
52
53
54
55
56
57
58
59
60
61
62
63
64
65
66
67
68
69
70
71
72
73
74
75
76
77
78
79
80
81
82
83
84
85
86
87
88
89
90
91
92
extensions:
  health_check:
    endpoint: 0.0.0.0:13133
  pprof:
    endpoint: 0.0.0.0:1777
  zpages:
    endpoint: 0.0.0.0:55679

receivers:
  hostmetrics:
    collection_interval: 10s
    scrapers:
      # CPU utilization metrics
      cpu:
      # Disk I/O metrics
      disk:
      # File System utilization metrics
      filesystem:
      # Memory utilization metrics
      memory:
      # Network interface I/O metrics & TCP connection metrics
      network:
      # CPU load metrics
      load:
      # Paging/Swap space utilization and I/O metrics
      paging:
      # Process count metrics
      processes:
      # Per process CPU, Memory and Disk I/O metrics. Disabled by default.
      # process:
  otlp:
    protocols:
      grpc:
      http:

  opencensus:

  # Collect own metrics
  prometheus/internal:
    config:
      scrape_configs:
      - job_name: 'otel-collector'
        scrape_interval: 10s
        static_configs:
        - targets: ['0.0.0.0:8888']

  jaeger:
    protocols:
      grpc:
      thrift_binary:
      thrift_compact:
      thrift_http:

  zipkin:

processors:
  batch:
  resourcedetection/system:
    detectors: [system]
    system:
      hostname_sources: [os]
  resourcedetection/ec2:
    detectors: [ec2]
  attributes/conf:
    actions:
      - key: participant.name
        action: insert
        value: "INSERT_YOUR_NAME_HERE"

exporters:
  logging:
    verbosity: normal
  otlphttp/splunk:
    metrics_endpoint: https://ingest.${env:REALM}.signalfx.com/v2/datapoint/otlp
    headers:
      X-SF-TOKEN: ${env:ACCESS_TOKEN}

service:

  pipelines:

    traces:
      receivers: [otlp, opencensus, jaeger, zipkin]
      processors: [batch]
      exporters: [logging]

    metrics:
      receivers: [hostmetrics, otlp, opencensus, prometheus/internal]
      processors: [batch, resourcedetection/system, resourcedetection/ec2, attributes/conf] 
      exporters: [logging, otlphttp/splunk]

  extensions: [health_check, pprof, zpages]

Tip

It is recommended that you validate your configuration file before restarting the collector. You can do this by using the built-in validate command:

otelcol-contrib validate --config=file:/etc/otelcol-contrib/config.yaml
Error: failed to get config: cannot unmarshal the configuration: 1 error(s) decoding:

* error decoding 'processors': error reading configuration for "attributes/conf": 1 error(s) decoding:

* 'actions[0]' has invalid keys: actions
2023/06/29 09:41:28 collector server run finished with error: failed to get config: cannot unmarshal the configuration: 1 error(s) decoding:

* error decoding 'processors': error reading configuration for "attributes/conf": 1 error(s) decoding:

* 'actions[0]' has invalid keys: actions

Now that we have a working configuration, let’s start the collector and then check to see what zPages is reporting.

otelcol-contrib --config=file:/etc/otelcol-contrib/config.yaml

pipelinez-full-config pipelinez-full-config

Last Modified Sep 19, 2024

Data Visualisations

Splunk Observability Cloud

Now that we have configured the OpenTelemetry Collector to send metrics to Splunk Observability Cloud, let’s take a look at the data in Splunk Observability Cloud. If you have not received an invite to Splunk Observability Cloud, your instructor will provide you with login credentials.

Before that, let’s make things a little more interesting and run a stress test on the instance. This in turn will light up the dashboards.

sudo apt install stress
while true; do stress -c 2 -t 40; stress -d 5 -t 40; stress -m 20 -t 40; done

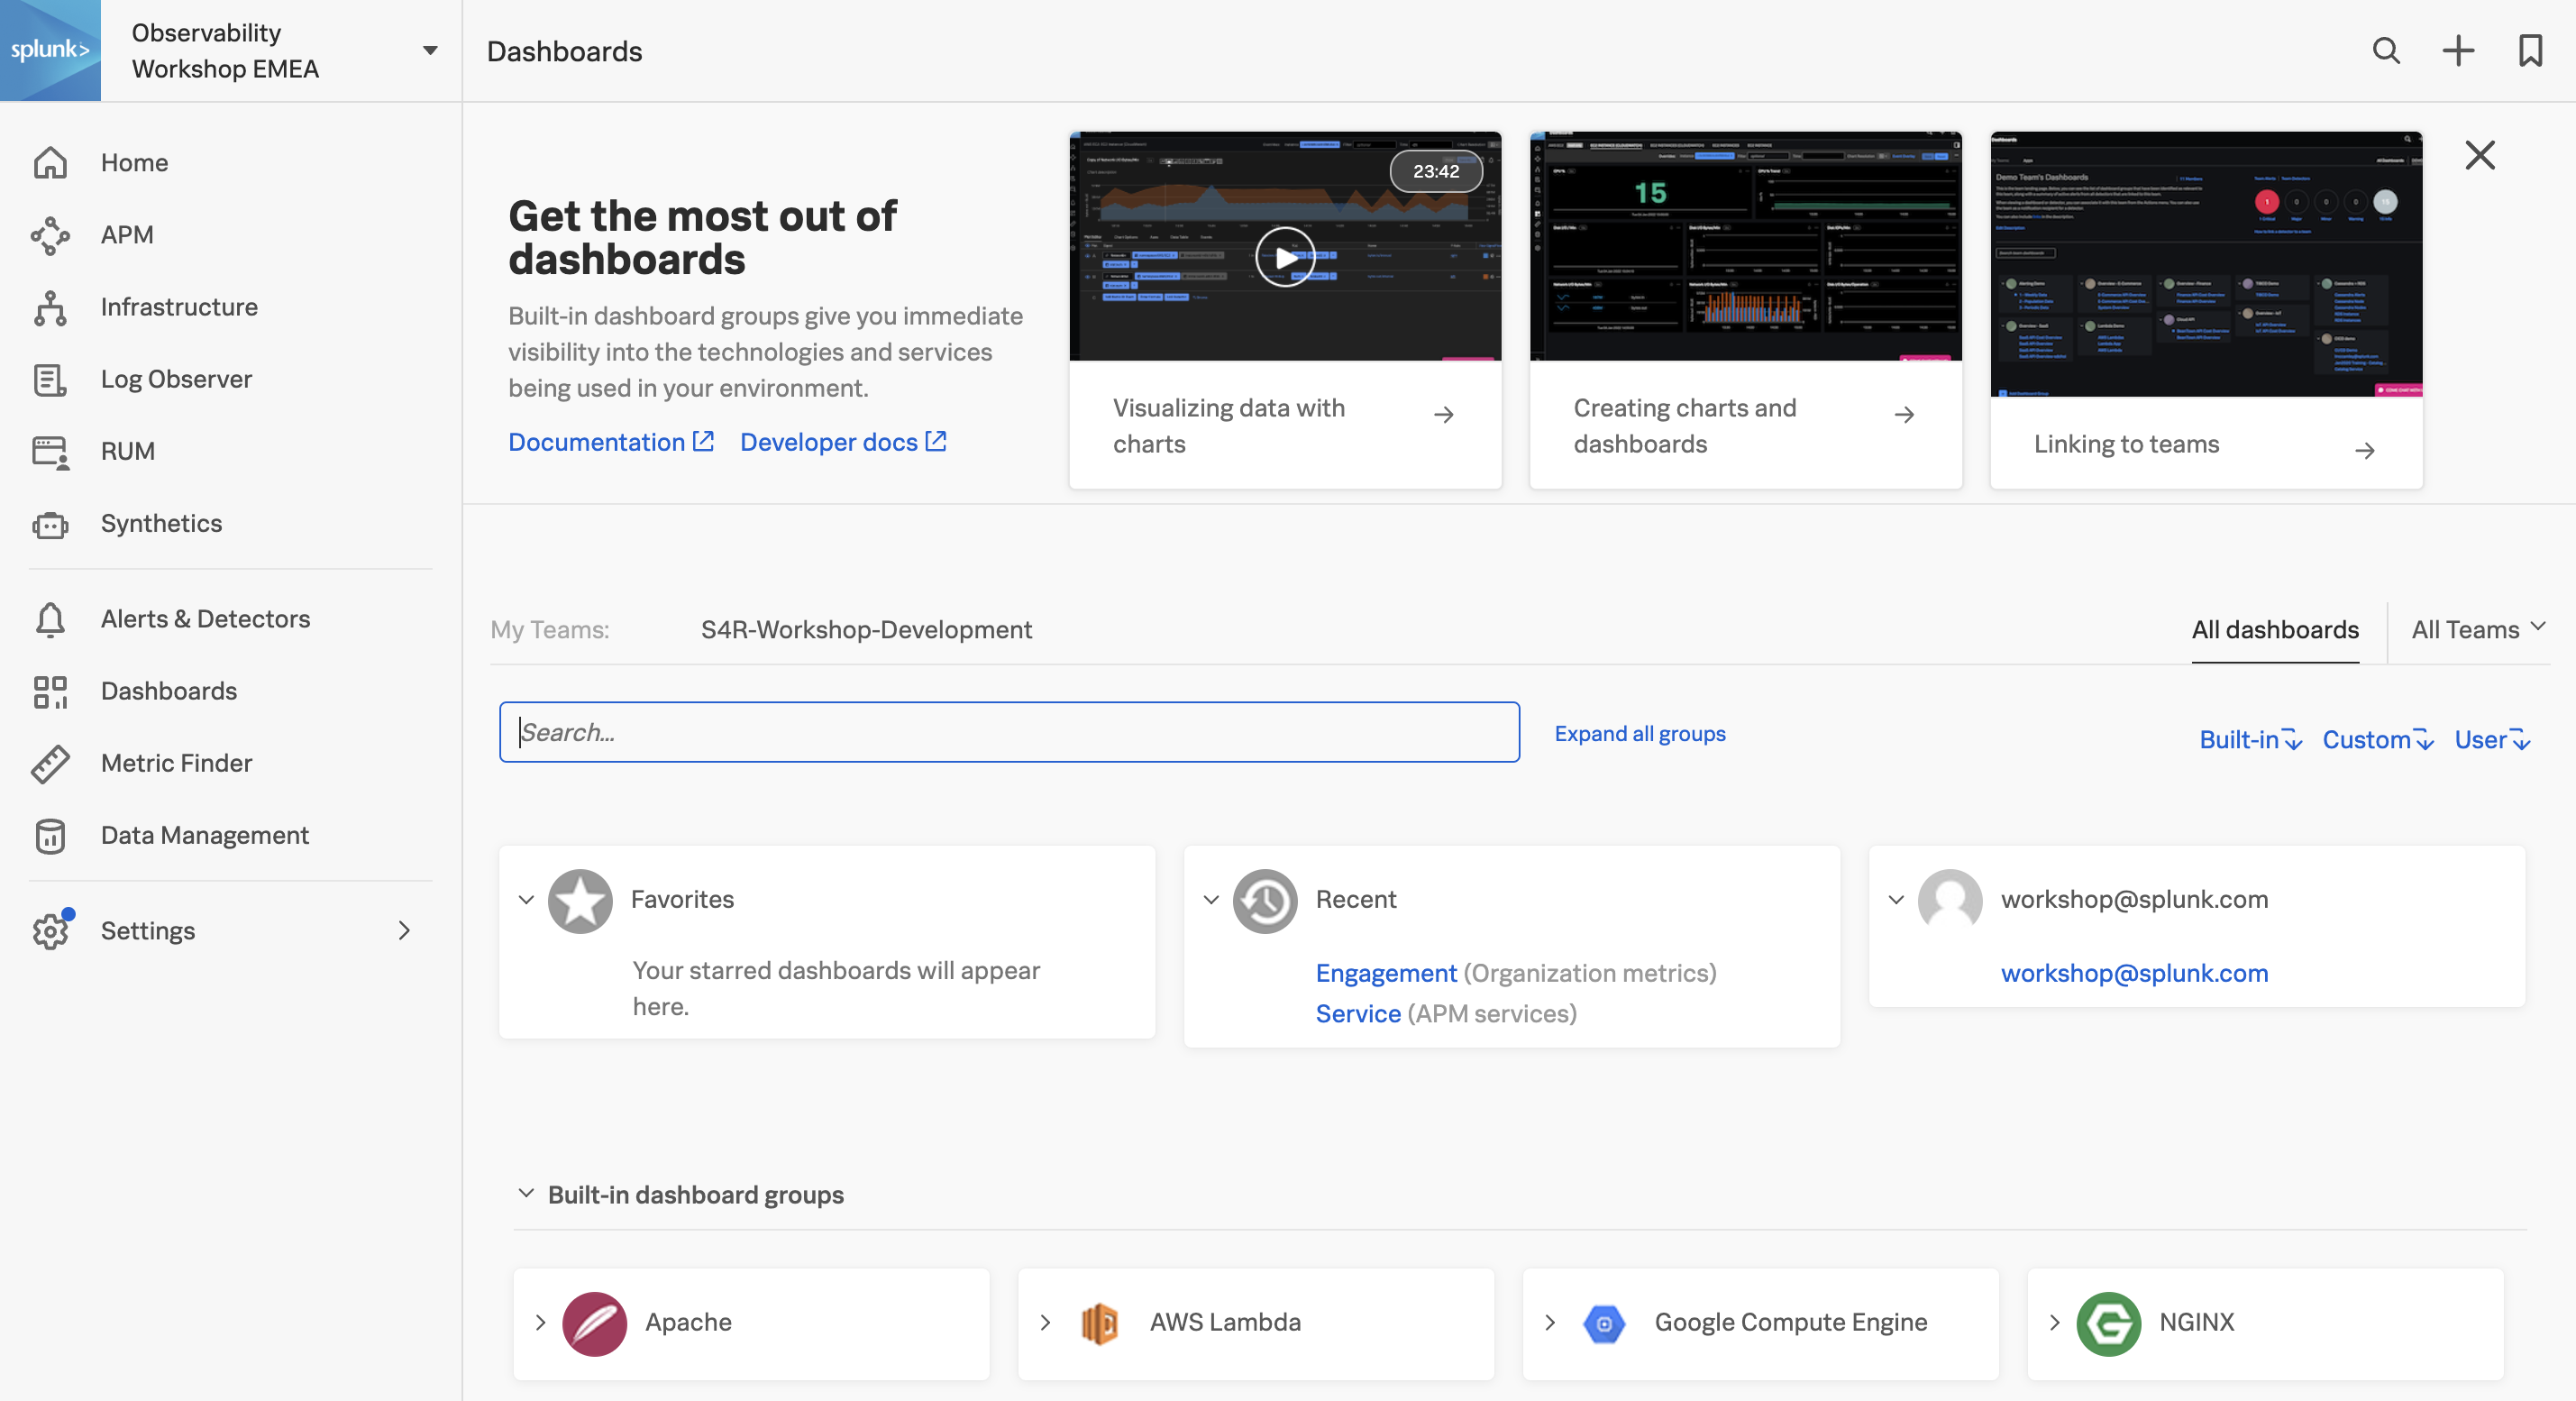
Once you are logged into Splunk Observability Cloud, using the left-hand navigation, navigate to Dashboards from the main menu. This will take you to the Teams view. At the top of this view click on All Dashboards :

menu-dashboards menu-dashboards

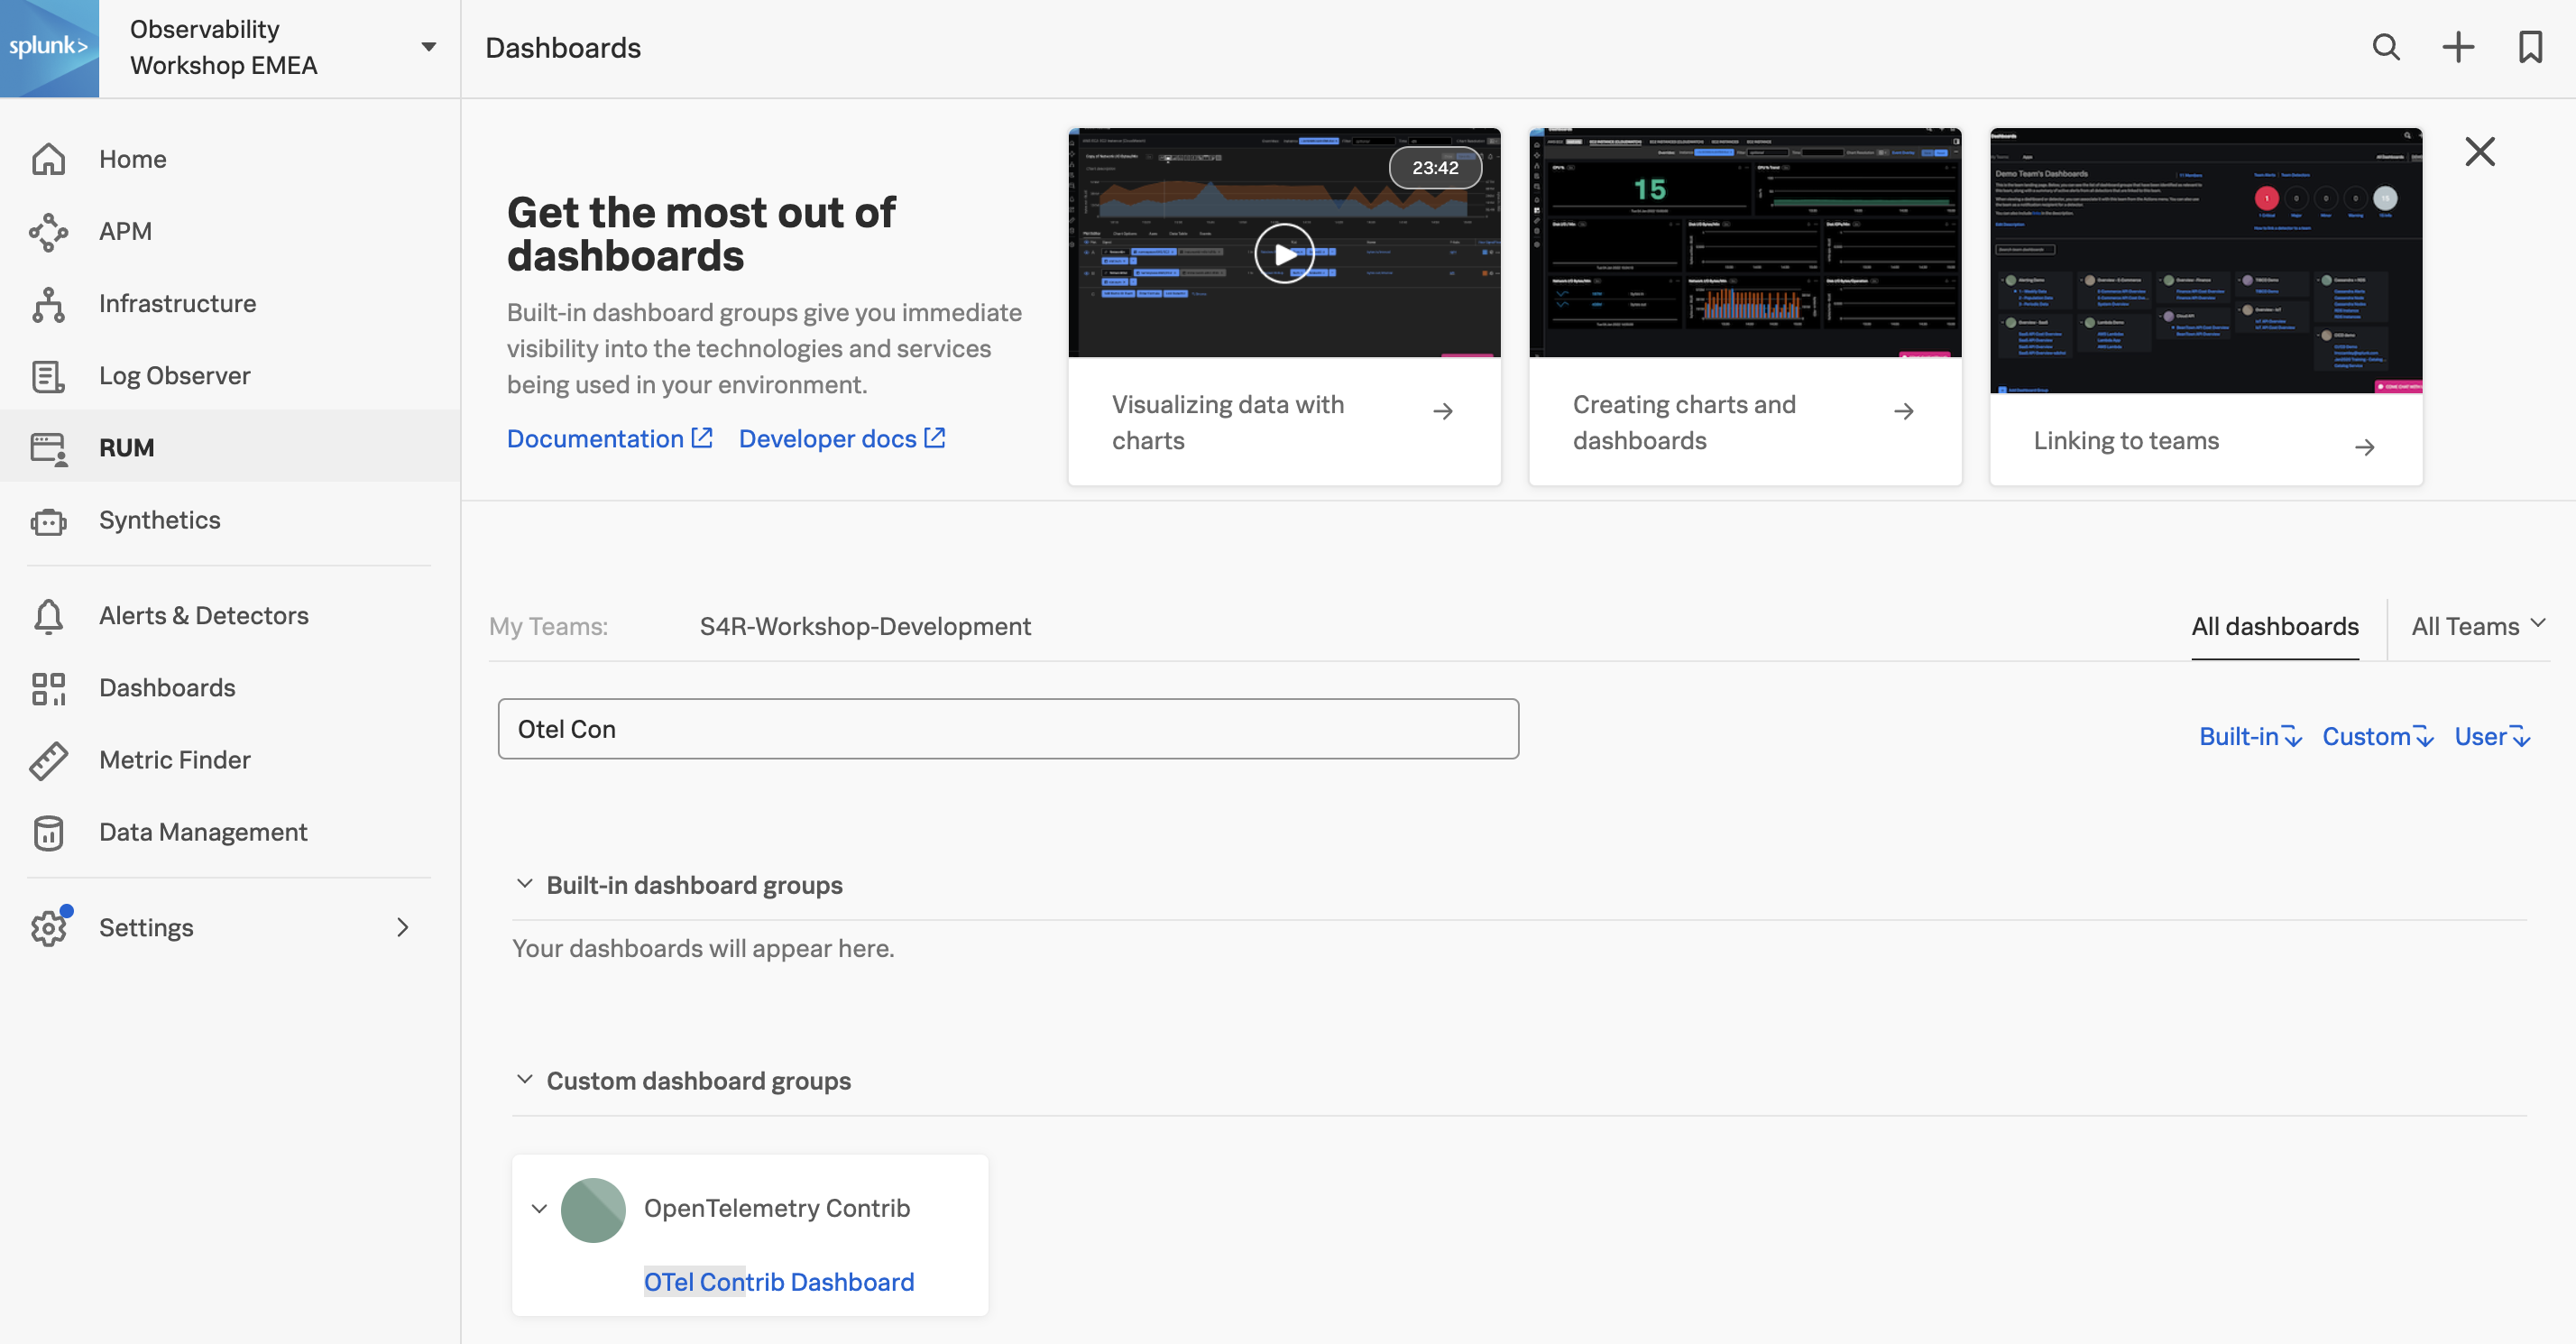
In the search box, search for OTel Contrib:

search-dashboards search-dashboards

Info

If the dashboard does not exist, then your instructor will be able to quickly add it. If you are not attending a Splunk hosted version of this workshop then the Dashboard Group to import can be found at the bottom of this page.

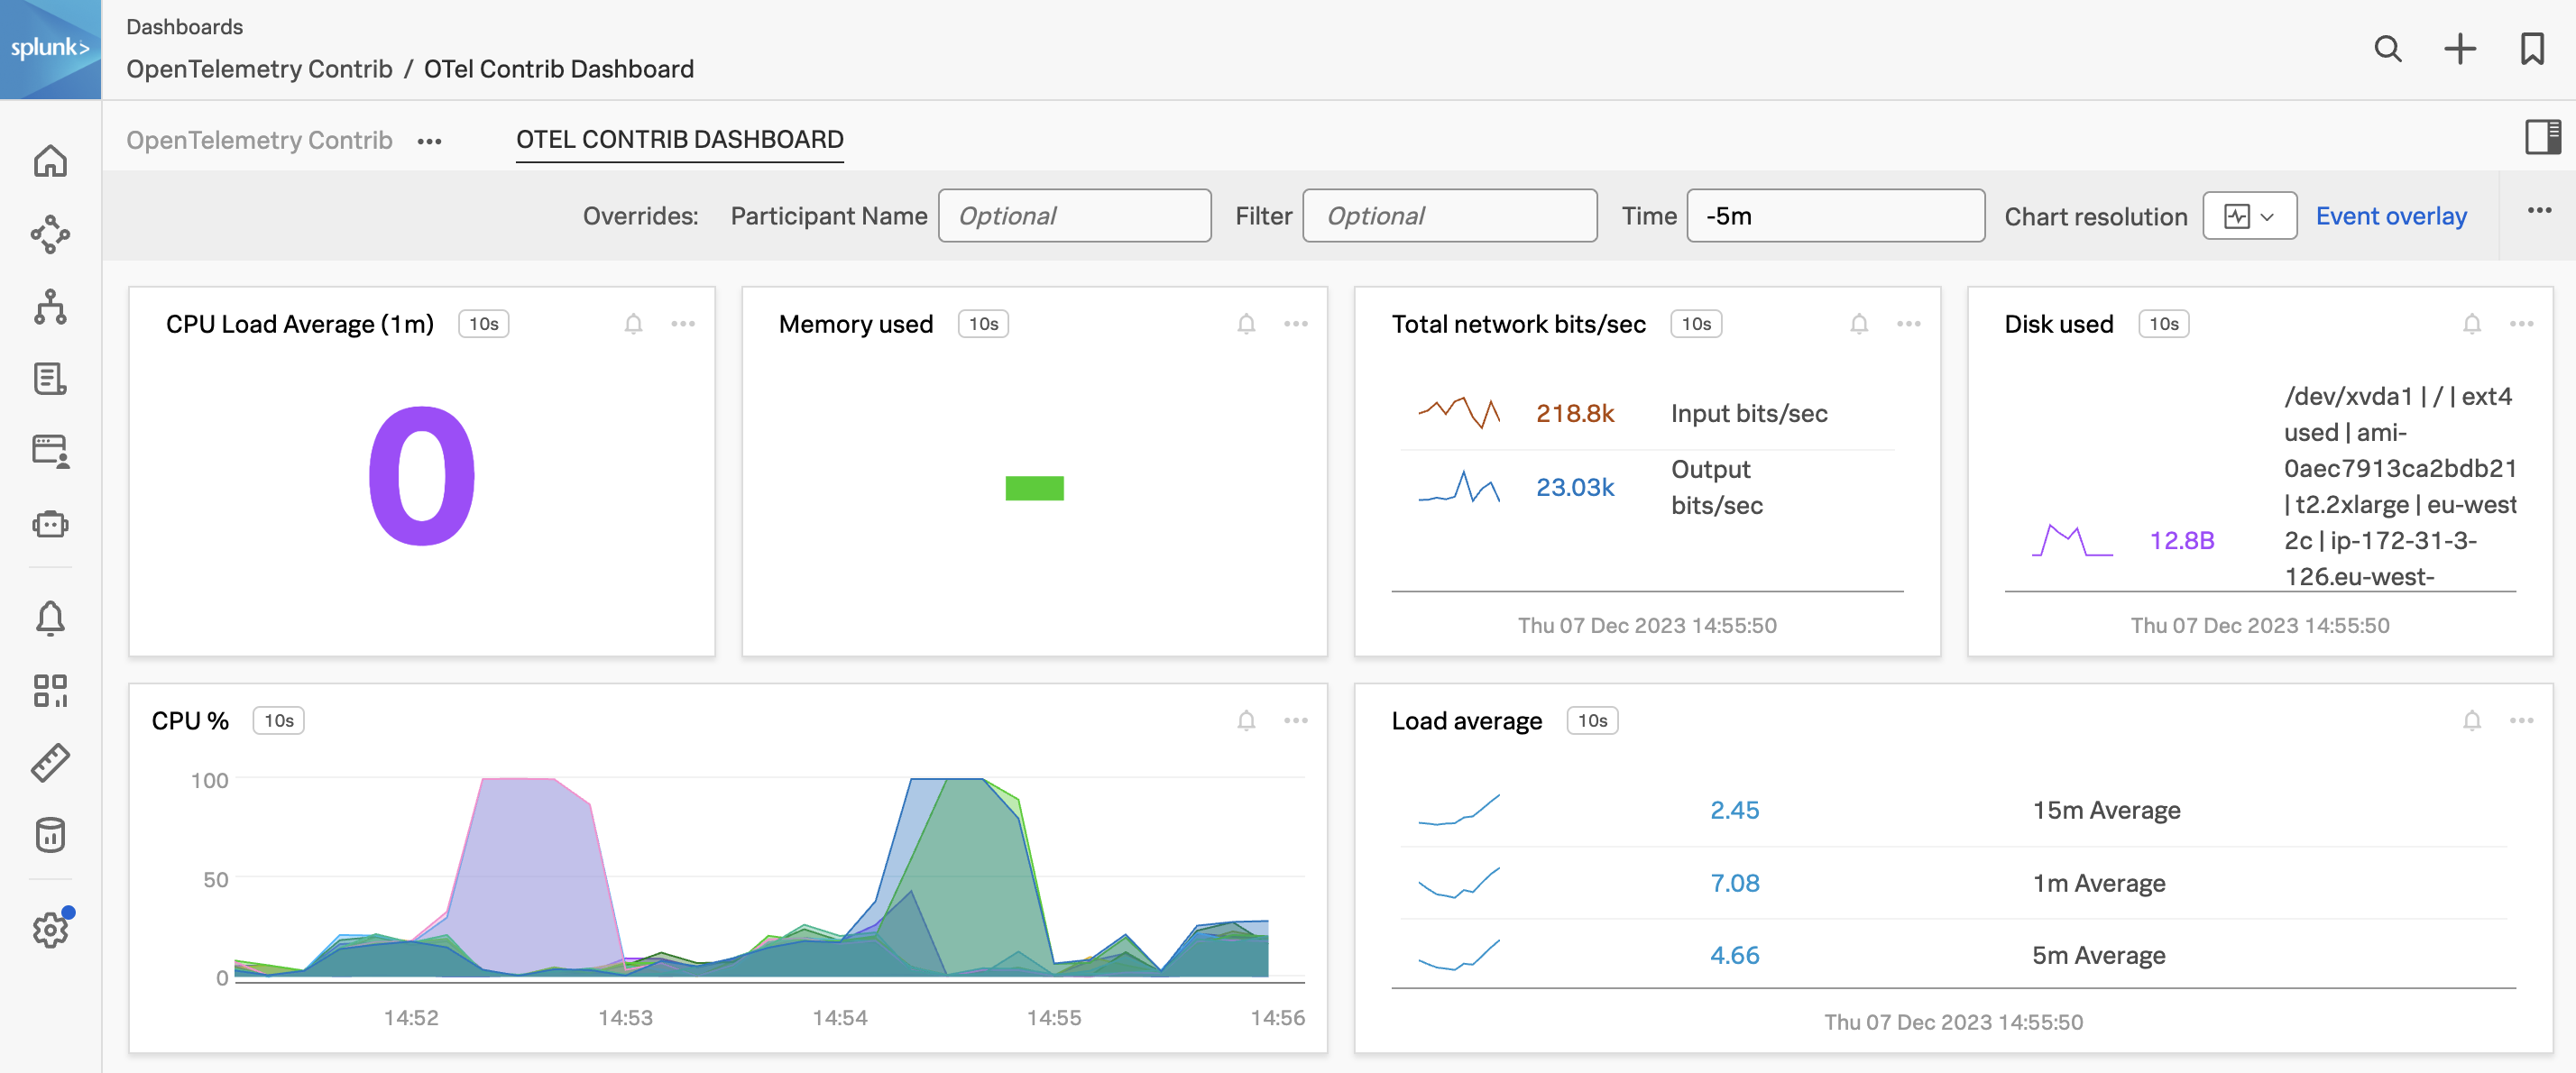
Click on the OTel Contrib Dashboard dashboard to open it:

otel-dashboard otel-dashboard

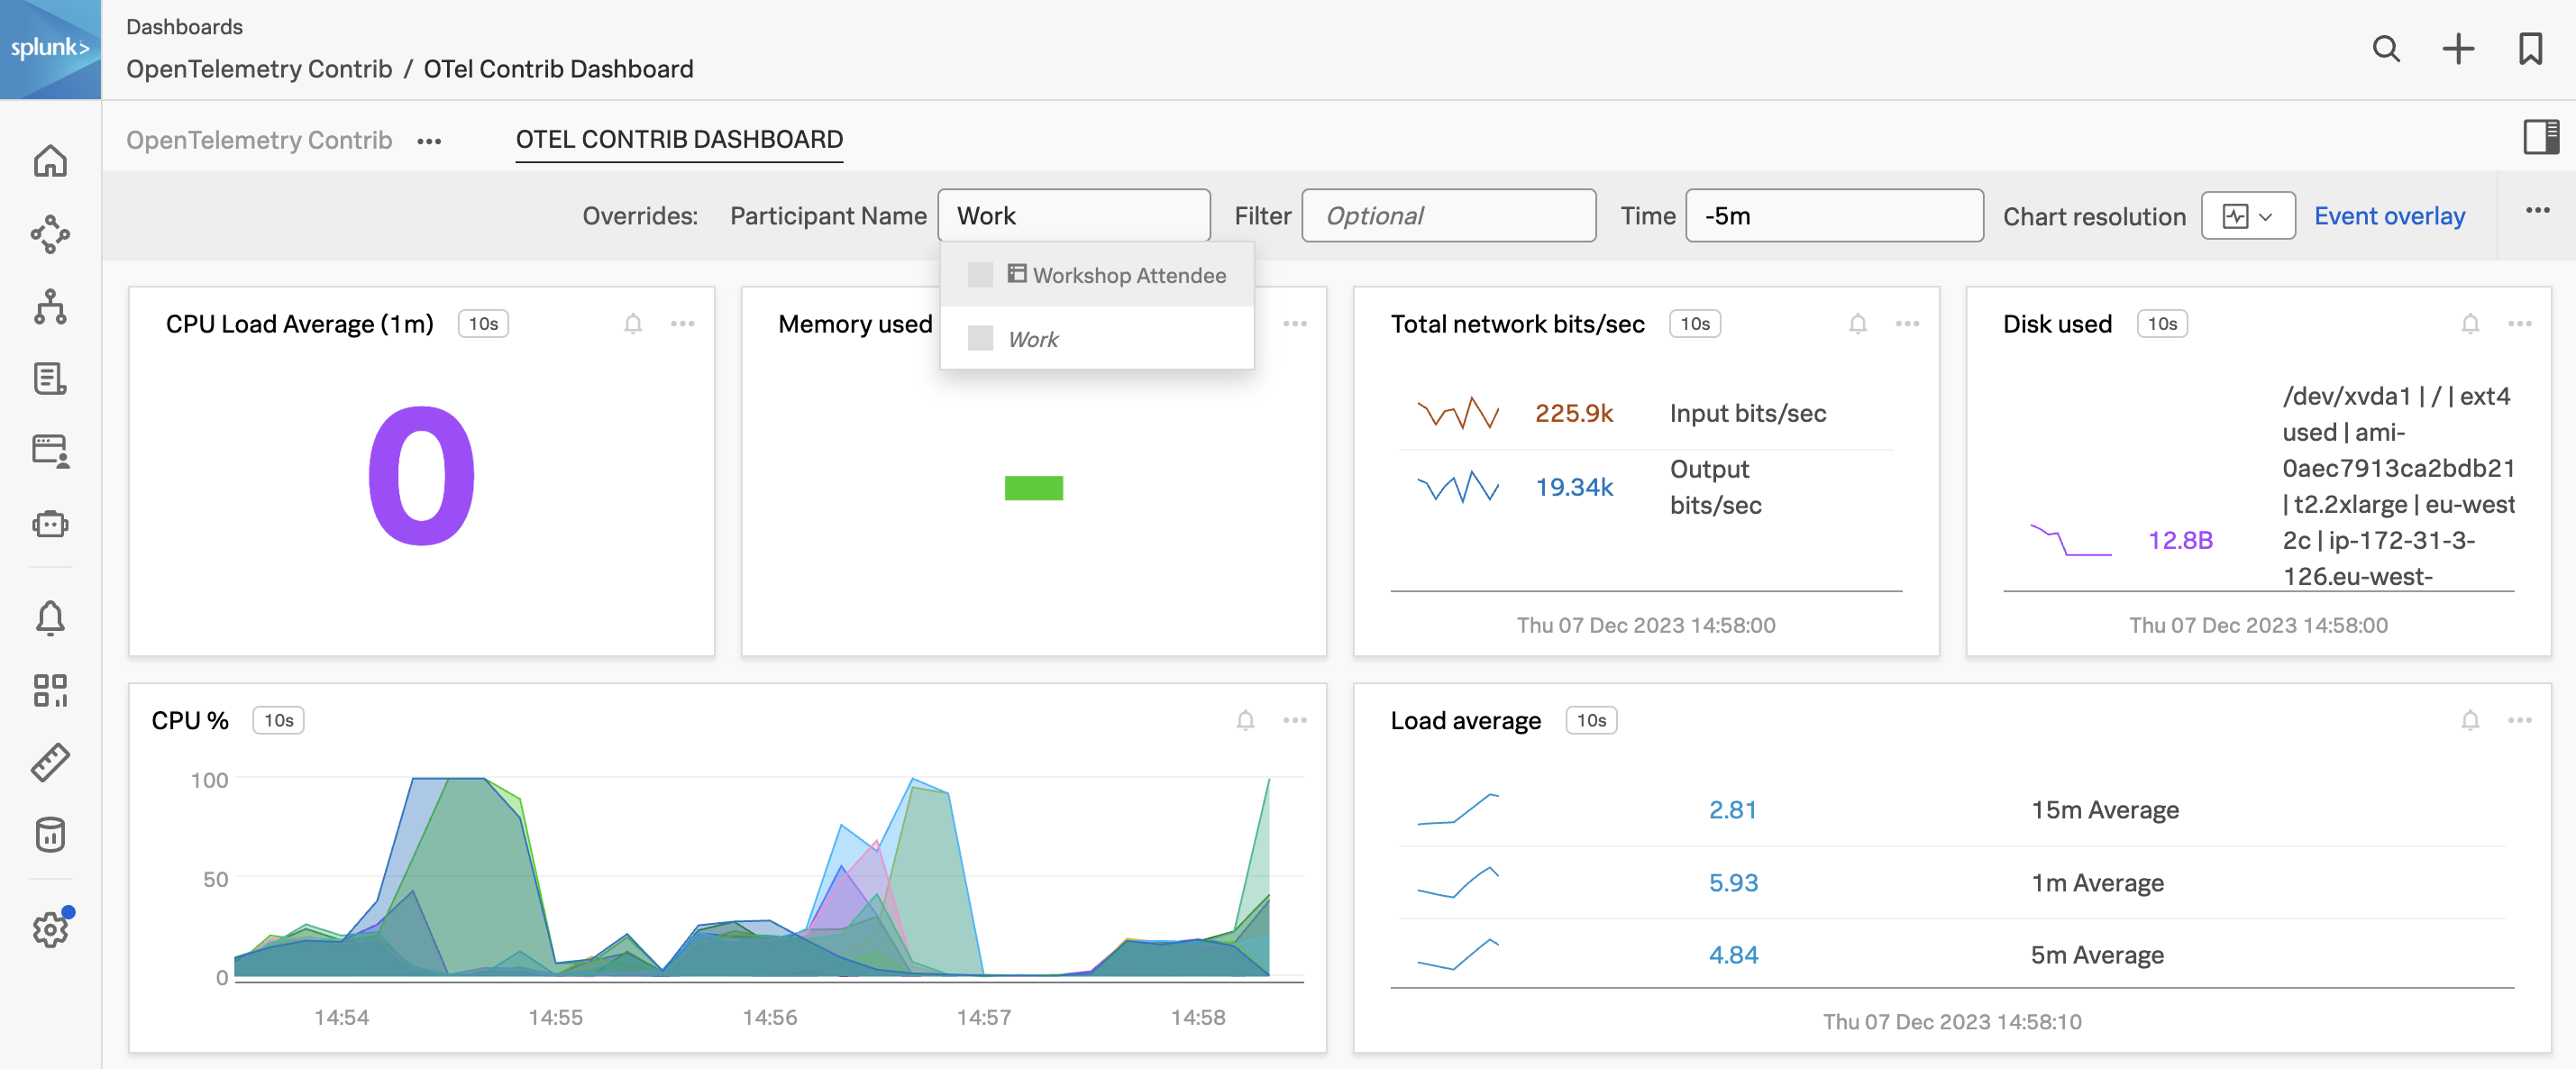
Click in the Participant Name box, at the top of the dashboard, and select the name you configured for participant.name in the config.yaml in the drop-down list or start typing the name to search for it:

select-conf-attendee-name select-conf-attendee-name

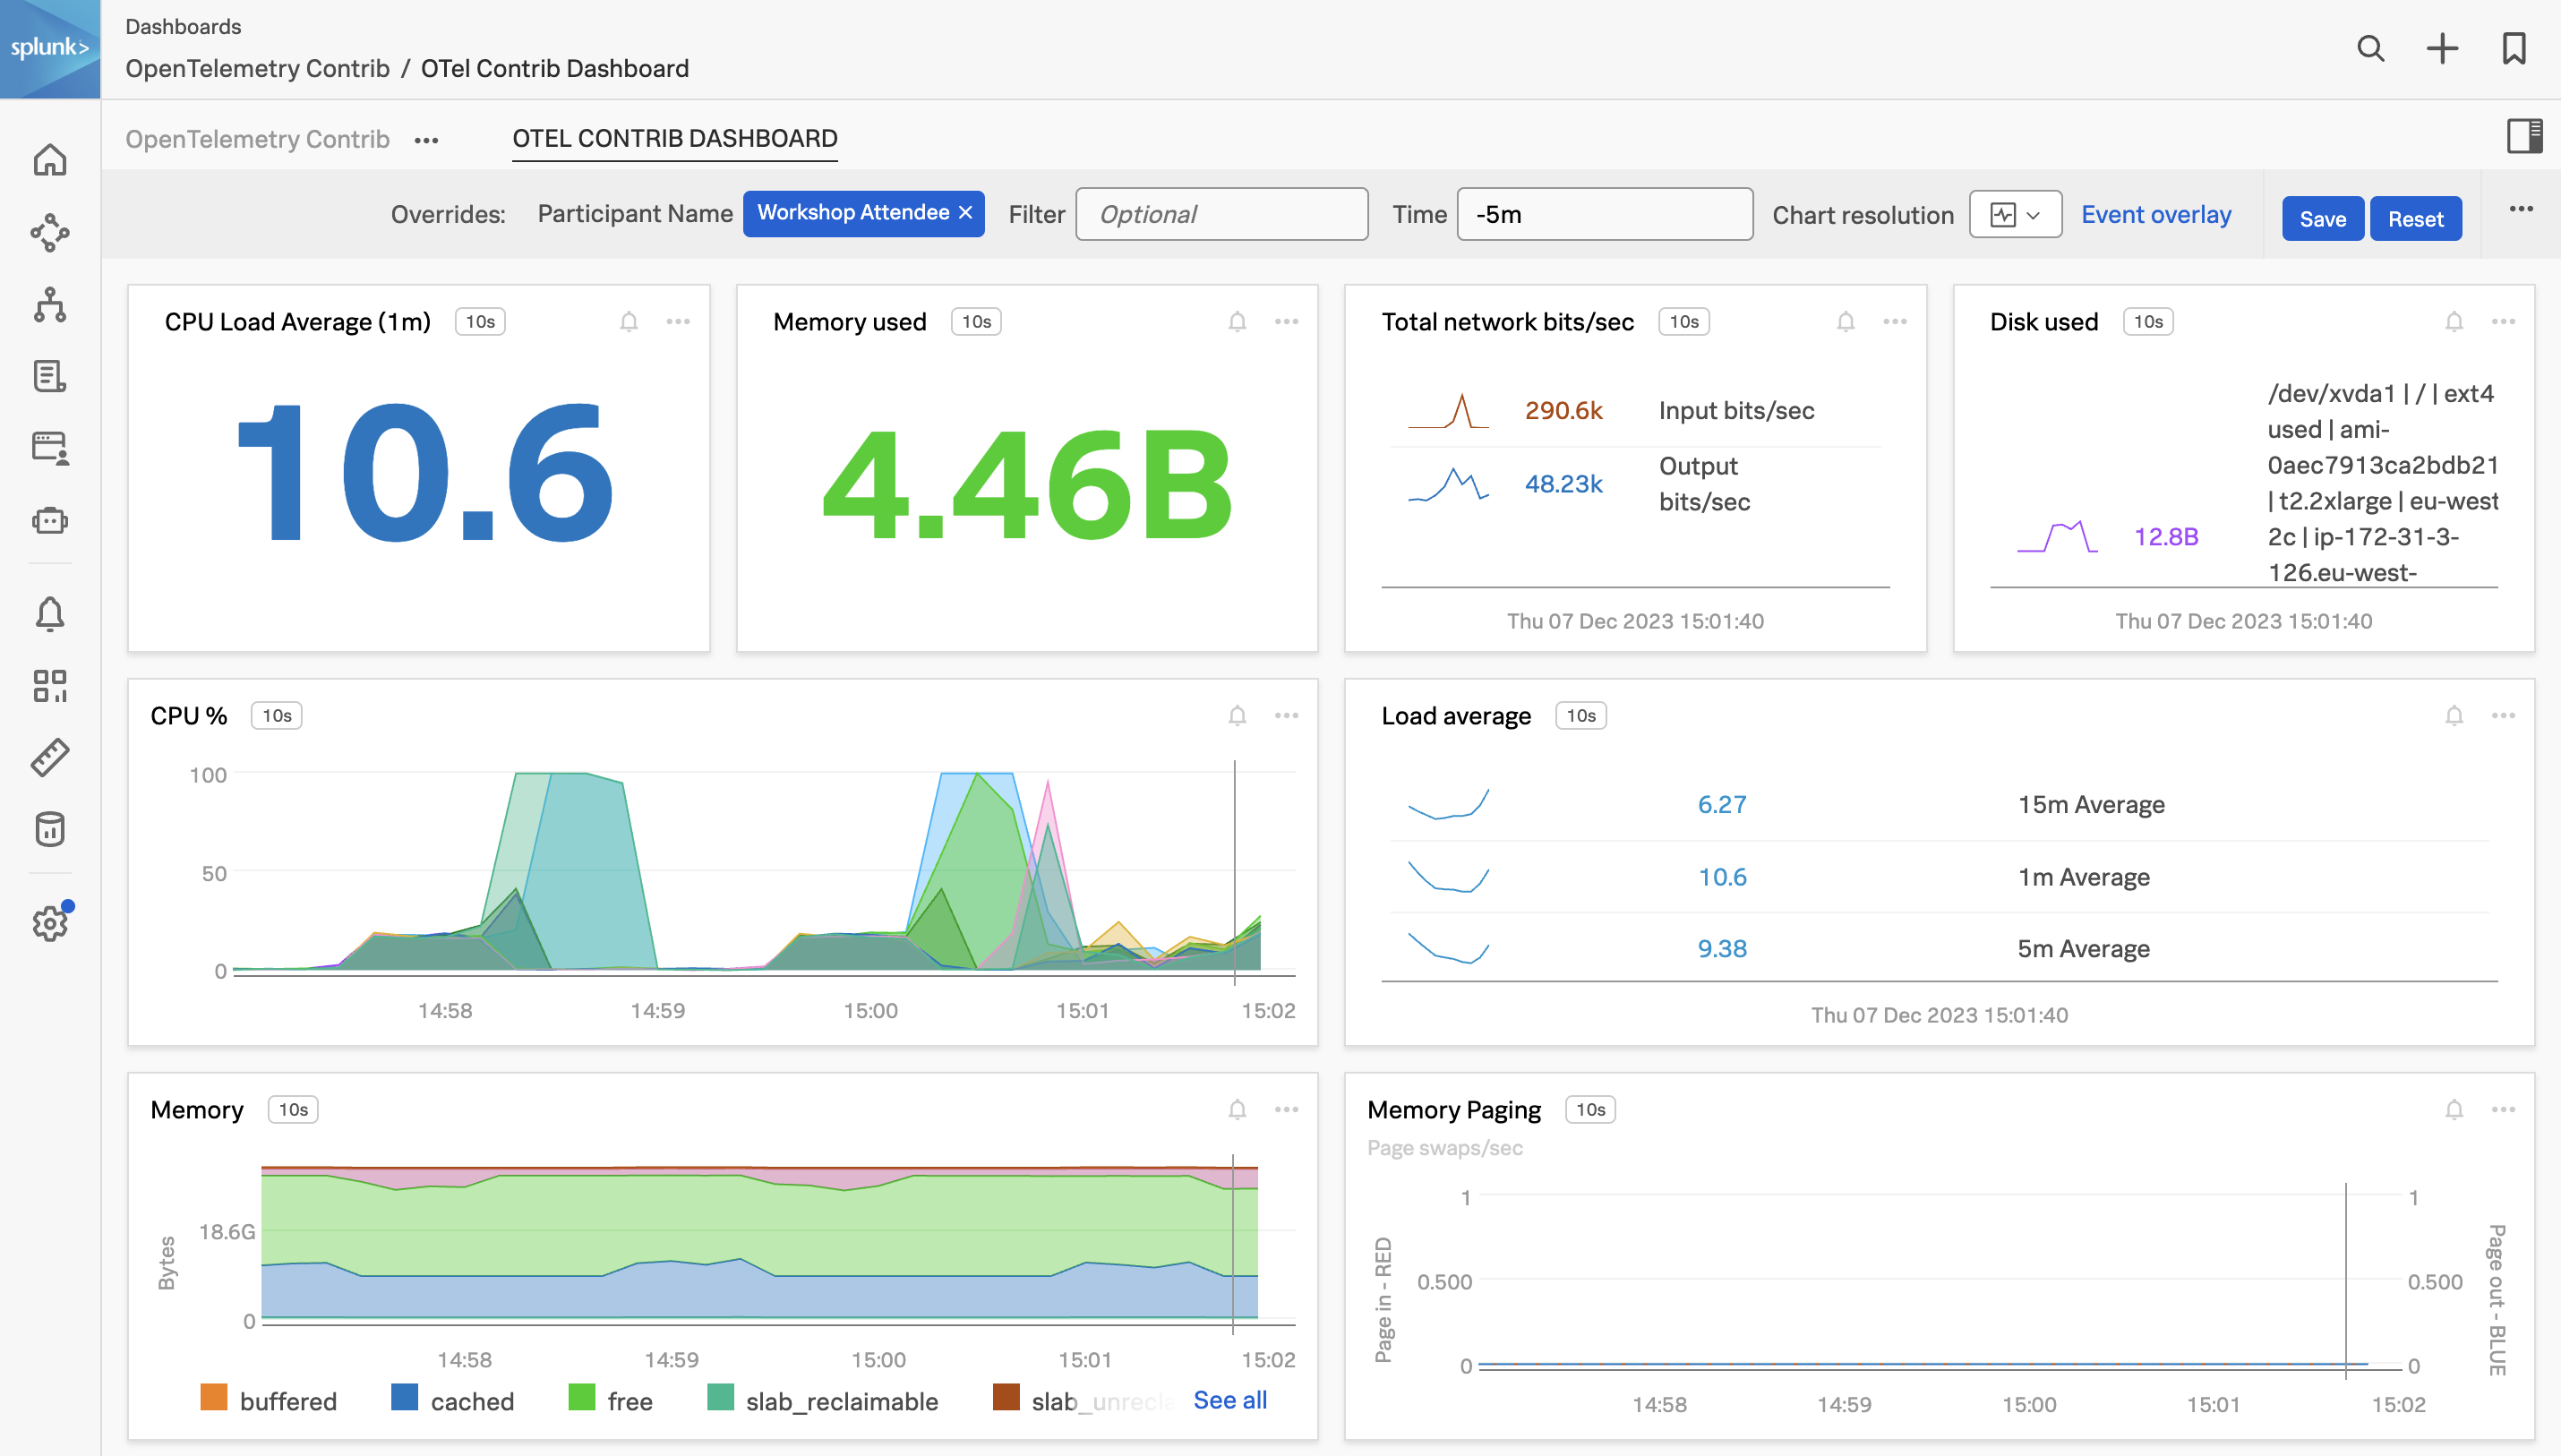
You can now see the host metrics for the host upon which you configured the OpenTelemetry Collector.

participant-dashboard participant-dashboard

Download Dashboard Group JSON for importing
Last Modified Sep 19, 2024

OpenTelemetry Collector Development

Developing a custom component

Building a component for the Open Telemetry Collector requires three key parts:

  1. The Configuration - What values are exposed to the user to configure
  2. The Factory - Make the component using the provided values
  3. The Business Logic - What the component needs to do

For this, we will use the example of building a component that works with Jenkins so that we can track important DevOps metrics of our project(s).

The metrics we are looking to measure are:

  1. Lead time for changes - “How long it takes for a commit to get into production”
  2. Change failure rate - “The percentage of deployments causing a failure in production”
  3. Deployment frequency - “How often a [team] successfully releases to production”
  4. Mean time to recover - “How long does it take for a [team] to recover from a failure in production”

These indicators were identified Google’s DevOps Research and Assesment (DORA)[^1] team to help show performance of a software development team. The reason for choosing Jenkins CI is that we remain in the same Open Source Software ecosystem which we can serve as the example for the vendor managed CI tools to adopt in future.

Instrument Vs Component

There is something to consider when improving level of Observability within your organisation since there are some trade offs that get made.

ProsCons
(Auto) InstrumentedDoes not require an external API to be monitored in order to observe the system.Changing instrumentation requires changes to the project.
Gives system owners/developers to make changes in their observability.Requires additional runtime dependancies.
Understands system context and can corrolate captured data with Exemplars.Can impact performance of the system.
Component- Changes to data names or semantics can be rolled out independently of the system’s release cycle.Breaking API changes require a coordinated release between system and collector.
Updating/extending data collected is a seemless user facing change.Captured data semantics can unexpectedly break that does not align with a new system release.
Does not require the supporting teams to have a deep understanding of observability practice.Strictly external / exposed information can be surfaced from the system.
Last Modified Sep 19, 2024

Subsections of OpenTelemetry Collector Development

OpenTelemetry Collector Development

Project Setup Ninja

Note

The time to finish this section of the workshop can vary depending on experience.

A complete solution can be found here in case you’re stuck or want to follow along with the instructor.

To get started developing the new Jenkins CI receiver, we first need to set up a Golang project. The steps to create your new Golang project is:

  1. Create a new directory named ${HOME}/go/src/jenkinscireceiver and change into it
    1. The actual directory name or location is not strict, you can choose your own development directory to make it in.
  2. Initialize the golang module by going go mod init splunk.conf/workshop/example/jenkinscireceiver
    1. This will create a file named go.mod which is used to track our direct and indirect dependencies
    2. Eventually, there will be a go.sum which is the checksum value of the dependencies being imported.
module splunk.conf/workshop/example/jenkinscireceiver

go 1.20
Last Modified Sep 19, 2024

OpenTelemetry Collector Development

Building The Configuration

The configuration portion of the component is how the user is able to have their inputs over the component, so the values that is used for the configuration need to be:

  1. Intuitive for users to understand what that field controls
  2. Be explicit in what is required and what is optional
  3. Reuse common names and fields
  4. Keep the options simple
---
jenkins_server_addr: hostname
jenkins_server_api_port: 8089
interval: 10m
filter_builds_by:
    - name: my-awesome-build
      status: amber
track:
    values:
        example.metric.1: yes
        example.metric.2: yes
        example.metric.3: no
        example.metric.4: no
---
# Required Values
endpoint: http://my-jenkins-server:8089
auth:
    authenticator: basicauth/jenkins
# Optional Values
collection_interval: 10m
metrics:
    example.metric.1:
        enabled: true
    example.metric.2:
        enabled: true
    example.metric.3:
        enabled: true
    example.metric.4:
        enabled: true

The bad configuration highlights how doing the opposite of the recommendations of configuration practices impacts the usability of the component. It doesn’t make it clear what field values should be, it includes features that can be pushed to existing processors, and the field naming is not consistent with other components that exist in the collector.

The good configuration keeps the required values simple, reuses field names from other components, and ensures the component focuses on just the interaction between Jenkins and the collector.

The code tab shows how much is required to be added by us and what is already provided for us by shared libraries within the collector. These will be explained in more detail once we get to the business logic. The configuration should start off small and will change once the business logic has started to include additional features that is needed.

Write the code

In order to implement the code needed for the configuration, we are going to create a new file named config.go with the following content:

package jenkinscireceiver

import (
    "go.opentelemetry.io/collector/config/confighttp"
    "go.opentelemetry.io/collector/receiver/scraperhelper"

    "splunk.conf/workshop/example/jenkinscireceiver/internal/metadata"
)

type Config struct {
    // HTTPClientSettings contains all the values
    // that are commonly shared across all HTTP interactions
    // performed by the collector.
    confighttp.HTTPClientSettings `mapstructure:",squash"`
    // ScraperControllerSettings will allow us to schedule 
    // how often to check for updates to builds.
    scraperhelper.ScraperControllerSettings `mapstructure:",squash"`
    // MetricsBuilderConfig contains all the metrics
    // that can be configured.
    metadata.MetricsBuilderConfig `mapstructure:",squash"`
}
Last Modified Sep 19, 2024

OpenTelemetry Collector Development

Component Review

To recap the type of component we will need to capture metrics from Jenkins:

The business use case an extension helps solves for are:

  1. Having shared functionality that requires runtime configuration
  2. Indirectly helps with observing the runtime of the collector

See Extensions Overview for more details.

The business use case a receiver solves for:

  • Fetching data from a remote source
  • Receiving data from remote source(s)

This is commonly referred to pull vs push based data collection, and you read more about the details in the Receiver Overview.

The business use case a processor solves for is:

  • Adding or removing data, fields, or values
  • Observing and making decisions on the data
  • Buffering, queueing, and reordering

The thing to keep in mind is the data type flowing through a processor needs to forward the same data type to its downstream components. Read through Processor Overview for the details.

The business use case an exporter solves for:

  • Send the data to a tool, service, or storage

The OpenTelemetry collector does not want to be “backend”, an all-in-one observability suite, but rather keep to the principles that founded OpenTelemetry to begin with; A vendor agnostic Observability for all. To help revisit the details, please read through Exporter Overview.

This is a component type that was missed in the workshop since it is a relatively new addition to the collector, but the best way to think about a connector is that it is like a processor that allows it to be used across different telemetry types and pipelines. Meaning that a connector can accept data as logs, and output metrics, or accept metrics from one pipeline and provide metrics on the data it has observed.

The business case that a connector solves for:

  • Converting from different telemetry types
    • logs to metrics
    • traces to metrics
    • metrics to logs
  • Observing incoming data and producing its own data
    • Accepting metrics and generating analytical metrics of the data.

There was a brief overview within the Ninja section as part of the Processor Overview, and be sure what the project for updates for new connector components.

From the component overviews, it is clear that developing a pull-based receiver for Jenkins.

Last Modified Sep 19, 2024

OpenTelemetry Collector Development

Designing The Metrics

To help define and export the metrics captured by our receiver, we will be using, mdatagen, a tool developed for the collector that turns YAML defined metrics into code.

---
# Type defines the name to reference the component
# in the configuration file
type: jenkins

# Status defines the component type and the stability level
status:
  class: receiver
  stability:
    development: [metrics]

# Attributes are the expected fields reported
# with the exported values.
attributes:
  job.name:
    description: The name of the associated Jenkins job
    type: string
  job.status:
    description: Shows if the job had passed, or failed
    type: string
    enum:
    - failed
    - success
    - unknown

# Metrics defines all the pontentially exported values from this receiver. 
metrics:
  jenkins.jobs.count:
    enabled: true
    description: Provides a count of the total number of configured jobs
    unit: "{Count}"
    gauge:
      value_type: int
  jenkins.job.duration:
    enabled: true
    description: Show the duration of the job
    unit: "s"
    gauge:
      value_type: int
    attributes:
    - job.name
    - job.status
  jenkins.job.commit_delta:
    enabled: true
    description: The calculation difference of the time job was finished minus commit timestamp
    unit: "s"
    gauge:
      value_type: int
    attributes:
    - job.name
    - job.status
// To generate the additional code needed to capture metrics, 
// the following command to be run from the shell:
//  go generate -x ./...

//go:generate go run github.com/open-telemetry/opentelemetry-collector-contrib/cmd/mdatagen@v0.80.0 metadata.yaml
package jenkinscireceiver

// There is no code defined within this file.

Create these files within the project folder before continuing onto the next section.

Building The Factory

The Factory is a software design pattern that effectively allows for an object, in this case a jenkinscireceiver, to be created dynamically with the provided configuration. To use a more real-world example, it would be going to a phone store, asking for a phone that matches your exact description, and then providing it to you.

Run the following command go generate -x ./... , it will create a new folder, jenkinscireceiver/internal/metadata, that contains all code required to export the defined metrics. The required code is:

package jenkinscireceiver

import (
    "errors"

    "go.opentelemetry.io/collector/component"
    "go.opentelemetry.io/collector/config/confighttp"
    "go.opentelemetry.io/collector/receiver"
    "go.opentelemetry.io/collector/receiver/scraperhelper"

    "splunk.conf/workshop/example/jenkinscireceiver/internal/metadata"
)

func NewFactory() receiver.Factory {
    return receiver.NewFactory(
        metadata.Type,
        newDefaultConfig,
        receiver.WithMetrics(newMetricsReceiver, metadata.MetricsStability),
    )
}

func newMetricsReceiver(_ context.Context, set receiver.CreateSettings, cfg component.Config, consumer consumer.Metrics) (receiver.Metrics, error) {
    // Convert the configuration into the expected type
    conf, ok := cfg.(*Config)
    if !ok {
        return nil, errors.New("can not convert config")
    }
    sc, err := newScraper(conf, set)
    if err != nil {
        return nil, err
    }
    return scraperhelper.NewScraperControllerReceiver(
        &conf.ScraperControllerSettings,
        set,
        consumer,
        scraperhelper.AddScraper(sc),
    )
}
package jenkinscireceiver

import (
    "go.opentelemetry.io/collector/config/confighttp"
    "go.opentelemetry.io/collector/receiver/scraperhelper"

    "splunk.conf/workshop/example/jenkinscireceiver/internal/metadata"
)

type Config struct {
    // HTTPClientSettings contains all the values
    // that are commonly shared across all HTTP interactions
    // performed by the collector.
    confighttp.HTTPClientSettings `mapstructure:",squash"`
    // ScraperControllerSettings will allow us to schedule 
    // how often to check for updates to builds.
    scraperhelper.ScraperControllerSettings `mapstructure:",squash"`
    // MetricsBuilderConfig contains all the metrics
    // that can be configured.
    metadata.MetricsBuilderConfig `mapstructure:",squash"`
}

func newDefaultConfig() component.Config {
    return &Config{
        ScraperControllerSettings: scraperhelper.NewDefaultScraperControllerSettings(metadata.Type),
        HTTPClientSettings:        confighttp.NewDefaultHTTPClientSettings(),
        MetricsBuilderConfig:      metadata.DefaultMetricsBuilderConfig(),
    }
}
package jenkinscireceiver

type scraper struct {}

func newScraper(cfg *Config, set receiver.CreateSettings) (scraperhelper.Scraper, error) {
    // Create a our scraper with our values 
    s := scraper{
        // To be filled in later
    }
    return scraperhelper.NewScraper(metadata.Type, s.scrape)
}

func (scraper) scrape(ctx context.Context) (pmetric.Metrics, error) {
    // To be filled in
    return pmetrics.NewMetrics(), nil
}
---
dist:
  name: otelcol
  description: "Conf workshop collector"
  output_path: ./dist
  version: v0.0.0-experimental

extensions:
  - gomod: github.com/open-telemetry/opentelemetry-collector-contrib/extension/basicauthextension v0.80.0
  - gomod: github.com/open-telemetry/opentelemetry-collector-contrib/extension/healthcheckextension v0.80.0

receivers:
  - gomod: go.opentelemetry.io/collector/receiver/otlpreceiver v0.80.0
  - gomod: github.com/open-telemetry/opentelemetry-collector-contrib/receiver/jaegerreceiver v0.80.0
  - gomod: github.com/open-telemetry/opentelemetry-collector-contrib/receiver/prometheusreceiver v0.80.0
  - gomod: splunk.conf/workshop/example/jenkinscireceiver v0.0.0
    path: ./jenkinscireceiver

processors:
  - gomod: go.opentelemetry.io/collector/processor/batchprocessor v0.80.0

exporters:
  - gomod: go.opentelemetry.io/collector/exporter/loggingexporter v0.80.0
  - gomod: go.opentelemetry.io/collector/exporter/otlpexporter v0.80.0
  - gomod: go.opentelemetry.io/collector/exporter/otlphttpexporter v0.80.0

# This replace is a go directive that allows for redefine
# where to fetch the code to use since the default would be from a remote project.
replaces:
- splunk.conf/workshop/example/jenkinscireceiver => ./jenkinscireceiver
├── build-config.yaml
└── jenkinscireceiver
    ├── go.mod
    ├── config.go
    ├── factory.go
    ├── scraper.go
    └── internal
      └── metadata

Once you have written these files into the project with the expected contents run, go mod tidy, which will fetch all the remote dependencies and update go.mod and generate the go.sum files.

Last Modified Sep 19, 2024

OpenTelemetry Collector Development

Building The Business Logic

At this point, we have a custom component that currently does nothing so we need to add in the required logic to capture this data from Jenkins.

From this point, the steps that we need to take are:

  1. Create a client that connect to Jenkins
  2. Capture all the configured jobs
  3. Report the status of the last build for the configured job
  4. Calculate the time difference between commit timestamp and job completion.

The changes will be made to scraper.go.

To be able to connect to the Jenkins server, we will be using the package, “github.com/yosida95/golang-jenkins”, which provides the functionality required to read data from the jenkins server.

Then we are going to utilise some of the helper functions from the, “go.opentelemetry.io/collector/receiver/scraperhelper” , library to create a start function so that we can connect to the Jenkins server once component has finished starting.

package jenkinscireceiver

import (
    "context"

    jenkins "github.com/yosida95/golang-jenkins"
    "go.opentelemetry.io/collector/component"
    "go.opentelemetry.io/collector/pdata/pmetric"
    "go.opentelemetry.io/collector/receiver"
    "go.opentelemetry.io/collector/receiver/scraperhelper"

    "splunk.conf/workshop/example/jenkinscireceiver/internal/metadata"
)

type scraper struct {
    mb     *metadata.MetricsBuilder
    client *jenkins.Jenkins
}

func newScraper(cfg *Config, set receiver.CreateSettings) (scraperhelper.Scraper, error) {
    s := &scraper{
        mb : metadata.NewMetricsBuilder(cfg.MetricsBuilderConfig, set),
    }
    
    return scraperhelper.NewScraper(
        metadata.Type,
        s.scrape,
        scraperhelper.WithStart(func(ctx context.Context, h component.Host) error {
            client, err := cfg.ToClient(h, set.TelemetrySettings)
            if err != nil {
                return err
            }
            // The collector provides a means of injecting authentication
            // on our behalf, so this will ignore the libraries approach
            // and use the configured http client with authentication.
            s.client = jenkins.NewJenkins(nil, cfg.Endpoint)
            s.client.SetHTTPClient(client)
            return nil
        }),
    )
}

func (s scraper) scrape(ctx context.Context) (pmetric.Metrics, error) {
    // To be filled in
    return pmetric.NewMetrics(), nil
}

This finishes all the setup code that is required in order to initialise a Jenkins receiver.

From this point on, we will be focuses on the scrape method that has been waiting to be filled in. This method will be run on each interval that is configured within the configuration (by default, every minute).

The reason we want to capture the number of jobs configured so we can see the growth of our Jenkins server, and measure of many projects have onboarded. To do this we will call the jenkins client to list all jobs, and if it reports an error, return that with no metrics, otherwise, emit the data from the metric builder.

func (s scraper) scrape(ctx context.Context) (pmetric.Metrics, error) {
    jobs, err := s.client.GetJobs()
    if err != nil {
        return pmetric.Metrics{}, err
    }

    // Recording the timestamp to ensure
    // all captured data points within this scrape have the same value. 
    now := pcommon.NewTimestampFromTime(time.Now())
    
    // Casting to an int64 to match the expected type
    s.mb.RecordJenkinsJobsCountDataPoint(now, int64(len(jobs)))
    
    // To be filled in

    return s.mb.Emit(), nil
}

In the last step, we were able to capture all jobs ands report the number of jobs there was. Within this step, we are going to examine each job and use the report values to capture metrics.

func (s scraper) scrape(ctx context.Context) (pmetric.Metrics, error) {
    jobs, err := s.client.GetJobs()
    if err != nil {
        return pmetric.Metrics{}, err
    }

    // Recording the timestamp to ensure
    // all captured data points within this scrape have the same value. 
    now := pcommon.NewTimestampFromTime(time.Now())
    
    // Casting to an int64 to match the expected type
    s.mb.RecordJenkinsJobsCountDataPoint(now, int64(len(jobs)))
    
    for _, job := range jobs {
        // Ensure we have valid results to start off with
        var (
            build  = job.LastCompletedBuild
            status = metadata.AttributeJobStatusUnknown
        )

        // This will check the result of the job, however,
        // since the only defined attributes are 
        // `success`, `failure`, and `unknown`. 
        // it is assume that anything did not finish 
        // with a success or failure to be an unknown status.

        switch build.Result {
        case "aborted", "not_built", "unstable":
            status = metadata.AttributeJobStatusUnknown
        case "success":
            status = metadata.AttributeJobStatusSuccess
        case "failure":
            status = metadata.AttributeJobStatusFailed
        }

        s.mb.RecordJenkinsJobDurationDataPoint(
            now,
            int64(job.LastCompletedBuild.Duration),
            job.Name,
            status,
        )
    }

    return s.mb.Emit(), nil
}

The final step is to calculate how long it took from commit to job completion to help infer our DORA metrics.

func (s scraper) scrape(ctx context.Context) (pmetric.Metrics, error) {
    jobs, err := s.client.GetJobs()
    if err != nil {
        return pmetric.Metrics{}, err
    }

    // Recording the timestamp to ensure
    // all captured data points within this scrape have the same value. 
    now := pcommon.NewTimestampFromTime(time.Now())
    
    // Casting to an int64 to match the expected type
    s.mb.RecordJenkinsJobsCountDataPoint(now, int64(len(jobs)))
    
    for _, job := range jobs {
        // Ensure we have valid results to start off with
        var (
            build  = job.LastCompletedBuild
            status = metadata.AttributeJobStatusUnknown
        )

        // Previous step here

        // Ensure that the `ChangeSet` has values
        // set so there is a valid value for us to reference
        if len(build.ChangeSet.Items) == 0 {
            continue
        }

        // Making the assumption that the first changeset
        // item is the most recent change.
        change := build.ChangeSet.Items[0]

        // Record the difference from the build time
        // compared against the change timestamp.
        s.mb.RecordJenkinsJobCommitDeltaDataPoint(
            now,
            int64(build.Timestamp-change.Timestamp),
            job.Name,
            status,
        )
    }

    return s.mb.Emit(), nil
}

Once all of these steps have been completed, you now have built a custom Jenkins CI receiver!

Whats next?

There are more than likely features that would be desired from component that you can think of, like:

  • Can I include the branch name that the job used?
  • Can I include the project name for the job?
  • How I calculate the collective job durations for project?
  • How do I validate the changes work?

Please take this time to play around, break it, change things around, or even try to capture logs from the builds.