1. Real Browser Test

Introduction

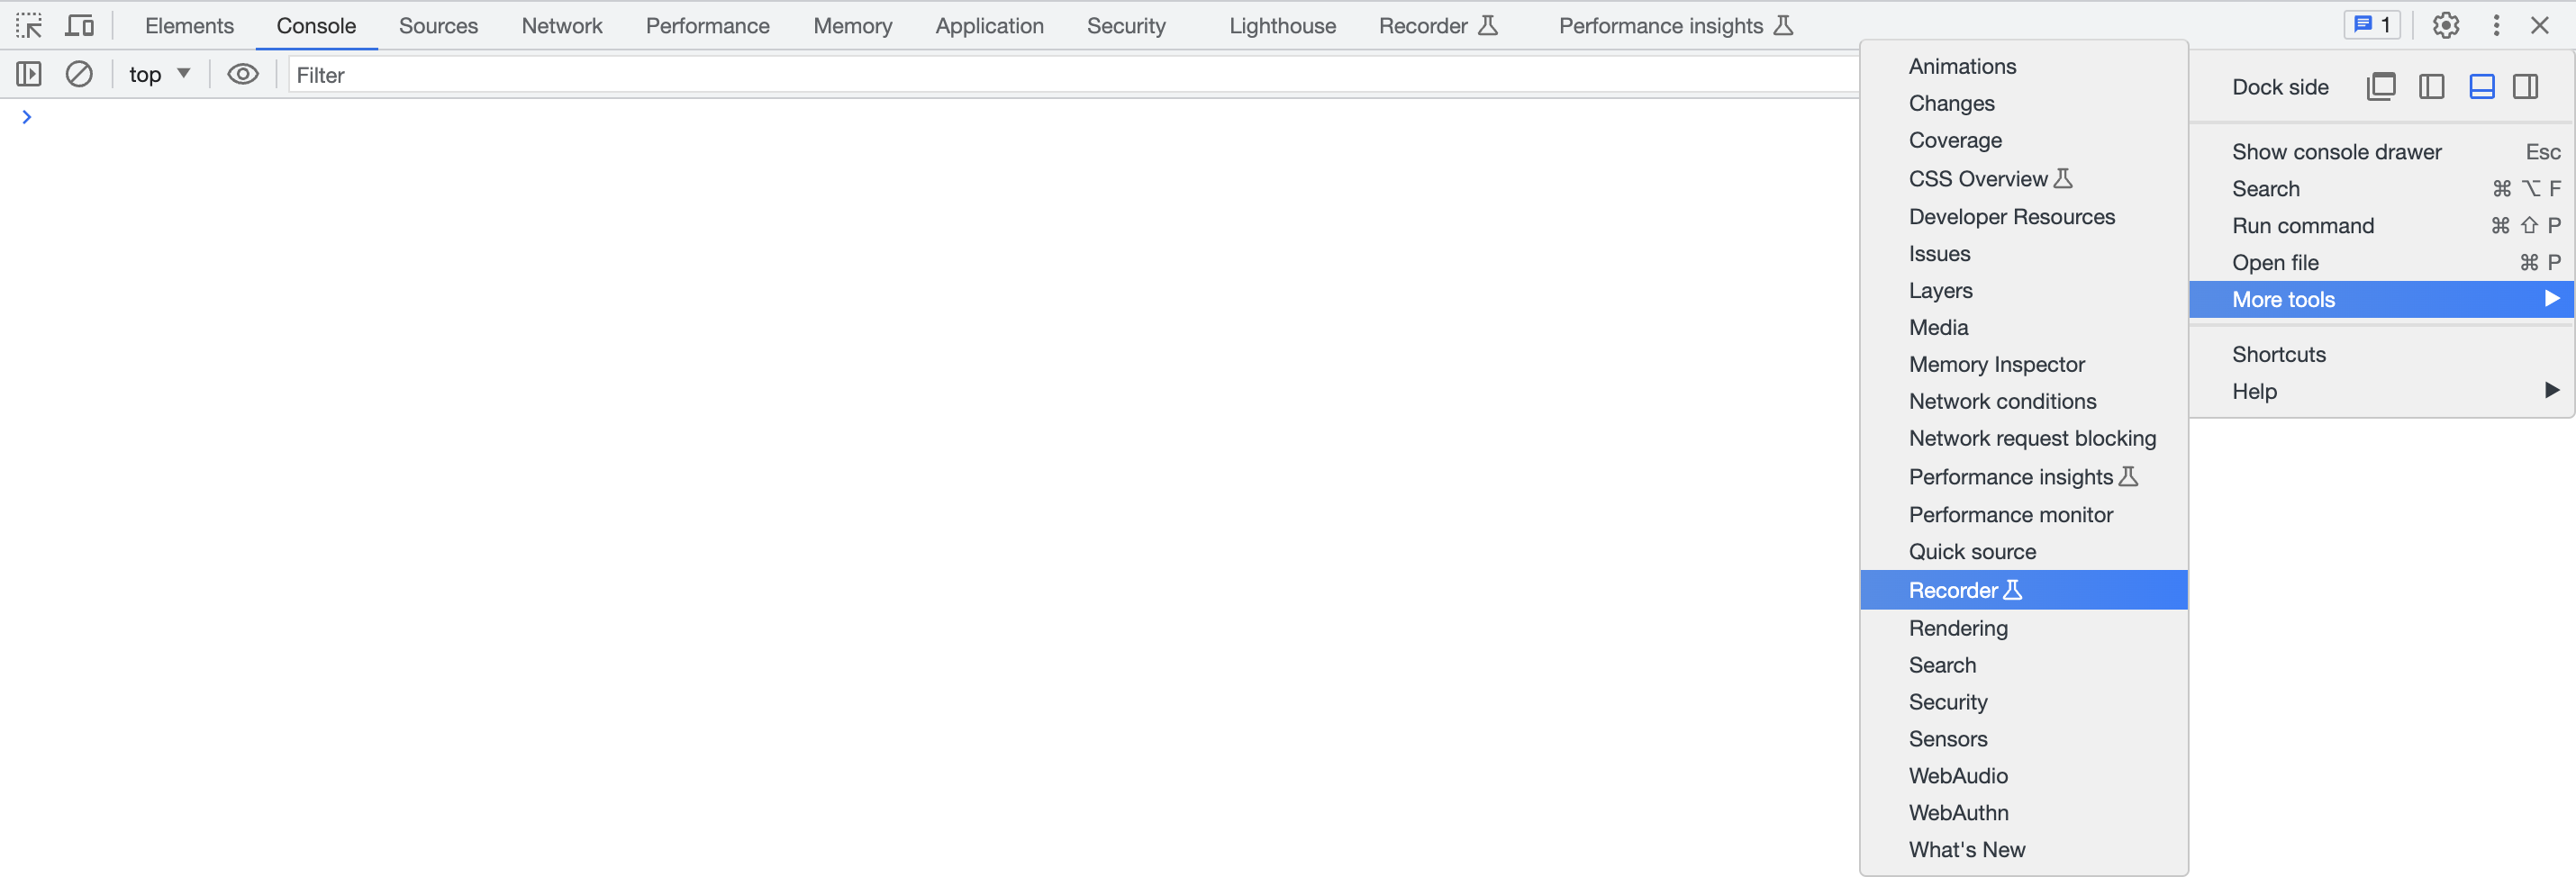
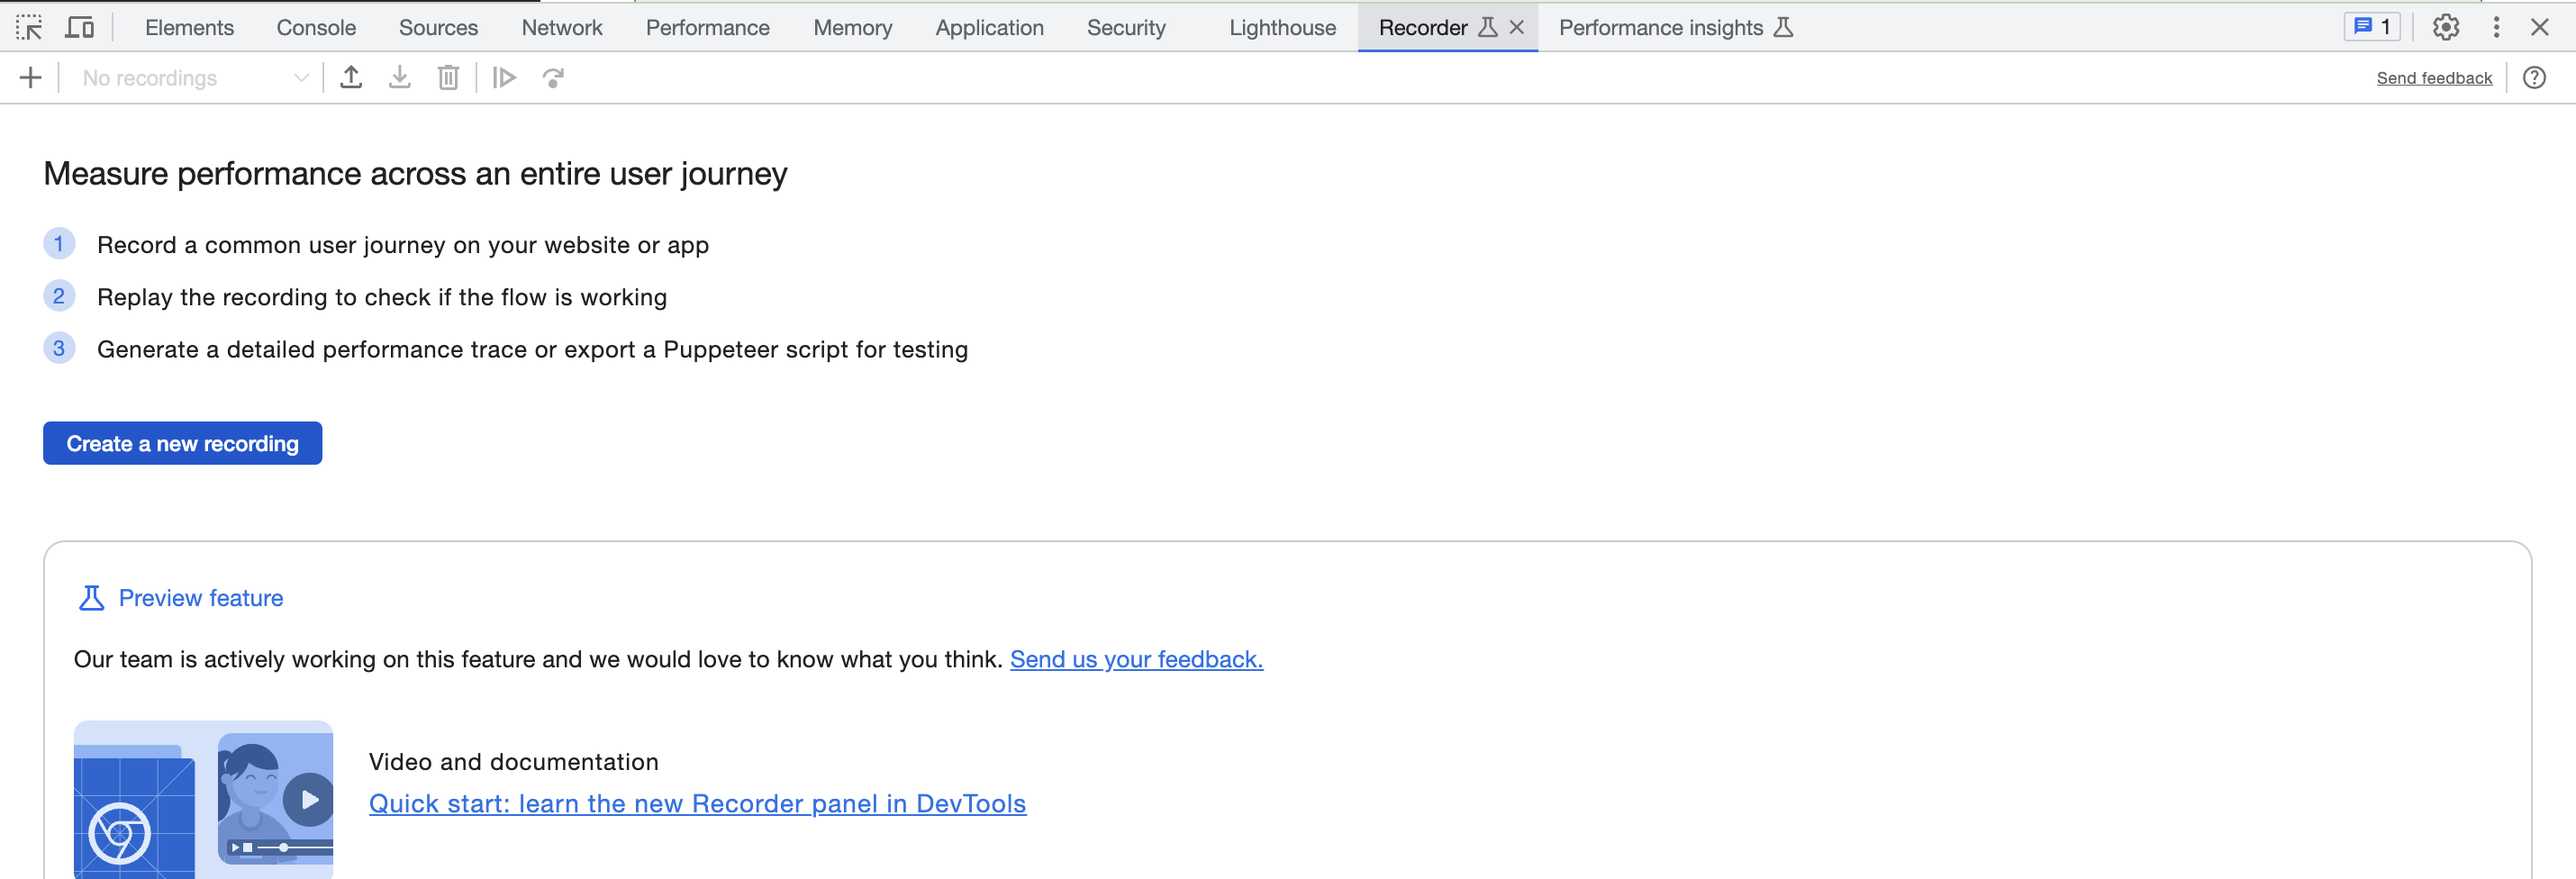
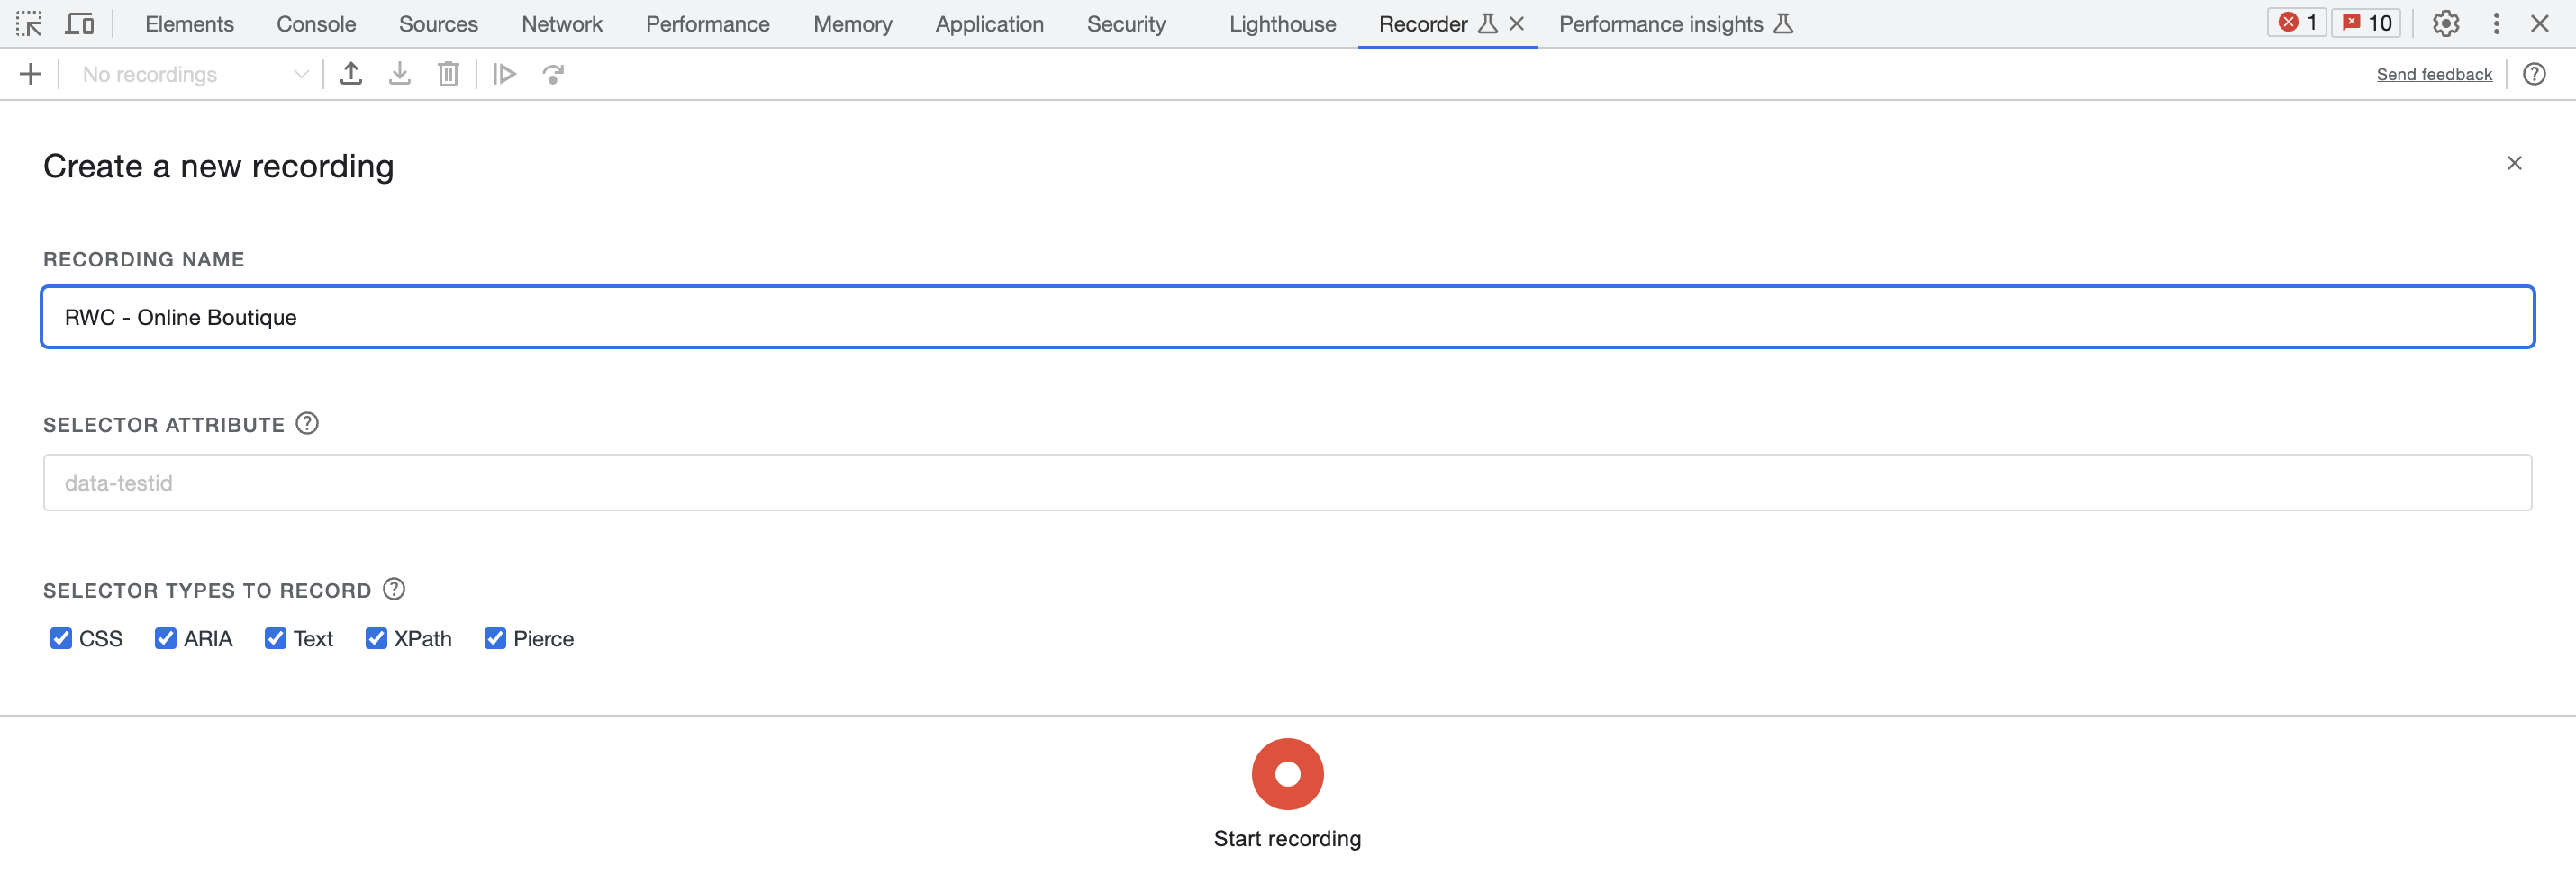
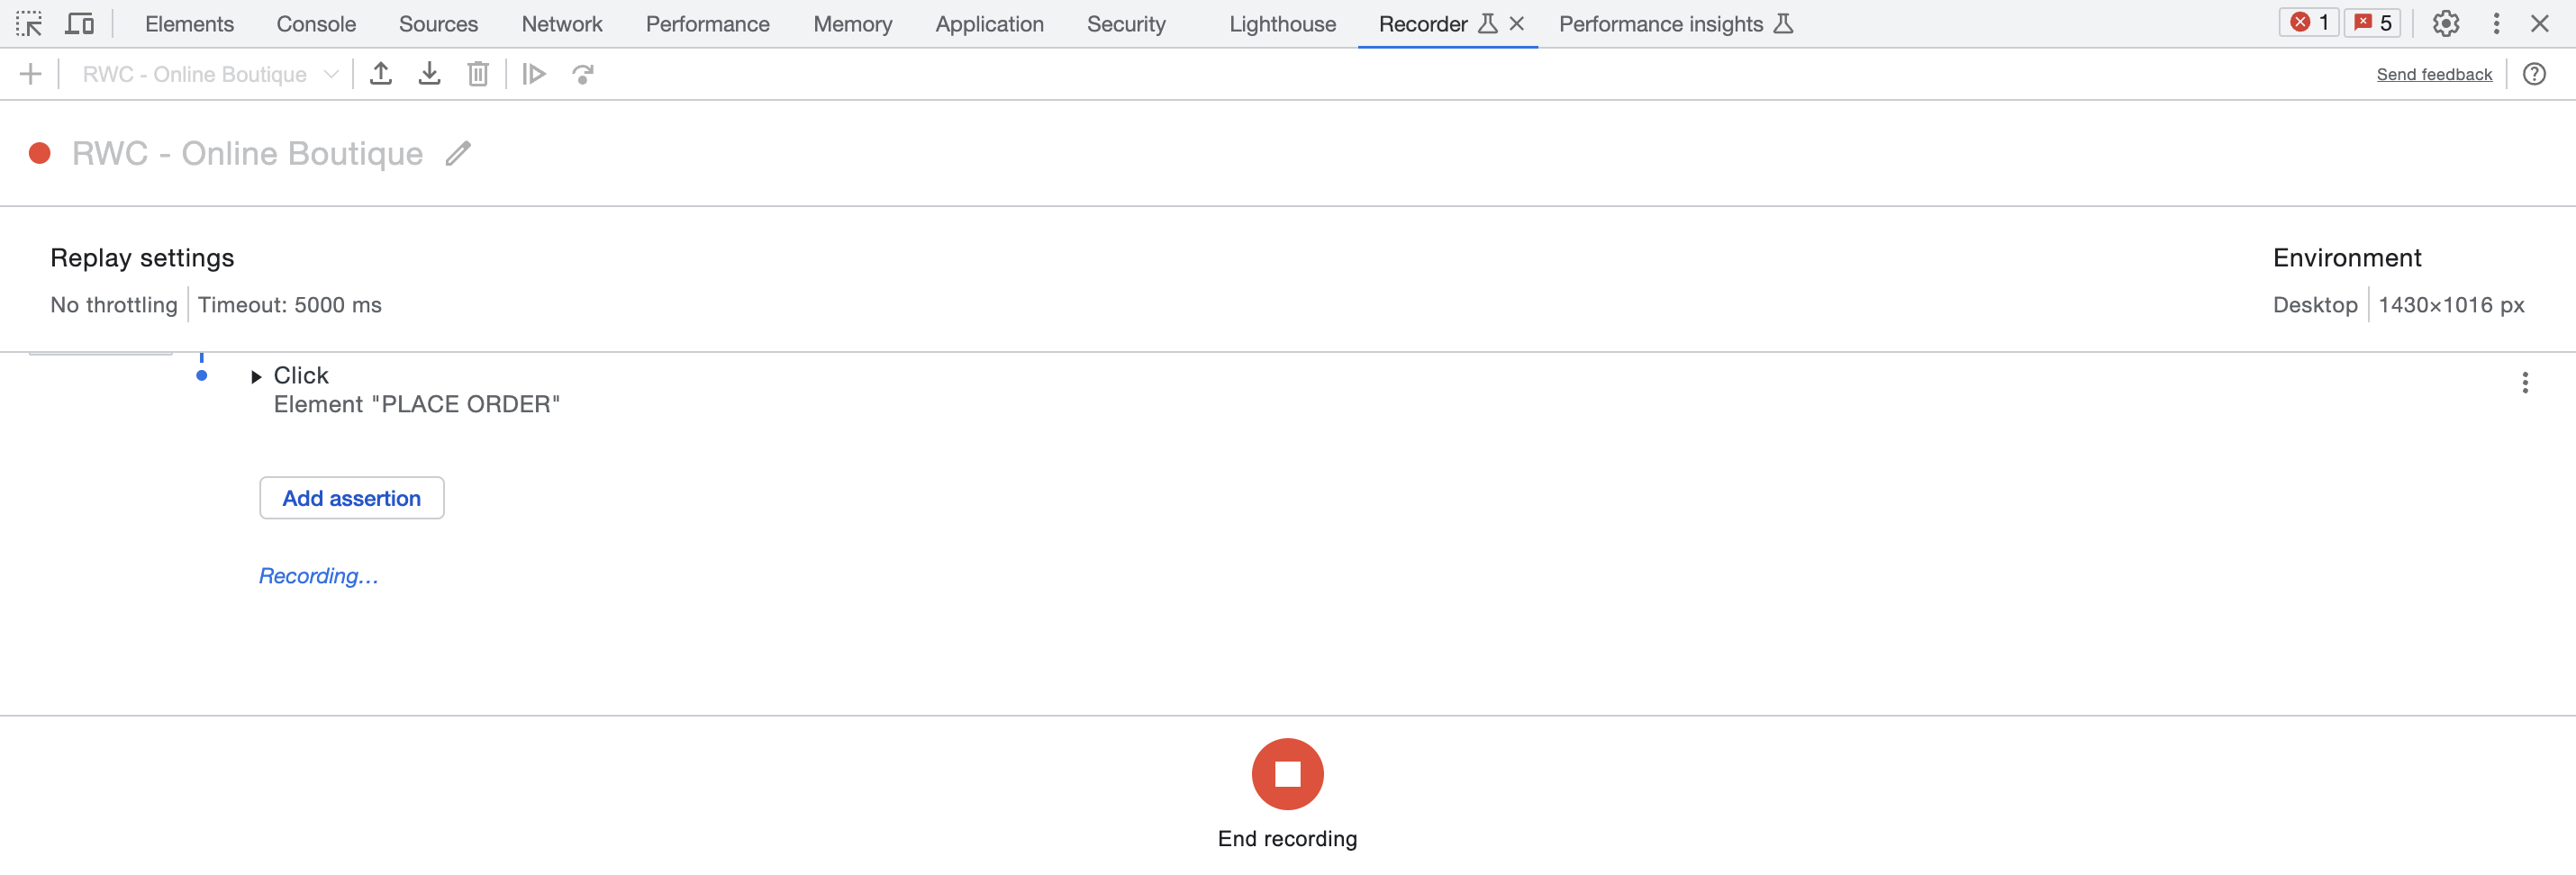
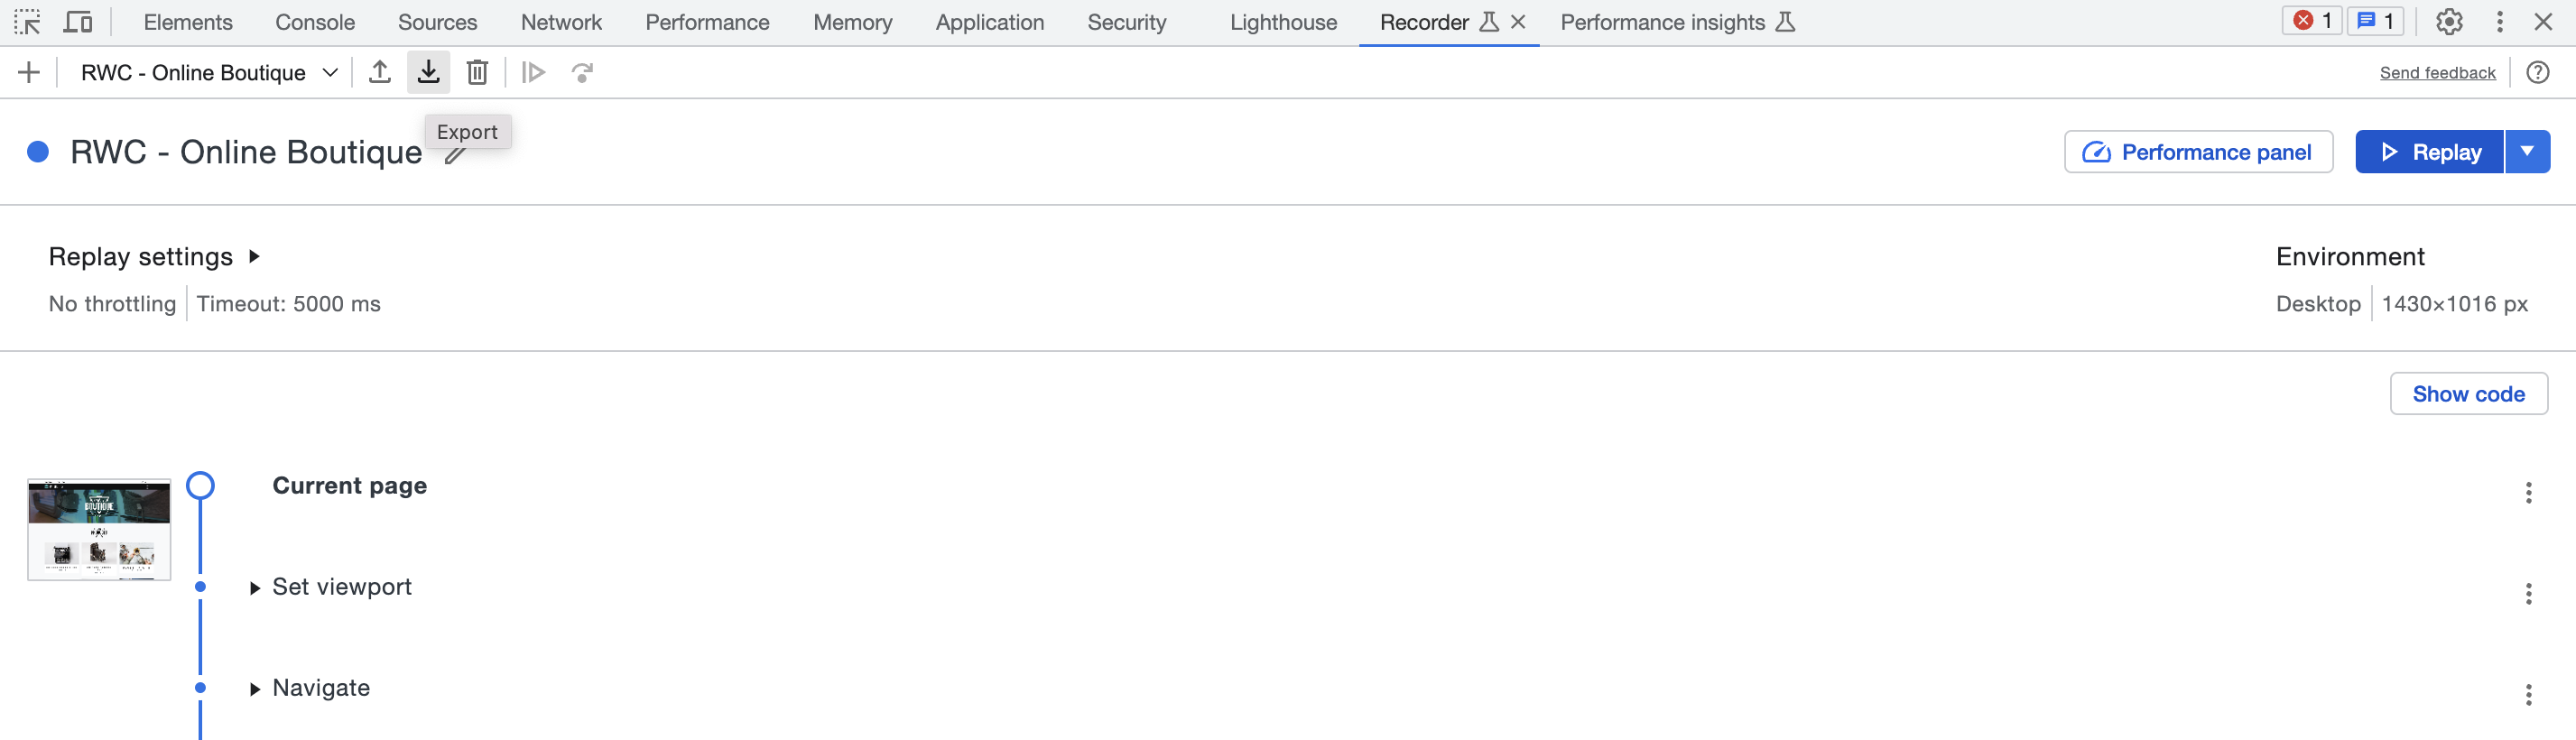
This workshop walks you through using the Chrome DevTools Recorder to create a synthetic transaction against a Splunk demonstration instance.

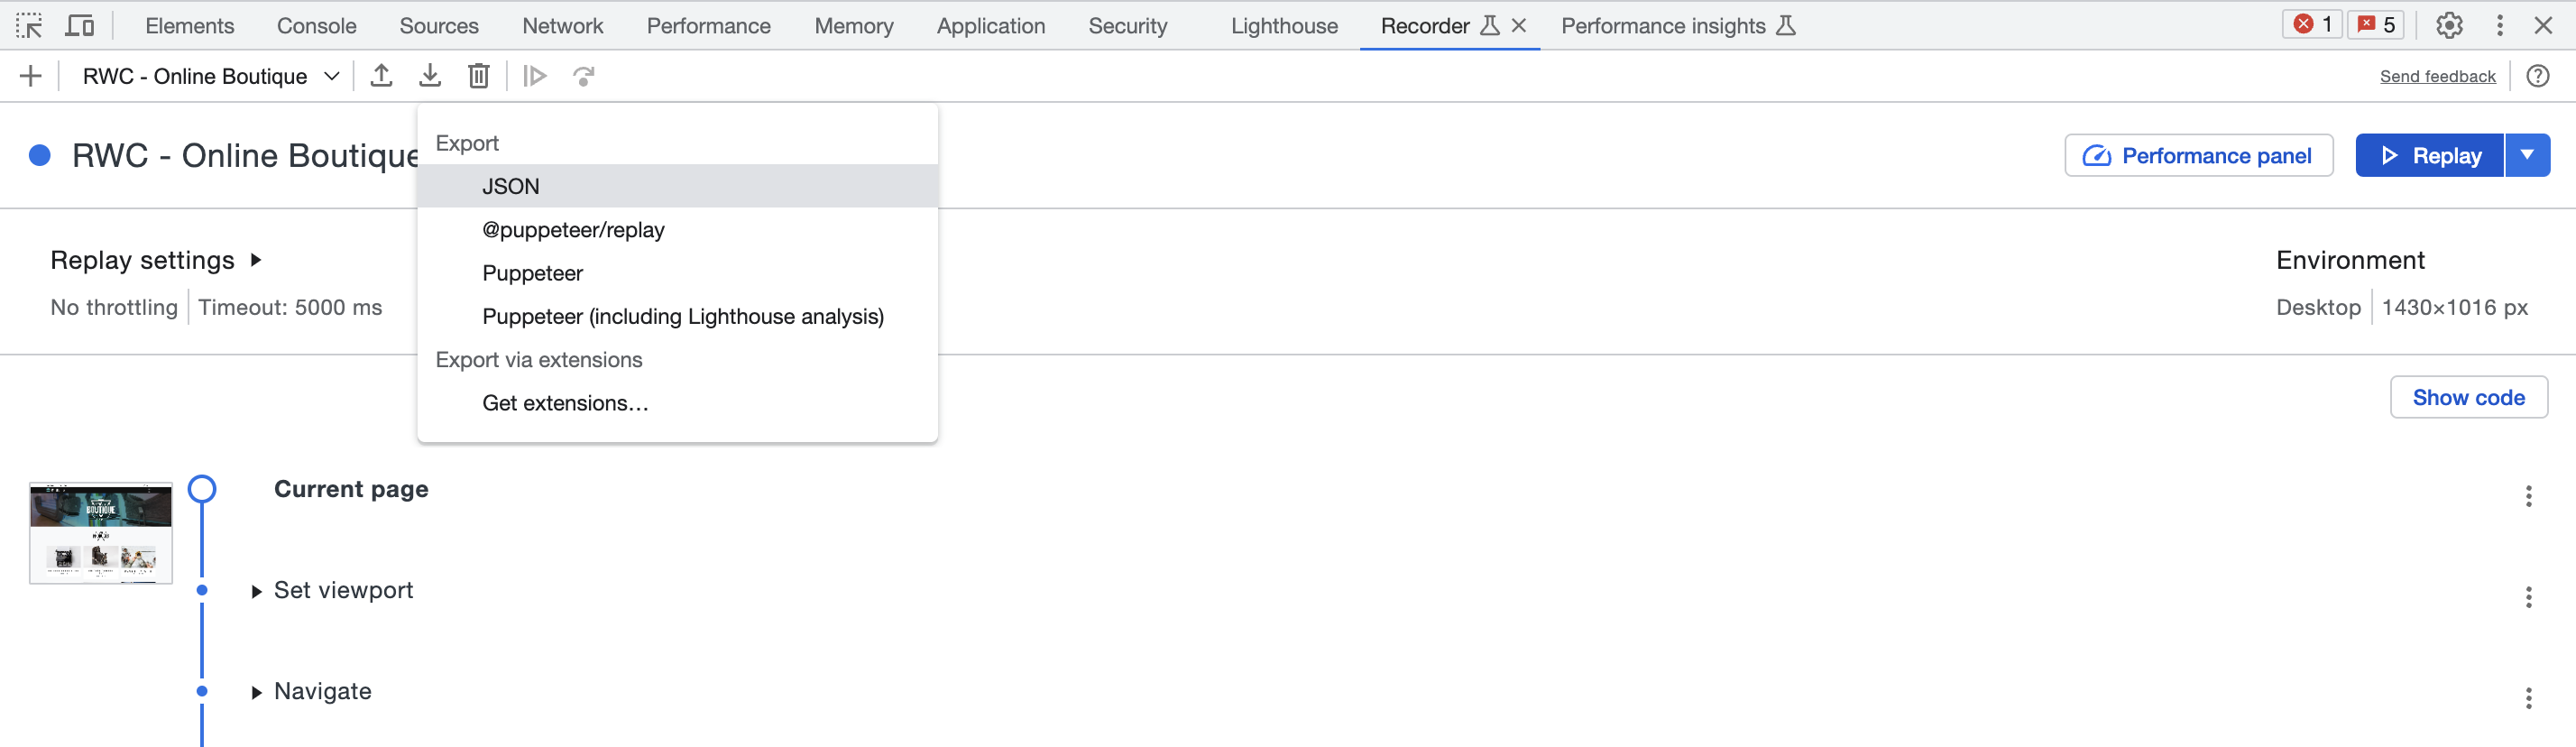
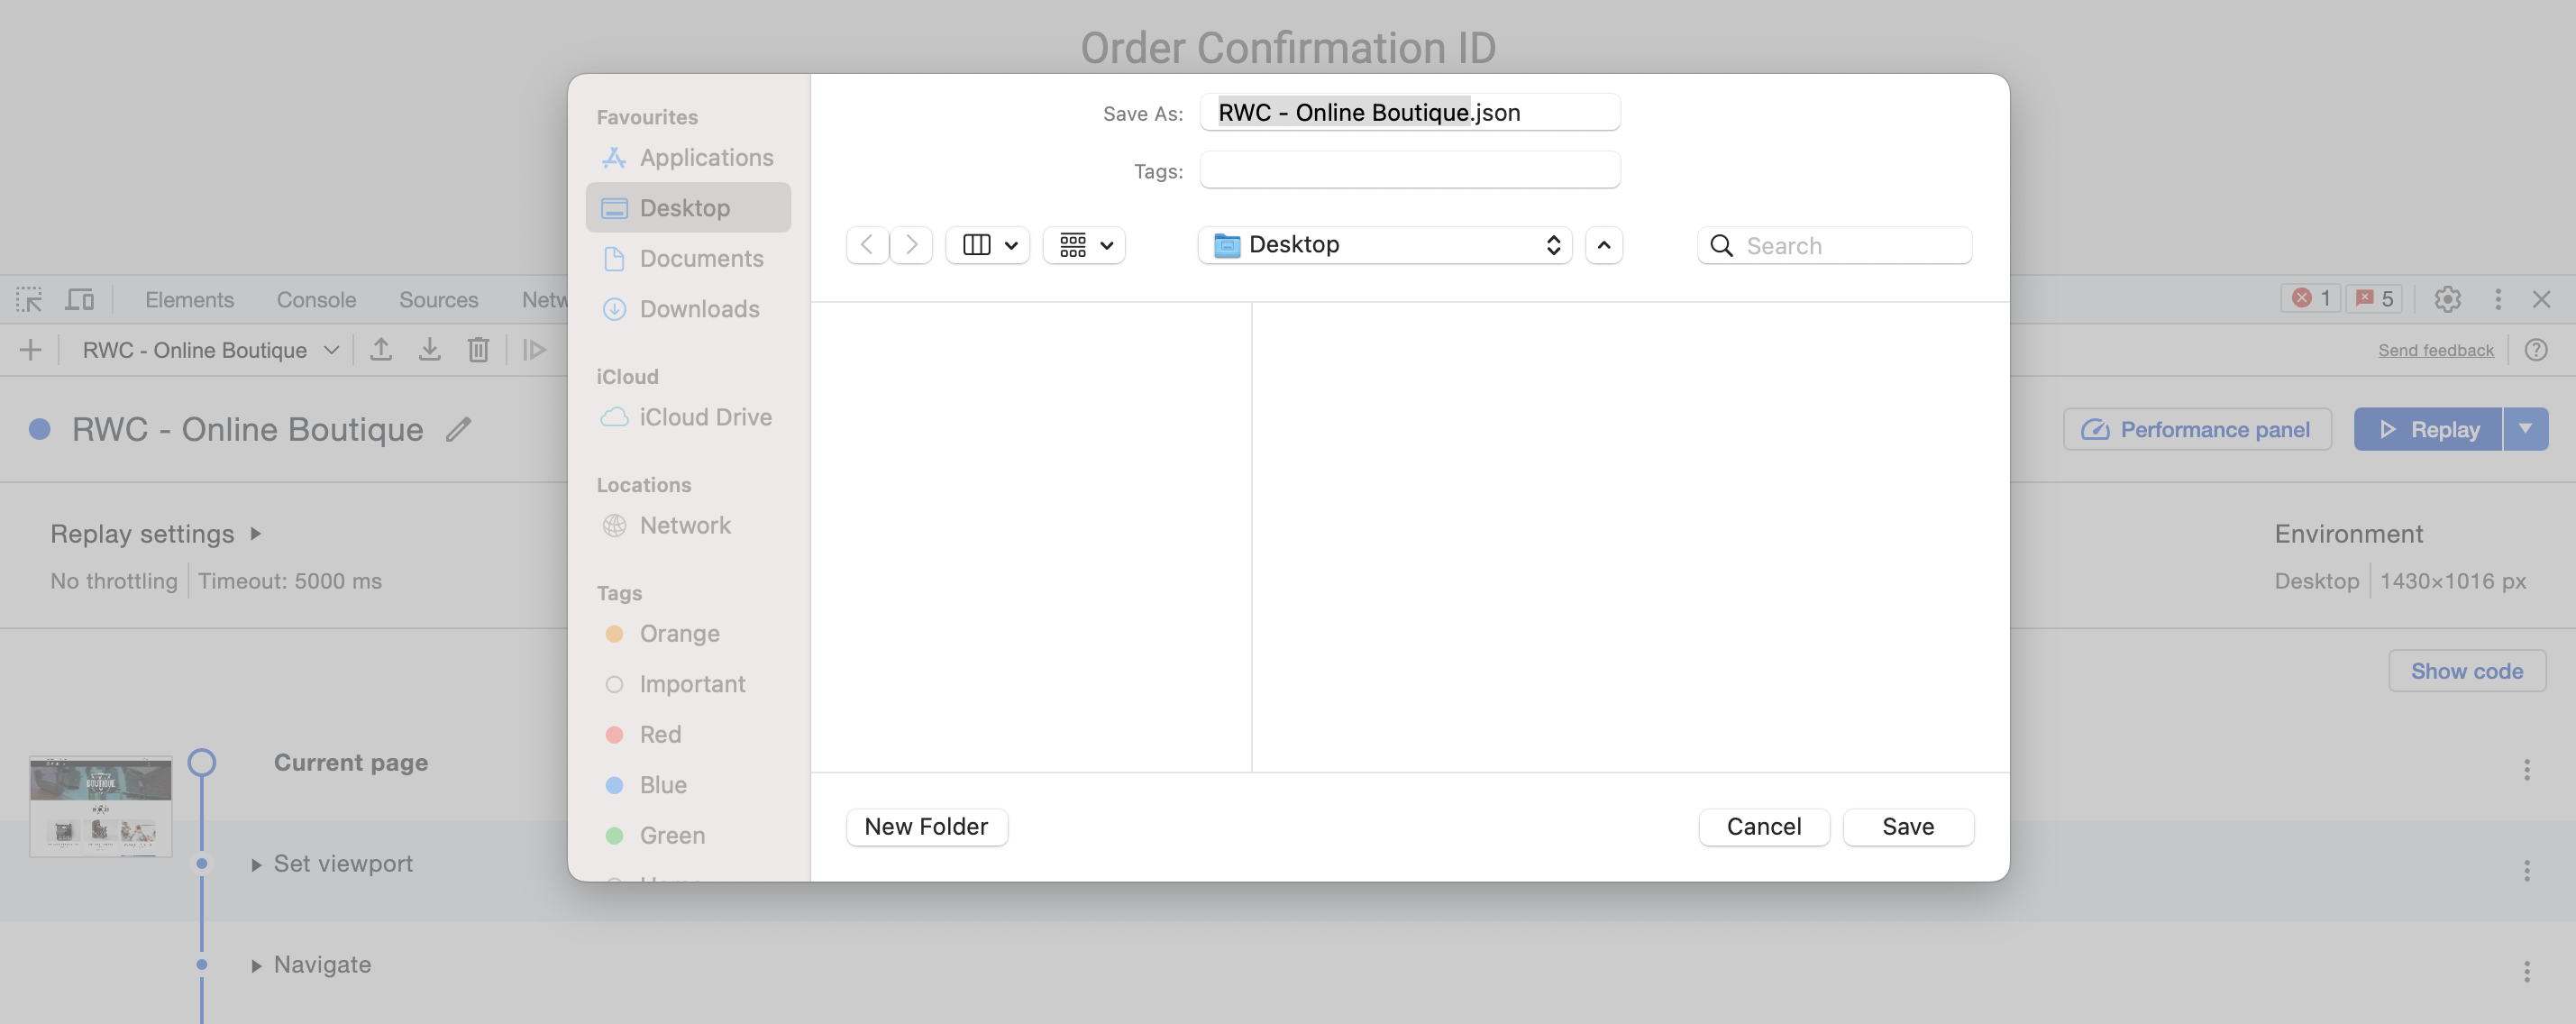
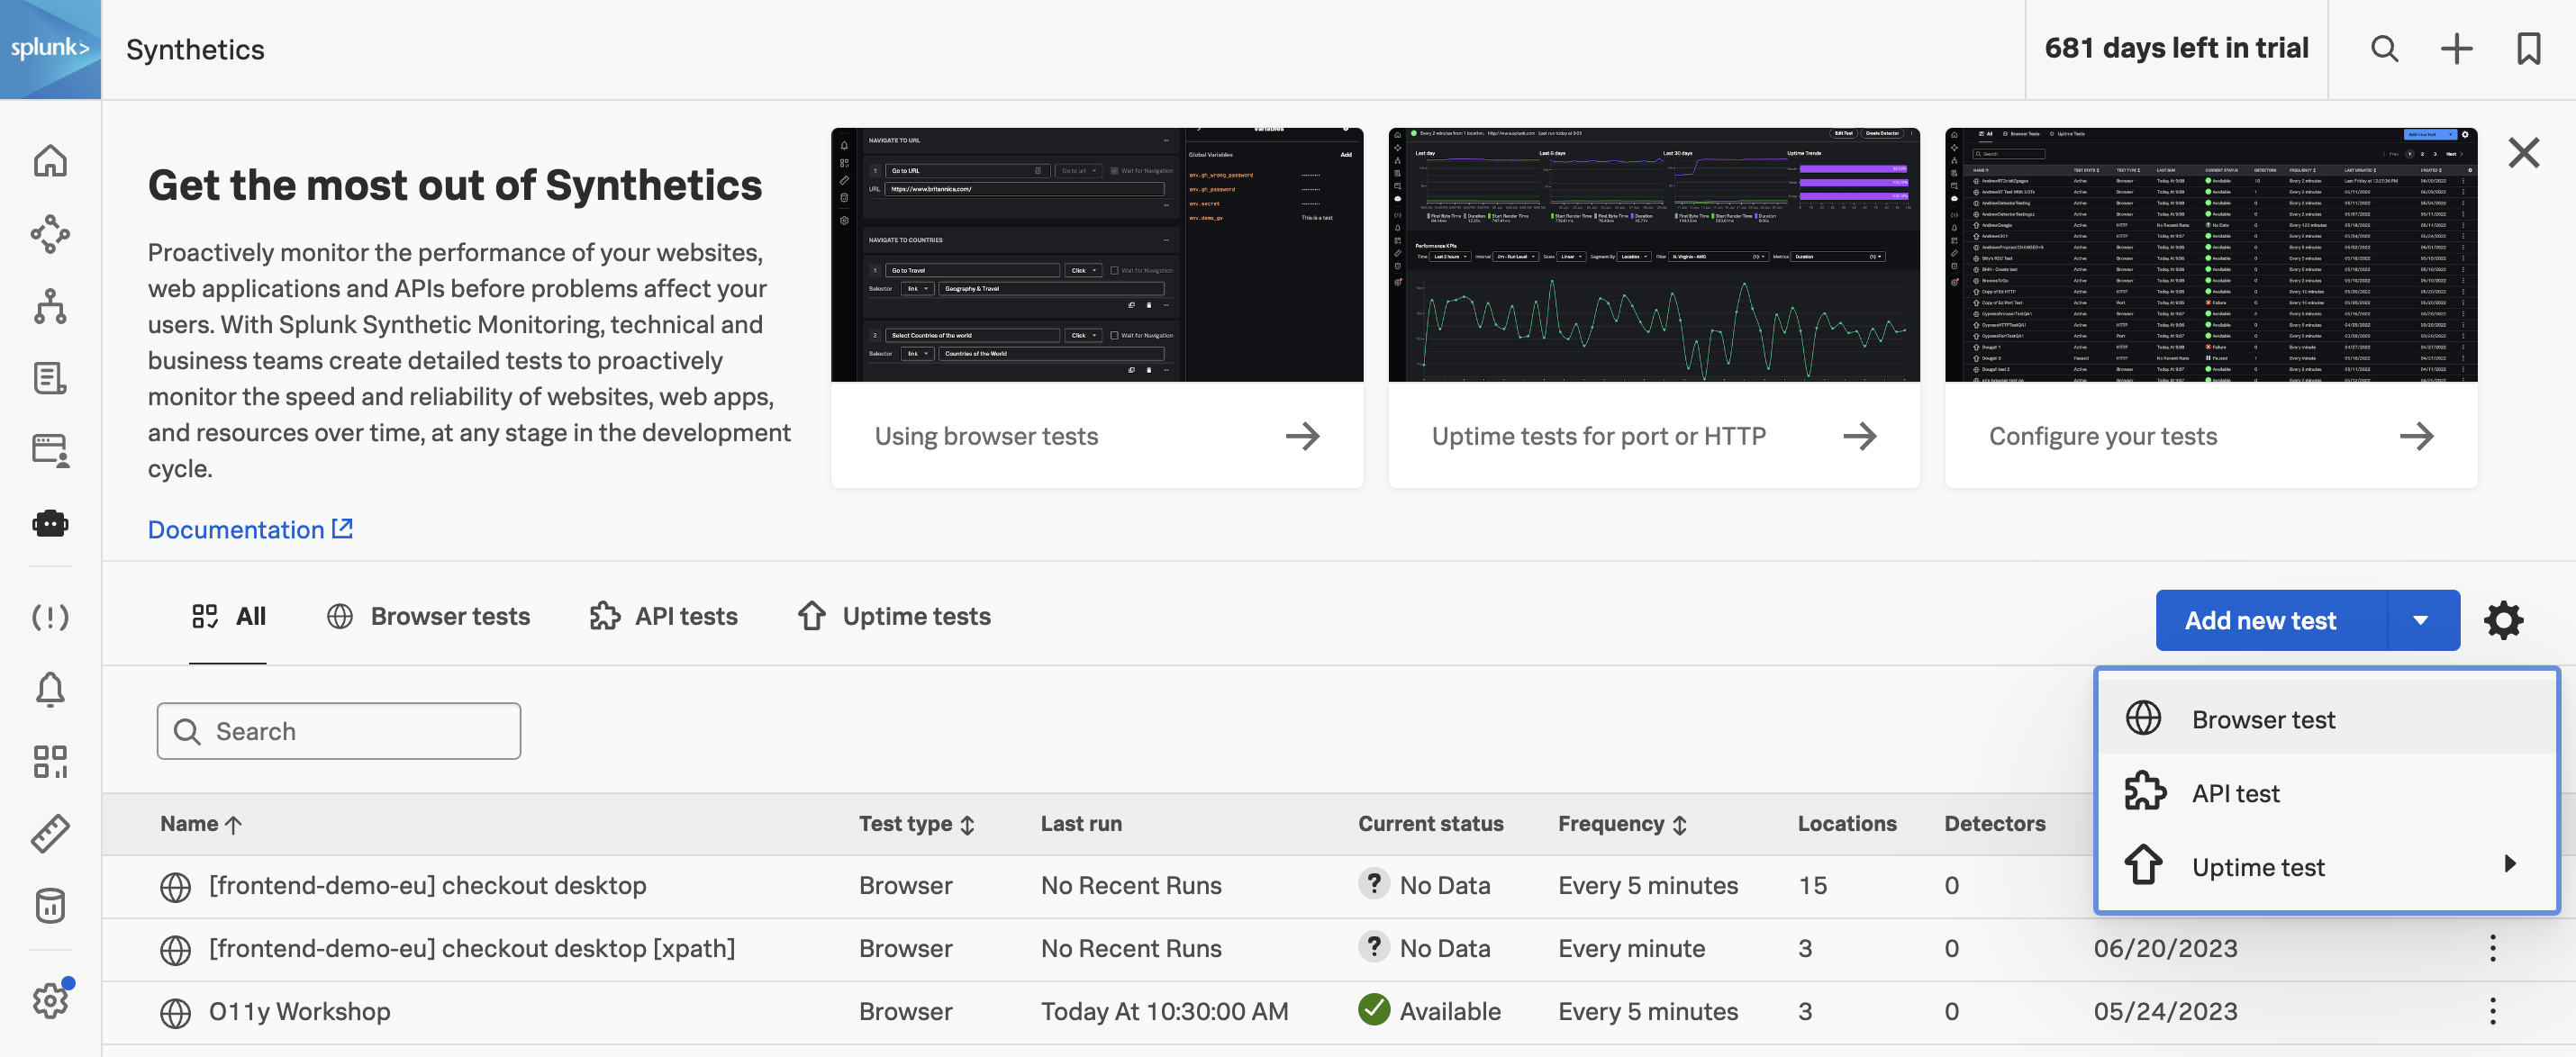
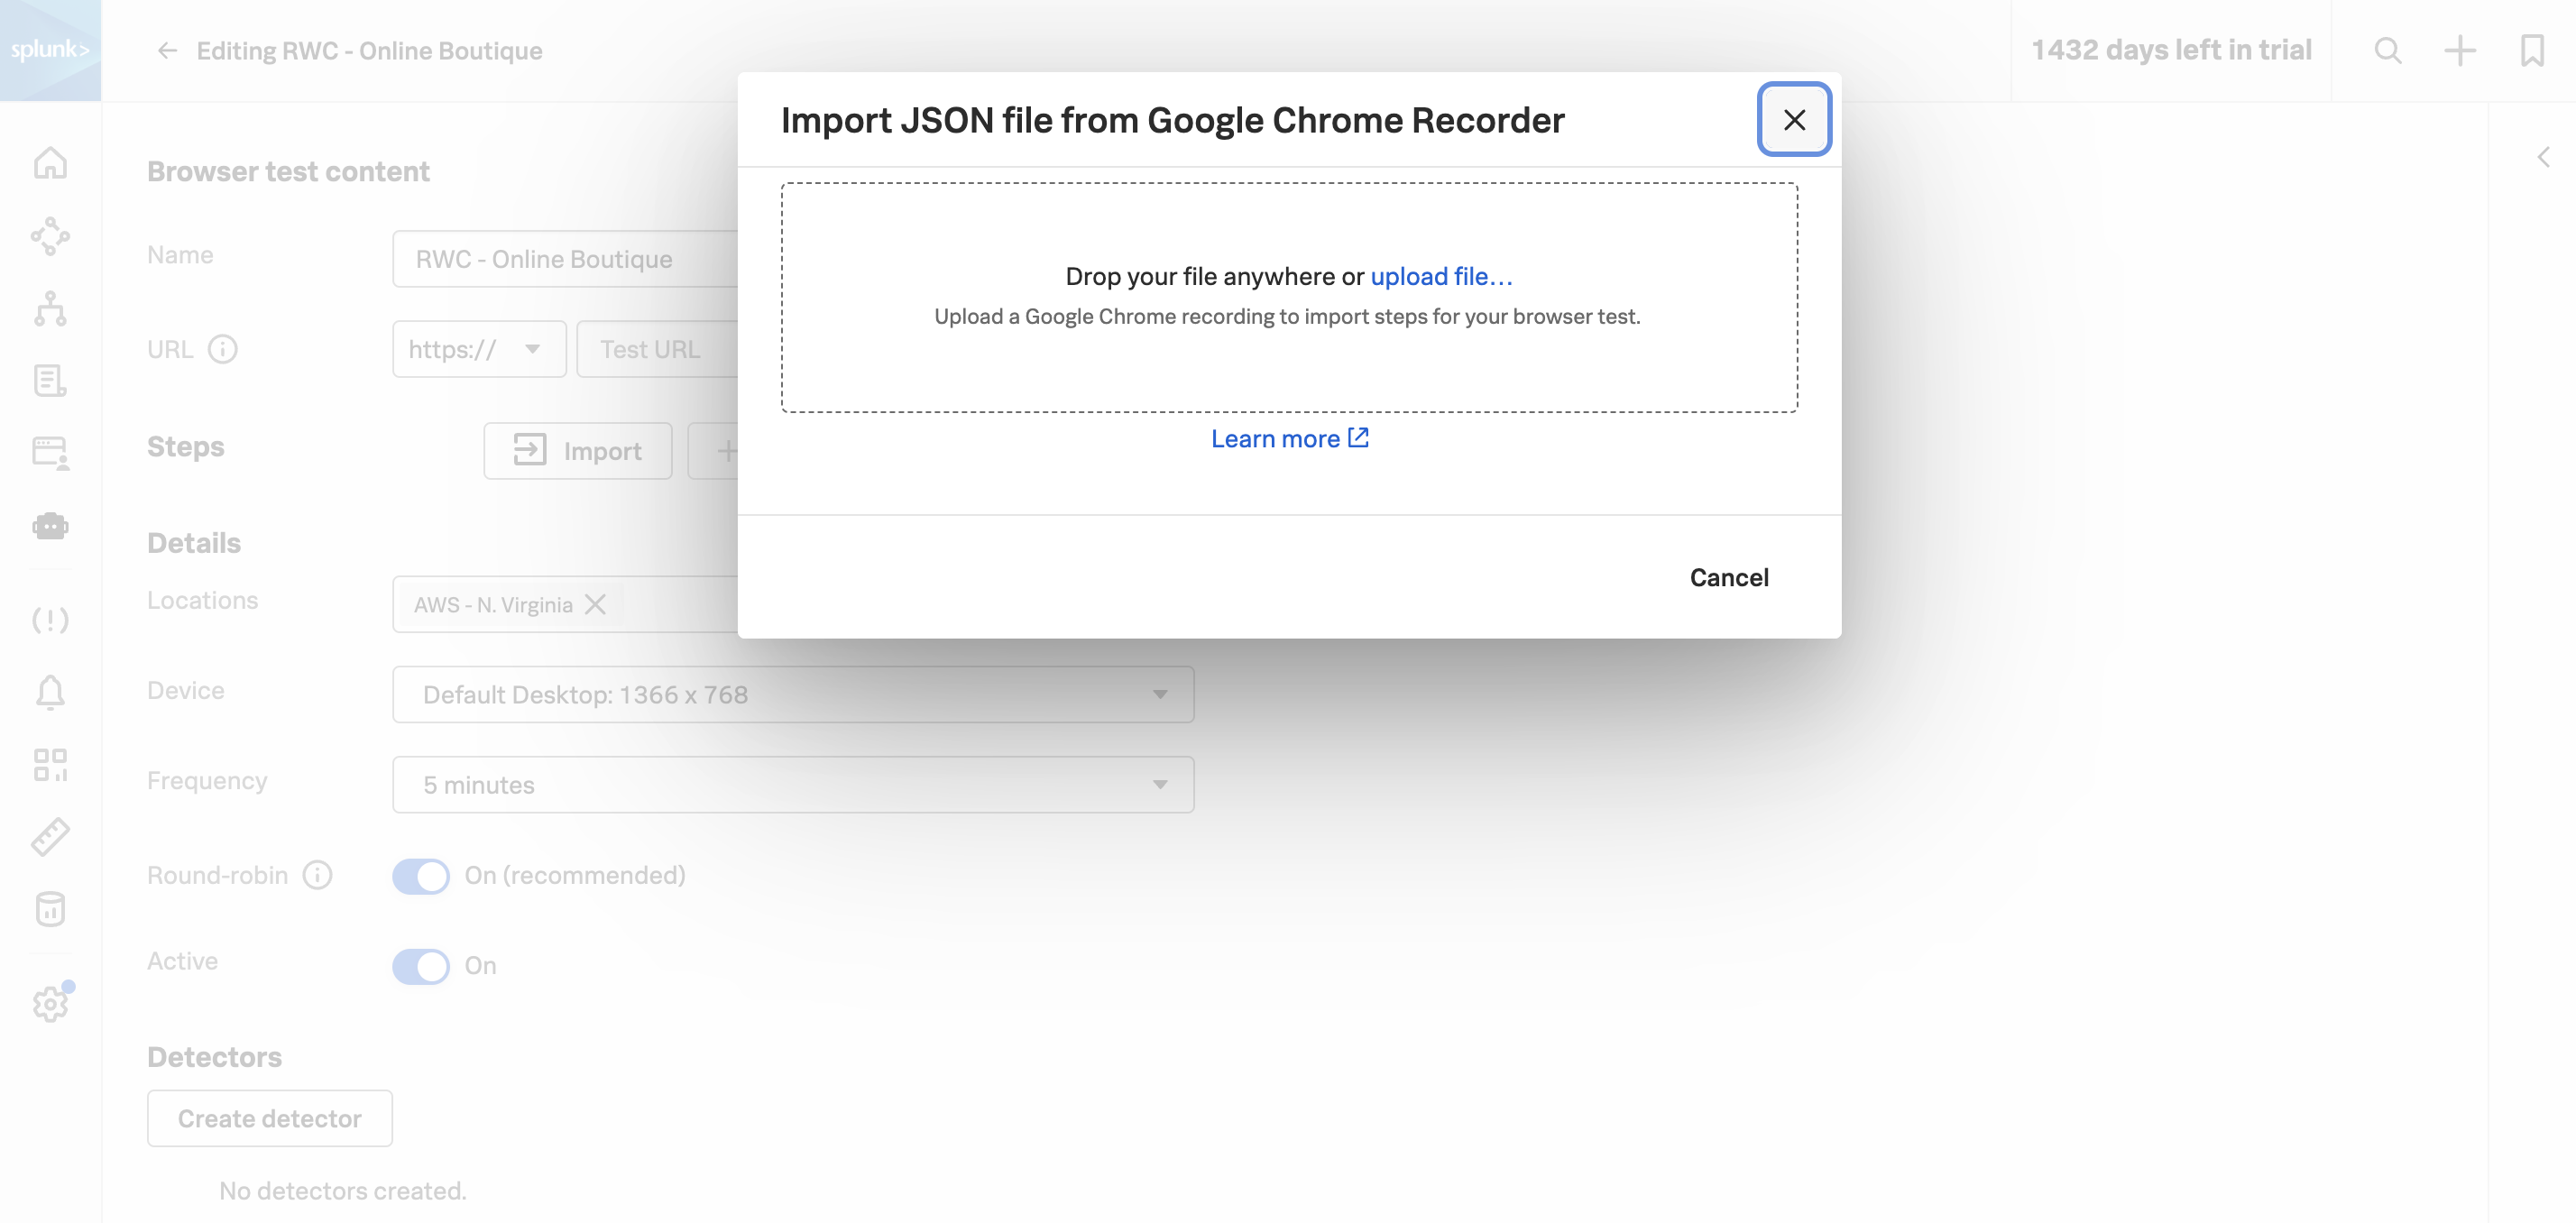
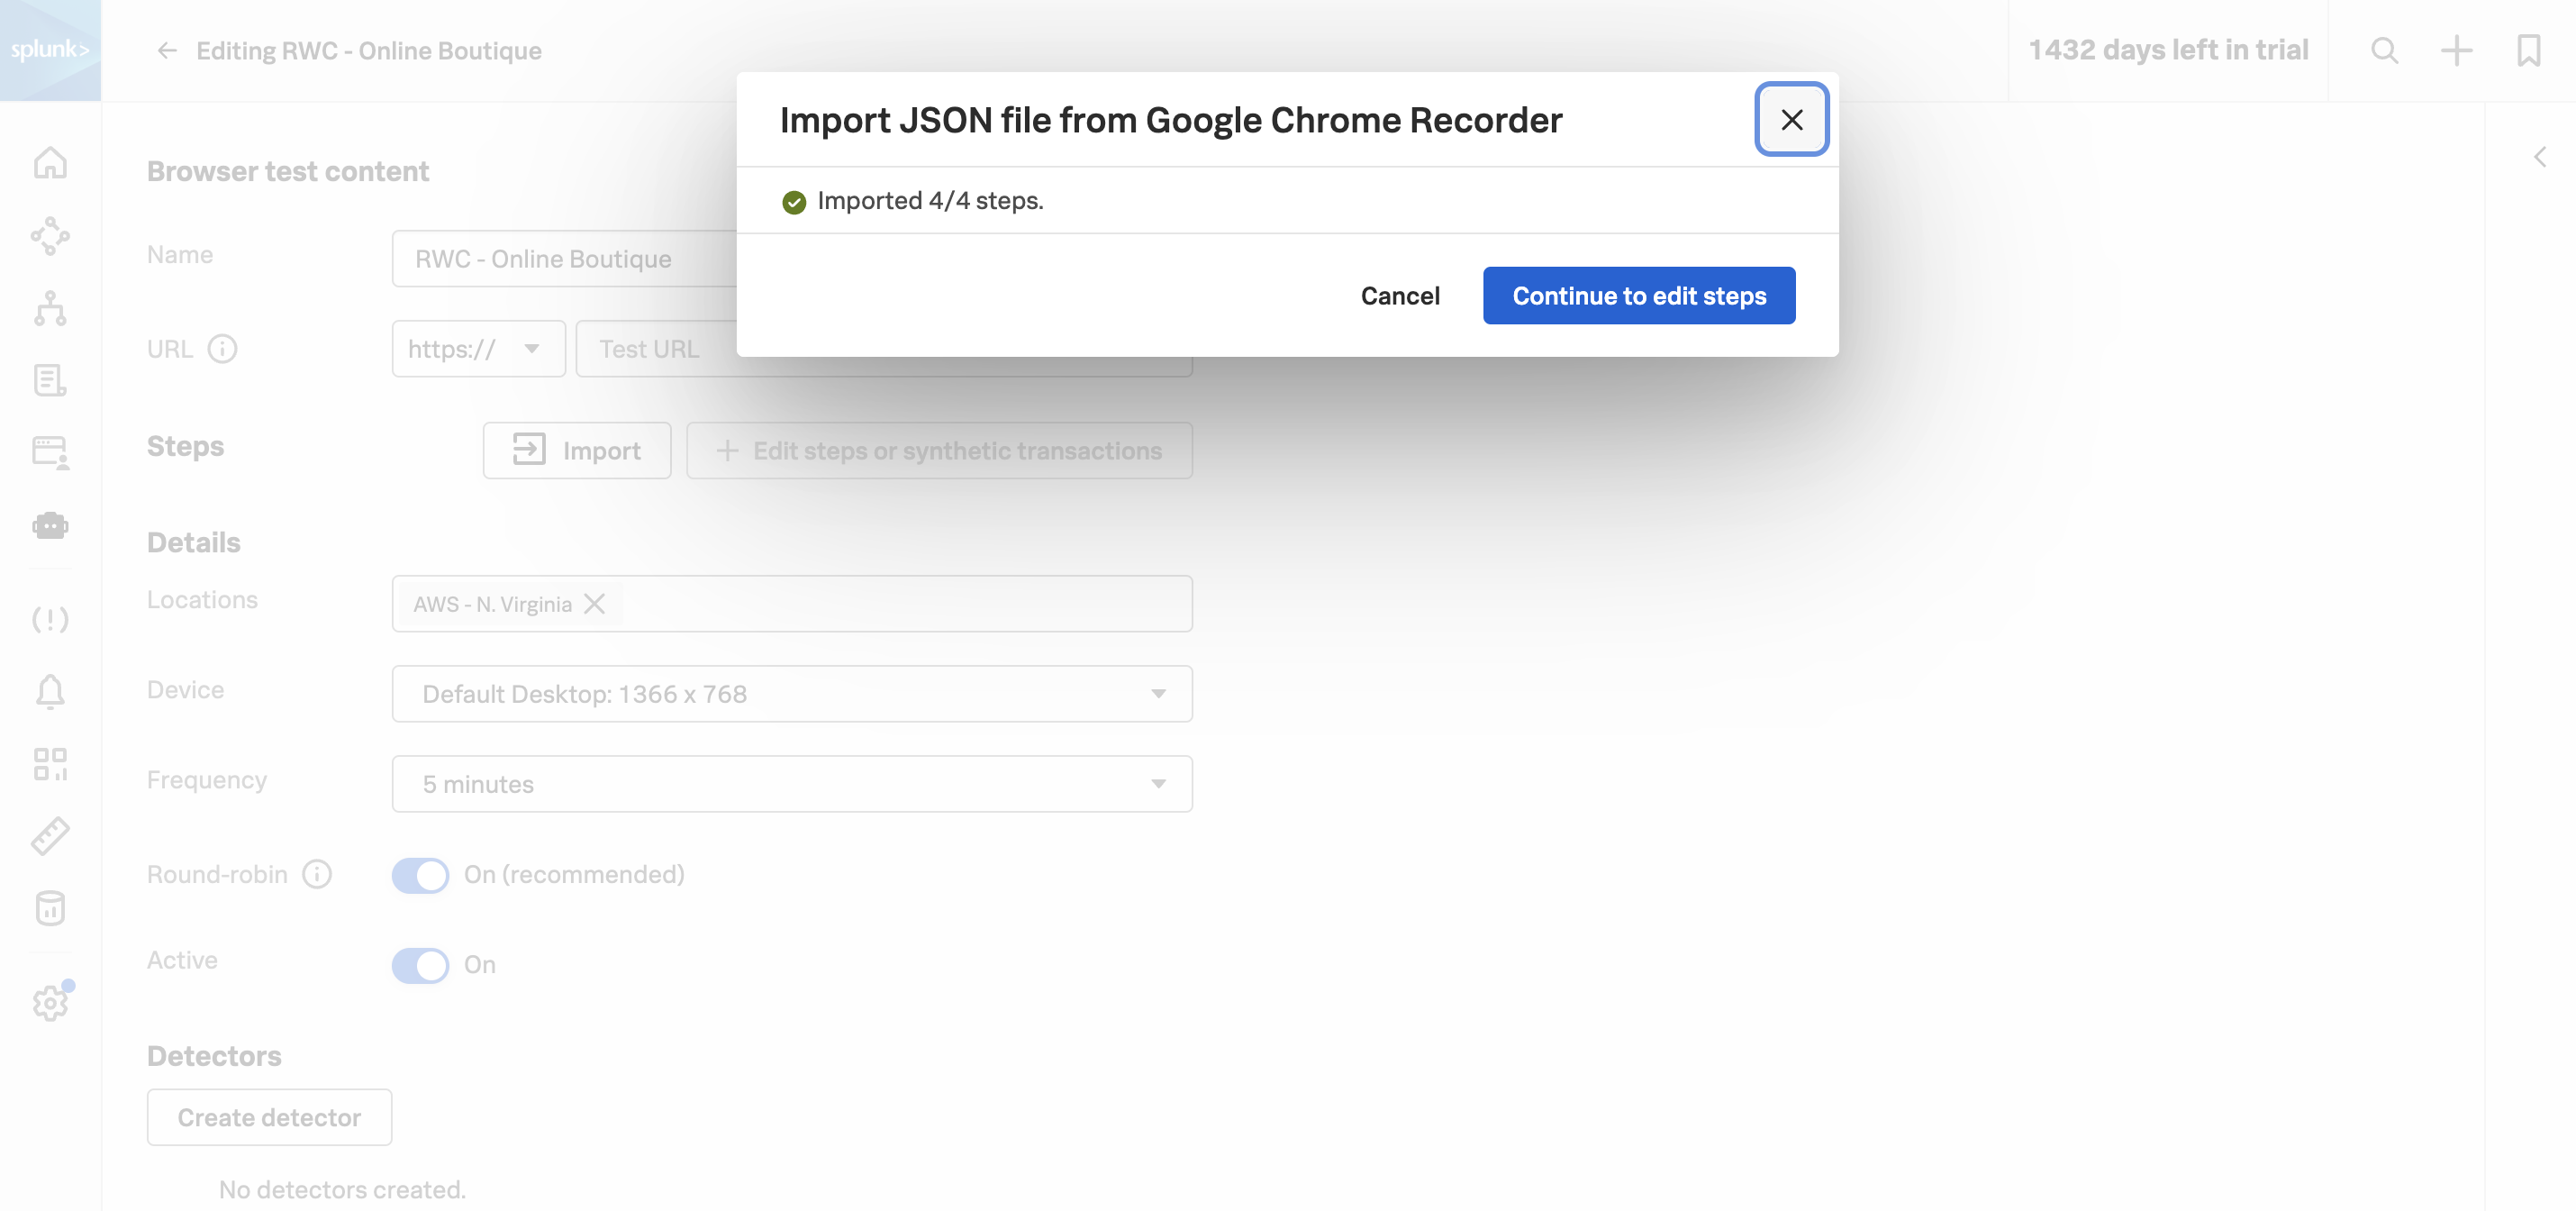
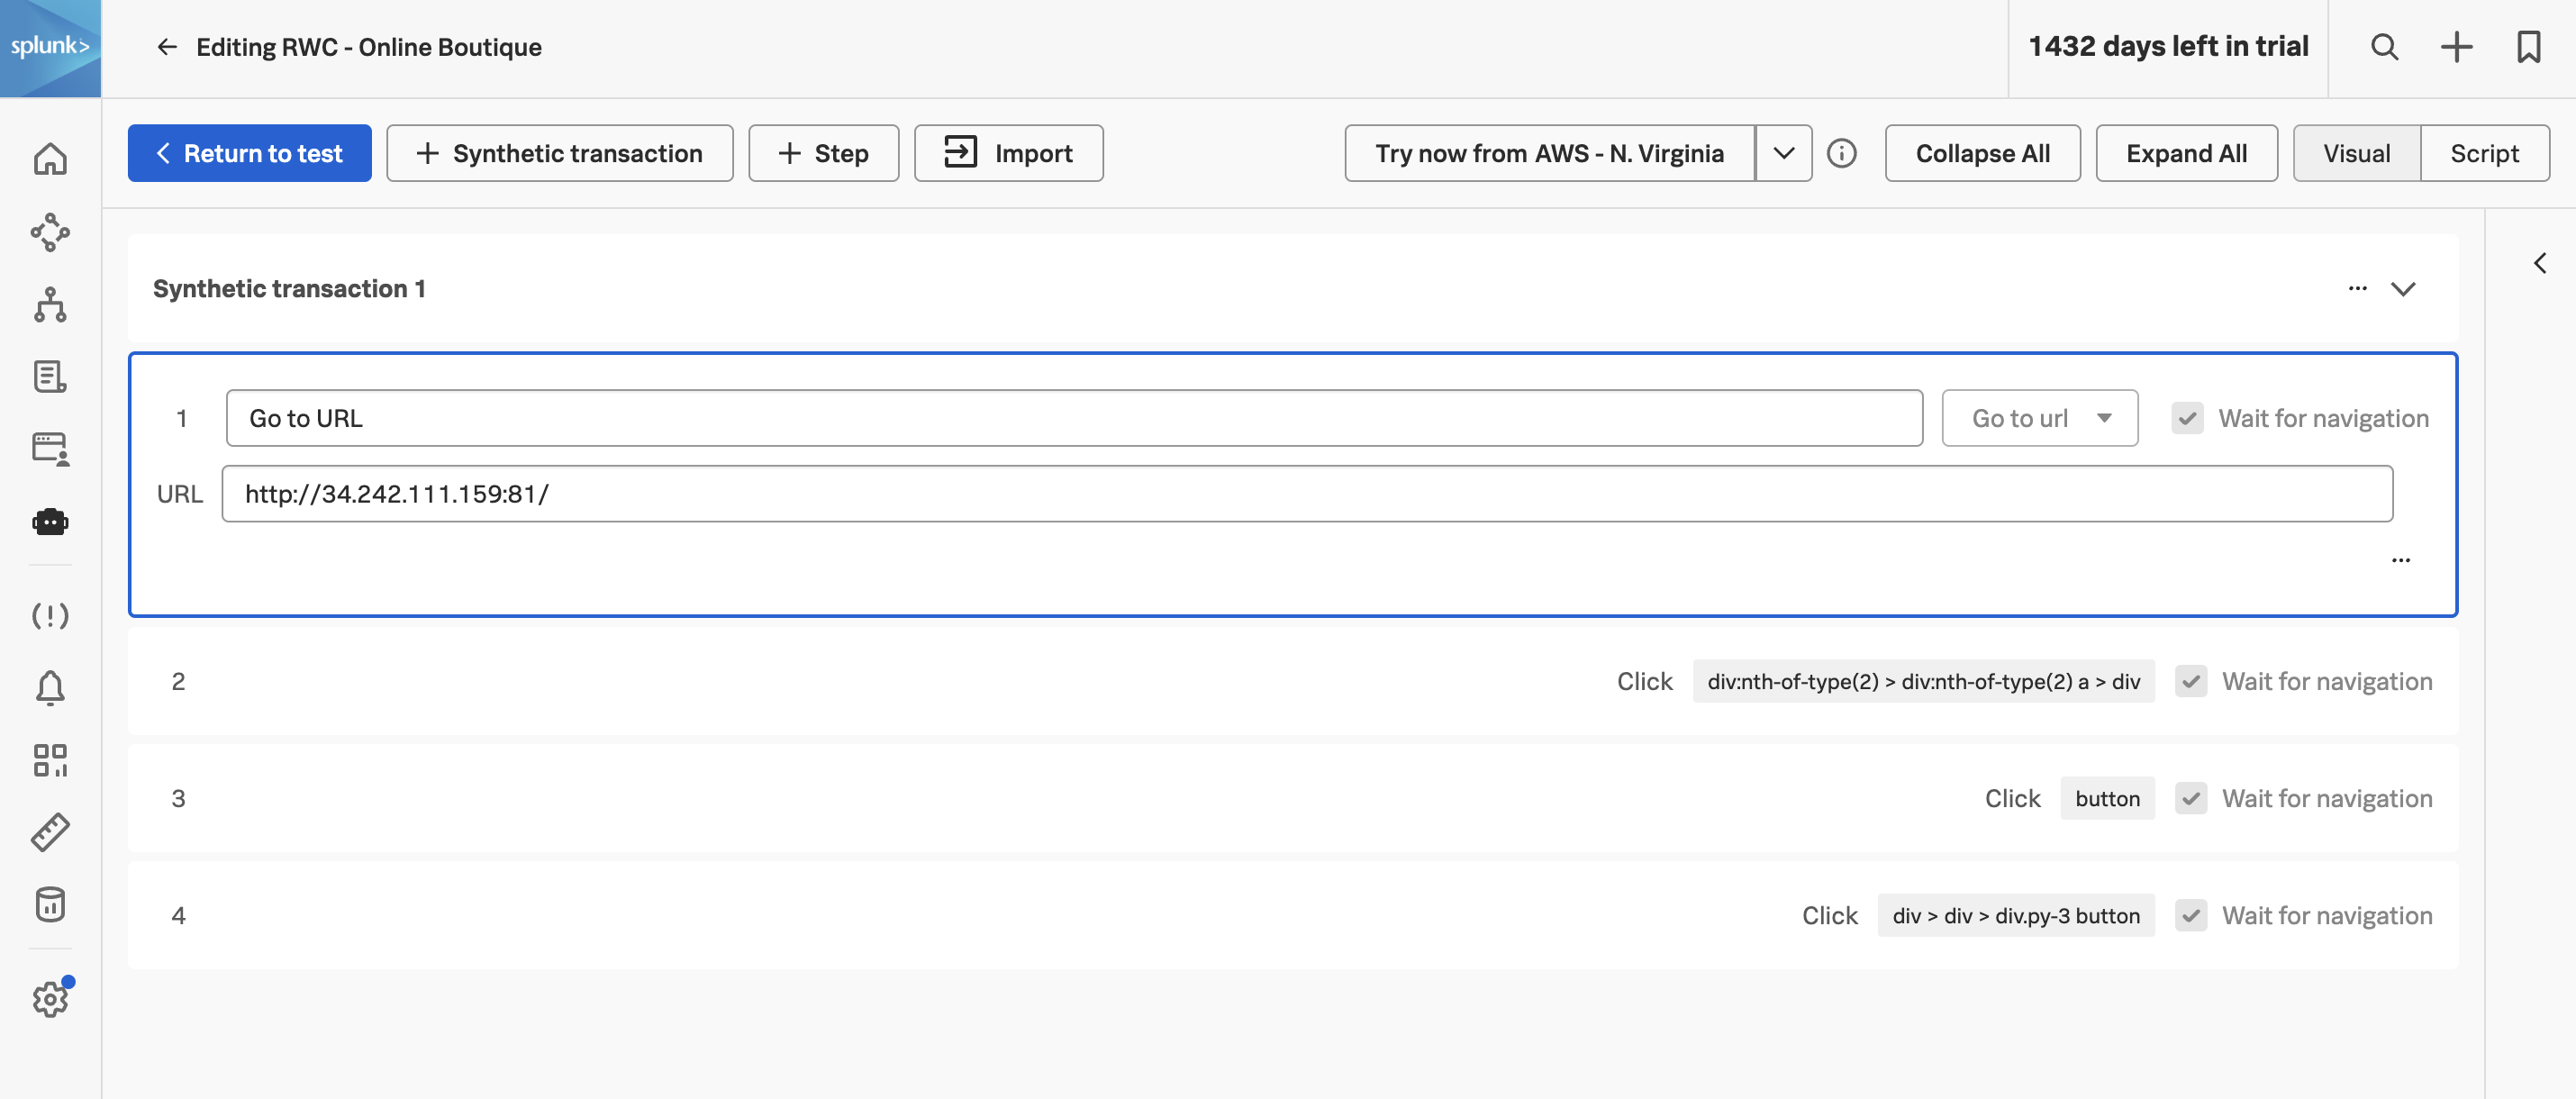
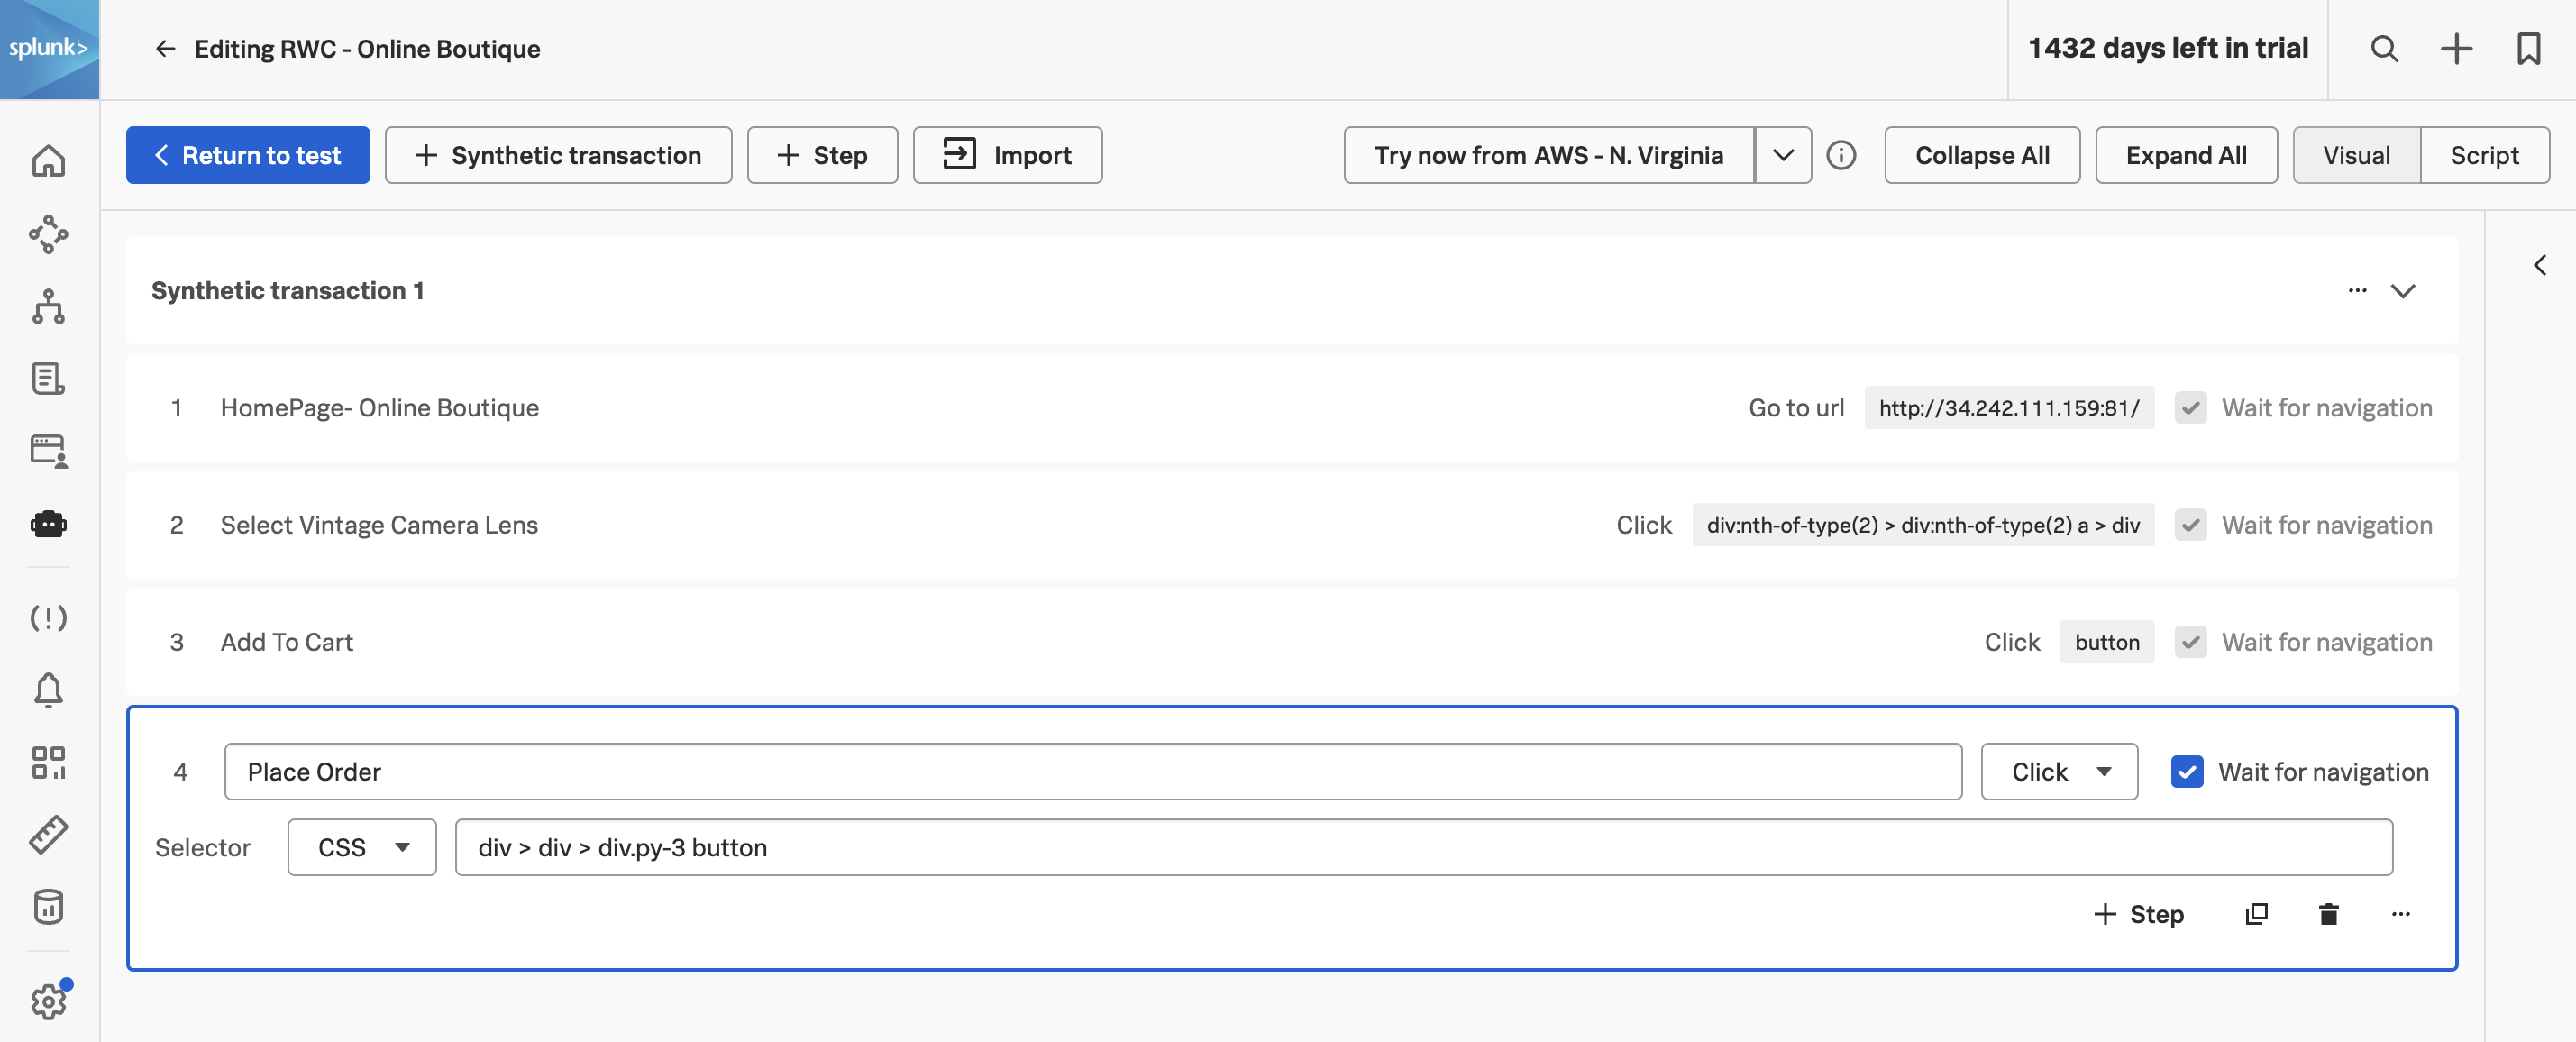
The exported JSON from the Chrome DevTools Recorder will then be used to create a Splunk Synthetic Monitoring Real Browser Test.

In addition, you will also get to learn other Splunk Synthetic Monitoring checks like API Test and Uptime Test.

Pre-requisites

  • Google Chrome Browser installed
  • Access to Splunk Observability Cloud
Last Modified Sep 19, 2024

Subsections of 1. Real Browser Test

1.1 Recording a test

Open the starting URL

Open the starting URL for the workshop in Chrome. Click on the appropriate link below to open the site in a new tab.

Note

The starting URL for the workshop is different for EMEA and AMER/APAC. Please use the correct URL for your region.

Open the Chrome DevTools Recorder

Next, open the Developer Tools (in the new tab that was opened above) by pressing Ctrl + Shift + I on Windows or Cmd + Option + I on a Mac, then select Recorder from the top-level menu or the More tools flyout menu.

Open Recorder Open Recorder

Note

Site elements might change depending on viewport width. Before recording, set your browser window to the correct width for the test you want to create (Desktop, Tablet, or Mobile). Change the DevTools “dock side” to pop out as a separate window if it helps.

Create a new recording

With the Recorder panel open in the DevTools window. Click on the Create a new recording button to start.

Recorder Recorder

For the Recording Name use your initials to prefix the name of the recording e.g. <your initials> - Online Boutique. Click on Start Recording to start recording your actions.

Recording Name Recording Name

Now that we are recording, complete the following actions on the site:

  • Click on Vintage Camera Lens
  • Click on Add to Cart
  • Click on Place Order
  • Click on End recording in the Recorder panel.

End Recording End Recording

Exporting the recording

Click on the Export button:

Export button Export button

Select JSON as the format, then click on Save

Export JSON Export JSON

Save JSON Save JSON

Congratulations! You have successfully created a recording using the Chrome DevTools Recorder. Next, we will use this recording to create a Real Browser Test in Splunk Synthetic Monitoring.


{
    "title": "RWC - Online Boutique",
    "steps": [
        {
            "type": "setViewport",
            "width": 1430,
            "height": 1016,
            "deviceScaleFactor": 1,
            "isMobile": false,
            "hasTouch": false,
            "isLandscape": false
        },
        {
            "type": "navigate",
            "url": "https://online-boutique-eu.splunko11y.com/",
            "assertedEvents": [
                {
                    "type": "navigation",
                    "url": "https://online-boutique-eu.splunko11y.com/",
                    "title": "Online Boutique"
                }
            ]
        },
        {
            "type": "click",
            "target": "main",
            "selectors": [
                [
                    "div:nth-of-type(2) > div:nth-of-type(2) a > div"
                ],
                [
                    "xpath//html/body/main/div/div/div[2]/div[2]/div/a/div"
                ],
                [
                    "pierce/div:nth-of-type(2) > div:nth-of-type(2) a > div"
                ]
            ],
            "offsetY": 170,
            "offsetX": 180,
            "assertedEvents": [
                {
                    "type": "navigation",
                    "url": "https://online-boutique-eu.splunko11y.com/product/66VCHSJNUP",
                    "title": ""
                }
            ]
        },
        {
            "type": "click",
            "target": "main",
            "selectors": [
                [
                    "aria/ADD TO CART"
                ],
                [
                    "button"
                ],
                [
                    "xpath//html/body/main/div[1]/div/div[2]/div/form/div/button"
                ],
                [
                    "pierce/button"
                ],
                [
                    "text/Add to Cart"
                ]
            ],
            "offsetY": 35.0078125,
            "offsetX": 46.4140625,
            "assertedEvents": [
                {
                    "type": "navigation",
                    "url": "https://online-boutique-eu.splunko11y.com/cart",
                    "title": ""
                }
            ]
        },
        {
            "type": "click",
            "target": "main",
            "selectors": [
                [
                    "aria/PLACE ORDER"
                ],
                [
                    "div > div > div.py-3 button"
                ],
                [
                    "xpath//html/body/main/div/div/div[4]/div/form/div[4]/button"
                ],
                [
                    "pierce/div > div > div.py-3 button"
                ],
                [
                    "text/Place order"
                ]
            ],
            "offsetY": 29.8125,
            "offsetX": 66.8203125,
            "assertedEvents": [
                {
                    "type": "navigation",
                    "url": "https://online-boutique-eu.splunko11y.com/cart/checkout",
                    "title": ""
                }
            ]
        }
    ]
}
Last Modified Sep 19, 2024

1.2 Create Real Browser Test

In Splunk Observability Cloud, navigate to Synthetics and click on Add new test.

From the dropdown select Browser test.

Add new test Add new test

You will then be presented with the Browser test content configuration page.

New Test New Test

Last Modified Sep 19, 2024

1.3 Import JSON

To begin configuring our test, we need to import the JSON that we exported from the Chrome DevTools Recorder. To enable the Import button, we must first give our test a name e.g. <your initials> - Online Boutique.

Import Import

Once the Import button is enabled, click on it and either drop the JSON file that you exported from the Chrome DevTools Recorder or upload the file.

Import JSON Import JSON

Once the JSON file has been uploaded, click on Continue to edit steps

Import Complete Import Complete

Edit Steps Edit Steps

Before we make any edits to the test, let’s first configure the settings, click on < Return to test

Last Modified Sep 19, 2024

1.4 Settings

The simple settings allow you to configure the basics of the test:

  • Name: The name of the test (e.g. RWC - Online Boutique).
  • Details:
    • Locations: The locations where the test will run from.
    • Device: Emulate different devices and connection speeds. Also, the viewport will be adjusted to match the chosen device.
    • Frequency: How often the test will run.
    • Round-robin: If multiple locations are selected, the test will run from one location at a time, rather than all locations at once.
    • Active: Set the test to active or inactive.

![Return to Test]For this workshop, we will configure the locations that we wish to monitor from. Click in the Locations field and you will be presented with a list of global locations (over 50 in total).

Global Locations Global Locations

Select the following locations:

  • AWS - N. Virginia
  • AWS - London
  • AWS - Melbourne

Once complete, scroll down and click on Click on Submit to save the test.

The test will now be scheduled to run every 5 minutes from the 3 locations that we have selected. This does take a few minutes for the schedule to be created.

So whilst we wait for the test to be scheduled, click on Edit test so we can go through the Advanced settings.

Last Modified Sep 19, 2024

1.5 Advanced Settings

Click on Advanced, these settings are optional and can be used to further configure the test.

Note

In the case of this workshop, we will not be using any of these settings as this is for informational purposes only.

Advanced Settings Advanced Settings

  • Security:
    • TLS/SSL validation: When activated, this feature is used to enforce the validation of expired, invalid hostname, or untrusted issuer on SSL/TLS certificates.
    • Authentication: Add credentials to authenticate with sites that require additional security protocols, for example from within a corporate network. By using concealed global variables in the Authentication field, you create an additional layer of security for your credentials and simplify the ability to share credentials across checks.
  • Custom Content:
    • Custom headers: Specify custom headers to send with each request. For example, you can add a header in your request to filter out requests from analytics on the back end by sending a specific header in the requests. You can also use custom headers to set cookies.
    • Cookies: Set cookies in the browser before the test starts. For example, to prevent a popup modal from randomly appearing and interfering with your test, you can set cookies. Any cookies that are set will apply to the domain of the starting URL of the check. Splunk Synthetics Monitoring uses the public suffix list to determine the domain.
    • Host overrides: Add host override rules to reroute requests from one host to another. For example, you can create a host override to test an existing production site against page resources loaded from a development site or a specific CDN edge node.

Next, we will edit the test steps to provide more meaningful names for each step.

Last Modified Sep 19, 2024

1.6 Edit test steps

To edit the steps click on the + Edit steps or synthetic transactions button. From here, we are going to give meaningful names to each step.

Edit steps Edit steps

For each of the four steps, we are going to give them a meaningful name.

  • Step 1 replace the text Go to URL with HomePage - Online Boutique
  • Step 2 enter the text Select Vintage Camera Lens.
  • Step 3 enter Add to Cart.
  • Step 4 enter Place Order.

Step names Step names

Click < Return to test to return to the test configuration page and click Save to save the test.

You will be returned to the test dashboard where you will see test results start to appear.

Scatterplot Scatterplot

Congratulations! You have successfully created a Real Browser Test in Splunk Synthetic Monitoring. Next, we will look into a test result in more detail.

Last Modified Sep 19, 2024

1.7 View test results

In the Scatterplot from the previous step, click on one of the dots to drill into the test run data. Preferably, select the most recent test run (farthest to the right).

Drilldown Drilldown