Learn how to enable automatic discovery and configuration for your Java-based application running in Kubernetes. Experience real-time monitoring to help you maximize application behavior with end-to-end visibility.
A workshop using Zero Configuration Auto-Instrumentation for NodeJS.
Subsections of Automatic Discovery Workshops
PetClinic Monolith Workshop
30 minutesAuthor
Robert Castley
The goal is to walk through the basic steps to configure the following components of the Splunk Observability Cloud platform:
Splunk Infrastructure Monitoring (IM)
Splunk Automatic Discovery for Java (APM)
Database Query Performance
AlwaysOn Profiling
Splunk Real User Monitoring (RUM)
RUM to APM Correlation
Splunk Log Observer (LO)
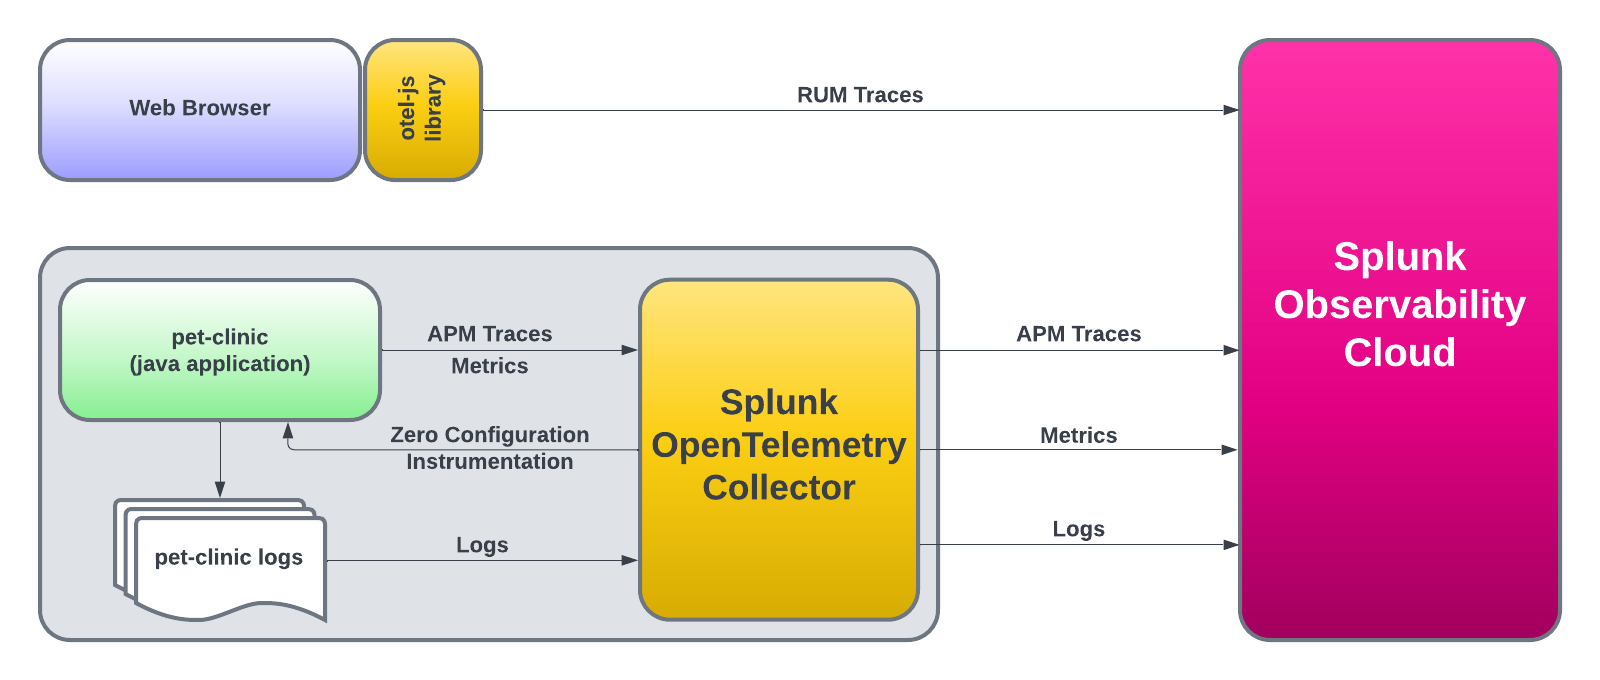
We will also show the steps about how to clone (download) a sample Java application (Spring PetClinic), as well as how to compile, package and run the application.
Once the application is up and running, we will instantly start seeing metrics, traces and logs via the automatic discovery and configuration for Java 2.x that will be used by the Splunk APM product.
After that, we will instrument PetClinic’s end user interface (HTML pages rendered by the application) with the Splunk OpenTelemetry Javascript Libraries (RUM) that will generate RUM traces around all the individual clicks and page loads executed by an end user.
Lastly, we will view the logs generated by the automatic injection of trace metadata into the PetClinic application logs.
Prerequisites
Outbound SSH access to port 2222.
Outbound HTTP access to port 8083.
Familiarity with the bash shell and vi/vim editor.
Subsections of PetClinic Monolith Workshop
Installing the OpenTelemetry Collector
The Splunk OpenTelemetry Collector is the core component of instrumenting infrastructure and applications. Its role is to collect and send:
Infrastructure metrics (disk, CPU, memory, etc)
Application Performance Monitoring (APM) traces
Profiling data
Host and application logs
Remove any existing OpenTelemetry Collectors
If you have completed the Splunk IM workshop, please ensure you have deleted the collector running in Kubernetes before continuing. This can be done by running the following command:
helm delete splunk-otel-collector
To ensure your instance is configured correctly, we need to confirm that the required environment variables for this workshop are set correctly. In your terminal run the following command:
. ~/workshop/scripts/check_env.sh
In the output check that all of the following environment variables are present and have values set. If any are missing, please contact your instructor:
We can then go ahead and install the Collector. Some additional parameters are passed to the install script, they are:
--with-instrumentation - This will install the agent from the Splunk distribution of OpenTelemetry Java, which is then loaded automatically when the PetClinic Java application starts up. No configuration is required!
--deployment-environment - Sets the resource attribute deployment.environment to the value passed. This is used to filter views in the UI.
--enable-profiler - Enables the profiler for the Java application. This will generate CPU profiles for the application.
--enable-profiler-memory - Enables the profiler for the Java application. This will generate memory profiles for the application.
--enable-metrics - Enables the exporting of Micrometer metrics
--hec-token - Sets the HEC token for the collector to use
--hec-url - Sets the HEC URL for the collector to use
Next, we will patch the collector to expose the hostname of the instance and not the AWS instance ID. This will make it easier to filter data in the UI:
Once the agent_config.yaml has been patched, you will need to restart the collector:
sudo systemctl restart splunk-otel-collector
Once the installation is completed, you can navigate to the Hosts with agent installed dashboard to see the data from your host, Dashboards → Hosts with agent installed.
Use the dashboard filter and select host.name and type or select the hostname of your workshop instance (you can get this from the command prompt in your terminal session). Once you see data flowing for your host, we are then ready to get started with the APM component.
Building the Spring PetClinic Application
The first thing we need to set up APM is… well, an application. For this exercise, we will use the Spring PetClinic application. This is a very popular sample Java application built with the Spring framework (Springboot).
First, clone the PetClinic GitHub repository, and then we will compile, build, package and test the application:
Next, we will start another container running Locust that will generate some simple traffic to the PetClinic application. Locust is a simple load-testing tool that can be used to generate traffic to a web application.
Next, compile, build and package PetClinic using maven:
./mvnw package -Dmaven.test.skip=true
[!INFO]
This will take a few minutes the first time you run and will download a lot of dependencies before it compiles the application. Future builds will be a lot quicker.
Once the build completes, you need to obtain the public IP address of the instance you are running on. You can do this by running the following command:
curl http://ifconfig.me
You will see an IP address returned, make a note of this as we will need it to validate that the application is running.
Automatic discovery and configuration for Java
You can now start the application with the following command. Notice that we are passing the mysql profile to the application, this will tell the application to use the MySQL database we started earlier. We are also setting the otel.service.name and otel.resource.attributes to a logical names using the instance name. These will also be used in the UI for filtering:
You can validate the application is running by visiting http://<IP_ADDRESS>:8083 (replace <IP_ADDRESS> with the IP address you obtained earlier).
When we installed the collector we configured it to enable AlwaysOn Profiling and Metrics. This means that the collector will automatically generate CPU and Memory profiles for the application and send them to Splunk Observability Cloud.
When you start the PetClinic application you will see the collector automatically detect the application and instrument it for traces and profiling.
Picked up JAVA_TOOL_OPTIONS: -javaagent:/usr/lib/splunk-instrumentation/splunk-otel-javaagent.jar
OpenJDK 64-Bit Server VM warning: Sharing is only supported for boot loader classes because bootstrap classpath has been appended
[otel.javaagent 2024-08-20 11:35:58:970 +0000] [main] INFO io.opentelemetry.javaagent.tooling.VersionLogger - opentelemetry-javaagent - version: splunk-2.6.0-otel-2.6.0
[otel.javaagent 2024-08-20 11:35:59:730 +0000] [main] INFO com.splunk.opentelemetry.profiler.ConfigurationLogger - -----------------------
[otel.javaagent 2024-08-20 11:35:59:730 +0000] [main] INFO com.splunk.opentelemetry.profiler.ConfigurationLogger - Profiler configuration:
[otel.javaagent 2024-08-20 11:35:59:730 +0000] [main] INFO com.splunk.opentelemetry.profiler.ConfigurationLogger -                  splunk.profiler.enabled : true
[otel.javaagent 2024-08-20 11:35:59:731 +0000] [main] INFO com.splunk.opentelemetry.profiler.ConfigurationLogger -                splunk.profiler.directory : /tmp
[otel.javaagent 2024-08-20 11:35:59:731 +0000] [main] INFO com.splunk.opentelemetry.profiler.ConfigurationLogger -       splunk.profiler.recording.duration : 20s
[otel.javaagent 2024-08-20 11:35:59:731 +0000] [main] INFO com.splunk.opentelemetry.profiler.ConfigurationLogger -               splunk.profiler.keep-files : false
[otel.javaagent 2024-08-20 11:35:59:732 +0000] [main] INFO com.splunk.opentelemetry.profiler.ConfigurationLogger -            splunk.profiler.logs-endpoint : null
[otel.javaagent 2024-08-20 11:35:59:732 +0000] [main] INFO com.splunk.opentelemetry.profiler.ConfigurationLogger -              otel.exporter.otlp.endpoint : null
[otel.javaagent 2024-08-20 11:35:59:732 +0000] [main] INFO com.splunk.opentelemetry.profiler.ConfigurationLogger -           splunk.profiler.memory.enabled : true
[otel.javaagent 2024-08-20 11:35:59:732 +0000] [main] INFO com.splunk.opentelemetry.profiler.ConfigurationLogger -        splunk.profiler.memory.event.rate : 150/s
[otel.javaagent 2024-08-20 11:35:59:732 +0000] [main] INFO com.splunk.opentelemetry.profiler.ConfigurationLogger -      splunk.profiler.call.stack.interval : PT10S
[otel.javaagent 2024-08-20 11:35:59:733 +0000] [main] INFO com.splunk.opentelemetry.profiler.ConfigurationLogger -  splunk.profiler.include.internal.stacks : false
[otel.javaagent 2024-08-20 11:35:59:733 +0000] [main] INFO com.splunk.opentelemetry.profiler.ConfigurationLogger -      splunk.profiler.tracing.stacks.only : false
[otel.javaagent 2024-08-20 11:35:59:733 +0000] [main] INFO com.splunk.opentelemetry.profiler.ConfigurationLogger - -----------------------
[otel.javaagent 2024-08-20 11:35:59:733 +0000] [main] INFO com.splunk.opentelemetry.profiler.JfrActivator - Profiler is active.
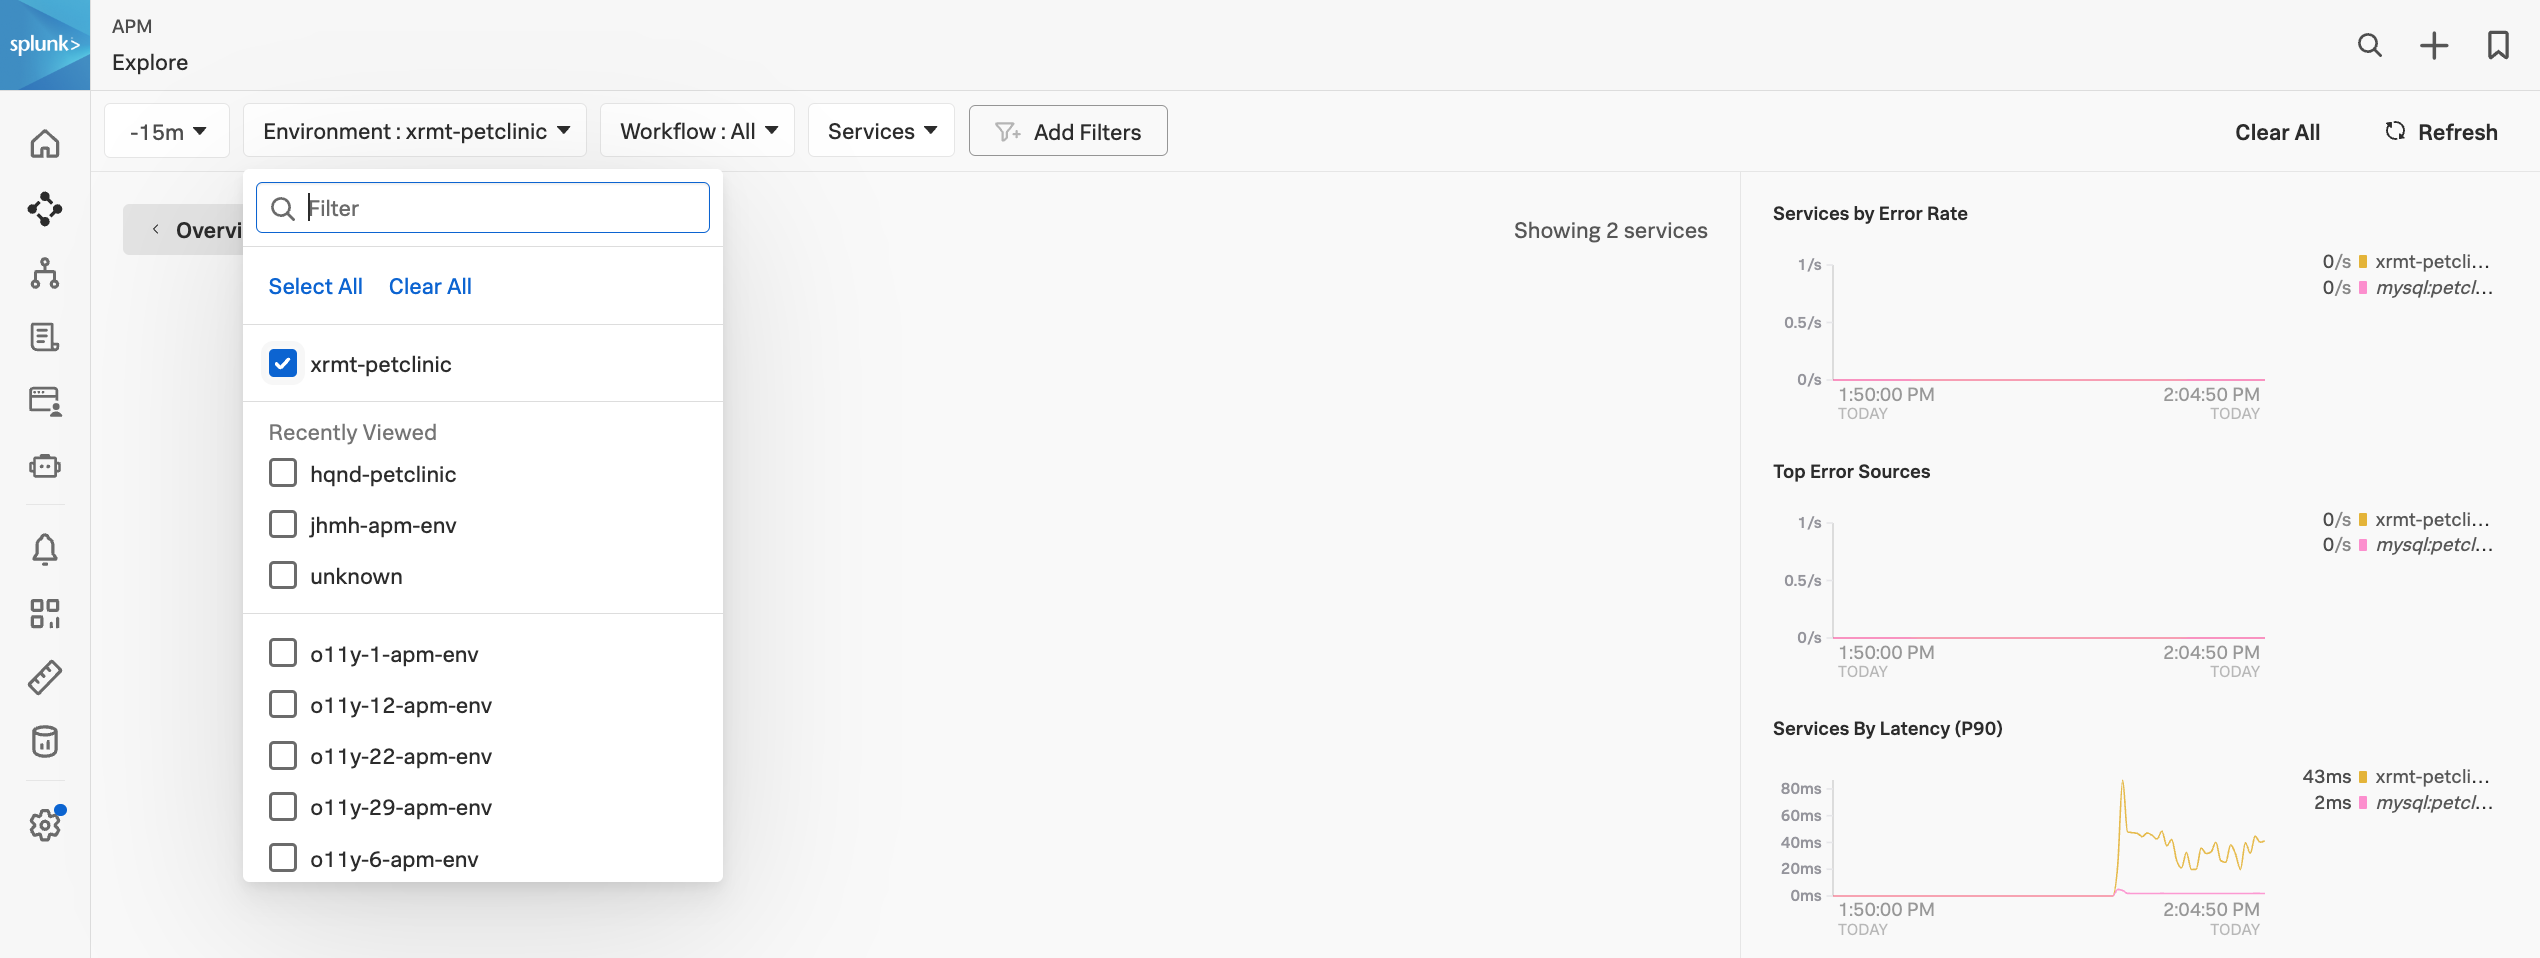
You can now visit the Splunk APM UI and examine the application components, traces, profiling, DB Query performance and metrics. From the left-hand menu APM → Explore, click the environment dropdown and select your environment e.g. <INSTANCE>-petclinic (where<INSTANCE> is replaced with the value you noted down earlier).
Once your validation is complete you can stop the application by pressing Ctrl-c.
Resource attributes can be added to every reported span. For example version=0.314. A comma-separated list of resource attributes can also be defined e.g. key1=val1,key2=val2.
Let’s launch the PetClinic again using new resource attributes. Note, that adding resource attributes to the run command will override what was defined when we installed the collector. Let’s add a new resource attribute version=0.314:
Back in the Splunk APM UI we can drill down on a recent trace and see the new version attribute in a span.
3. Real User Monitoring
For the Real User Monitoring (RUM) instrumentation, we will add the Open Telemetry Javascript https://github.com/signalfx/splunk-otel-js-web snippet in the pages, we will use the wizard again Data Management → Add Integration → RUM Instrumentation → Browser Instrumentation.
Your instructor will inform you which token to use from the dropdown, click Next. Enter App name and Environment using the following syntax:
<INSTANCE>-petclinic-service - replacing <INSTANCE> with the value you noted down earlier.
<INSTANCE>-petclinic-env - replacing <INSTANCE> with the value you noted down earlier.
The wizard will then show a snippet of HTML code that needs to be placed at the top of the pages in the <head> section. The following is an example of the (do not use this snippet, use the one generated by the wizard):
/*
IMPORTANT: Replace the <version> placeholder in the src URL with a
version from https://github.com/signalfx/splunk-otel-js-web/releases
*/
<scriptsrc="https://cdn.signalfx.com/o11y-gdi-rum/latest/splunk-otel-web.js"crossorigin="anonymous"></script><script>SplunkRum.init({realm:"eu0",rumAccessToken:"<redacted>",applicationName:"petclinic-1be0-petclinic-service",deploymentEnvironment:"petclinic-1be0-petclinic-env"});</script>
The Spring PetClinic application uses a single HTML page as the “layout” page, that is reused across all pages of the application. This is the perfect location to insert the Splunk RUM Instrumentation Library as it will be loaded in all pages automatically.
Let’s then edit the layout page:
vi src/main/resources/templates/fragments/layout.html
Next, insert the snippet we generated above in the <head> section of the page. Make sure you don’t include the comment and replace <version> in the source URL to latest e.g.
Then let’s visit the application using a browser to generate real-user traffic http://<IP_ADDRESS>:8083.
In RUM, filter down into the environment as defined in the RUM snippet above and click through to the dashboard.
When you drill down into a RUM trace you will see a link to APM in the spans. Clicking on the trace ID will take you to the corresponding APM trace for the current RUM trace.
4. Log Observer
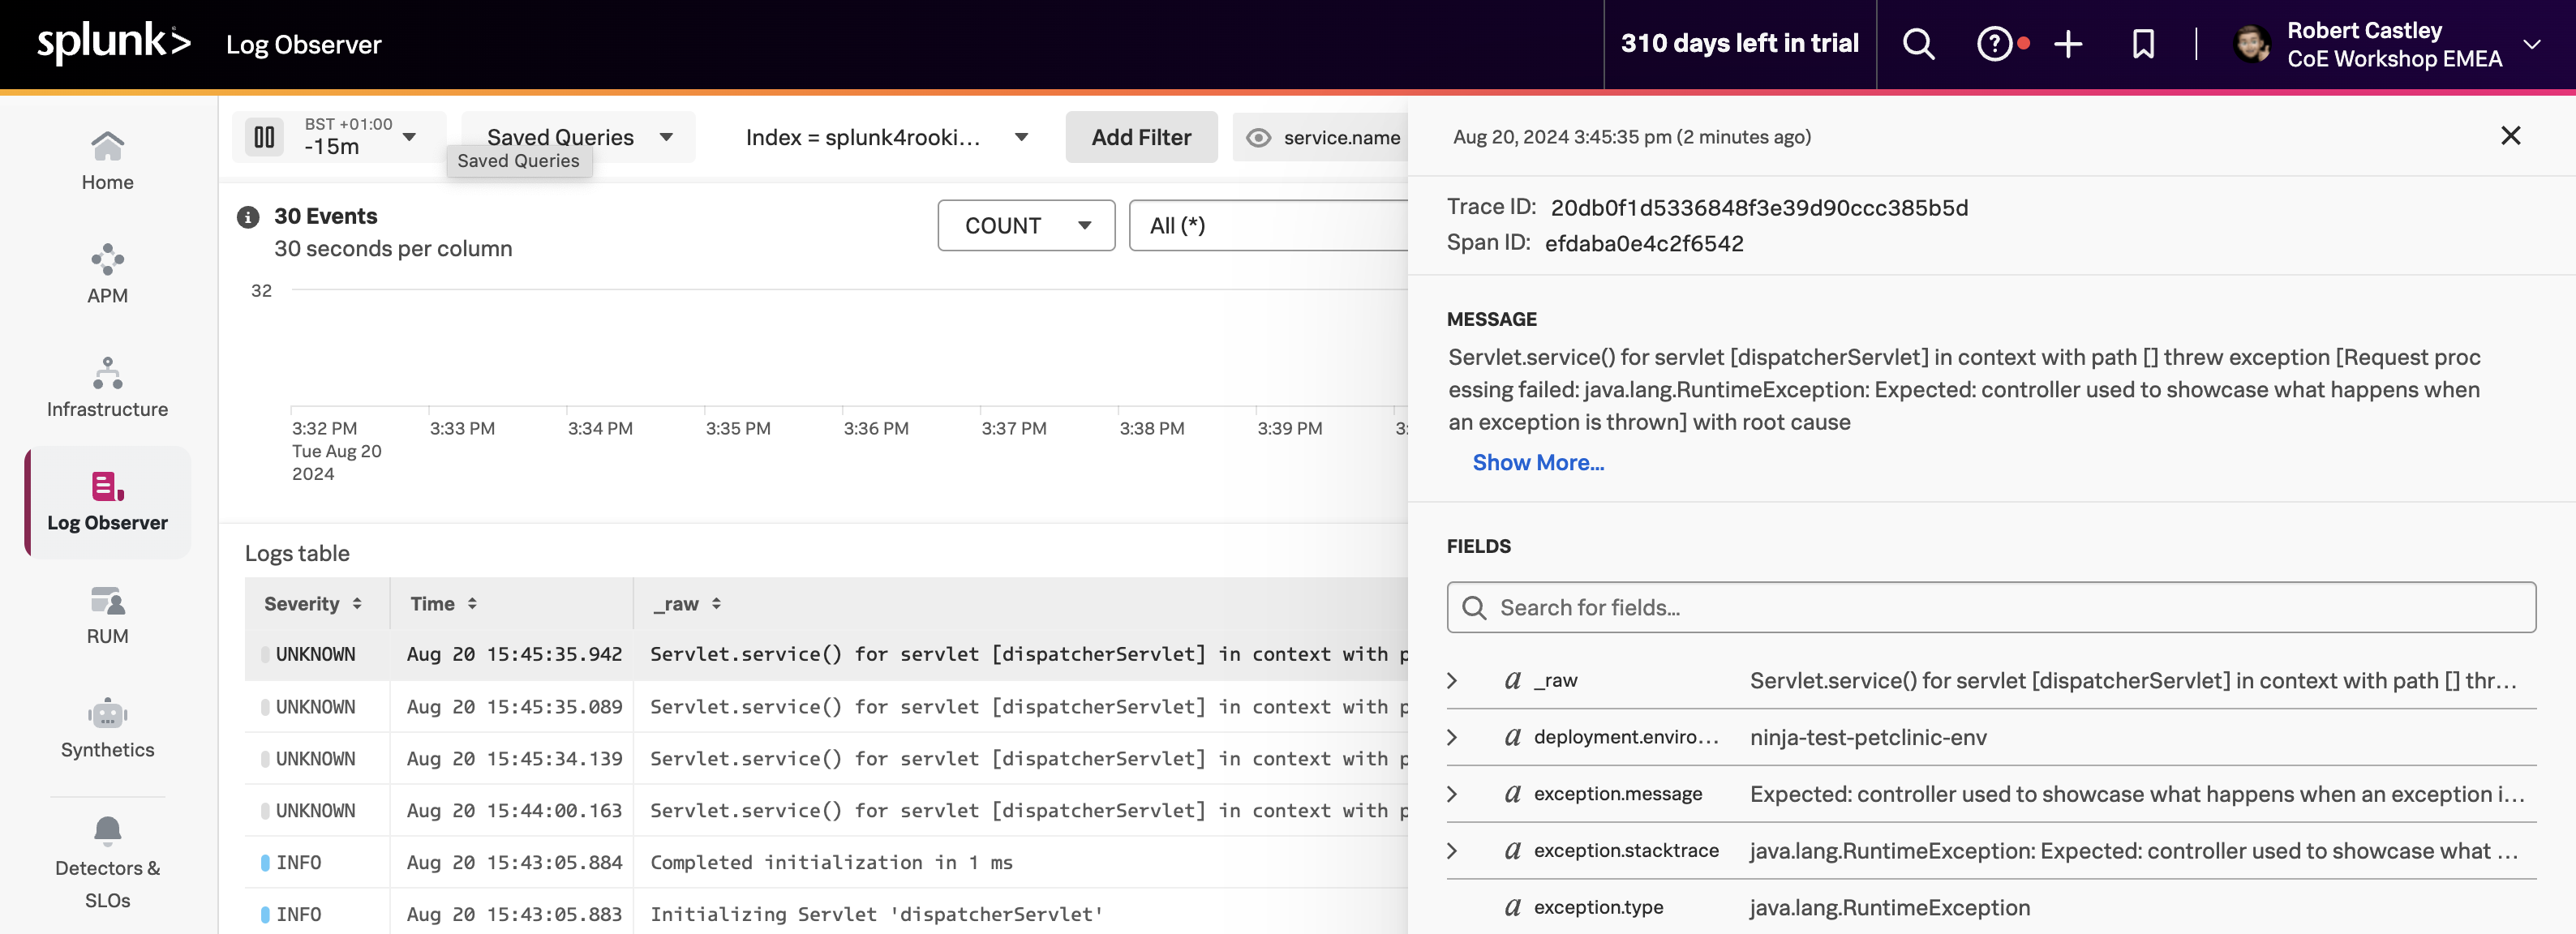
For the Splunk Log Observer component, the Splunk OpenTelemetry Collector automatically collects logs from the Spring PetClinic application and sends them to Splunk Observability Cloud using the OTLP exporter, anotating the log events with trace_id, span_id and trace flags.
Log Observer provides a real-time view of logs from your applications and infrastructure. It allows you to search, filter, and analyze logs to troubleshoot issues and monitor your environment.
Go back to the PetClinic web application and click on the Error link several times. This will generate some log messages in the PetClinic application logs.
From the left-hand menu click on Log Observer and ensure Index is set to splunk4rookies-workshop.
Next, click Add Filter search for the field service.name select the value <INSTANCE>-petclinic-service and click = (include). You should now see only the log messages from your PetClinic application.
Select one of the log entries that were generated by clicking on the Error link in the PetClinic application. You will see the log message and the trace metadata that was automatically injected into the log message. Also, you will notice that Related Content is available for APM and Infrastructure.
This is the end of the workshop and we have certainly covered a lot of ground. At this point, you should have metrics, traces (APM & RUM), logs, database query performance and code profiling being reported into Splunk Observability Cloud and all without having to modify the PetClinic application code (well except for RUM).
Congratulations!
Spring PetClinic SpringBoot Based Microservices On Kubernetes
90 minutesAuthor
Pieter Hagen
The goal of this workshop is to introduce the features of Splunk’s automatic discovery and configuration for Java.
The workshop scenario will be created by installing a simple (un-instrumented) Java microservices application in Kubernetes.
By following the simple steps to install the Splunk OpenTelemetry Collector and enabling automatic discovery and configuration for existing Java based deployments you will learn how easy it is to send metrics, traces and logs to Splunk Observability Cloud.
Prerequisites
Outbound SSH access to port 2222.
Outbound HTTP access to port 81.
Familiarity with the Linux command line.
During this workshop we will cover the following components:
Splunk Infrastructure Monitoring (IM)
Splunk automatic discovery and configuration for Java (APM)
Database Query Performance
AlwaysOn Profiling
Splunk Log Observer (LO)
Splunk Real User Monitoring (RUM)
Splunk Synthetics is feeling a little left out here, but we cover that in other workshops
Subsections of Spring PetClinic SpringBoot Based Microservices On Kubernetes
Architecture
5 minutes
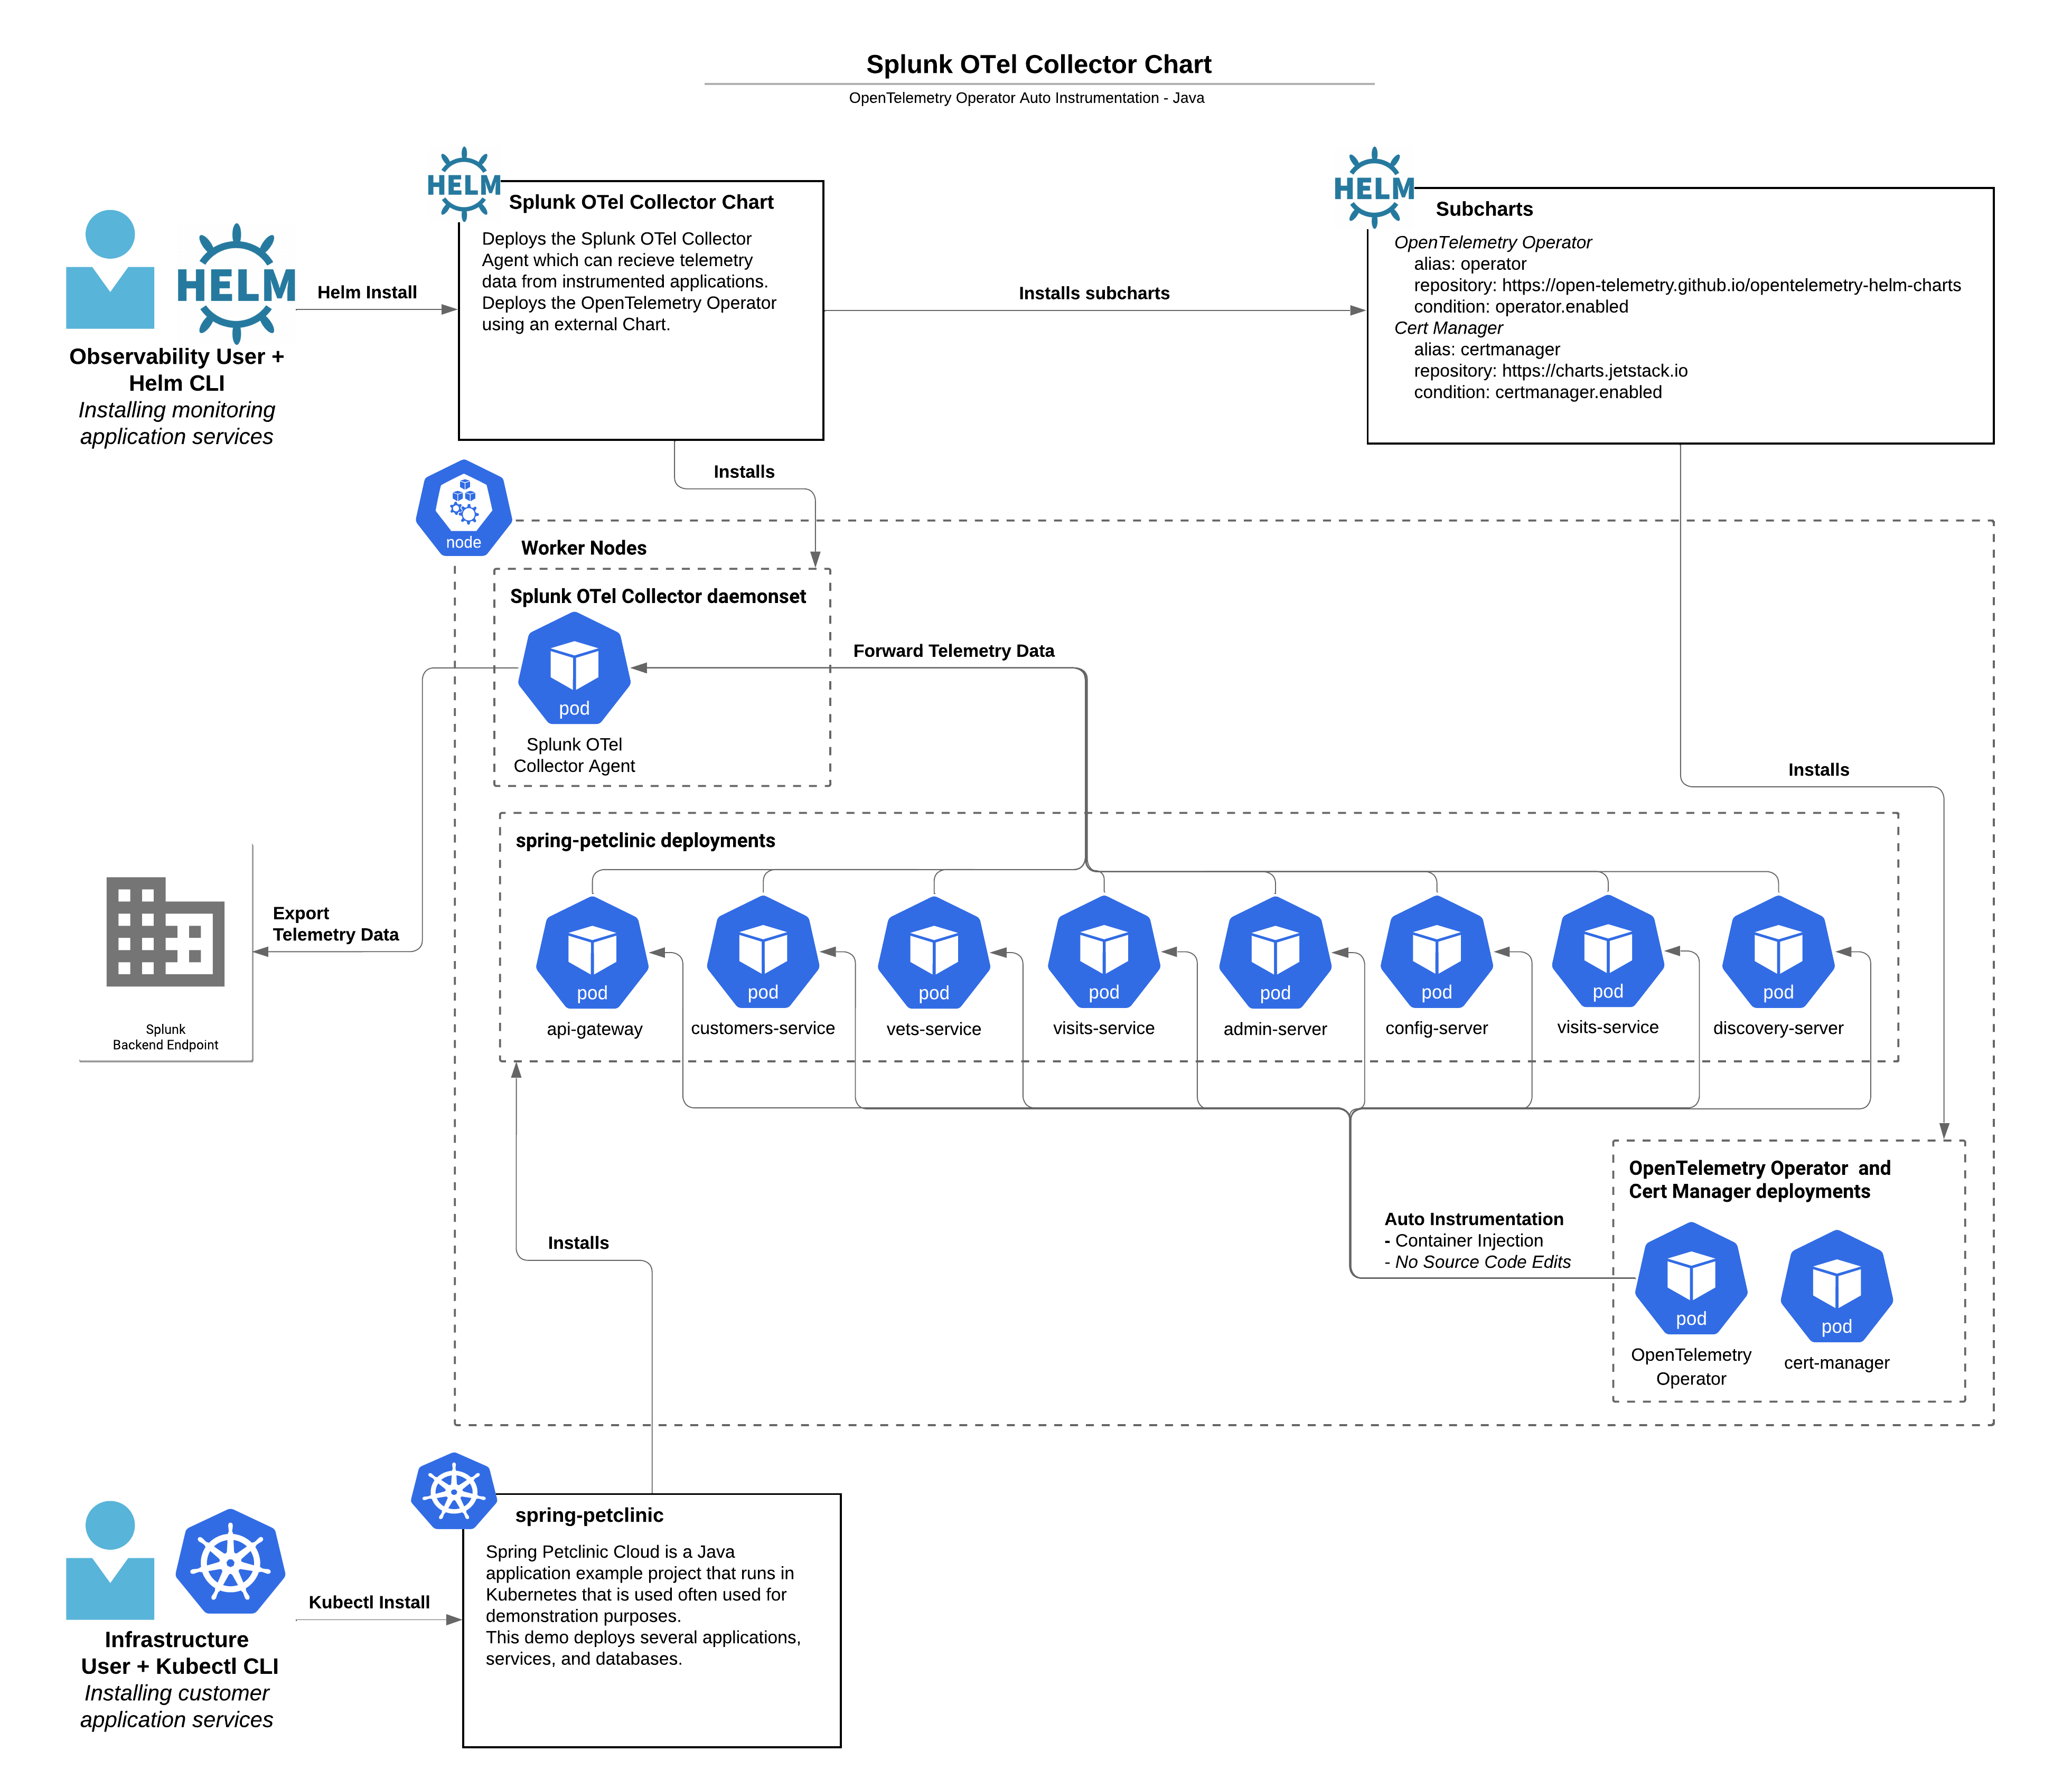
The diagram below details the architecture of the Spring PetClinic Java application running in Kubernetes with the Splunk OpenTelemetry Operator and automatic discovery and configuration enabled.
The Spring PetClinic Java application is a simple microservices application that consists of a frontend and backend services. The frontend service is a Spring Boot application that serves a web interface to interact with the backend services. The backend services are Spring Boot applications that serve RESTful API’s to interact with a MySQL database.
By the end of this workshop, you will have a better understanding of how to enable automatic discovery and configuration for your Java-based applications running in Kubernetes.
The instructor will provide you with the login information for the instance that we will be using during the workshop.
When you first log into your instance, you will be greeted by the Splunk Logo as shown below. If you have any issues connecting to your workshop instance then please reach out to your Instructor.
$ ssh -p 2222 splunk@<ip-address>

███████╗██████╗ ██╗     ██╗   ██╗███╗   ██╗██╗  ██╗    ██╗
██╔════╝██╔══██╗██║     ██║   ██║████╗  ██║██║ ██╔╝    ╚██╗
███████╗██████╔╝██║     ██║   ██║██╔██╗ ██║█████╔╝      ╚██╗
╚════██║██╔═══╝ ██║     ██║   ██║██║╚██╗██║██╔═██╗      ██╔╝
███████║██║     ███████╗╚██████╔╝██║ ╚████║██║  ██╗    ██╔╝
╚══════╝╚═╝     ╚══════╝ ╚═════╝ ╚═╝  ╚═══╝╚═╝  ╚═╝    ╚═╝
Last login: Mon Feb  5 11:04:54 2024 from [Redacted]
Waiting for cloud-init status...
Your instance is ready!
splunk@show-no-config-i-0d1b29d967cb2e6ff:~$
To ensure your instance is configured correctly, we need to confirm that the required environment variables for this workshop are set correctly. In your terminal run the following script and check that the environment variables are present and set with actual valid values:
Please make a note of the INSTANCE environment variable value as this will used later to filter data in Splunk Observability Cloud.
For this workshop, all of the above are required. If any have values missing, please contact your Instructor.
Delete any existing OpenTelemetry Collectors
If you have previously completed a Splunk Observability workshop using this EC2 instance, you need to ensure that any existing installation of the Splunk OpenTelemetry Collector is deleted. This can be achieved by running the following command:
helm delete splunk-otel-collector
Subsections of Preparation of the Workshop instance
Deploy the Splunk OpenTelemetry Collector
To get Observability signals (metrics, traces and logs) into Splunk Observability Cloud the Splunk OpenTelemetry Collector needs to be deployed into the Kubernetes cluster.
For this workshop, we will be using the Splunk OpenTelemetry Collector Helm Chart. First we need to add the Helm chart repository to Helm and update to ensure the latest version:
Using ACCESS_TOKEN={REDACTED}
Using REALM=eu0
"splunk-otel-collector-chart" has been added to your repositories
Using ACCESS_TOKEN={REDACTED}
Using REALM=eu0
Hang tight while we grab the latest from your chart repositories...
...Successfully got an update from the "splunk-otel-collector-chart" chart repository
Update Complete. ⎈Happy Helming!⎈
Splunk Observability Cloud offers wizards in the UI to walk you through the setup of the OpenTelemetry Collector on Kubernetes, but in the interest of time, we will use the Helm install command below. Additional parameters are set to enable the operator and automatic discovery and configuration.
--set="operator.enabled=true" - this will install the Opentelemetry operator that will be used to handle automatic discovery and configuration.
--set="certmanager.enabled=true" - this will install the required certificate manager for the operator.
--set="splunkObservability.profilingEnabled=true" - this enables Code Profiling via the operator.
To install the collector run the following command, do NOT edit this:
LAST DEPLOYED: Fri Apr 19 09:39:54 2024
NAMESPACE: default
STATUS: deployed
REVISION: 1
NOTES:
Splunk OpenTelemetry Collector is installed and configured to send data to Splunk Platform endpoint "https://http-inputs-o11y-workshop-eu0.splunkcloud.com:443/services/collector/event".

Splunk OpenTelemetry Collector is installed and configured to send data to Splunk Observability realm eu0.

[INFO] You've enabled the operator's auto-instrumentation feature (operator.enabled=true), currently considered ALPHA.
  - Instrumentation library maturity varies (e.g., Java is more mature than Go). For library stability, visit: https://opentelemetry.io/docs/instrumentation/#status-and-releases
  - Some libraries may be enabled by default. For current status, see: https://github.com/open-telemetry/opentelemetry-operator#controlling-instrumentation-capabilities
  - Splunk provides best-effort support for native OpenTelemetry libraries, and full support for Splunk library distributions. For used libraries, refer to the values.yaml under "operator.instrumentation.spec".
Ensure the Pods are reported as Running before continuing (this typically takes around 30 seconds).
Ensure there are no errors reported by the Splunk OpenTelemetry Collector (press ctrl + c to exit) or use the installed awesomek9s terminal UI for bonus points!
2021-03-21T16:11:10.900Z        INFO    service/service.go:364  Starting receivers...
2021-03-21T16:11:10.900Z        INFO    builder/receivers_builder.go:70 Receiver is starting... {"component_kind": "receiver", "component_type": "prometheus", "component_name": "prometheus"}
2021-03-21T16:11:11.009Z        INFO    builder/receivers_builder.go:75 Receiver started.       {"component_kind": "receiver", "component_type": "prometheus", "component_name": "prometheus"}
2021-03-21T16:11:11.009Z        INFO    builder/receivers_builder.go:70 Receiver is starting... {"component_kind": "receiver", "component_type": "k8s_cluster", "component_name": "k8s_cluster"}
2021-03-21T16:11:11.009Z        INFO    k8sclusterreceiver@v0.21.0/watcher.go:195       Configured Kubernetes MetadataExporter  {"component_kind": "receiver", "component_type": "k8s_cluster", "component_name": "k8s_cluster", "exporter_name": "signalfx"}
2021-03-21T16:11:11.009Z        INFO    builder/receivers_builder.go:75 Receiver started.       {"component_kind": "receiver", "component_type": "k8s_cluster", "component_name": "k8s_cluster"}
2021-03-21T16:11:11.009Z        INFO    healthcheck/handler.go:128      Health Check state change       {"component_kind": "extension", "component_type": "health_check", "component_name": "health_check", "status": "ready"}
2021-03-21T16:11:11.009Z        INFO    service/service.go:267  Everything is ready. Begin running and processing data.
2021-03-21T16:11:11.009Z        INFO    k8sclusterreceiver@v0.21.0/receiver.go:59       Starting shared informers and wait for initial cache sync.      {"component_kind": "receiver", "component_type": "k8s_cluster", "component_name": "k8s_cluster"}
2021-03-21T16:11:11.281Z        INFO    k8sclusterreceiver@v0.21.0/receiver.go:75       Completed syncing shared informer caches.       {"component_kind": "receiver", "component_type": "k8s_cluster", "component_name": "k8s_cluster"}
Deleting a failed installation
If you make an error installing the OpenTelemetry Collector you can start over by deleting the installation with the following command:
helm delete splunk-otel-collector
Deploy the PetClinic Application
The first deployment of our application will be using prebuilt containers to give us the base scenario: a regular Java microservices-based application running in Kubernetes that we want to start observing. So let’s deploy our application:
deployment.apps/config-server created
service/config-server created
deployment.apps/discovery-server created
service/discovery-server created
deployment.apps/api-gateway created
service/api-gateway created
service/api-gateway-external created
deployment.apps/customers-service created
service/customers-service created
deployment.apps/vets-service created
service/vets-service created
deployment.apps/visits-service created
service/visits-service created
deployment.apps/admin-server created
service/admin-server created
service/petclinic-db created
deployment.apps/petclinic-db created
configmap/petclinic-db-initdb-config created
deployment.apps/petclinic-loadgen-deployment created
configmap/scriptfile created
At this point, we can verify the deployment by checking if the Pods are running. The containers need to be downloaded and started so this may take a couple of minutes.
Make sure the output of kubectl get pods matches the output as shown above. Ensure all the services are shown as Running (or use k9s to contuuously monitor the status).
Once they are running, the application will take a few minutes to fully start up, create the database and synchronize all the services, so let’s use the time to check the local private repository is active.
Verify the local Private Registry
Later on, when we test our automatic discovery and configuration we are going to build new containers to highlight some of the additional features of Splunk Observability Cloud.
As configuration files and source code will be changed, the containers will need to be built and stored in a local private registry (which has already been enabled for you).
To check if the private registry is avaiable, run the following command (this will return an empty list):
curl -X GET http://localhost:9999/v2/_catalog
**{"repositories":[]}**
Verify Kubernetes Cluster metrics
10 minutes
Once the installation has been completed, you can log in to Splunk Observability Cloud and verify that the metrics are flowing in from your Kubernetes cluster.
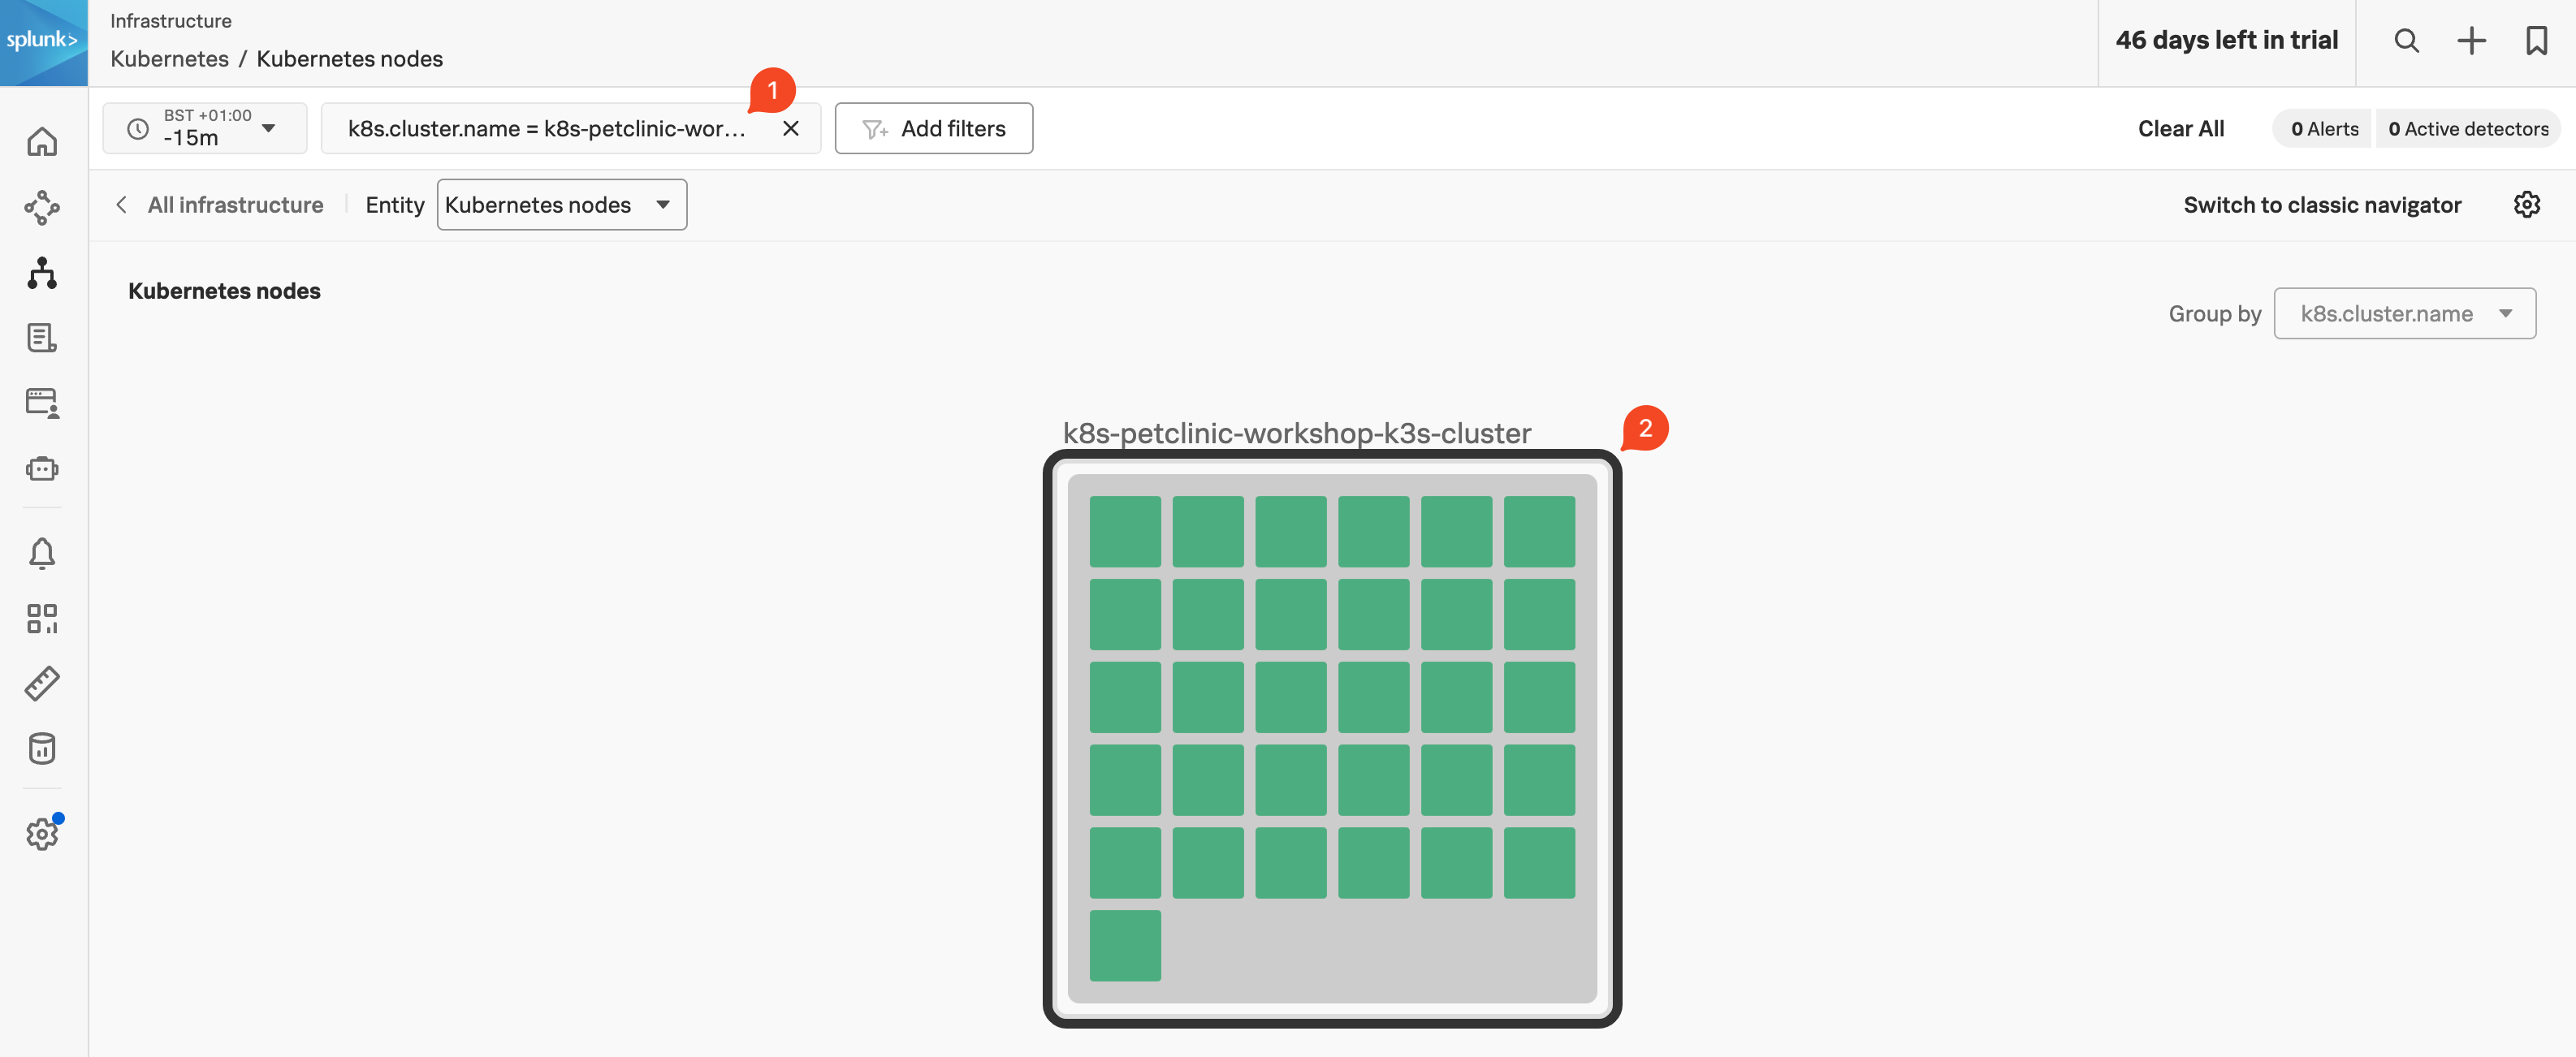
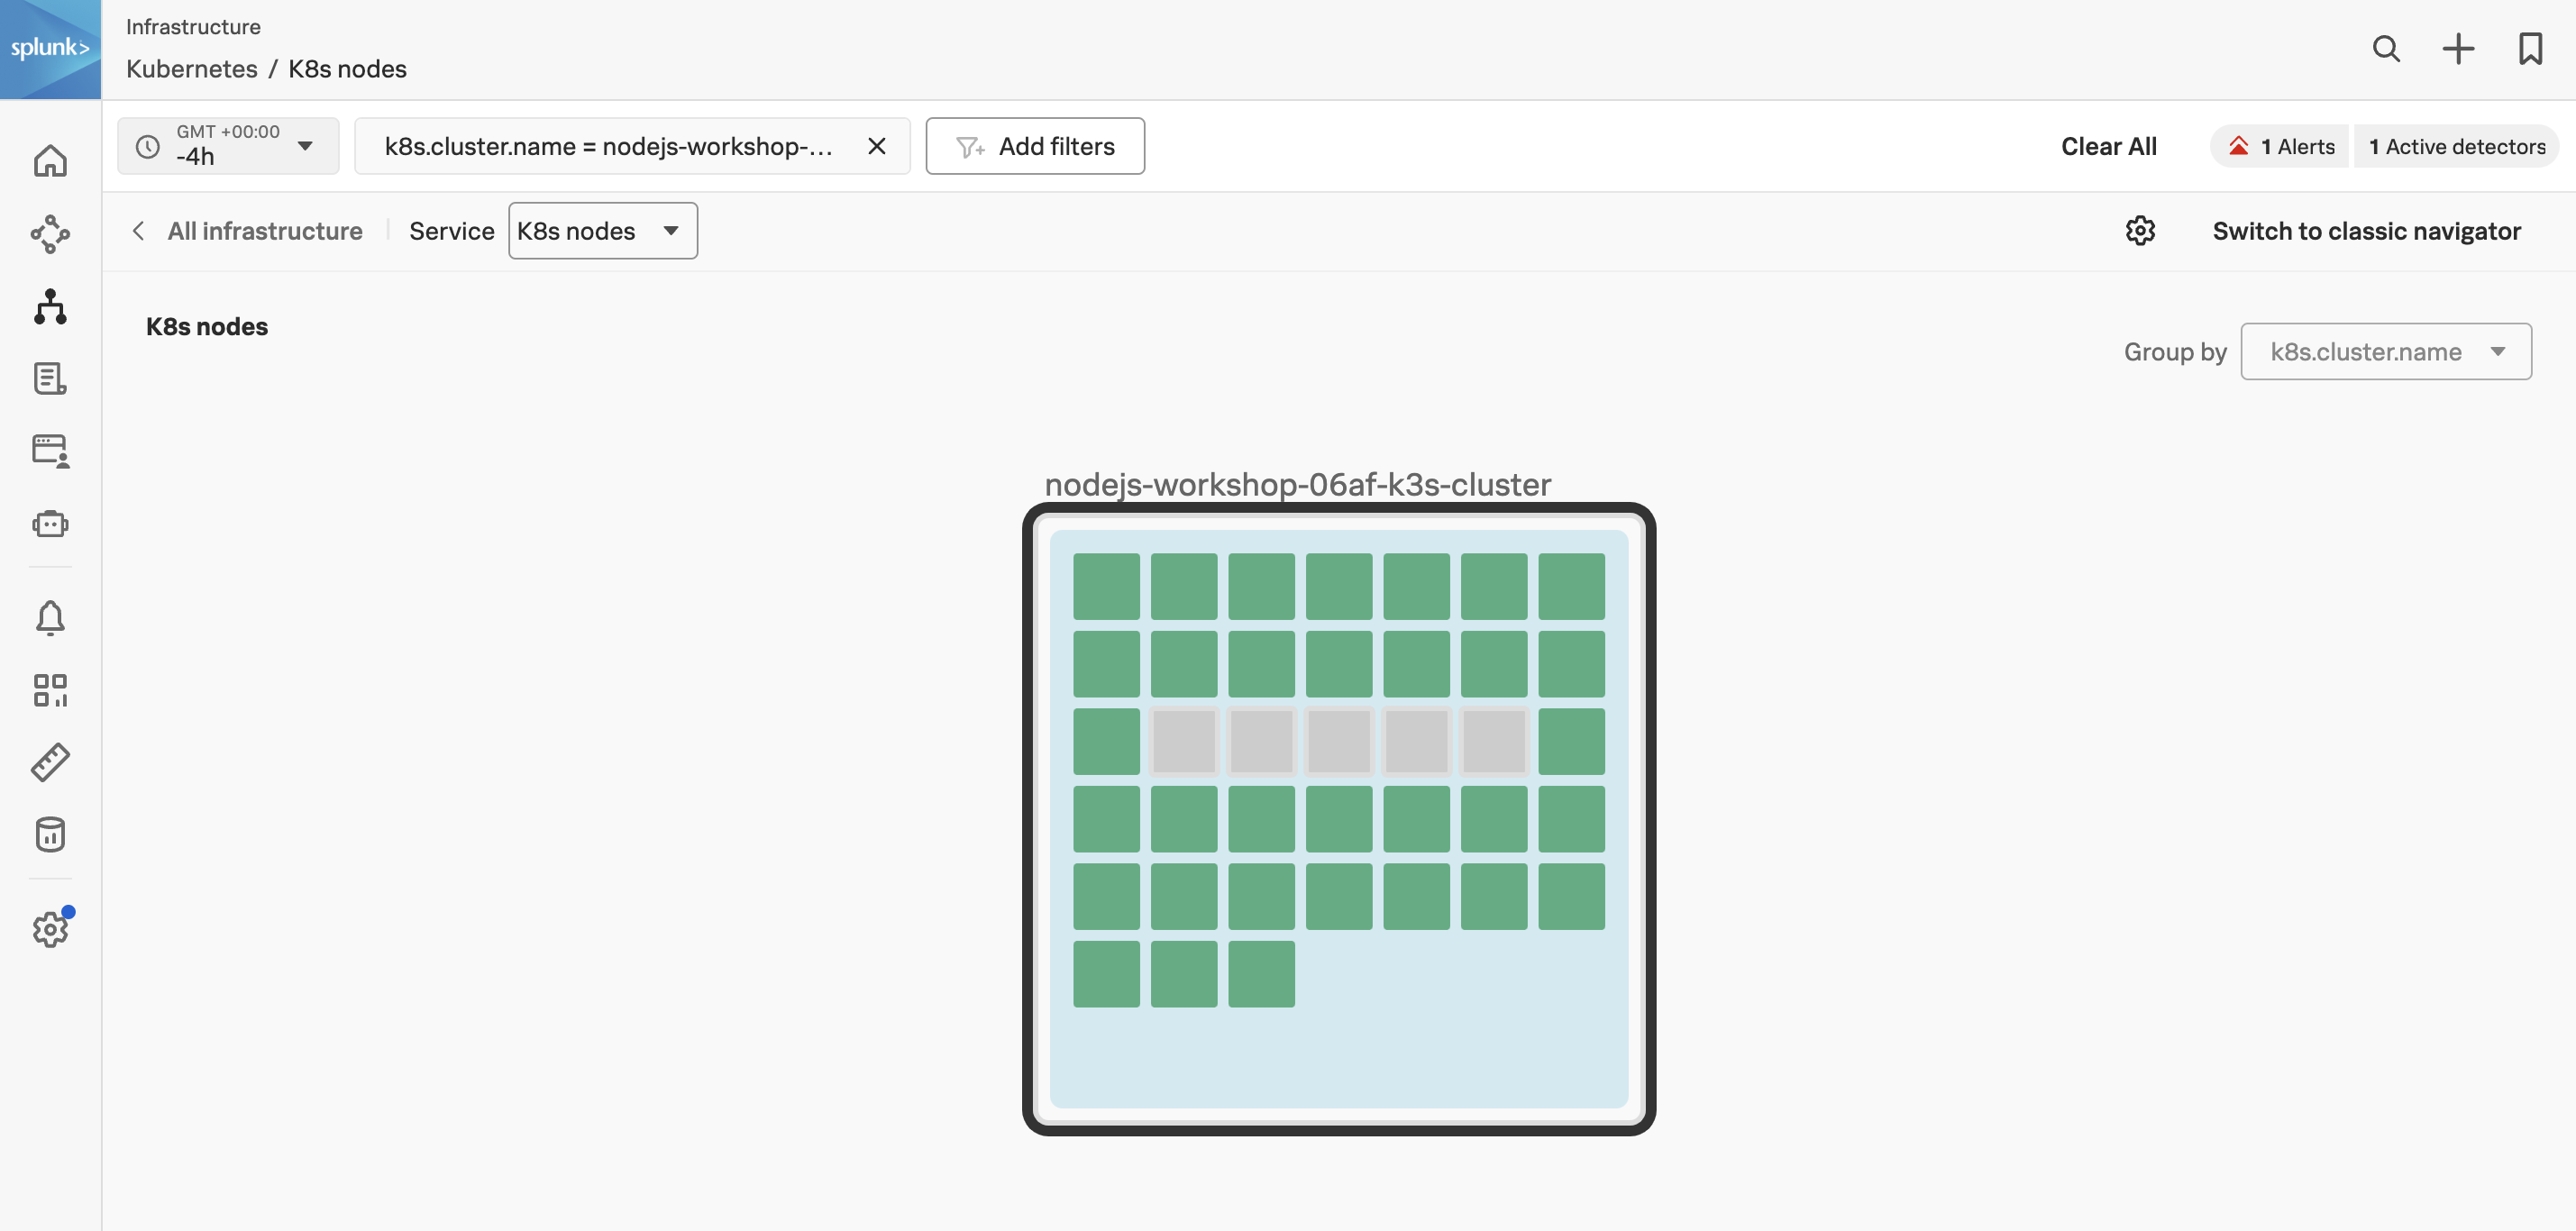
From the left-hand menu click on Infrastructure and select Kubernetes, then select the Kubernetes nodes pane. Once you are in the Kubernetes nodes view, change the Time filter from -4h to the last 15 minutes (-15m) to focus on the latest data.
Next, click Add filters (next to the Time filter) and add the filter k8s.cluster.name(1). Type or select the cluster name of your workshop instance (you can get the unique part from your cluster name by using the INSTANCE from the output from the shell script you ran earlier). You can also select your cluster by clicking on its image in the cluster pane. You will now only have your cluster visible (2).
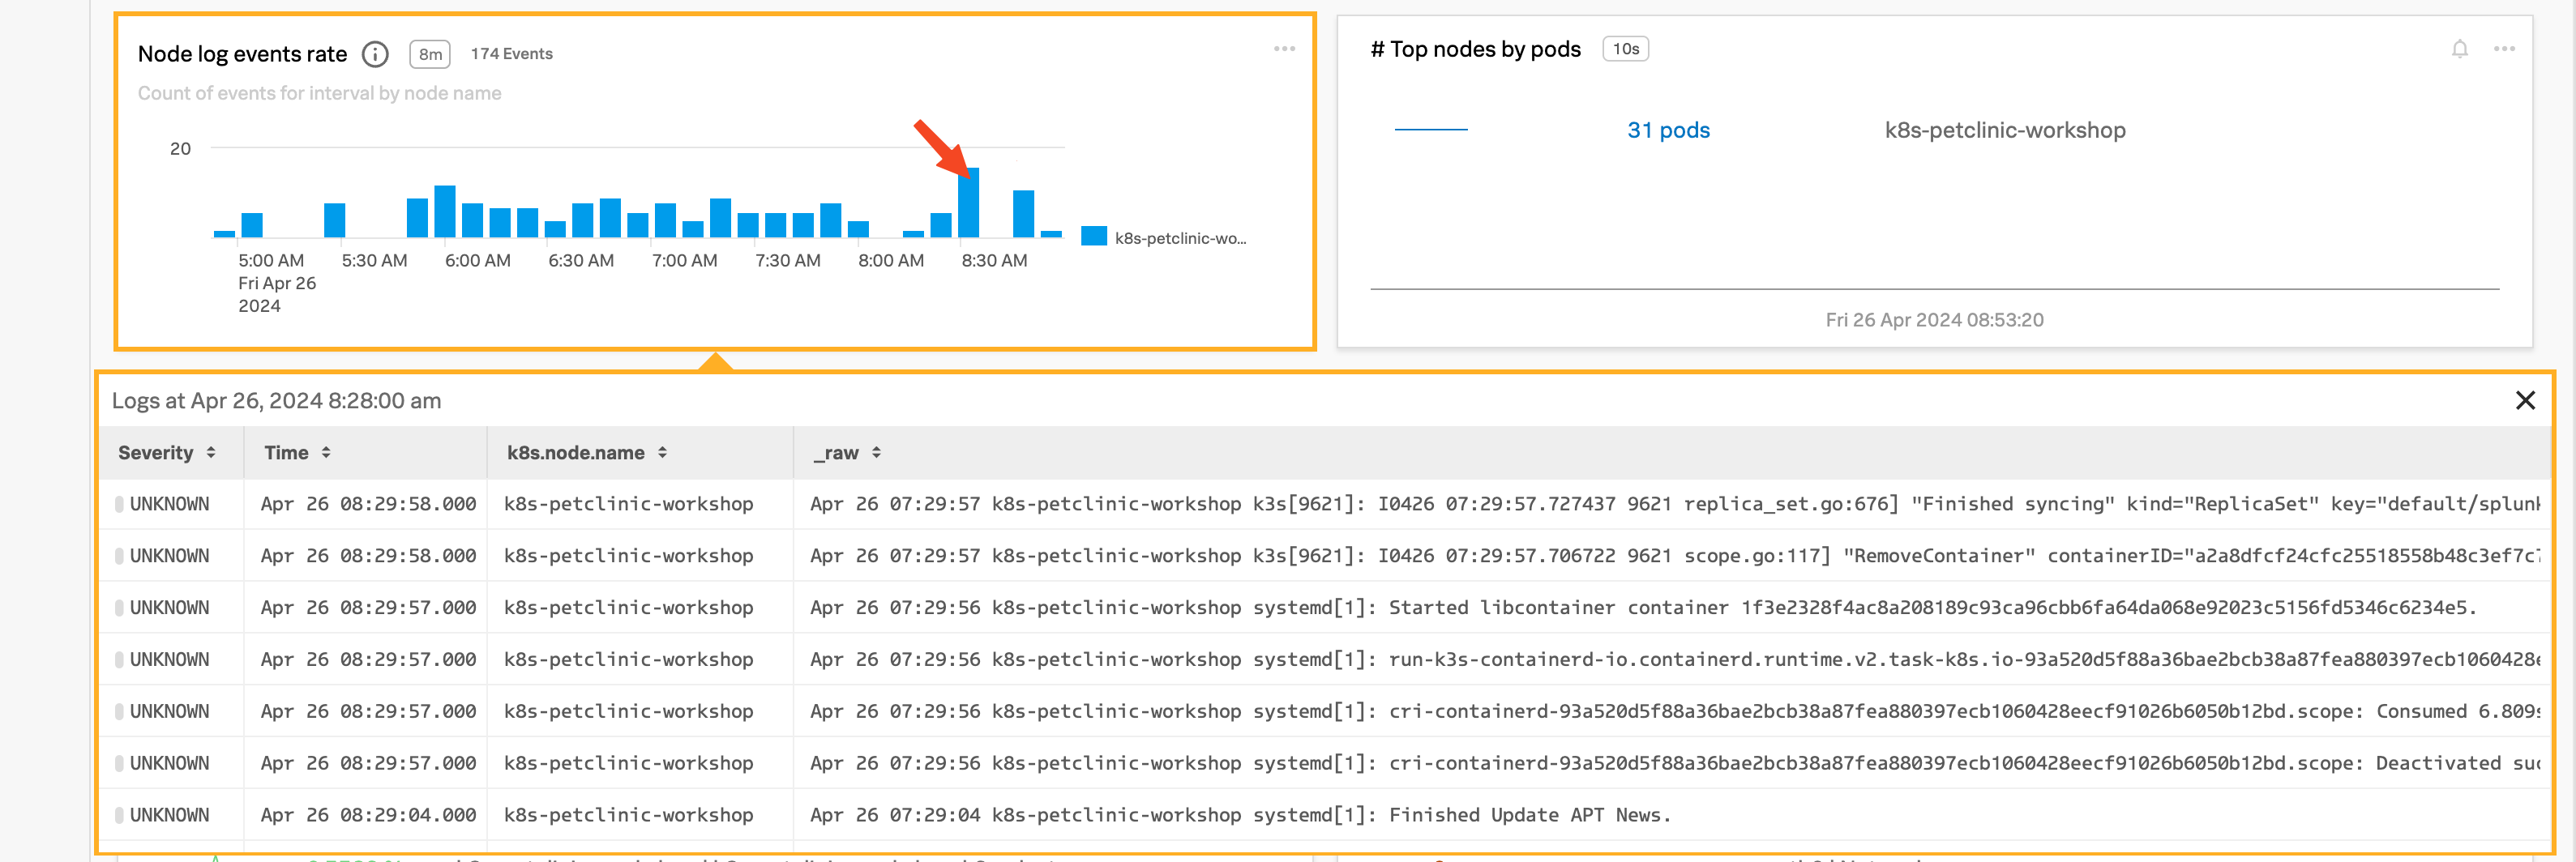
Scroll down the page to see the metrics coming in from your cluster. Locate the Node log events rate chart and click on a vertical bar to see the log entries coming in from your cluster.
Subsections of Verify Kubernetes Cluster metrics
Verify the PetClinic Website
To test the application you need to obtain the public IP address of the instance you are running on. You can do this by running the following command:
curl http://ifconfig.me
You can validate if the application is running by visiting http://<IP_ADDRESS>:81 (replace <IP_ADDRESS> with the IP address you obtained above). You should see the PetClinic application running.
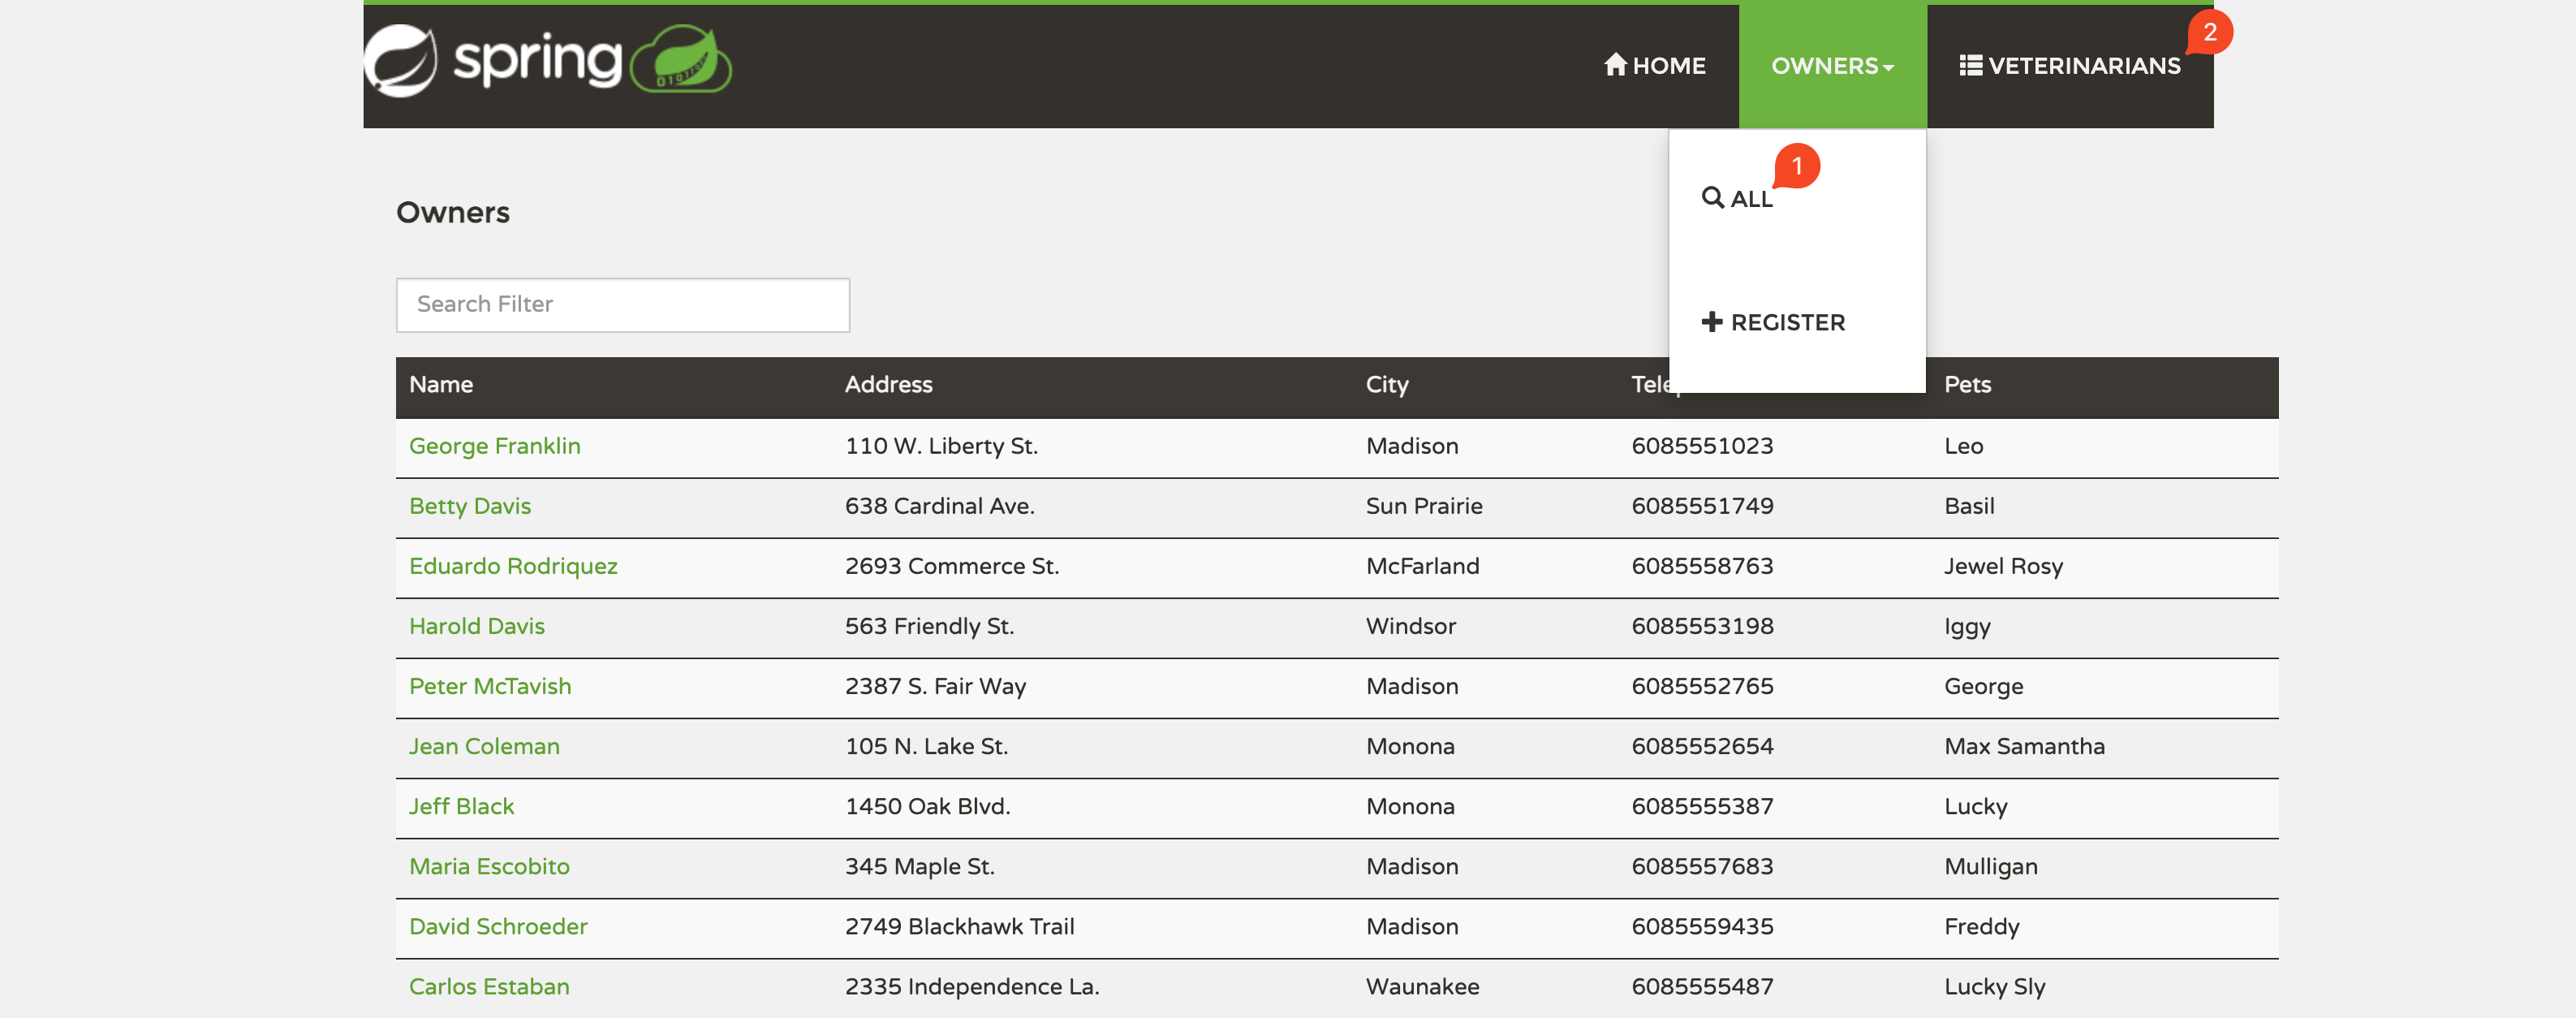
Make sure the application is working correctly by visiting the All Owners(1) and Veterinarians(2) tabs, you should get a list of names in each case.
Note
As each service needs to start up and synchronize with the database, it may take a few minutes for the application to fully start up.
Setting up automatic discovery and configuration for APM
10 minutes
In this section we will enable automatic discovery and configuration for the Java services running in Kubernetes. This means that the OpenTelemetry Collector will look for Pod annotations that indicate that the Java application should be instrumented with the Splunk OpenTelemetry Java agent. This will allow us to get traces, spans, and profiling data from the Java services running on the cluster.
automatic discovery and configuration
It is important to understand that automatic discovery and configuration is designed to get trace, span & profiling data out of your application, without requiring code changes or recompilation.
This is a great way to get started with APM, but it is not a replacement for manual instrumentation. Manual instrumentation allows you to add custom spans, tags, and logs to your application, which can provide more context and detail to your traces.
For Java applications the OpenTelemetry Collector will look for the annotation instrumentation.opentelemetry.io/inject-java.
The annotation can have the value set true or to the namespace/daemonset of the OpenTelemetry Collector e.g. default/splunk-otel-collector. This allows working across namespaces and what we will use in this workshop.
Using the deployment.yaml
If you want your Pods to send traces automatically, you can add the annotation to the deployment.yaml as shown below. This will add the instrumentation library during the initial deployment. To speed things up we have done that for the following Pods:
Subsections of Setting up automatic discovery and configuration for APM
Patching the Deployment
To configure automatic discovery and configuration the deployments need to be patched to add the instrumentation annotation. Once patched, the OpenTelemetry Collector will inject the automatic discovery and configuration library and the Pods will be restarted in order to start sending traces and profiling data. First, confirm that the api-gateway does not have the splunk-otel-java image.
Next, enable the Java automatic discovery and configuration for all of the services by adding the annotation to the deployments. The following command will patch the all deployments. This will trigger the OpenTelemetry Operator to inject the splunk-otel-java image into the Pods:
kubectl get deployments -l app.kubernetes.io/part-of=spring-petclinic -o name | xargs -I % kubectl patch % -p "{\"spec\": {\"template\":{\"metadata\":{\"annotations\":{\"instrumentation.opentelemetry.io/inject-java\":\"default/splunk-otel-collector\"}}}}}"
deployment.apps/config-server patched (no change)
deployment.apps/admin-server patched (no change)
deployment.apps/customers-service patched
deployment.apps/visits-service patched
deployment.apps/discovery-server patched (no change)
deployment.apps/vets-service patched
deployment.apps/api-gateway patched
There will be no change for the config-server, discovery-server and admin-server as these have already been patched.
To check the container image(s) of the api-gateway pod again, run the following command:
A new image has been added to the api-gateway which will pull splunk-otel-java from ghcr.io (if you see two api-gateway containers, the original one is probably still terminating, so give it a few seconds).
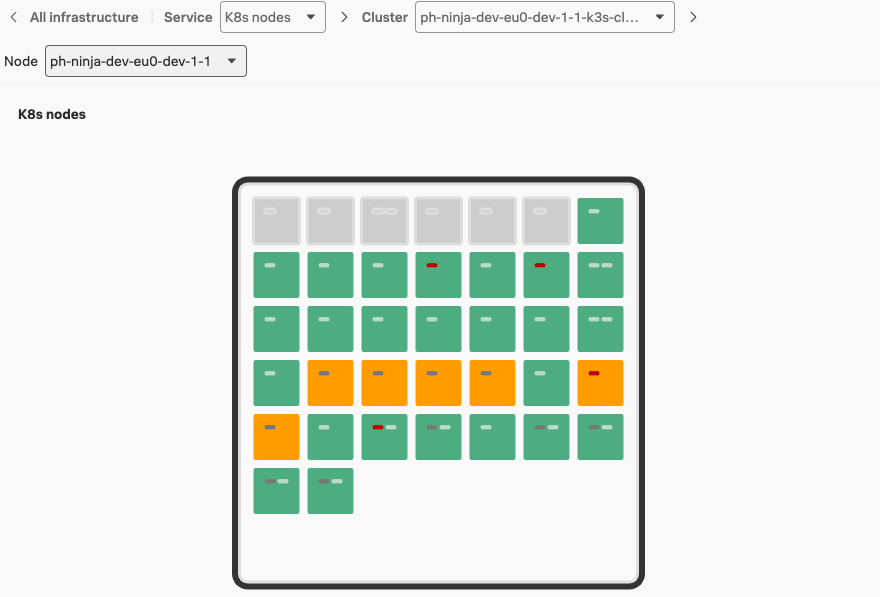
Navigate back to the Kubernetes Navigator in Splunk Observability Cloud. After a couple of minutes you will see that the Pods are being restarted by the operator and the automatic discovery and configuration container will be added. This will look similar to the screenshot below:
Wait for the Pods to turn green in the Kubernetes Navigator, then go tho the next section.
Viewing the data in Splunk APM
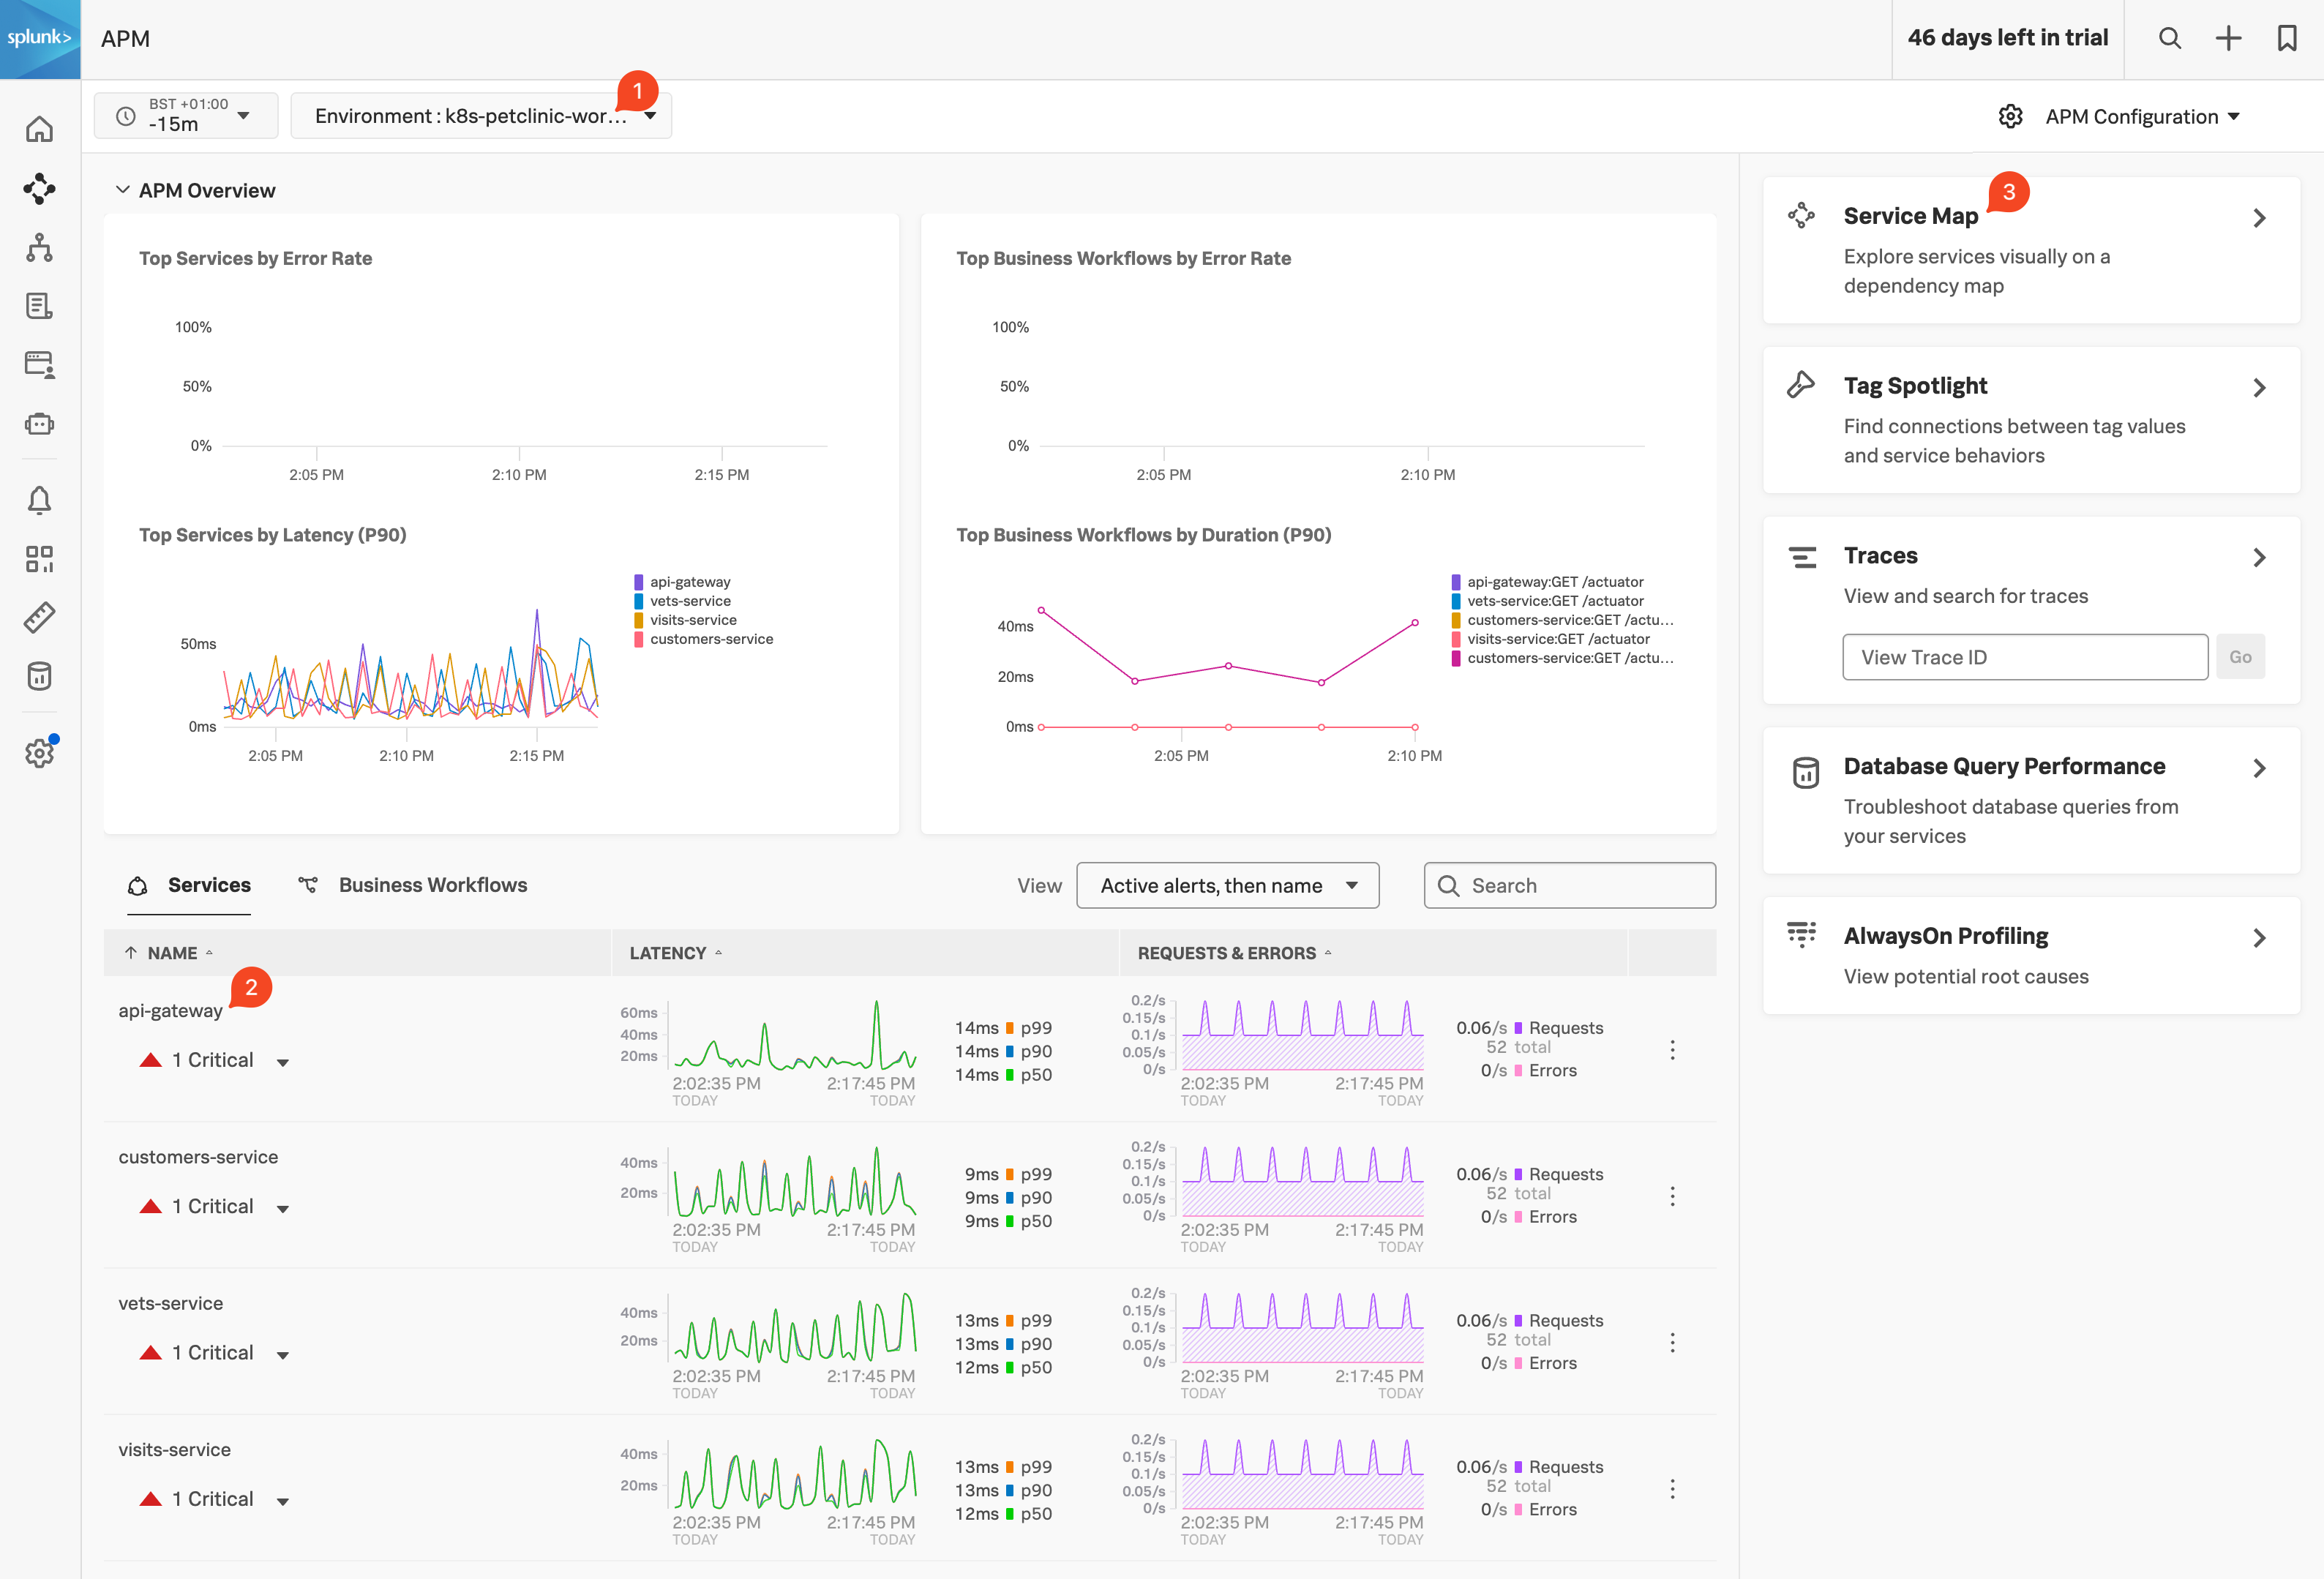
Log in to Splunk Observability Cloud, from the left-hand menu click on APM to see the data generated by the traces from the newly instrumented services. Change the Environment filter (1) to the name of your workshop instance in the dropdown box (this will be <INSTANCE>-workshop where INSTANCE is the value from the shell script you ran earlier) and make sure it is the only one selected.
You will see the name (2) of the api-gateway service and metrics in the Latency and Request & Errors charts (you can ignore the Critical Alert, as it is caused by the sudden request increase generated by the load generator). You will also see the rest of the services appear.
Once you see the Customer service, Vets service and Visits services like show in the screenshot above, let’s click on the Service Map(3) pane to get ready for the next section.
APM Features
15 minutes
As we have seen in the previous section, once you enable automatic discovery and configuration on your services, traces are sent to Splunk Observability Cloud.
With these traces, Splunk will automatically generate Service Maps and RED Metrics. These are the first steps in understanding the behavior of your services and how they interact with each other.
In this next section, we are going to examine the traces themselves and what information they provide to help you understand the behavior of your services all without touching your code.
Subsections of APM Features
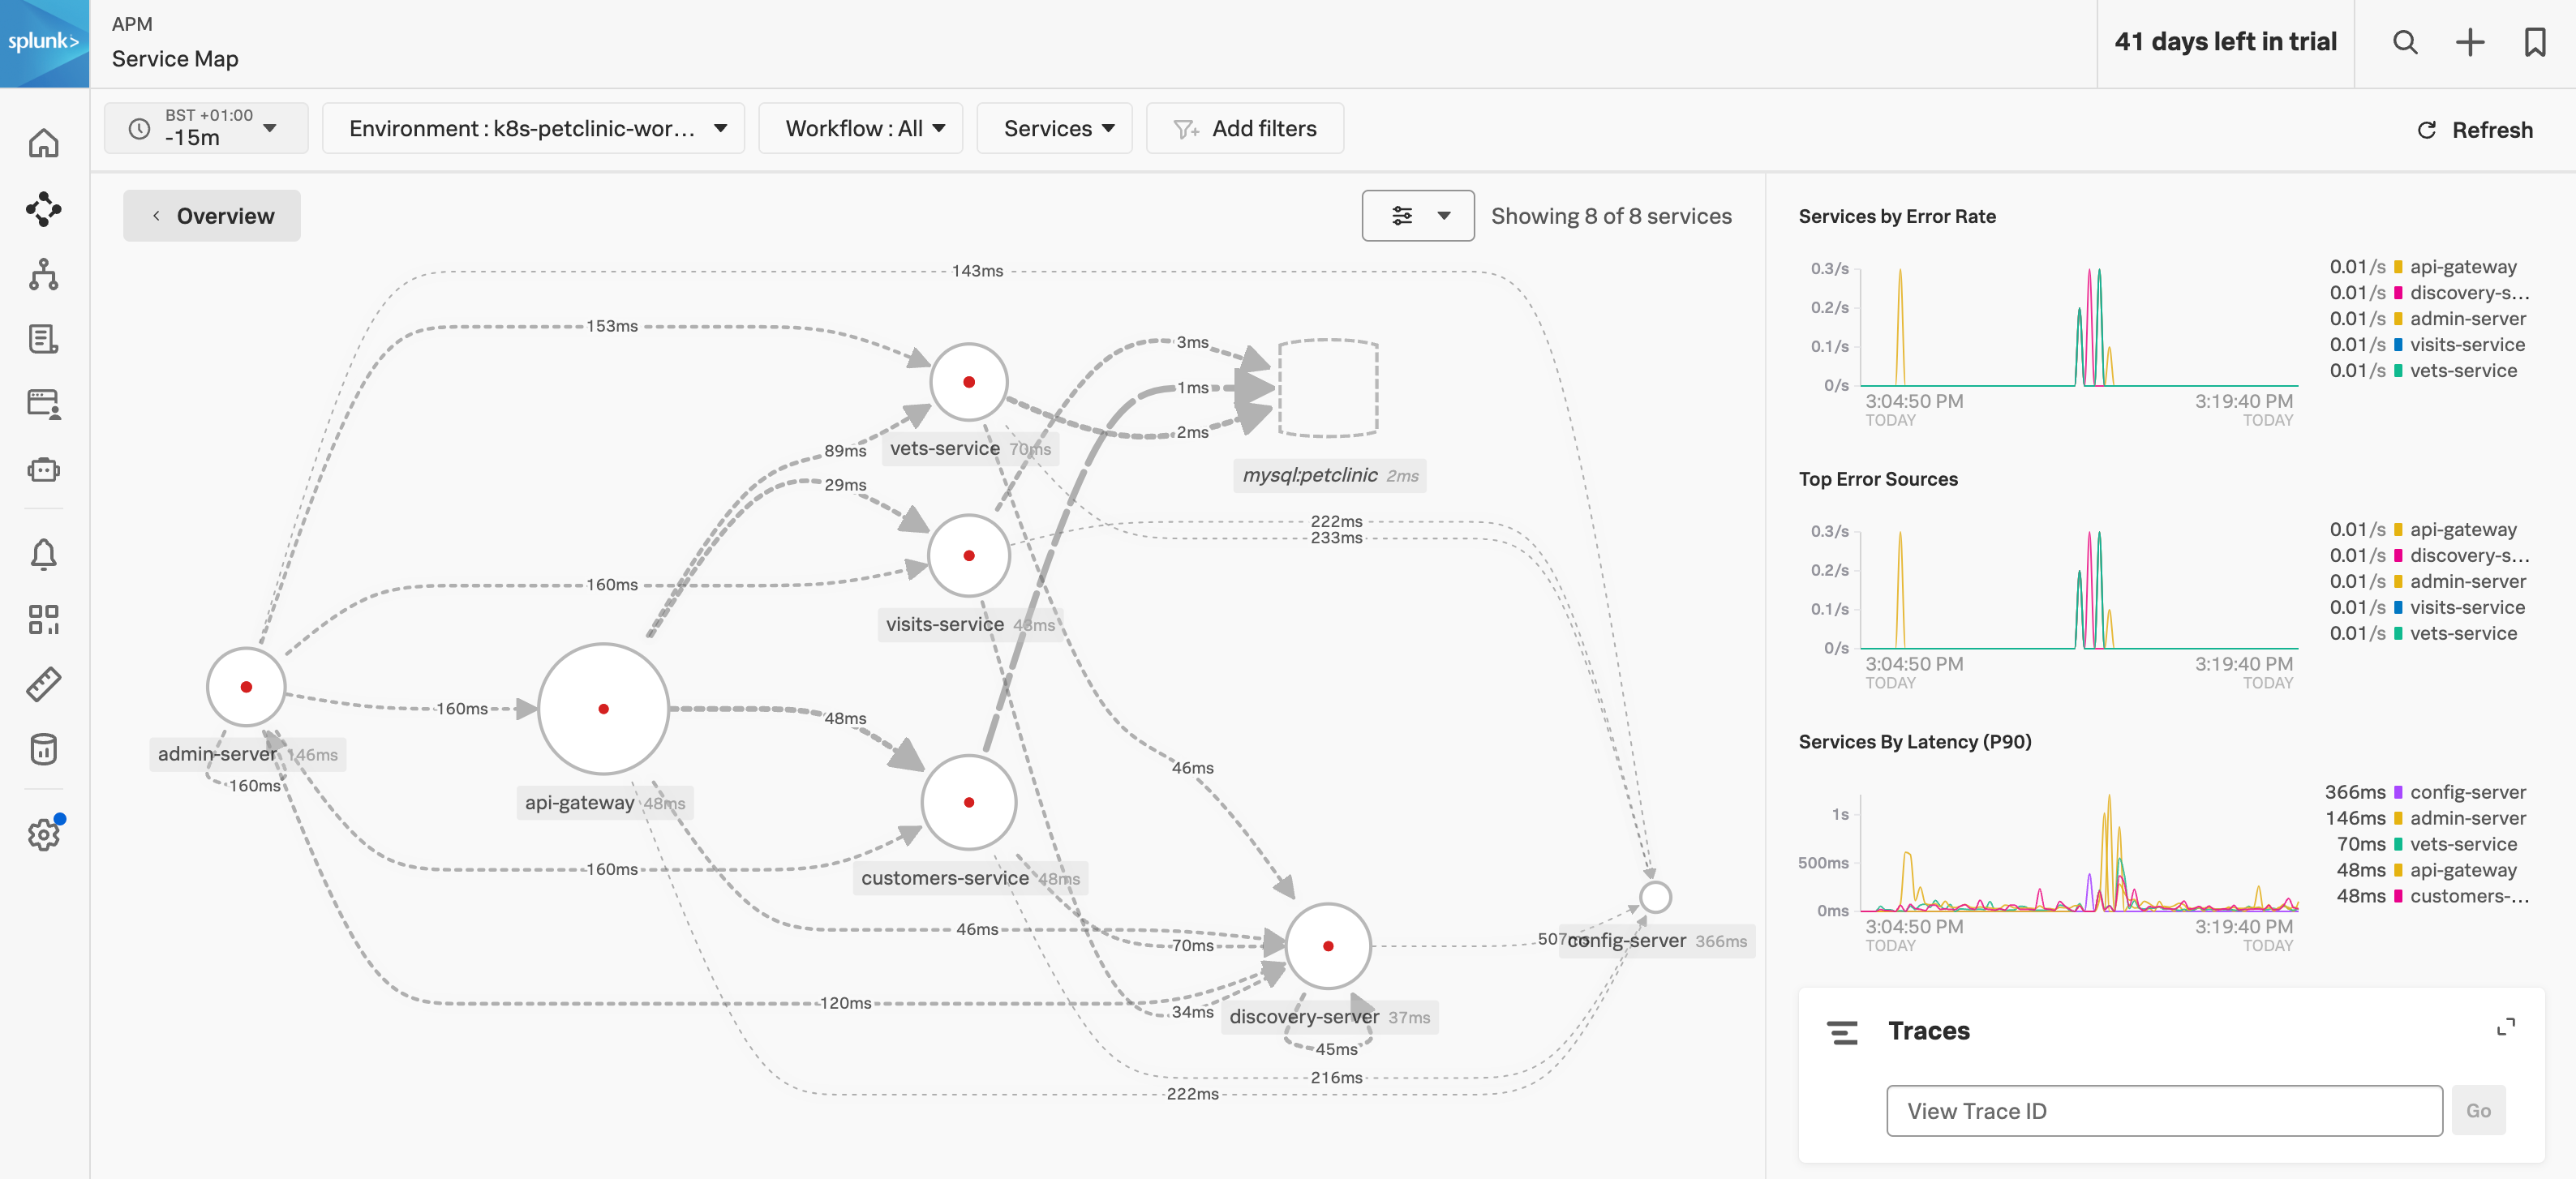
APM Service Map
The above map shows all the interactions between all of the services. The map may still be in an interim state as it will take the Petclinic Microservice application a few minutes to start up and fully synchronize. Reducing the time filter to a custom time of 2 minutes will help. The initial startup-related errors (red dots) will eventually disappear.
Next, let’s examine the metrics that are available for each service that is instrumented and visit the request, error, and duration (RED) metrics Dashboard
For this exercise we are going to use a common scenario you would use if the service operation was showing high latency, or errors for example.
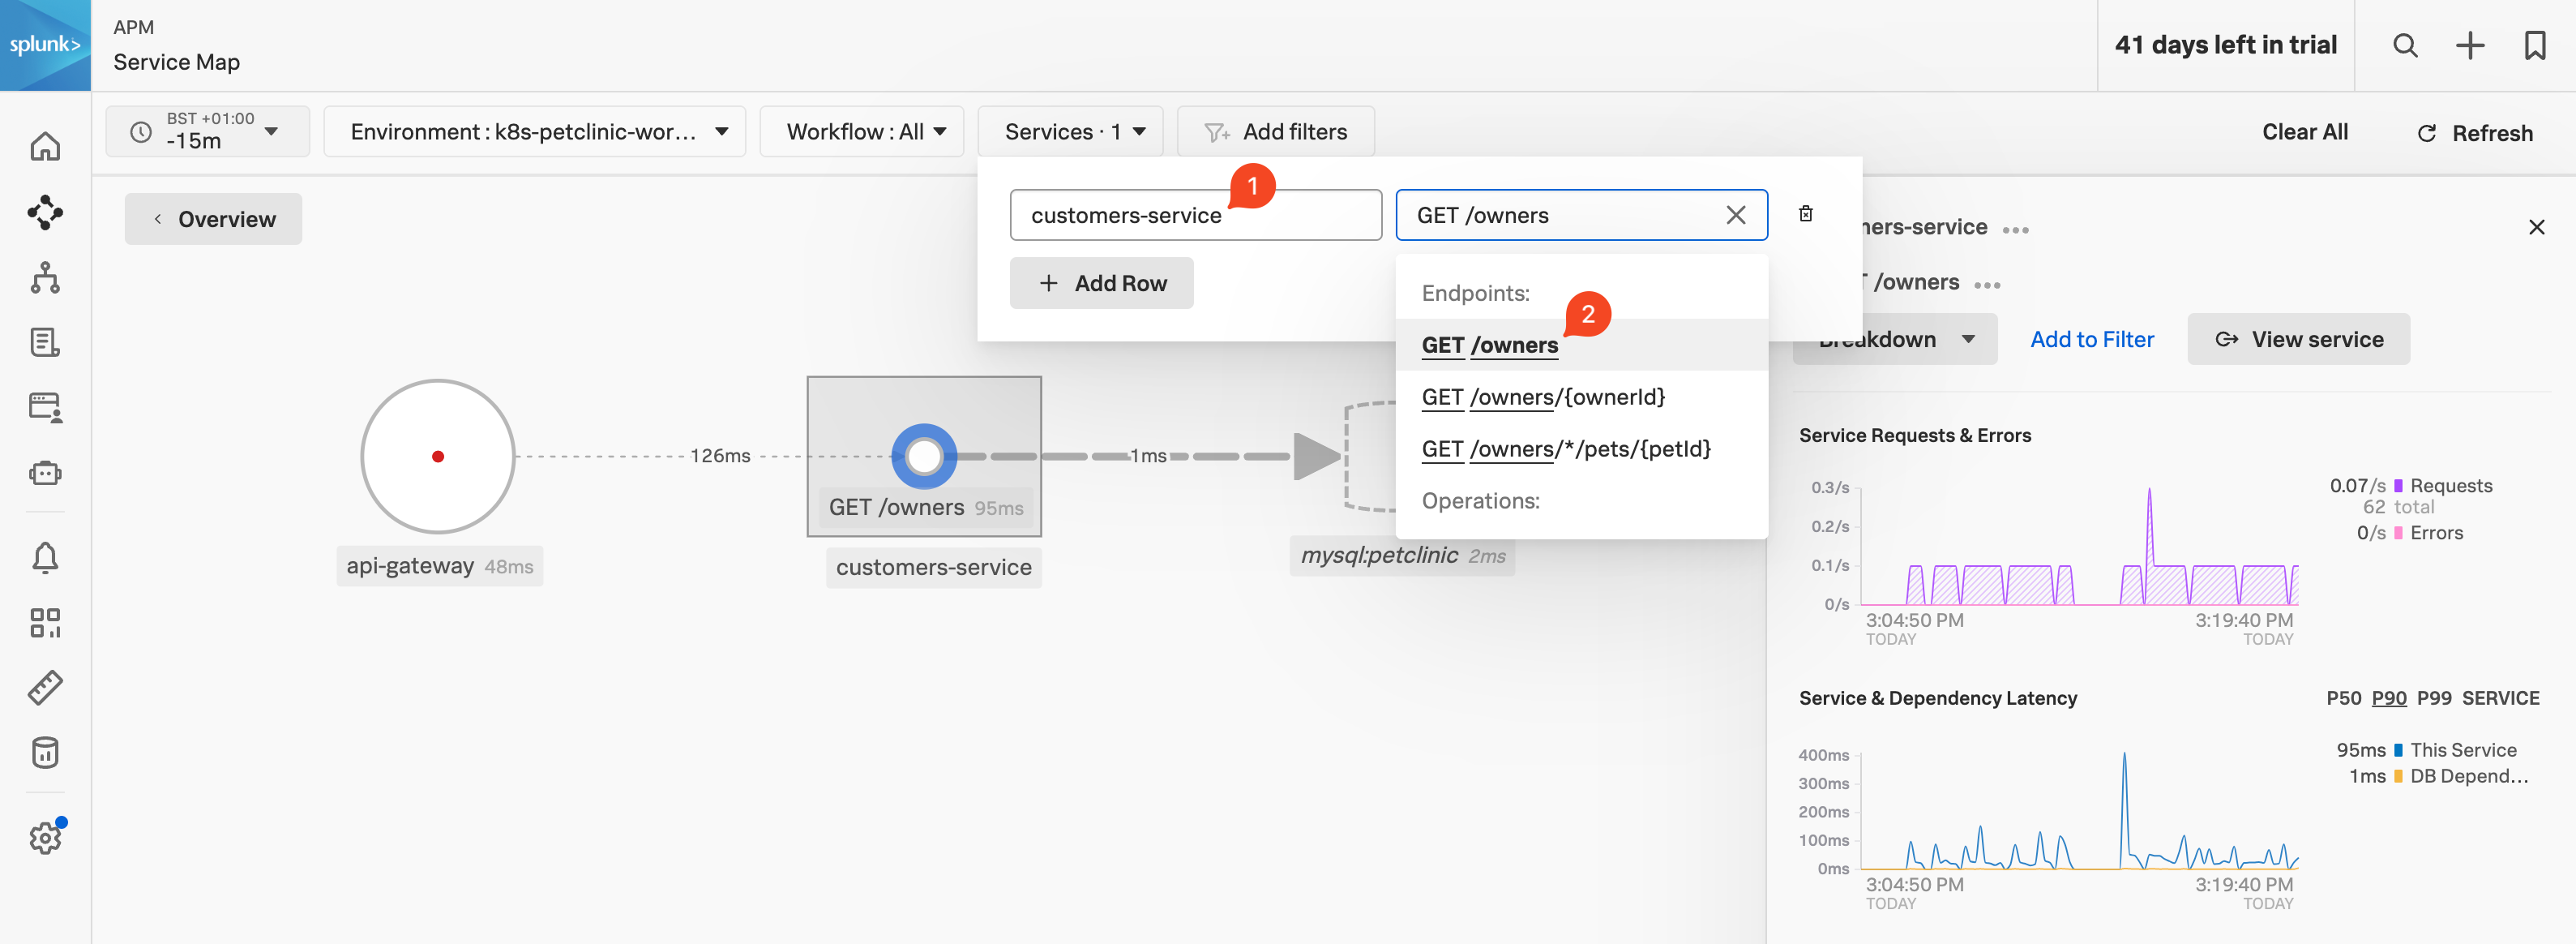
Select (click) on the Customer Service in the Dependency map (1), then make sure the customers-service is selected in the Services dropdown box (2). Next, select GET /Owners from the Operations dropdown (3)**.
This should give you the workflow with a filter on GET /owners(1) as shown below.
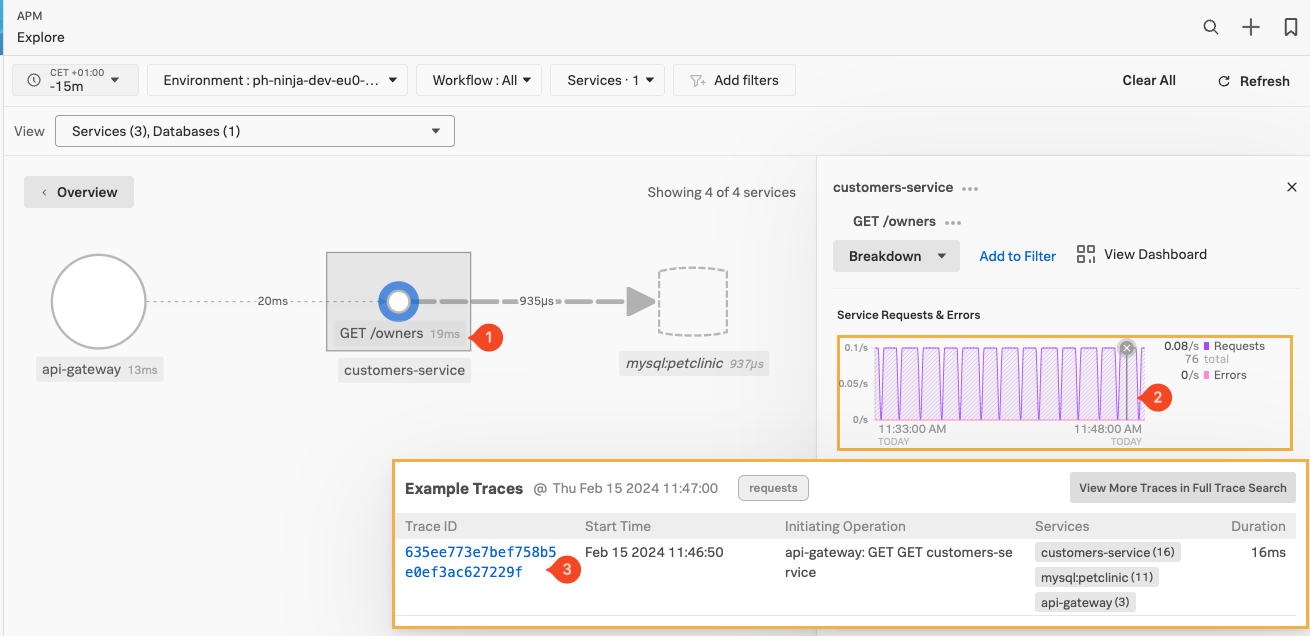
APM Trace
To pick a trace, select a line in the Service Requests & Errors chart (2), when the dot appears click to get a list of sample traces:
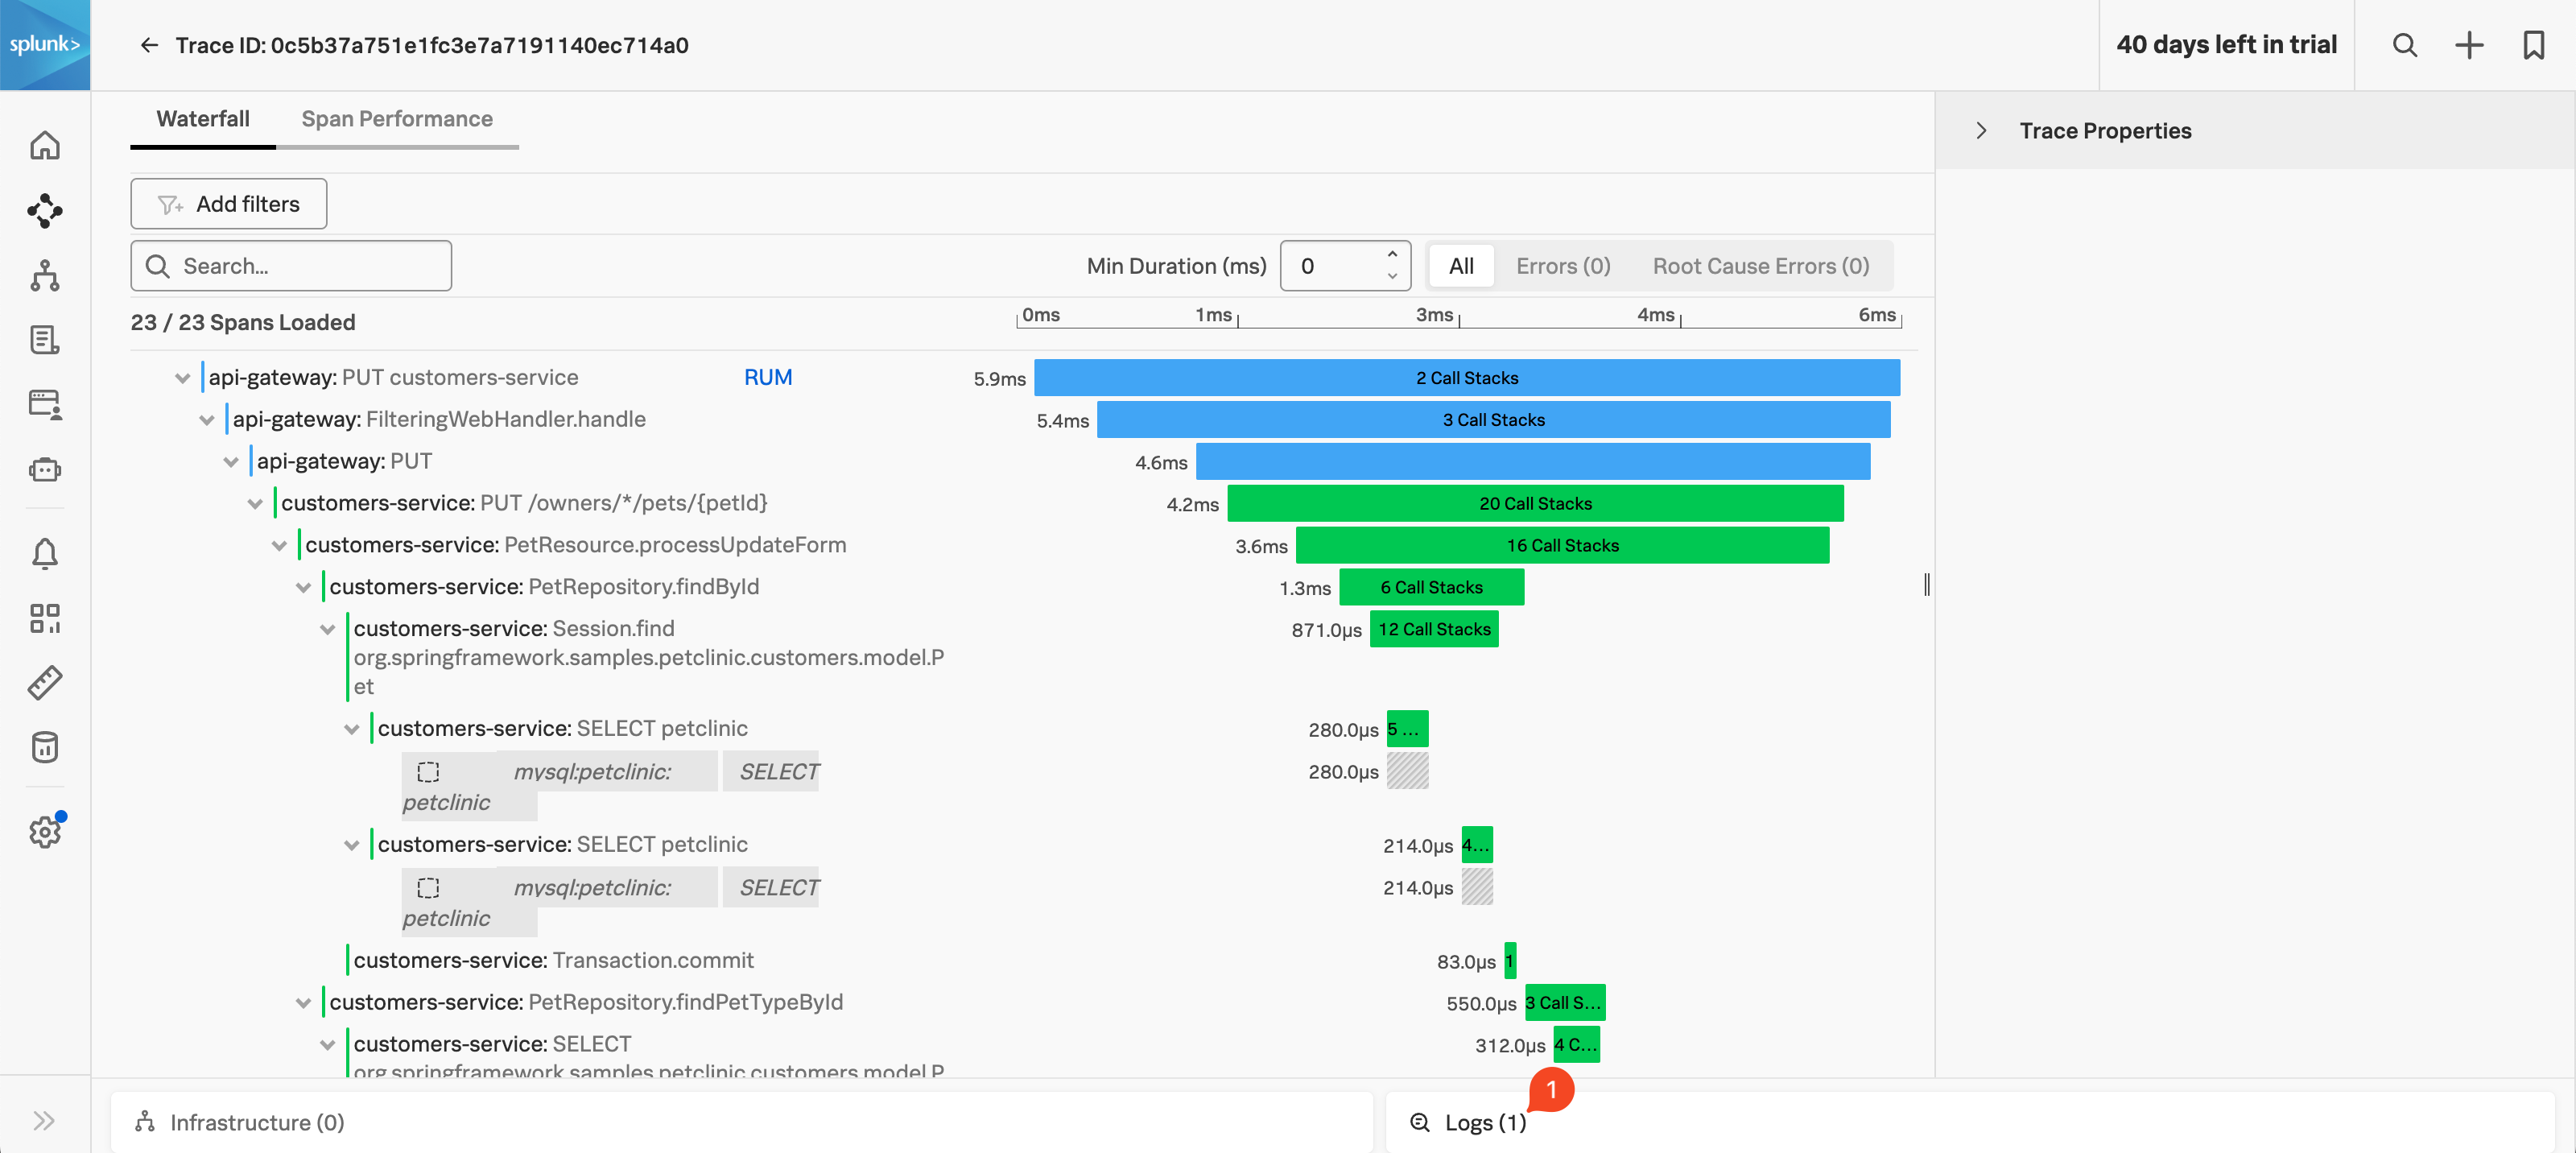
Once you have the list of sample traces, click on the blue (3) Trace ID Link (make sure it has the same three services mentioned in the Service Column.)
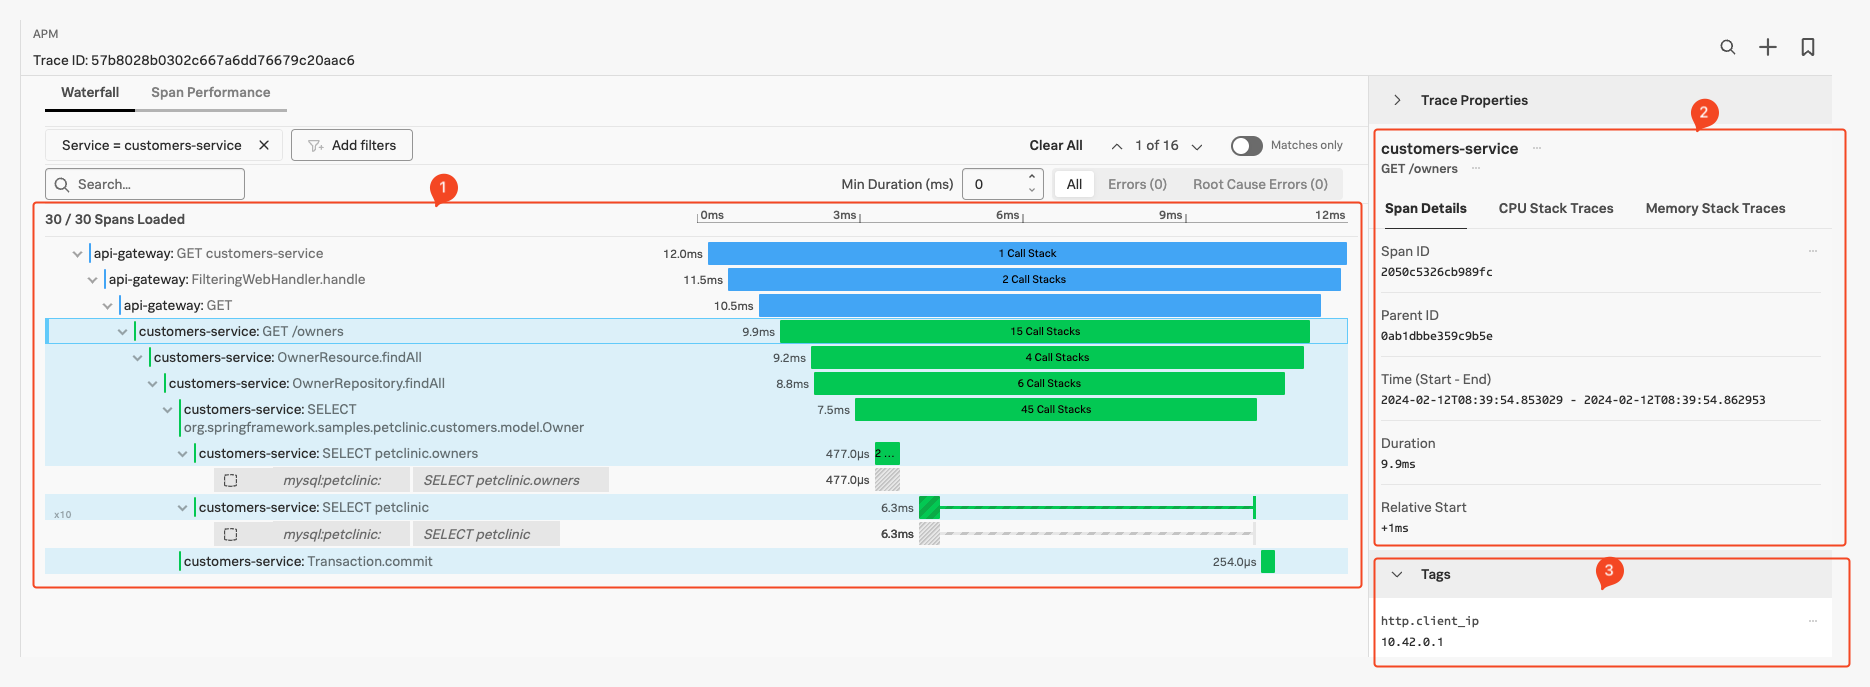
This brings us the the Trace selected in the Waterfall view:
Here we find several sections:
The actual Waterfall Pane (1), where you see the trace and all the instrumented functions visible as spans, with their duration representation and order/relationship showing.
The Trace Info Pane (2), by default, shows the selected Span information (highlighted with a box around the Span in the Waterfall Pane).
The Span Pane (3), here you can find all the Tags that have been sent in the selected Span, You can scroll down to see all of them.
The process Pane, with tags related to the process that created the Span (scroll down to see as it is not in the screenshot).
The Trace Properties at the top of the right-hand pane by default is collapsed as shown.
APM Span
While we examine our spans, let’s look at several features that you get out of the box without code modifications when using automatic discovery and configuration on top of tracing:
Due to the fact there are several different routes
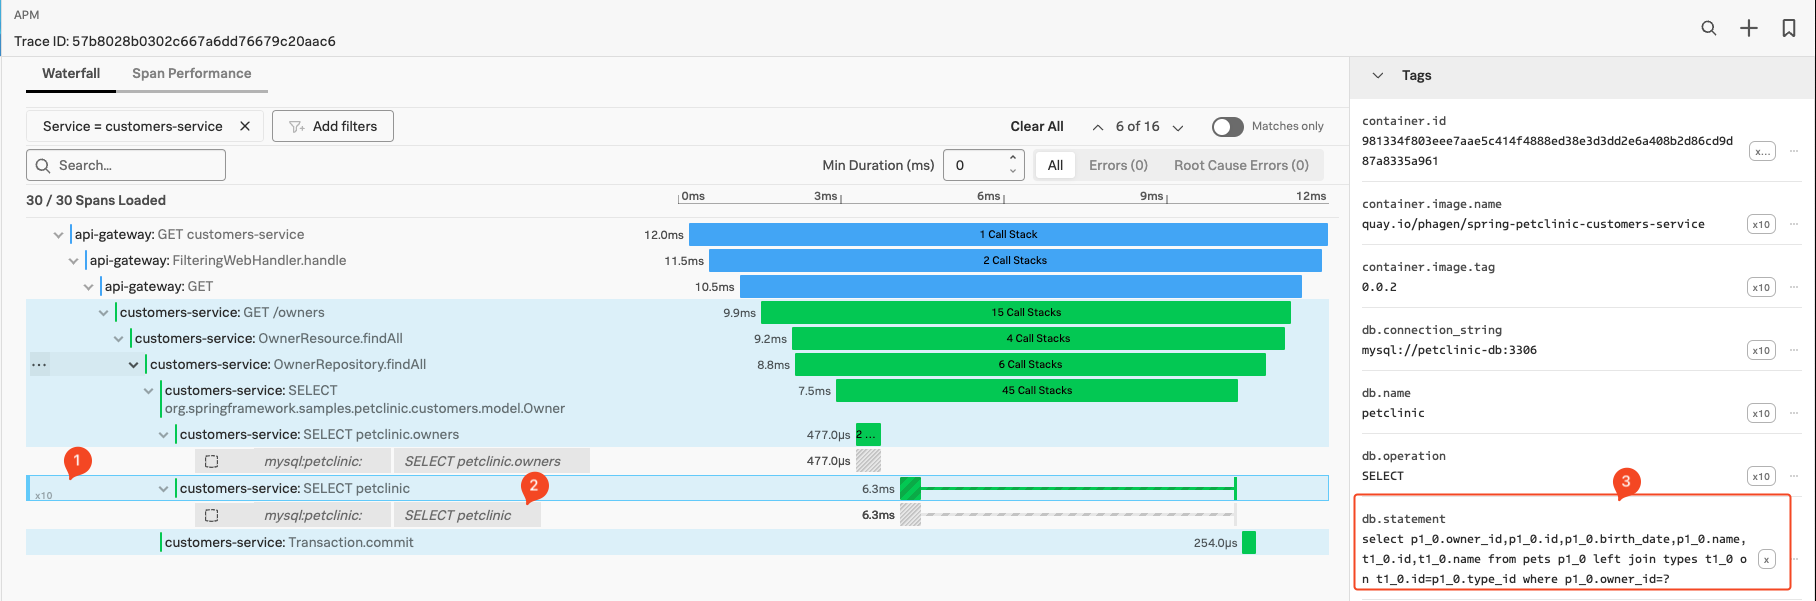
First, in the Waterfall Pane, make sure the customers-service:SELECT petclinic.owners or similar span is selected as shown in the screenshot below:
The basic latency information is shown as a bar for the instrumented function or call, in our example, it took 6.3 Milliseconds.
Several similar Spans (1), are only visible if the span is repeated multiple times. In this case, there are 10 repeats in our example. (You can show/hide them all by clicking on the 10x and all spans will show in order)
Inferred Services: Calls made to external systems that are not instrumented, show up as a grey ‘inferred’ span. The Inferred Service or span in our case here is a call to the Mysql Database mysql:petclinic SELECT petclinic(2) as shown above our selected span.
Span Tags: In the Tag Pane, standard tags produced by the automatic discovery and configuration. In this case, the span is calling a Database, so it includes the db.statement tag (3). This tag will hold the DB query statement and is used by the Database call performed during this span. This will be used by the DB-Query Performance feature. We look at DB-Query Performance in the next section.
Always-on Profiling: IF the system is configured to and has captured Profiling data during a Span life cycle, it will show the number of Call Stacks captured in the Spans timeline (15 Call Stacks for the customers-service:SELECT petclinic.owners Span shown above).
We will look at Profiling in the next section.
Service Centric View
Splunk APM provide Service Centric Views that provide engineers a deep understanding of service performance in one centralized view. Now, across every service, engineers can quickly identify errors or bottlenecks from a service’s underlying infrastructure, pinpoint performance degradations from new deployments, and visualize the health of every third party dependency.
To see this dashboard for the api-gateway, make sure you have the api-gateway service selected in the Service Map, then click on the *View Service button in the top of the right-hand pane. This will bring you to the Service Centric View dashboard:
This view, which is available for each of your instrumented services, offers an overview of Service metrics, Runtime metrics and Infrastructure metrics.
You can select the *Back function of you browser to go back to the previous view.
Always-On Profiling & DB Query Performance
15 minutes
As we have seen in the previous chapter, you can trace your interactions between the various services using APM without touching your code, which will allow you to identify issues faster.
However, besides tracing automatic discovery and configuration offers additional features out of the box that can help you find issues even faster. In this section we are going to look at two of them:
Always-on Profiling and Java Metrics
Database Query Performance
If you want to dive deeper into Always-on Profiling or DB-Query performance, we have a separate Ninja Workshop called Debug Problems in Microservices that you can follow.
Subsections of Always-On Profiling & DB Query Performance
Always-On Profiling & Metrics
When we installed the Splunk Distribution of the OpenTelemetry Collector using the Helm chart earlier, we configured it to enable AlwaysOn Profiling and Metrics. This means that the collector will automatically generate CPU and Memory profiles for the application and send them to Splunk Observability Cloud.
When you deploy the PetClinic application and set the annotation, the collector automatically detects the application and instruments it for traces and profiling. We can verify this by examining the startup logs of one of the Java containers we are instrumenting by running the following script:
The logs should show what flags were picked up by the Java automatic discovery and configuration:
. ~/workshop/petclinic/scripts/get_logs.sh
2024/02/15 09:42:00 Problem with dial: dial tcp 10.43.104.25:8761: connect: connection refused. Sleeping 1s
2024/02/15 09:42:01 Problem with dial: dial tcp 10.43.104.25:8761: connect: connection refused. Sleeping 1s
2024/02/15 09:42:02 Connected to tcp://discovery-server:8761
Picked up JAVA_TOOL_OPTIONS:  -javaagent:/otel-auto-instrumentation-java/javaagent.jar
Picked up _JAVA_OPTIONS: -Dspring.profiles.active=docker,mysql -Dsplunk.profiler.call.stack.interval=150
OpenJDK 64-Bit Server VM warning: Sharing is only supported for boot loader classes because bootstrap classpath has been appended
[otel.javaagent 2024-02-15 09:42:03:056 +0000] [main] INFO io.opentelemetry.javaagent.tooling.VersionLogger - opentelemetry-javaagent - version: splunk-1.30.1-otel-1.32.1
[otel.javaagent 2024-02-15 09:42:03:768 +0000] [main] INFO com.splunk.javaagent.shaded.io.micrometer.core.instrument.push.PushMeterRegistry - publishing metrics for SignalFxMeterRegistry every 30s
[otel.javaagent 2024-02-15 09:42:07:478 +0000] [main] INFO com.splunk.opentelemetry.profiler.ConfigurationLogger - -----------------------
[otel.javaagent 2024-02-15 09:42:07:478 +0000] [main] INFO com.splunk.opentelemetry.profiler.ConfigurationLogger - Profiler configuration:
[otel.javaagent 2024-02-15 09:42:07:480 +0000] [main] INFO com.splunk.opentelemetry.profiler.ConfigurationLogger -                  splunk.profiler.enabled : true
[otel.javaagent 2024-02-15 09:42:07:505 +0000] [main] INFO com.splunk.opentelemetry.profiler.ConfigurationLogger -                splunk.profiler.directory : /tmp
[otel.javaagent 2024-02-15 09:42:07:505 +0000] [main] INFO com.splunk.opentelemetry.profiler.ConfigurationLogger -       splunk.profiler.recording.duration : 20s
[otel.javaagent 2024-02-15 09:42:07:506 +0000] [main] INFO com.splunk.opentelemetry.profiler.ConfigurationLogger -               splunk.profiler.keep-files : false
[otel.javaagent 2024-02-15 09:42:07:510 +0000] [main] INFO com.splunk.opentelemetry.profiler.ConfigurationLogger -            splunk.profiler.logs-endpoint : http://10.13.2.38:4317
[otel.javaagent 2024-02-15 09:42:07:513 +0000] [main] INFO com.splunk.opentelemetry.profiler.ConfigurationLogger -              otel.exporter.otlp.endpoint : http://10.13.2.38:4317
[otel.javaagent 2024-02-15 09:42:07:513 +0000] [main] INFO com.splunk.opentelemetry.profiler.ConfigurationLogger -           splunk.profiler.memory.enabled : true
[otel.javaagent 2024-02-15 09:42:07:515 +0000] [main] INFO com.splunk.opentelemetry.profiler.ConfigurationLogger -             splunk.profiler.tlab.enabled : true
[otel.javaagent 2024-02-15 09:42:07:516 +0000] [main] INFO com.splunk.opentelemetry.profiler.ConfigurationLogger -        splunk.profiler.memory.event.rate : 150/s
[otel.javaagent 2024-02-15 09:42:07:516 +0000] [main] INFO com.splunk.opentelemetry.profiler.ConfigurationLogger -      splunk.profiler.call.stack.interval : PT0.15S
[otel.javaagent 2024-02-15 09:42:07:517 +0000] [main] INFO com.splunk.opentelemetry.profiler.ConfigurationLogger -  splunk.profiler.include.internal.stacks : false
[otel.javaagent 2024-02-15 09:42:07:517 +0000] [main] INFO com.splunk.opentelemetry.profiler.ConfigurationLogger -      splunk.profiler.tracing.stacks.only : false
[otel.javaagent 2024-02-15 09:42:07:517 +0000] [main] INFO com.splunk.opentelemetry.profiler.ConfigurationLogger - -----------------------
[otel.javaagent 2024-02-15 09:42:07:518 +0000] [main] INFO com.splunk.opentelemetry.profiler.JfrActivator - Profiler is active.
We are interested in the section written by the com.splunk.opentelemetry.profiler.ConfigurationLogger or the Profiling Configuration.
We can see the various settings you can control, some that are useful depending on your use case like the splunk.profiler.directory - The location where the agent writes the call stacks before sending them to Splunk. This may be different depending on how you configure your containers.
Another parameter you may want to change is splunk.profiler.call.stack.interval This is how often the system takes a CPU Stack trace. You may want to reduce this if you have short spans like we have in our application. (we kept the default as the spans in this demo application are extremely short, so Span may not always have a CPU Call Stack related to it.)
You can find how to set these parameters here. Below, is how you set a higher collection rate for call stack in your deployment.yaml, exactly how to pass any JAVA option to the Java application running in your container:
If you don’t see those lines as a result of the script, the startup may have taken too long and generated too many connection errors, try looking at the logs directly with kubectl or the k9s utility that is installed.
Always-On Profiling in the Trace Waterfall
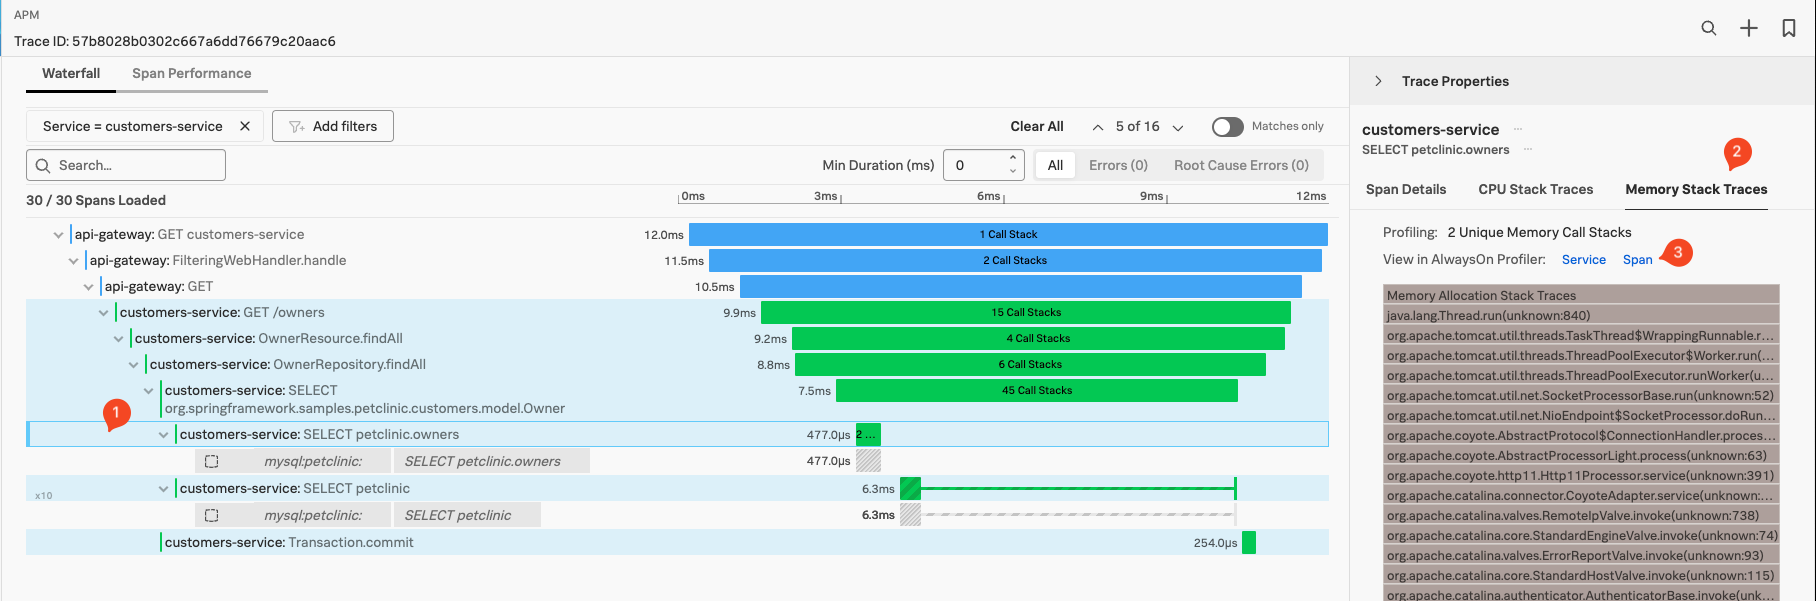
Make sure you have your original (or similar) Trace & Span (1) selected in the APM Waterfall view and select Memory Stack Traces (2) from the right-hand pane:
The pane should show you the Memory Stack Trace Flame Graph (3), you can scroll down and/or make the pane for a better view by dragging the right side of the pane.
As AlwaysOn Profiling is constantly taking snapshots, or stack traces, of your application’s code and reading through thousands of stack traces is not practical, AlwaysOn Profiling aggregates and summarizes profiling data, providing a convenient way to explore Call Stacks in a view called the Flame Graph. It represents a summary of all stack traces captured from your application. You can use the Flame Graph to discover which lines of code might be causing performance issues and to confirm whether the changes you make to the code have the intended effect.
To dive deeper into the Always-on Profiling, select Span (3) in the Profiling Pane under Memory Stack Traces
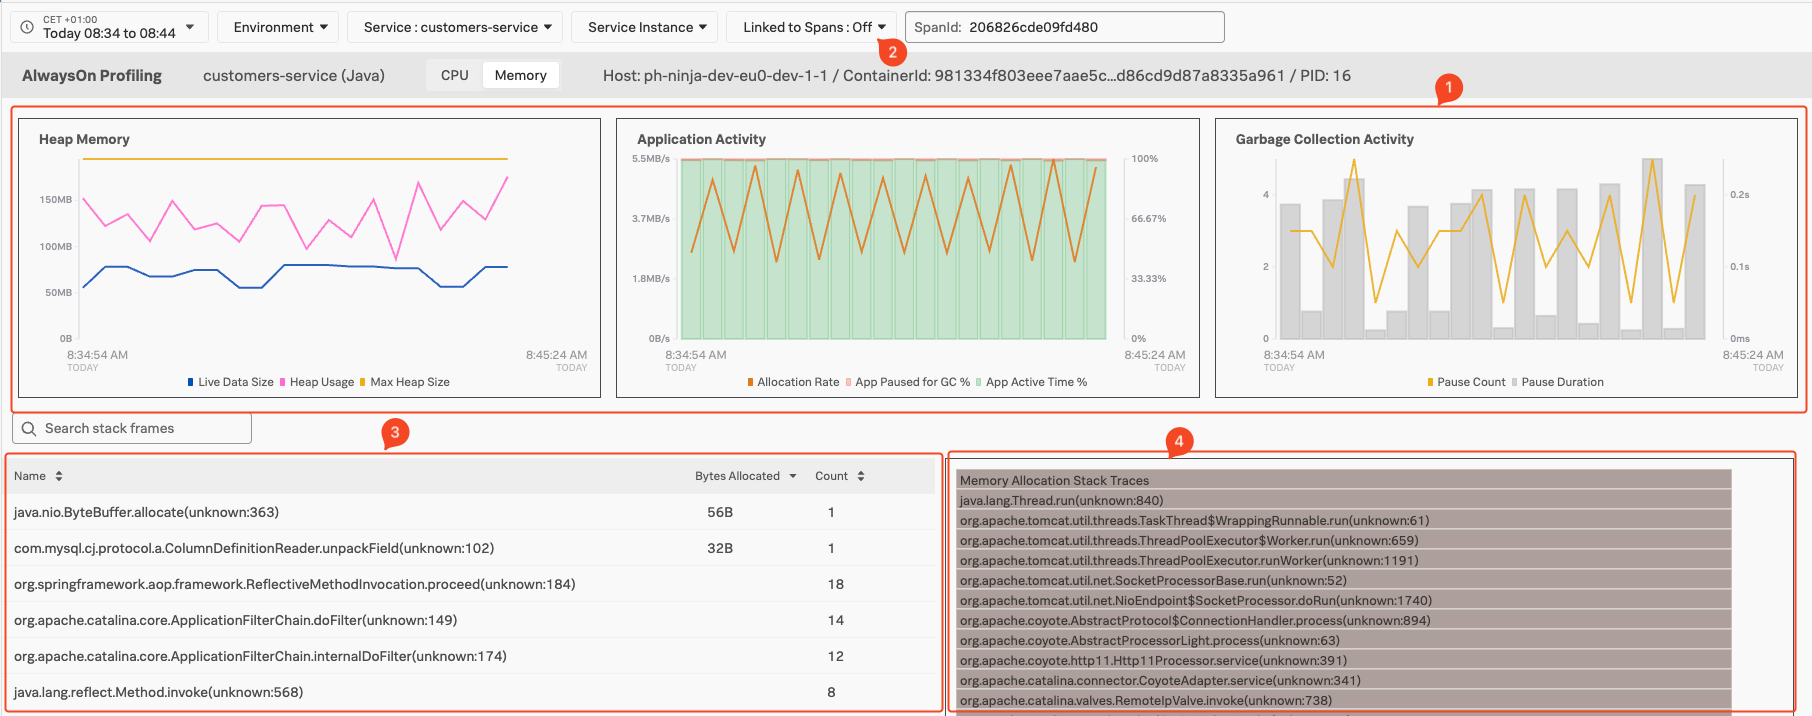
This will bring you to the Always-on Profiling main screen, with the Memory view pre-selected:
Java Memory Metric Charts (1), Allow you to Monitor Heap Memory, Application Activity like Memory Allocation Rate and Garbage Collecting Metrics.
Ability to focus/see metrics and Stack Traces only related to the Span (2), This will filter out background activities running in the Java application if required.
Java Function calls identified. (3), allowing you to drill down into the Methods called from that function.
The Flame Graph (4), with the visualization of hierarchy based on the stack traces of the profiled service.
For further investigation the UI let’s you grab the actual stack trace, so you can use in your coding platform to go to the actual lines of code used at this point (depending of course on your preferred Coding platform)
Database Query Performance
With Database Query Performance, you can monitor the impact of your database queries on service availability directly in Splunk APM. This way, you can quickly identify long-running, unoptimized, or heavy queries and mitigate issues they might be causing, without having to instrument your databases.
To look at the performance of your database queries, make sure you are on the APM Explore page either by going back in the browser or navigating to the APM section in the Menu bar, then click on the Explore tile.
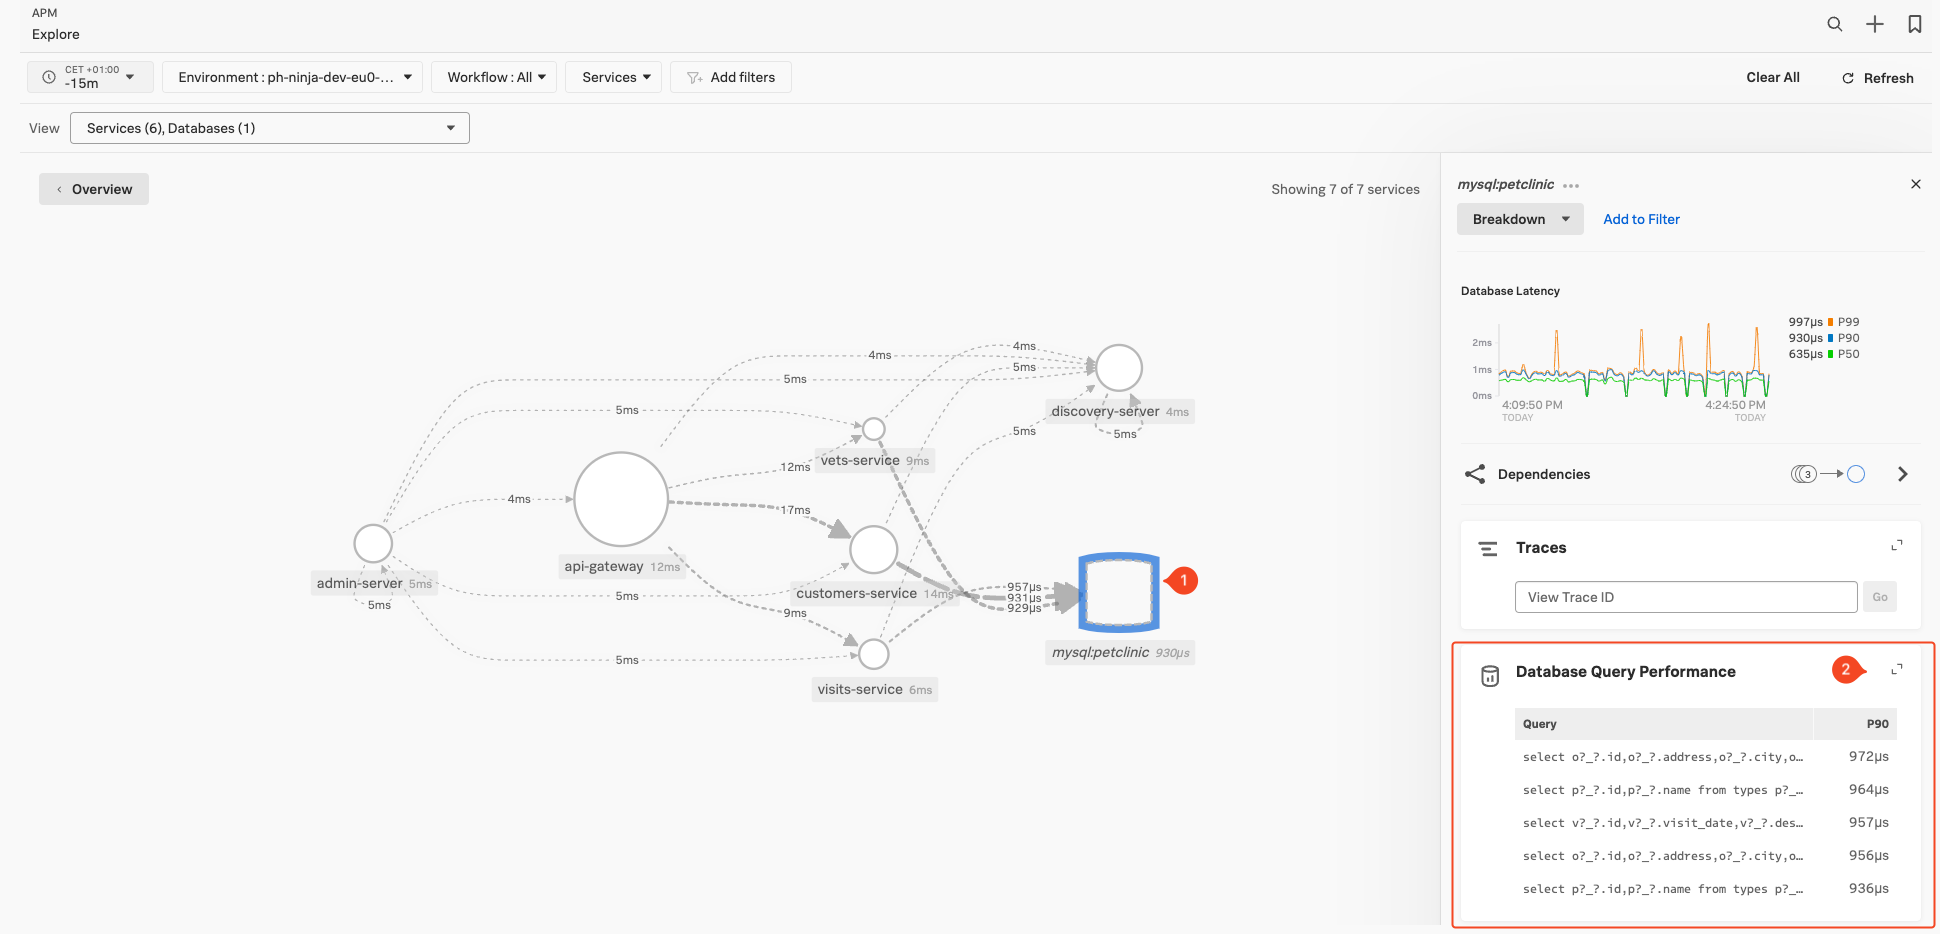
Select the inferred database service mysql:petclinic Inferred Database server in the Dependency map (1), then scroll the right-hand pane to find the Database Query Performance Pane (2).
If the service you have selected in the map is indeed an (inferred) database server, this pane will populate with the top 90% (P90) database calls based on duration. To dive deeper into the db-query performance function click somewhere on the word Database Query Performance at the top of the pane.
This will bring us to the DB-query Performance overview screen:
Database Query Normalization
By default, Splunk APM instrumentation sanitizes database queries to remove or mask sensible data, such as secrets or personally identifiable information (PII) from the db.statements. You can find how to turn off database query normalization here.
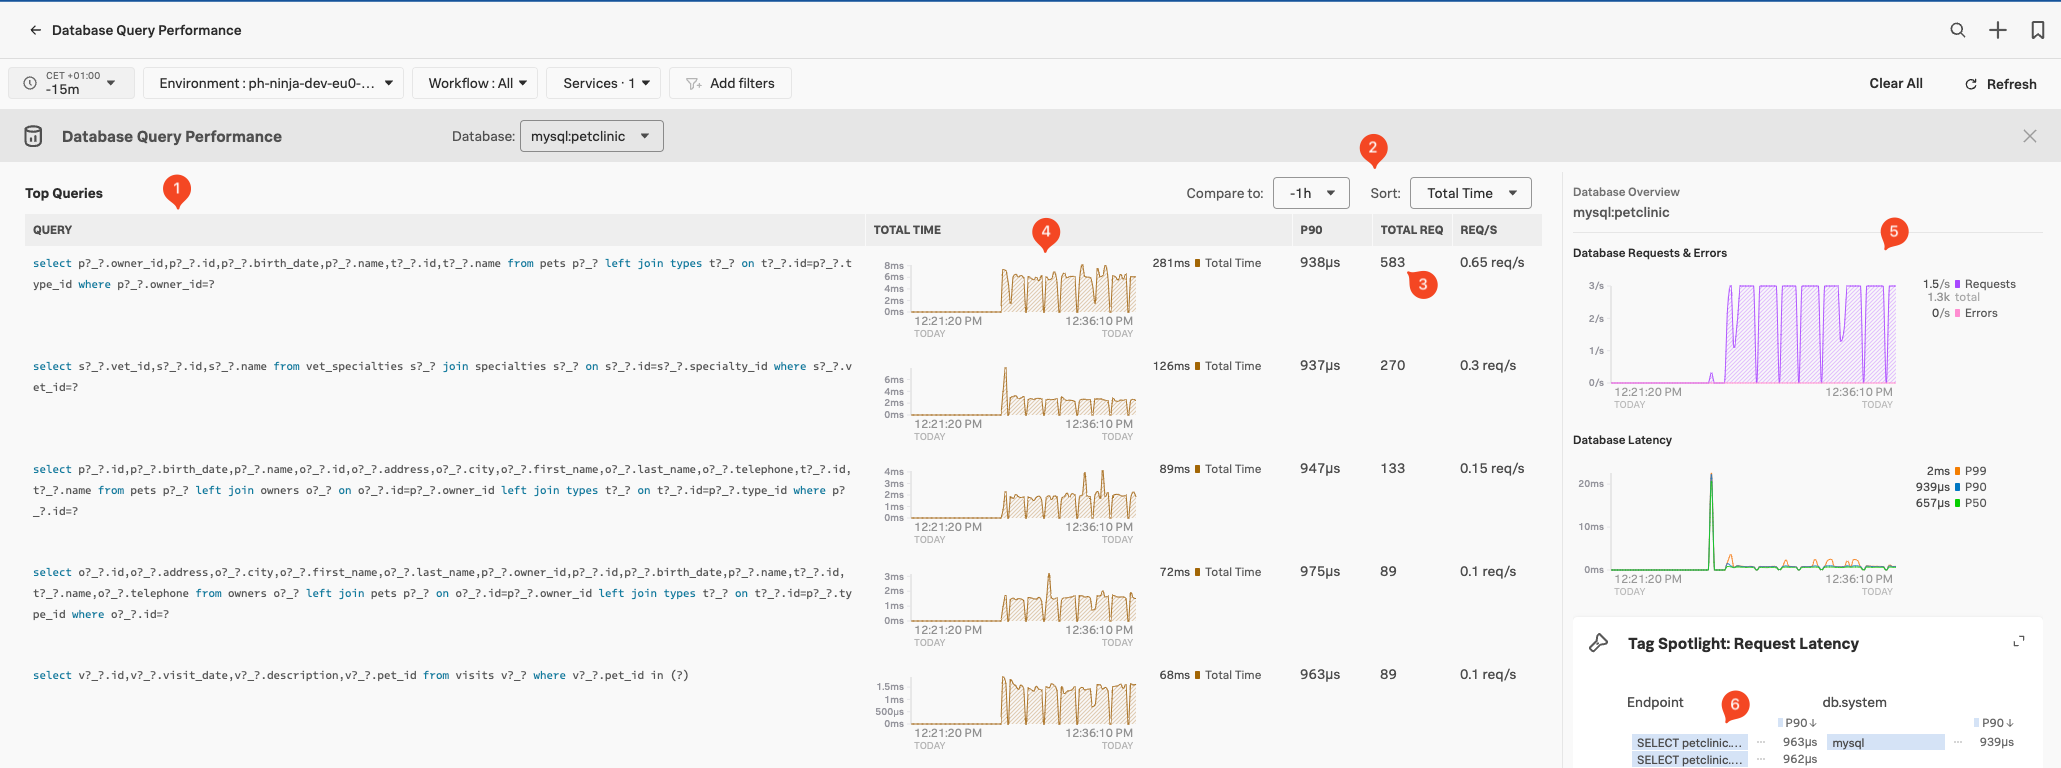
This screen will show us all the Database queries (1) done towards our database from your application, based on the Traces & Spans sent to the Splunk Observability Cloud. Note that you can compare them across a time block or sort them on Total Time, P90 Latency & Requests (2).
For each Database query in the list, we see the highest latency, the total number of calls during the time window and the number of requests per second (3). This allows you to identify places where you might optimize your queries.
You can select traces containing Database Calls via the two charts in the right-hand pane (5). Use the Tag Spotlight pane (6) to drill down what tags are related to the database calls, based on endpoints or tags.
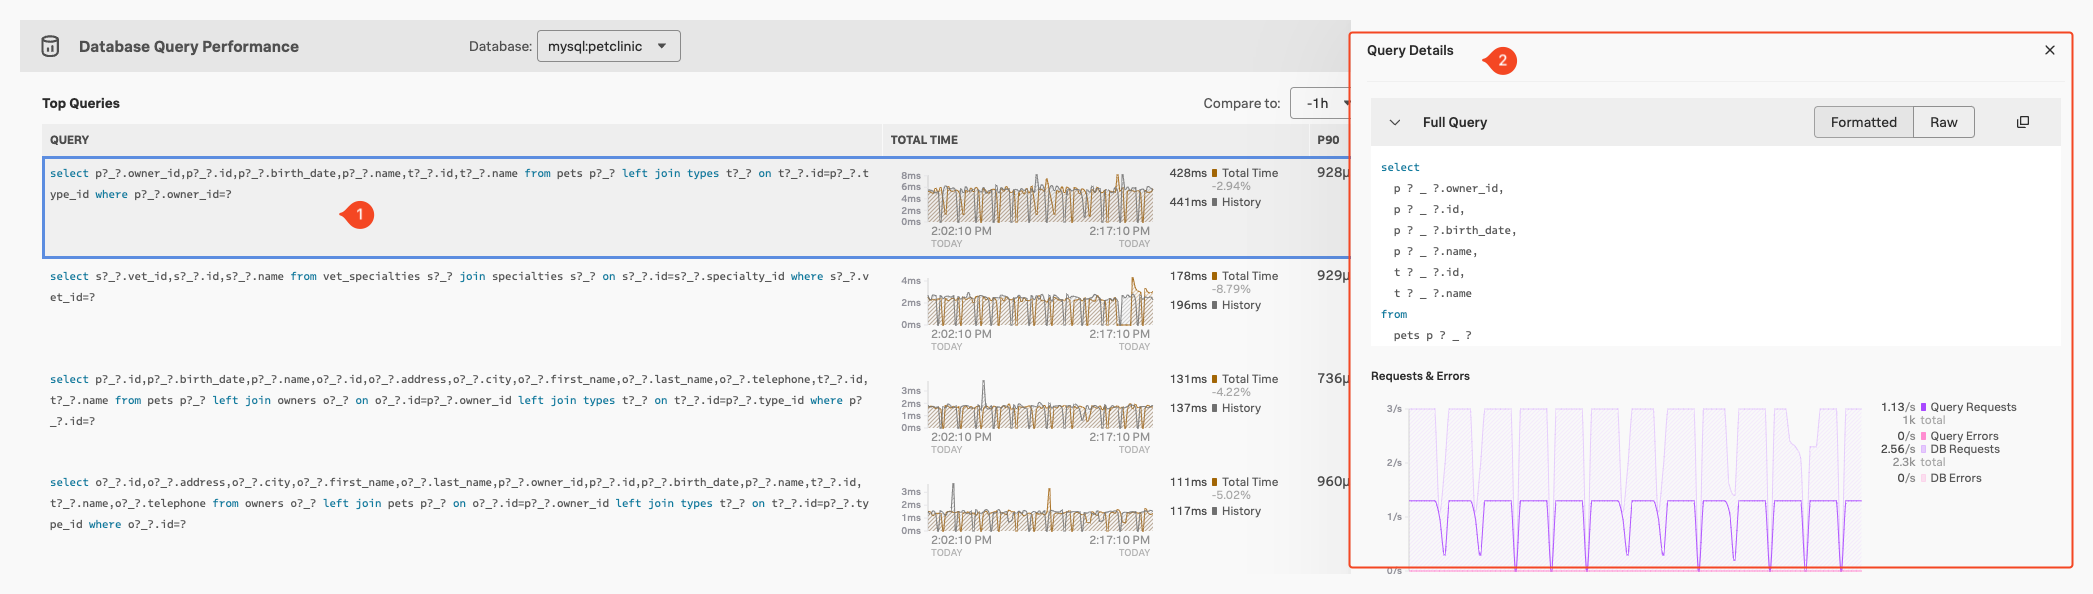
If you click on a specific Query (1) you get a detailed query Details pane appears (2), which you can use for more detailed investigations:
Log Observer
10 minutes
Up until this point, there have been no code changes, yet tracing, profiling and Database Query Performance data is being sent to Splunk Observability Cloud.
Next we will work with the Splunk Log Observer to the mix to obtain log data from the Spring PetClinic application.
The Splunk OpenTelemetry Collector automatically collects logs from the Spring PetClinic application and sends them to Splunk Observability Cloud using the OTLP exporter, annotating the log events with trace_id, span_id and trace flags.
The Splunk Log Observer is then used to view the logs and with the changes to the log format the platform can automatically correlate log information with services and traces.
In order to see logs click on the Log Observer in the left-hand menu. Once in Log Observer please ensure Index on the filter bar is set to splunk4rookies-workshop.
Next, click Add Filter and search for the field deployment.environment, select your workshop instance and click = (to include). You will now see only the log messages from your PetClinic application.
Next search for the field service.name, select the value customers-service and click = (to include). Now the log entries will be reduced to show the entries from your customers-service only.
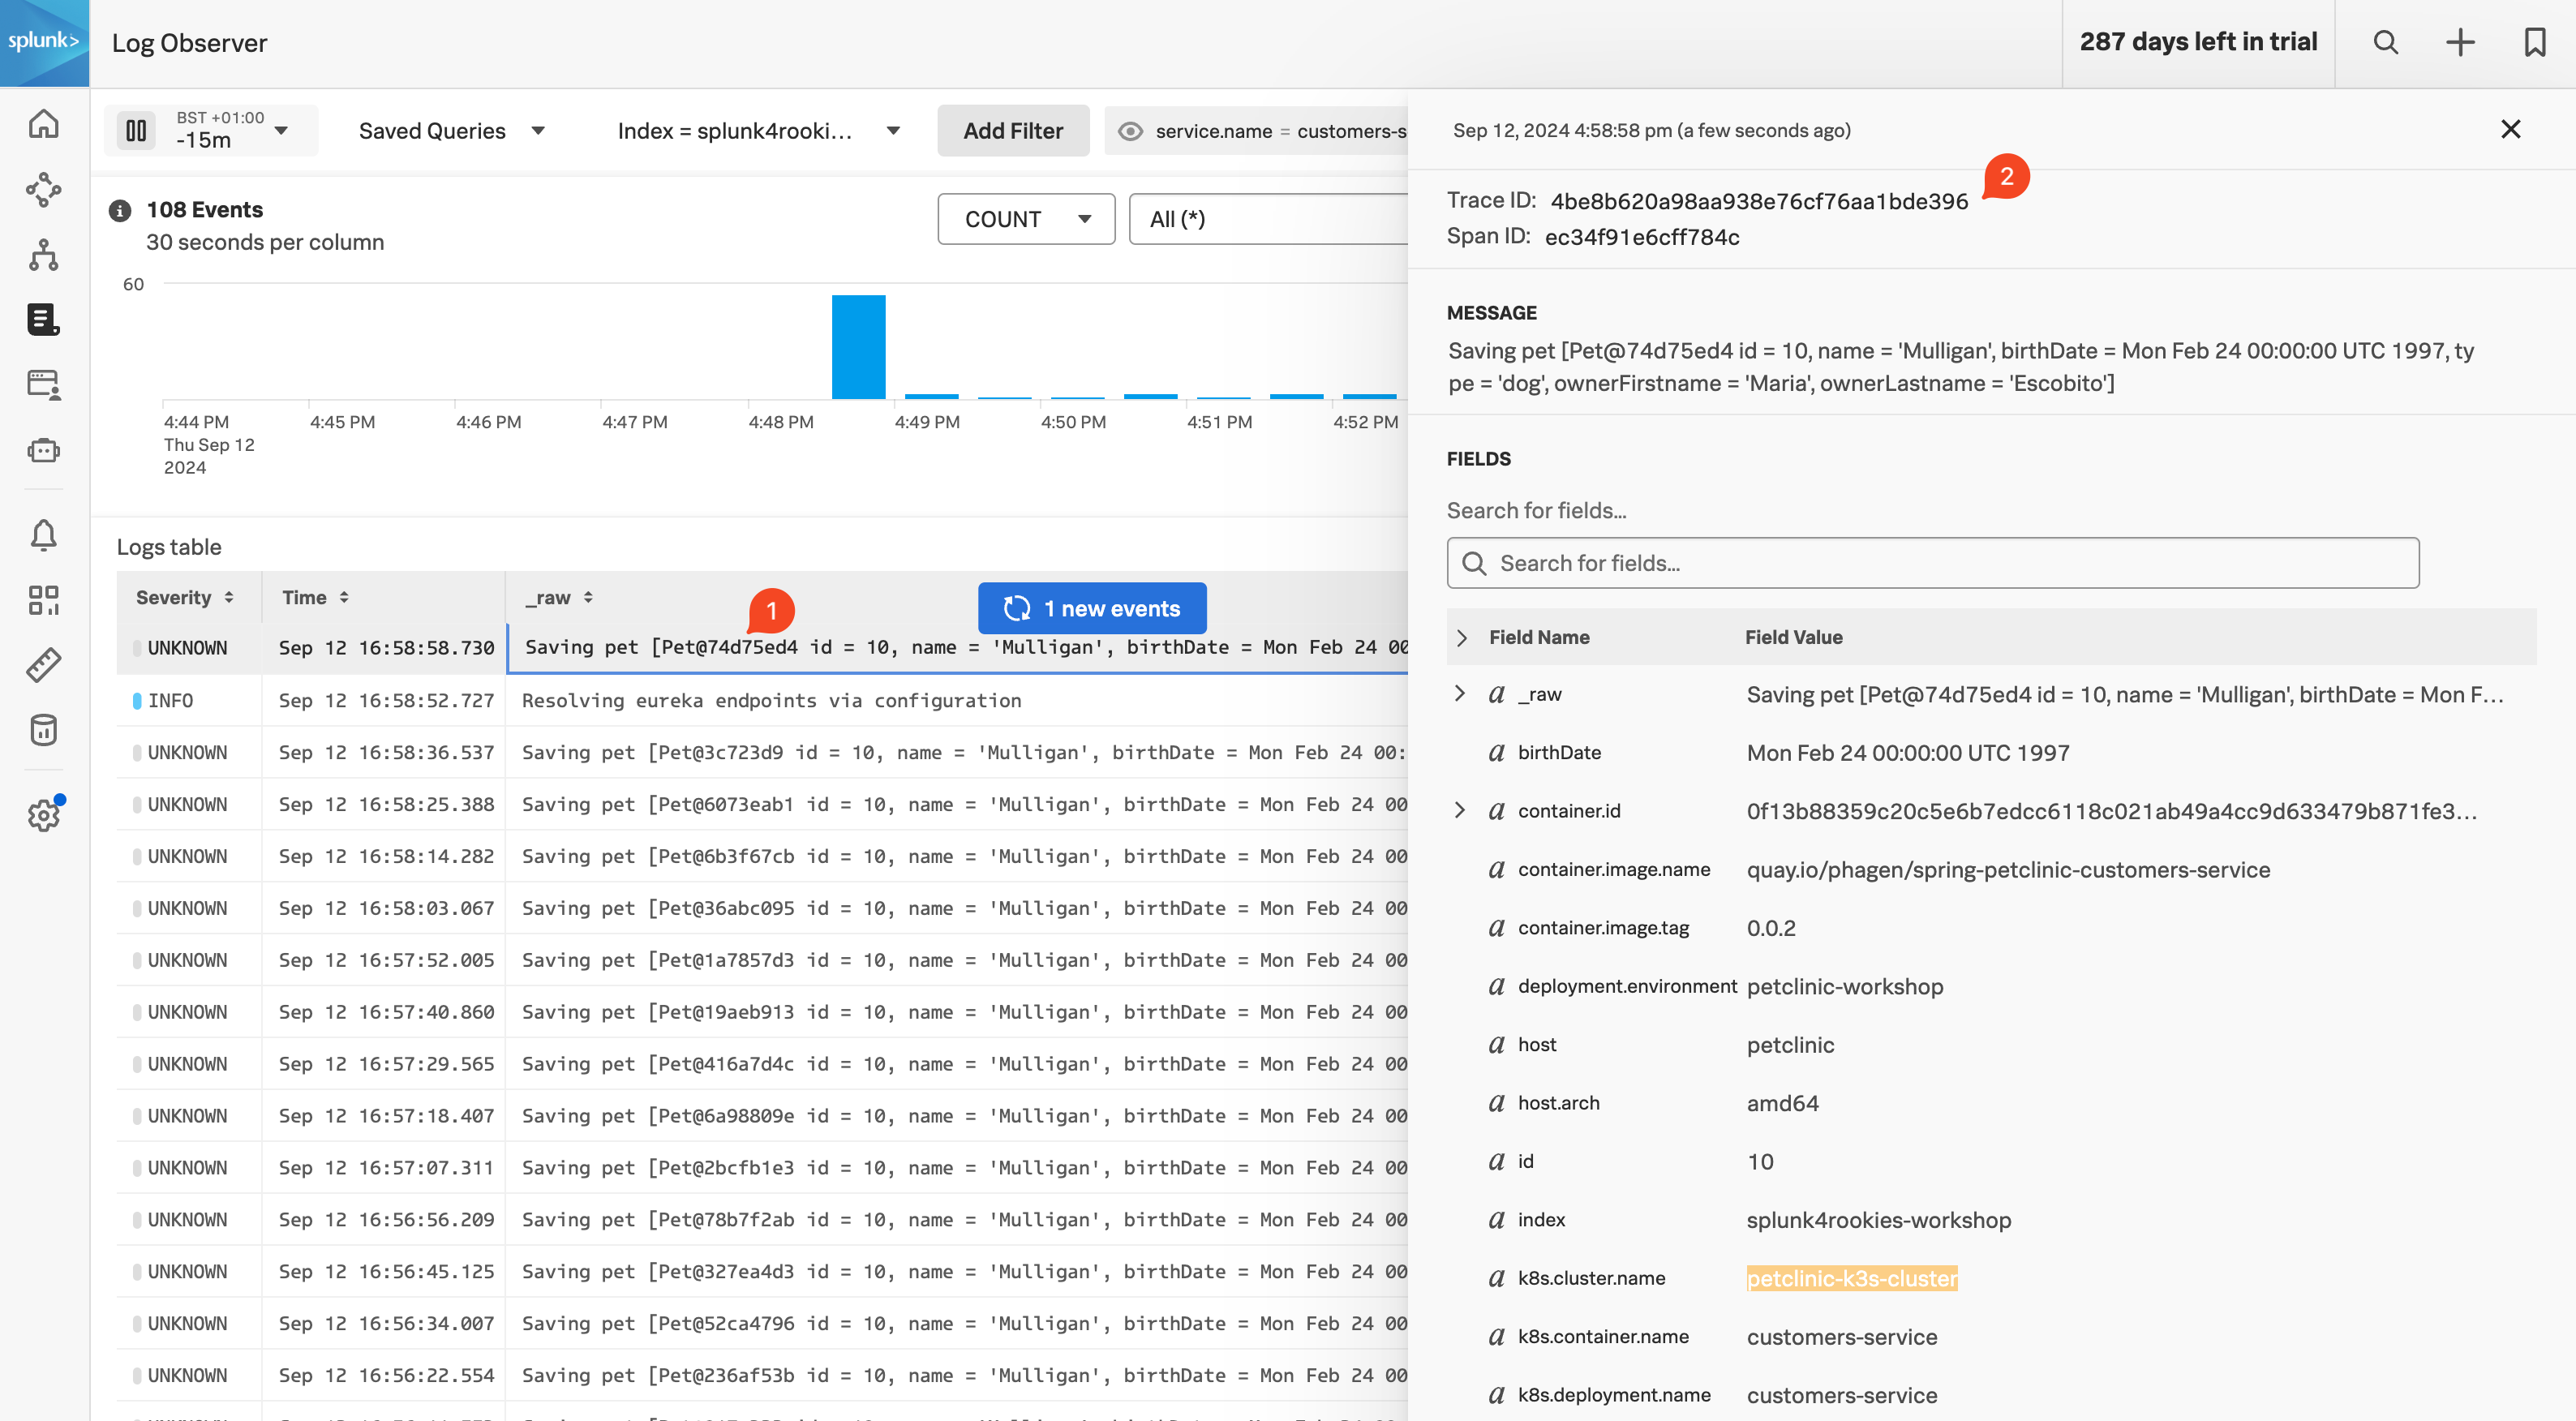
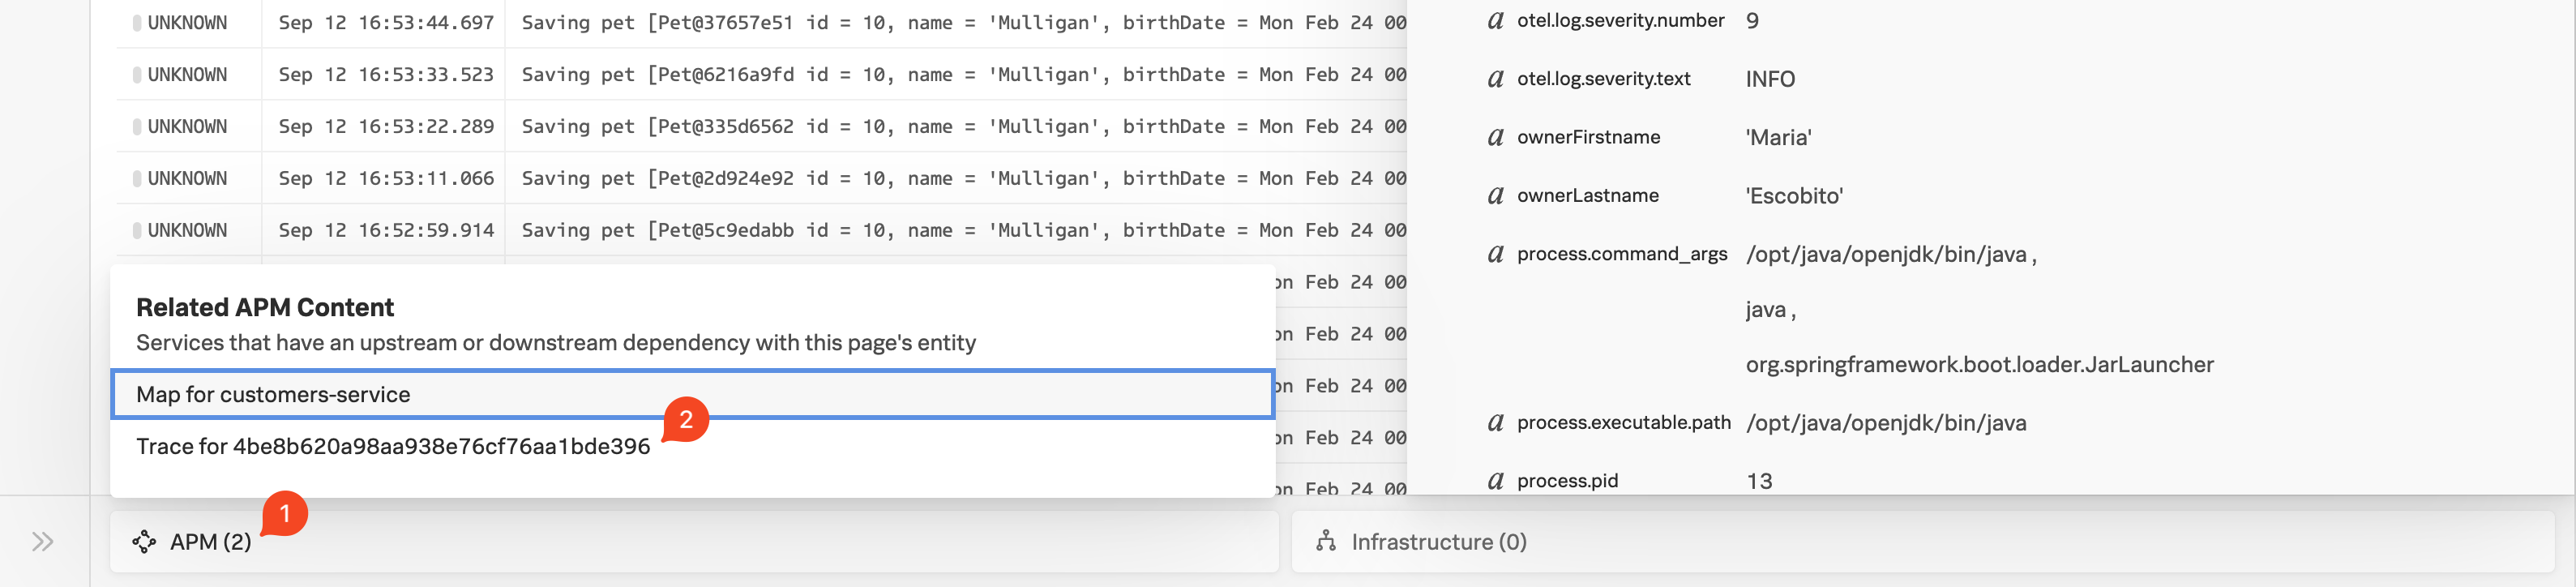
Click on an entry with an injected trace_id (1). A side pane will open where you can see the detailed information, including the relevant trace and span IDs (2).
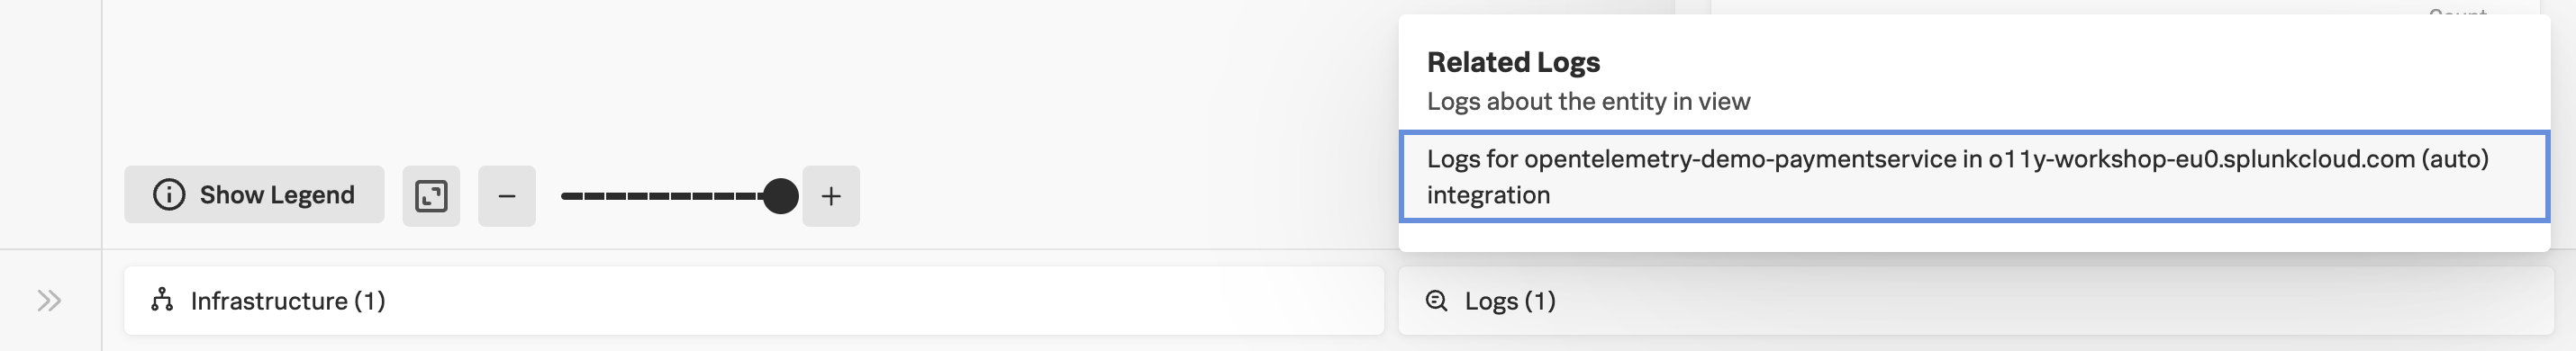
Related Content
In the bottom pane is where any related content will be reported. In the screenshot below you can see that APM has found a trace that is related to this log line (1):
By clicking on Trace for 4be8b620a98aa938e76cf76aa1bde396(2) will take us to the waterfall in APM for this specific trace that this log line was generated from:
Note that you now have Related Content pane for Logs appear (1). Clicking on this will take you back to Log Observer and will display all the log lines that are part of this trace.
Real User Monitoring
10 minutes
To enable Real User Monitoring (RUM) instrumentation for your application, you need to add the Open Telemetry Javascript https://github.com/signalfx/splunk-otel-js-web snippet to your code.
The Spring PetClinic application uses a single HTML page as the “index” page, that is reused across all pages of the application. This is the perfect location to insert the Splunk RUM Instrumentation Library as it will be loaded for all pages automatically.
The following snippet is inserted into the section of the index.html page:
<scriptsrc="/static/env.js"></script><scriptsrc="https://cdn.signalfx.com/o11y-gdi-rum/latest/splunk-otel-web.js"crossorigin="anonymous"></script><scriptsrc="https://cdn.signalfx.com/o11y-gdi-rum/latest/splunk-otel-web-session-recorder.js"crossorigin="anonymous"></script><script>varrealm=env.RUM_REALM;console.log('Realm:',realm);varauth=env.RUM_AUTH;varappName=env.RUM_APP_NAME;varenvironmentName=env.RUM_ENVIRONMENTif(realm&&auth){SplunkRum.init({realm:realm,rumAccessToken:auth,applicationName:appName,deploymentEnvironment:environmentName,version:'1.0.0',});SplunkSessionRecorder.init({app:appName,realm:realm,rumAccessToken:auth});constProvider=SplunkRum.provider;vartracer=Provider.getTracer('appModuleLoader');}else{// Realm or auth is empty, provide default values or skip initialization
console.log("Realm or auth is empty. Skipping Splunk Rum initialization.");}</script>
The above snippet of code has already been added to index.html in the repository you cloned earlier, but it is not yet activated, we will do that in the next section.
If you want you can verify the snippet, we added to the index.html by viewing the file:
more ~/spring-petclinic-microservices/spring-petclinic-api-gateway/src/main/resources/static/index.html
<!DOCTYPE html>

<html ng-app="petClinicApp" lang="en">

<head>
    <meta http-equiv="Content-Type" content="text/html; charset=UTF-8"/>
    <meta charset="utf-8"/>
    <meta http-equiv="X-UA-Compatible" content="IE=edge"/>
    <meta name="viewport" content="width=device-width, initial-scale=1, user-scalable=0, minimal-ui"/>
    <!-- The above 4 meta tags *must* come first in the head; any other head content must come *after* these tags -->

    <link rel="shortcut icon" type="image/x-icon" href="/images/favicon.png"/>

    <title>PetClinic :: a Spring Framework demonstration</title>
    <link rel="stylesheet" href="/webjars/bootstrap/css/bootstrap.min.css"/>
    <link rel="stylesheet" href="/css/petclinic.css"/>

    <script src="/webjars/jquery/jquery.min.js"></script>
    <script src="/webjars/bootstrap/js/bootstrap.min.js"></script>

    <script src="/webjars/angularjs/angular.min.js"></script>
    <script src="/webjars/angular-ui-router/angular-ui-router.min.js"></script>
    <!-- Section added for  RUM -->
    <script src="/scripts/env.js"></script>
    <script src="https://cdn.signalfx.com/o11y-gdi-rum/latest/splunk-otel-web.js" crossorigin="anonymous"></script>
    <script src="https://cdn.signalfx.com/o11y-gdi-rum/latest/splunk-otel-web-session-recorder.js" crossorigin="anonymous"></script>
    <script>
        var realm = env.RUM_REALM;
        console.log('Realm:', realm);
        var auth = env.RUM_AUTH;
        var appName = env.RUM_APP_NAME;
        var environmentName = env.RUM_ENVIRONMENT
        if (realm && auth) {
            SplunkRum.init({
                realm: realm,
                rumAccessToken: auth,
                applicationName: appName,
                deploymentEnvironment: environmentName,
                version: '1.0.0',
            });

            SplunkSessionRecorder.init({
                app: appName,
                realm: realm,
                rumAccessToken: auth
            });
            const Provider = SplunkRum.provider;
            var tracer=Provider.getTracer('appModuleLoader');
        } else {
        // Realm or auth is empty, provide default values or skip initialization
        console.log("Realm or auth is empty. Skipping Splunk Rum initialization.");
        }
    </script>
     <!-- Section added for  RUM -->
    <script src="/scripts/app.js"></script>
Subsections of Real User Monitoring
Rebuild PetClinic with RUM enabled
At the top of the previous code snippet, there is a reference to the file /static/env.js, which contains/sets the variables used by RUM, currently these are not configured and therefore no RUM traces are currently being sent.
Run the script that will update variables to enable RUM traces so they are viewable in Splunk Observability Cloud. Note, that the env.js script contains a deliberate JavaScript error, that will be picked up in RUM:
As soon as the container is pushed into the repository, just restart the api-gateway to apply the changes:
kubectl rollout restart deployment api-gateway
deployment.apps/api-gateway restarted
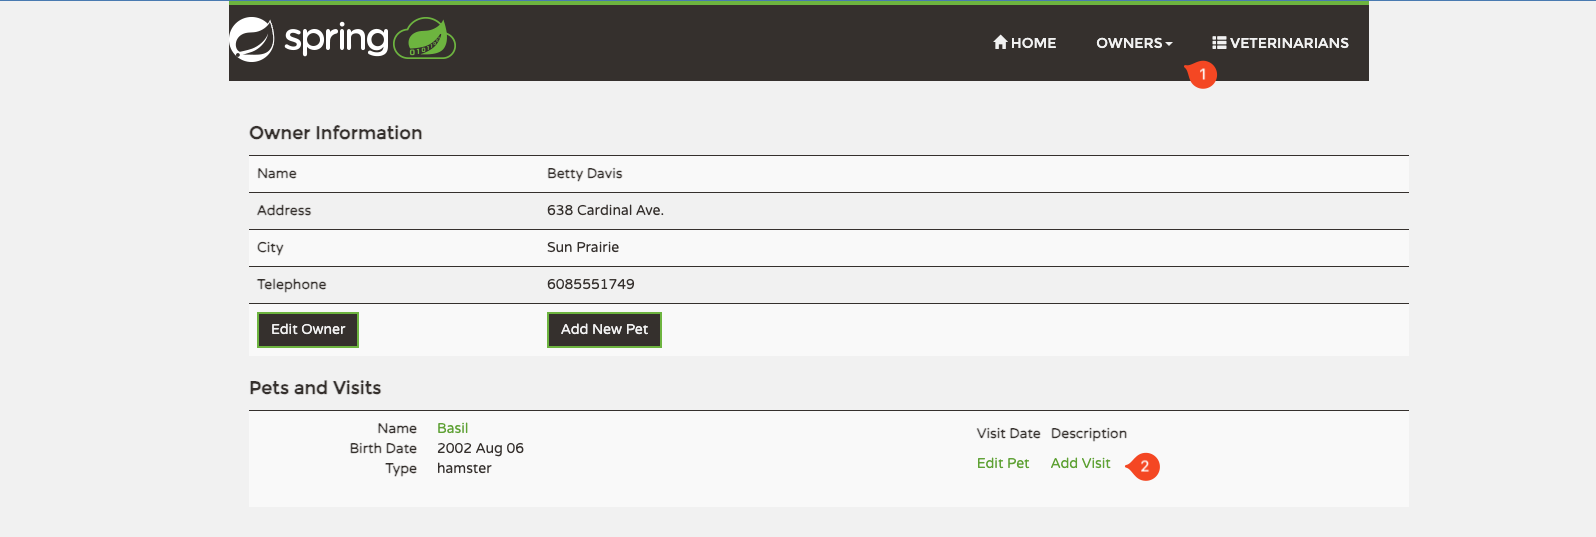
Validate that the application is running by visiting http://<IP_ADDRESS>:81 (replace <IP_ADDRESS> with the IP address you obtained above). Make sure the application is working correctly by visiting the All Owners(1) and select an owner, then add a visit(2). We will use this action when checking RUM
If you want, you can access this website on your phone/tablet as well as this data will also show up in RUM.
Select the RUM view for the Petclinic App
Once RUM has been configured and you have added a visit for a pet, you can log in to Splunk Observability Cloud and verify that RUM traces are flowing in.
Lets start a quick high level tour into RUM by clicking RUM in the left-hand menu. Then change the Environment filter (1) to the name of your workshop instance from the dropdown box, it will be <INSTANCE>-workshop(1) (where INSTANCE is the value from the shell script you ran earlier). Make sure it is the only one selected.
Then change the App(2) dropdown box to the name of your app, it will be <INSTANCE>-store
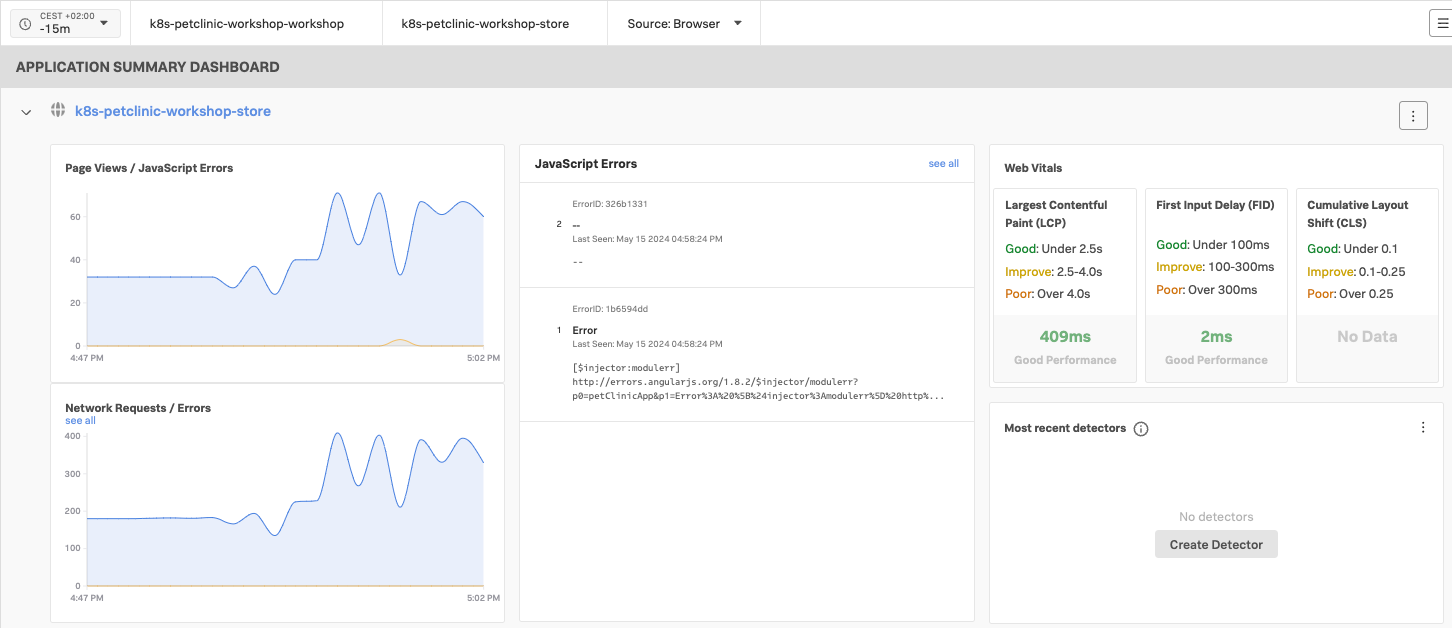
Once you have selected your Environment and App, you will see an overview page showing the RUM status of your App (if your Summary Dashboard is just a single row of numbers, you are looking at the condensed view. You can expand it by clicking on the > in front of the Application name). If any JavaScript error occurred they will show up as shown below:
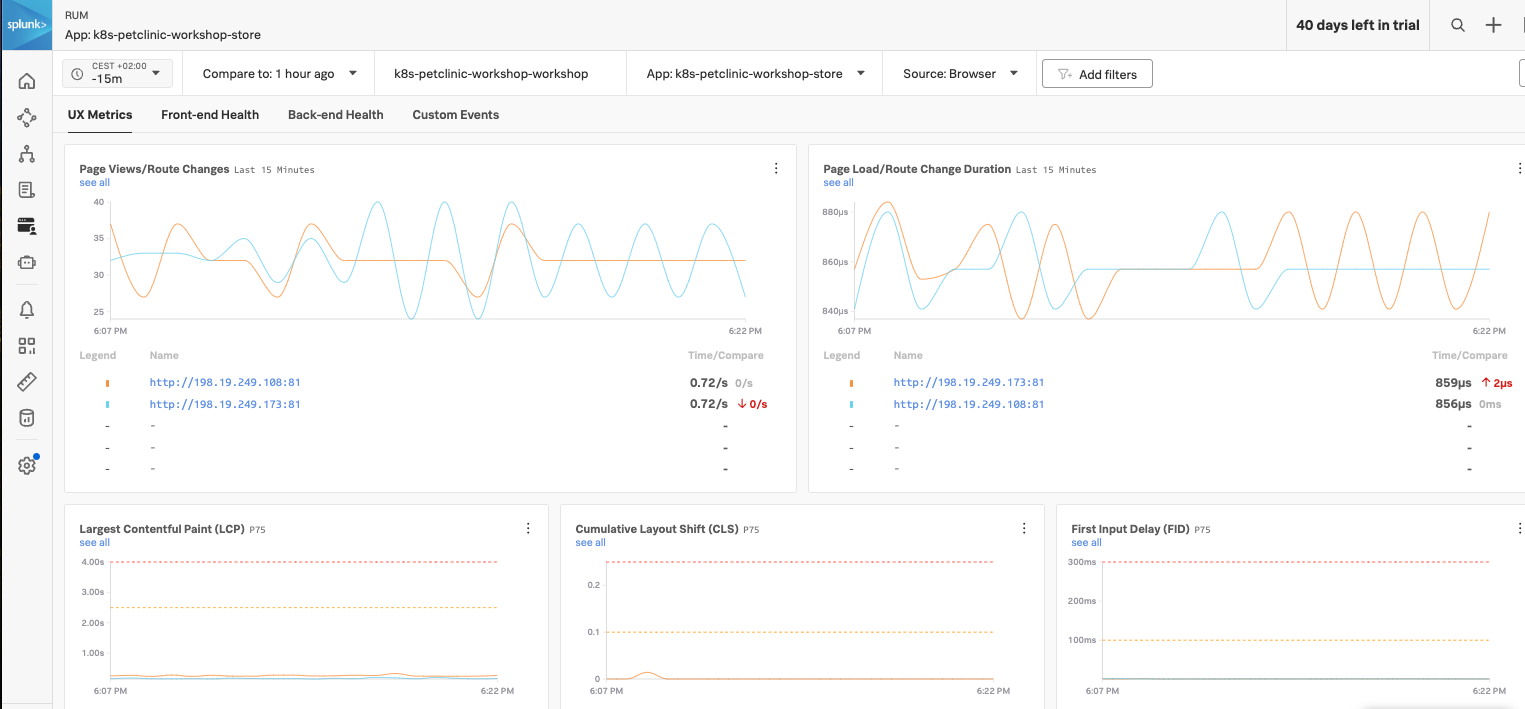
To continue, click on the blue link (with your workshop name) to get to the details page, this will bring up a new dashboard view breaking down the interactions by UX Metrics, Front-end Health, Back-end Health and Custom Events and comparing them to historic metrics (1 hour by default).
Normally you have only one line inside the first chart, Click on the link that relates to your Petclinic shop,
http://198.19.249.62 in our example:
This will bring us to the Tag Spotlight page:
RUM trace Waterfall view & linking to APM
In the TAG Spotlight view, you are presented with all the tags associated with the RUM data. Tags are key-value pairs that are used to identify the data. In this case, the tags are automatically generated by the OpenTelemetry instrumentation. The tags are used to filter the data and to create the charts and tables. The Tag Spotlight view allows you detect trends in behavior and to drill down into a user session.
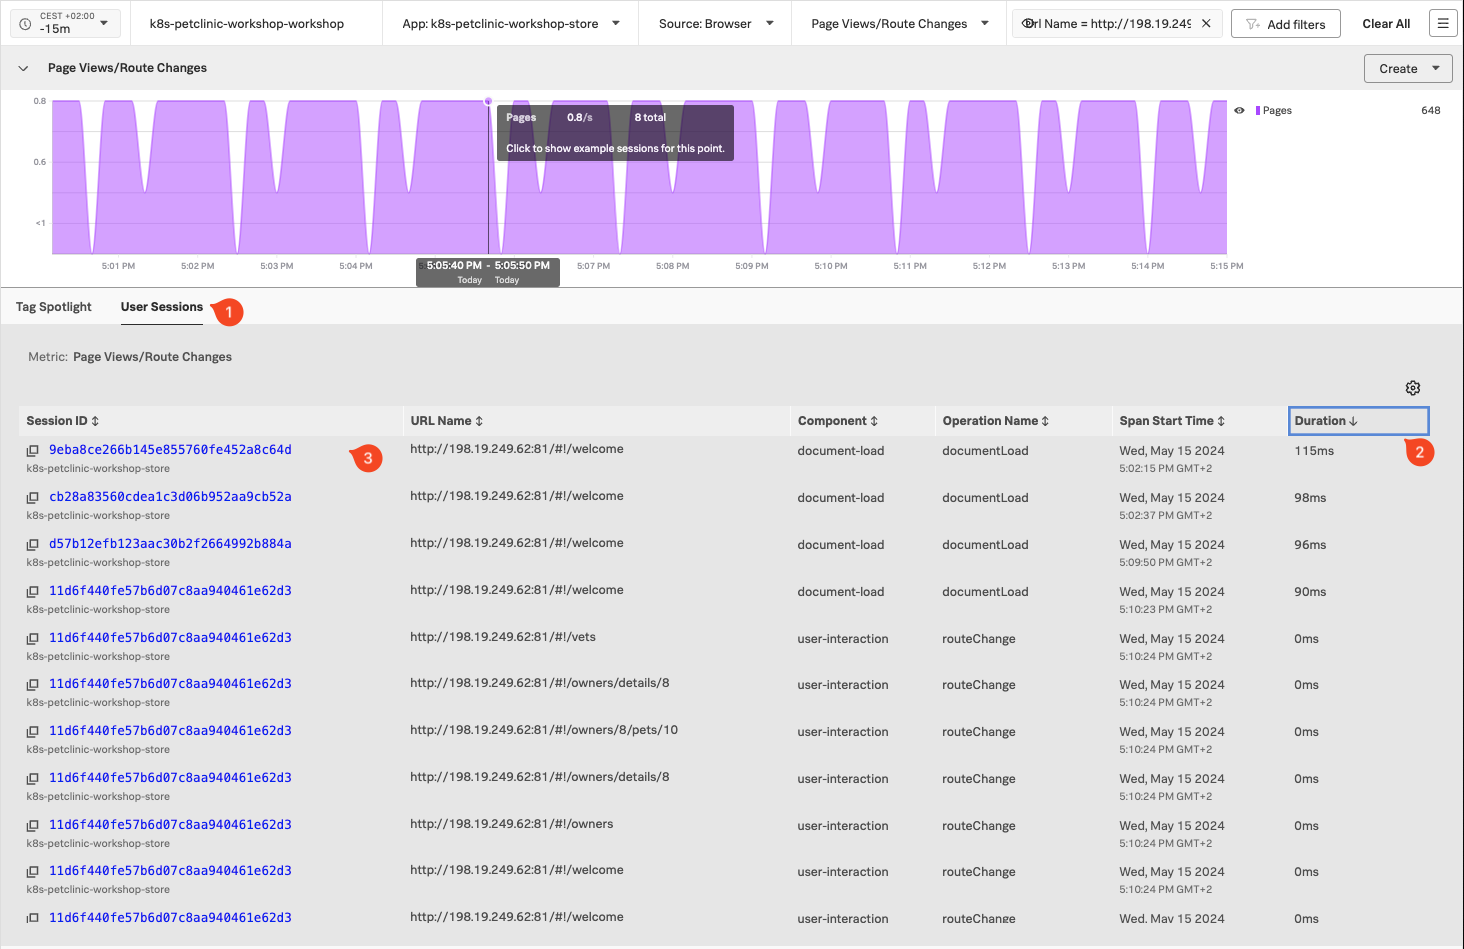
Click on User Sessions (1), this will show you the list of user session that occurred during the time window.
We want to look at one of the session , so click on Duration(2) to sort on duration, and make sure you click on the link of one of the longer ones (3):
RUM trace Waterfall view & linking to APM
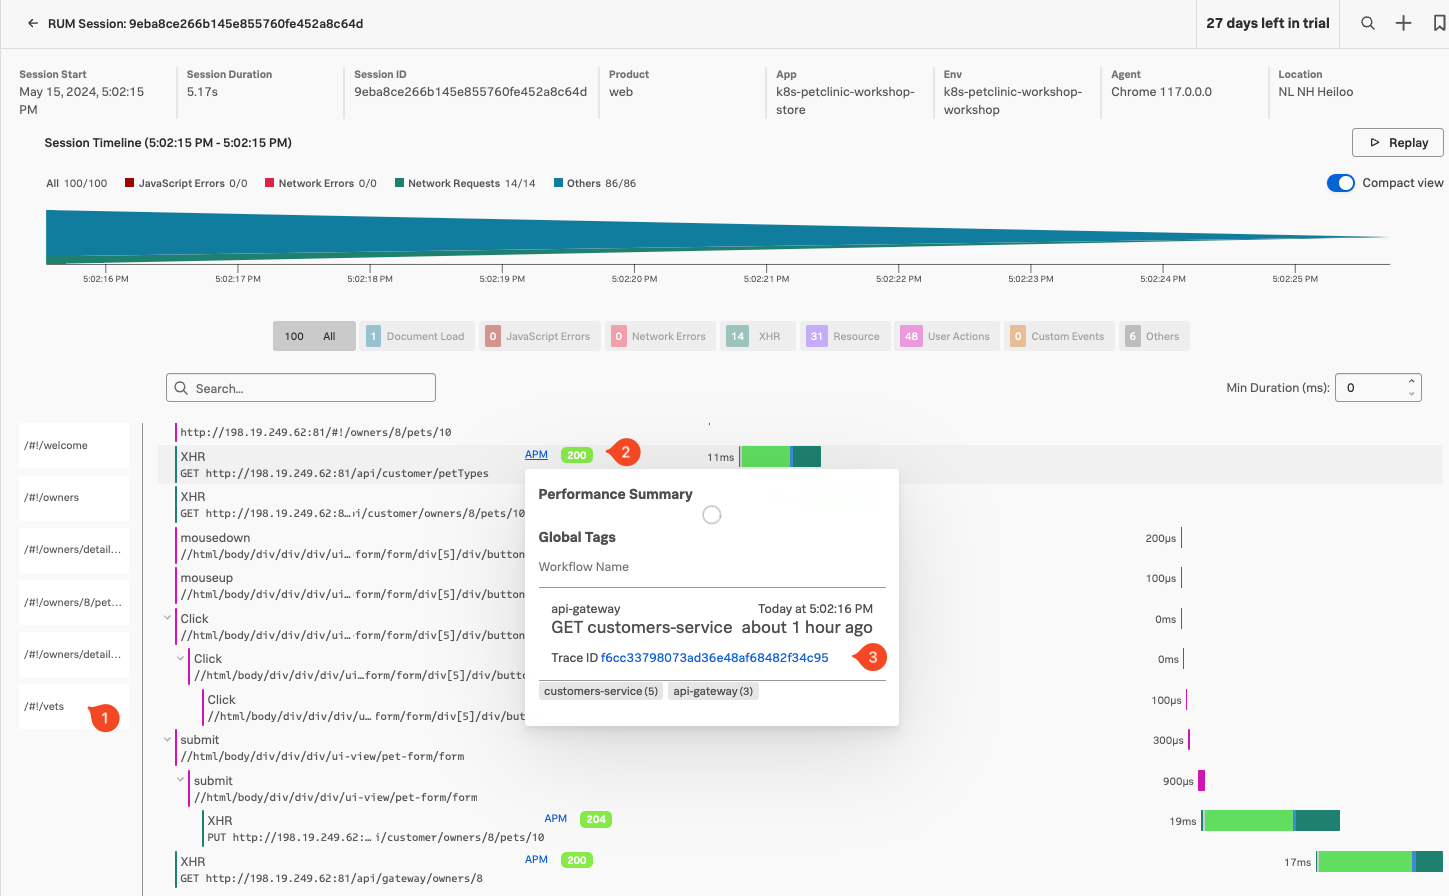
We are now looking at the RUM Trace waterfall, this will tell you what happened during the session on the user device as they visited the page of our petclinic application.
If you scroll down the waterfall find click on the Vets segment on the right (1), you see a list of action that occurred during the handling of the Vets request. Note, that the HTTP request have a blue APM link before the return code. Pick one, and click on the APM link. This will show you the APM info for this Ser vice call to our Microservices in Kubernetes.
Note , that there give you the information what happened during action in the Microservices, and if you want to drill down to verify what happened with the request, click on the Trace ID url.
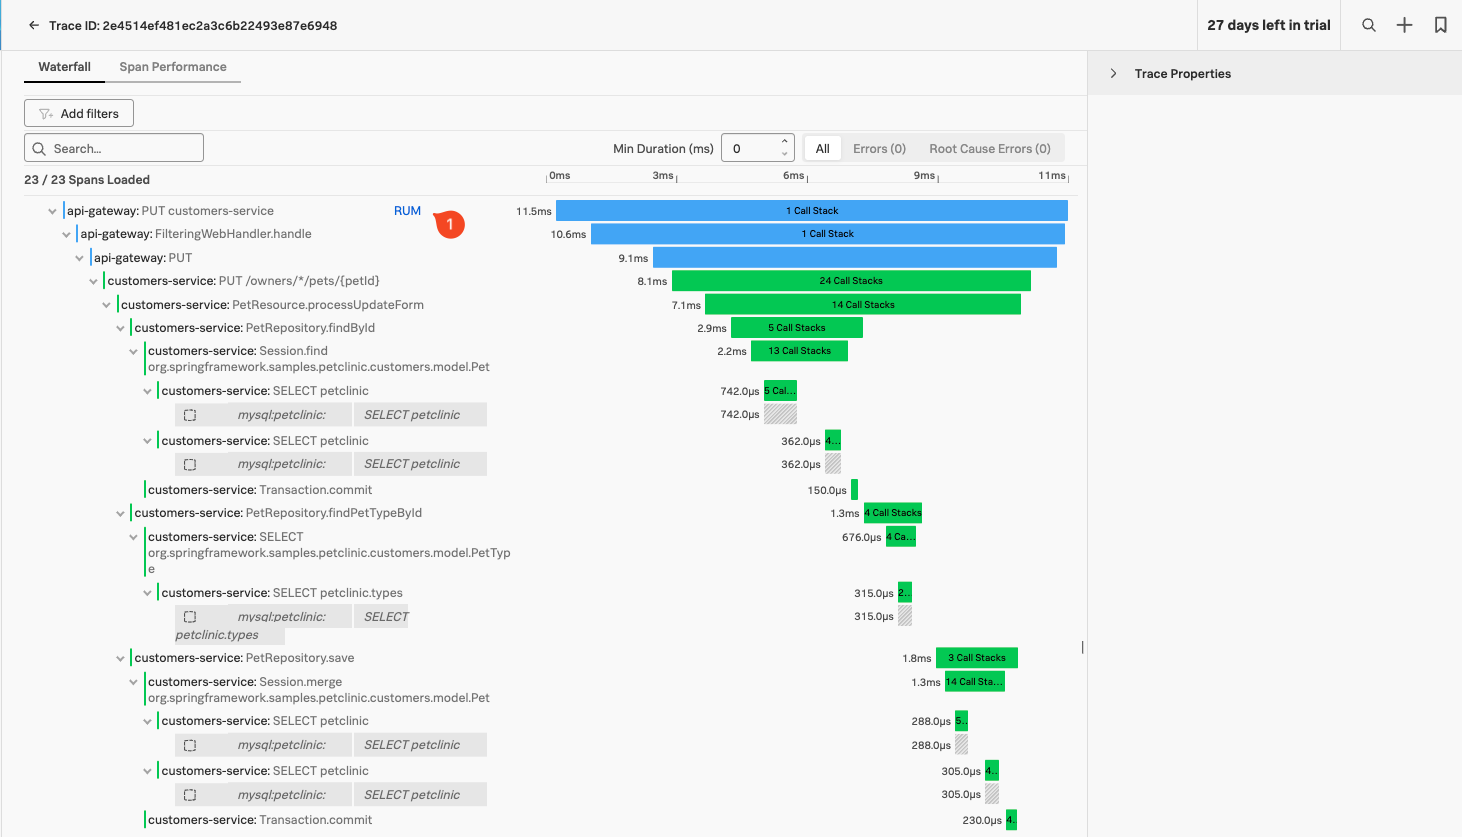
This will show you the trace related to your request from RUM:
You can see that the entry point into your service now has a RUM (1) related content link added, allowing you to return back to your RUM session after you validated what happened in your Microservices.
Workshop Wrap-up 🎁
Congratulations, you have completed the Get the Most Out of Your Existing Kubernetes Java Applications Using Automatic Discovery and Configuration With OpenTelemetry workshop.
Today, you have learnt how easy it is to add Tracing, Code Profiling and Database Query Performance to your existing Java application in Kubernetes.
You immediately improved the observability of the application and infrastructure with out touching a line of code or configuration using Automatic Discovery and Configuration.
You also learnt that with simple configuration changes you can add even more observability (logging and RUM) to the application in order to provide end-to-end observability.
NodeJS Zero-Config Workshop
30 minutesAuthor
Robert Castley
The goal is to walk through the basic steps to configure the following components of the Splunk Observability Cloud platform:
Splunk Infrastructure Monitoring (IM)
Splunk Zero Configuration Auto Instrumentation for NodeJS (APM)
AlwaysOn Profiling
Splunk Log Observer (LO)
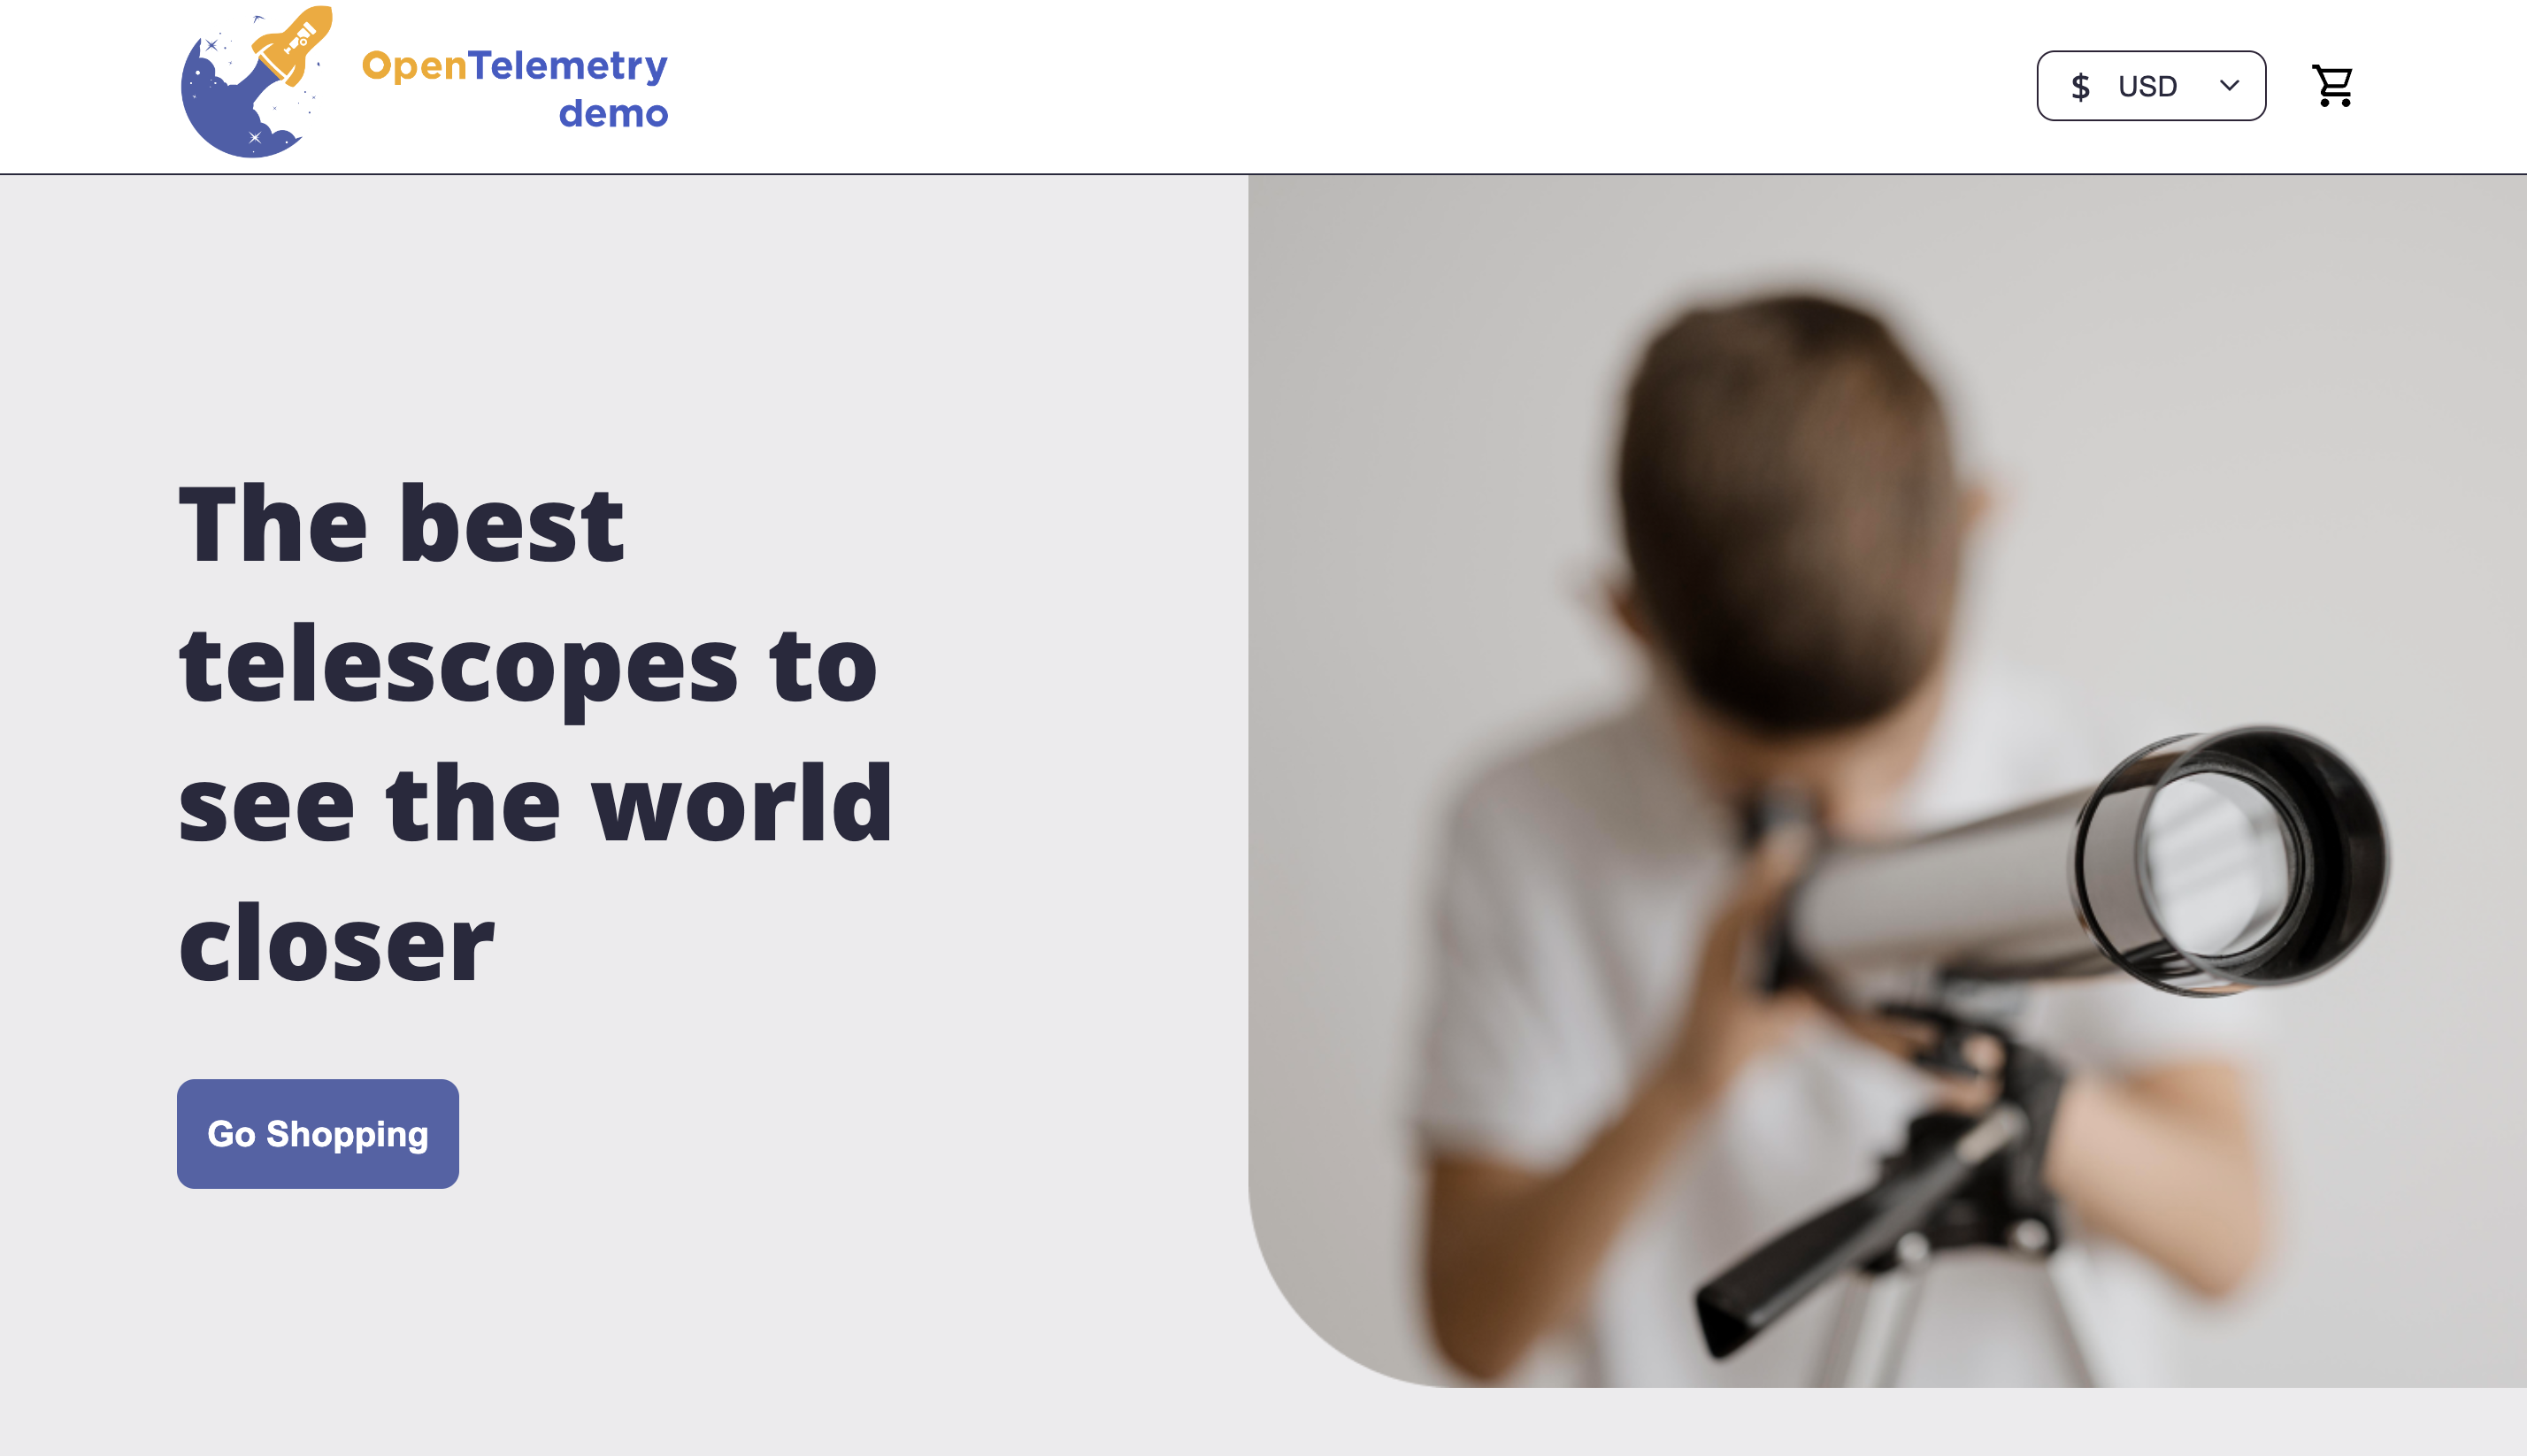
We will deploy the OpenTelemetry Astronomy Shop application in Kubernetes, which contains two NodeJS services (Frontend & Payment Service). Once the application and the OpenTelemetry Connector are up and running, we will start seeing metrics, traces and logs via the Zero Configuration Auto Instrumentation for NodeJS that will be used by the Splunk Observability Cloud platform to provide insights into the application.
Prerequisites
Outbound SSH access to port 2222.
Outbound HTTP access to port 8083.
Familiarity with the bash shell and vi/vim editor.
To not conflict with other workshops, we will deploy the OpenTelemetry Demo in a separate namespace called otel-demo. To create the namespace, run the following command:
kubectl create namespace otel-demo
2. Deploy the OpenTelemetry Demo
Next, change to the directory containing the OpenTelemetry Demo application:
cd ~/workshop/apm
Deploy the OpenTelemetry Demo application:
kubectl apply -n otel-demo -f otel-demo.yaml
serviceaccount/opentelemetry-demo created
service/opentelemetry-demo-adservice created
service/opentelemetry-demo-cartservice created
service/opentelemetry-demo-checkoutservice created
service/opentelemetry-demo-currencyservice created
service/opentelemetry-demo-emailservice created
service/opentelemetry-demo-featureflagservice created
service/opentelemetry-demo-ffspostgres created
service/opentelemetry-demo-frontend created
service/opentelemetry-demo-kafka created
service/opentelemetry-demo-loadgenerator created
service/opentelemetry-demo-paymentservice created
service/opentelemetry-demo-productcatalogservice created
service/opentelemetry-demo-quoteservice created
service/opentelemetry-demo-recommendationservice created
service/opentelemetry-demo-redis created
service/opentelemetry-demo-shippingservice created
deployment.apps/opentelemetry-demo-accountingservice created
deployment.apps/opentelemetry-demo-adservice created
deployment.apps/opentelemetry-demo-cartservice created
deployment.apps/opentelemetry-demo-checkoutservice created
deployment.apps/opentelemetry-demo-currencyservice created
deployment.apps/opentelemetry-demo-emailservice created
deployment.apps/opentelemetry-demo-featureflagservice created
deployment.apps/opentelemetry-demo-ffspostgres created
deployment.apps/opentelemetry-demo-frauddetectionservice created
deployment.apps/opentelemetry-demo-frontend created
deployment.apps/opentelemetry-demo-kafka created
deployment.apps/opentelemetry-demo-loadgenerator created
deployment.apps/opentelemetry-demo-paymentservice created
deployment.apps/opentelemetry-demo-productcatalogservice created
deployment.apps/opentelemetry-demo-quoteservice created
deployment.apps/opentelemetry-demo-recommendationservice created
deployment.apps/opentelemetry-demo-redis created
deployment.apps/opentelemetry-demo-shippingservice created
Once the application is deployed, we need to wait for the pods to be in a Running state. To check the status of the pods, run the following command:
Obtain the public IP address of the instance you are running on. You can do this by running the following command:
curl ifconfig.me
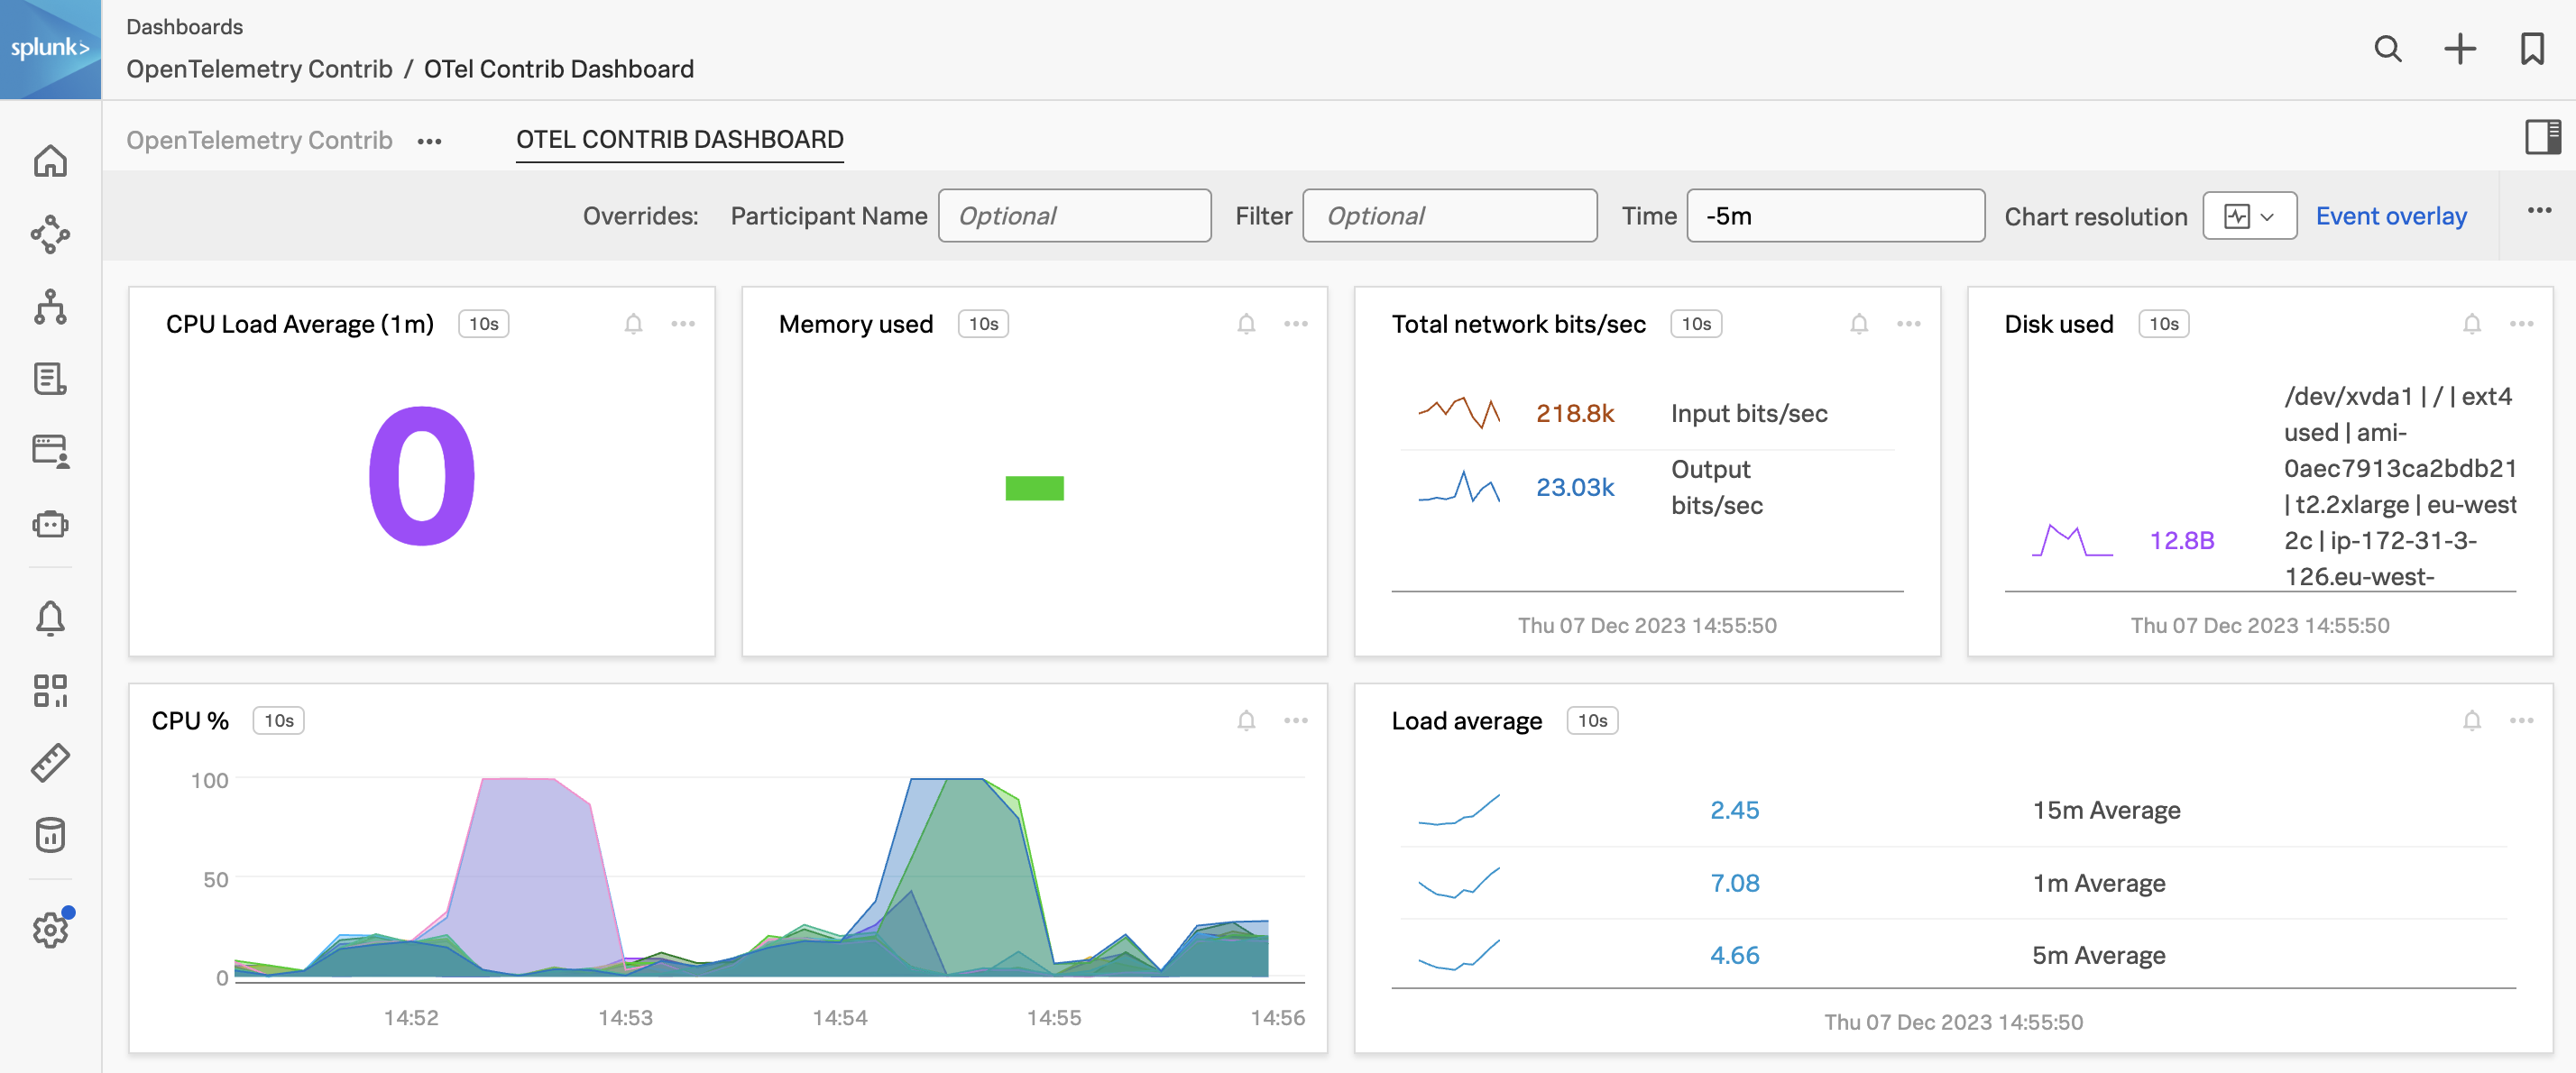
Once the port-forward is running, you can access the application by opening a browser and navigating to http://<public IP address>:8083. You should see the following:
Once you have confirmed the application is running, you can close the port-forward by pressing ctrl + c.
Next, we will deploy the OpenTelemetry Collector.
Installing the OpenTelemetry Collector
1. Introduction
Delete any existing OpenTelemetry Collectors
If you have completed any other Observability workshops, please ensure you delete the collector running in Kubernetes before continuing. This can be done by running the following command:
helm delete splunk-otel-collector
2. Confirm environment variables
To ensure your instance is configured correctly, we need to confirm that the required environment variables for this workshop are set correctly. In your terminal run the following command:
env
In the output check the following environment variables are present and have values set:
ACCESS_TOKEN
REALM
RUM_TOKEN
HEC_TOKEN
HEC_URL
For this workshop, all of the above are required. If any are missing, please contact your instructor.
3. Install the OpenTelemetry Collector
We can then go ahead and install the Collector. Some additional parameters are passed to the helm install command, they are:
--set="operator.enabled=true" - Enabled the Splunk OpenTelemetry Collector Operator for Kubernetes.
--set="certmanager.enabled=true" - The cert-manager adds certificates and certificate issuers as resource types in Kubernetes clusters and simplifies the process of obtaining, renewing and using those certificates.
--set="splunkObservability.profilingEnabled=true" - Enables CPU/Memory profiling for supported languages.
Once the installation is completed, you can navigate to the Kubernetes Navigator to see the data from your host.
Click on Add filters select k8s.cluster.name and select the cluster of your workshop instance.
You can determine your instance name from the command prompt in your terminal session:
echo$INSTANCE
Once you see data flowing for your host, we are then ready to get started with the APM component.
Zero Configuration - Frontend Service
1. Patching the Frontend service
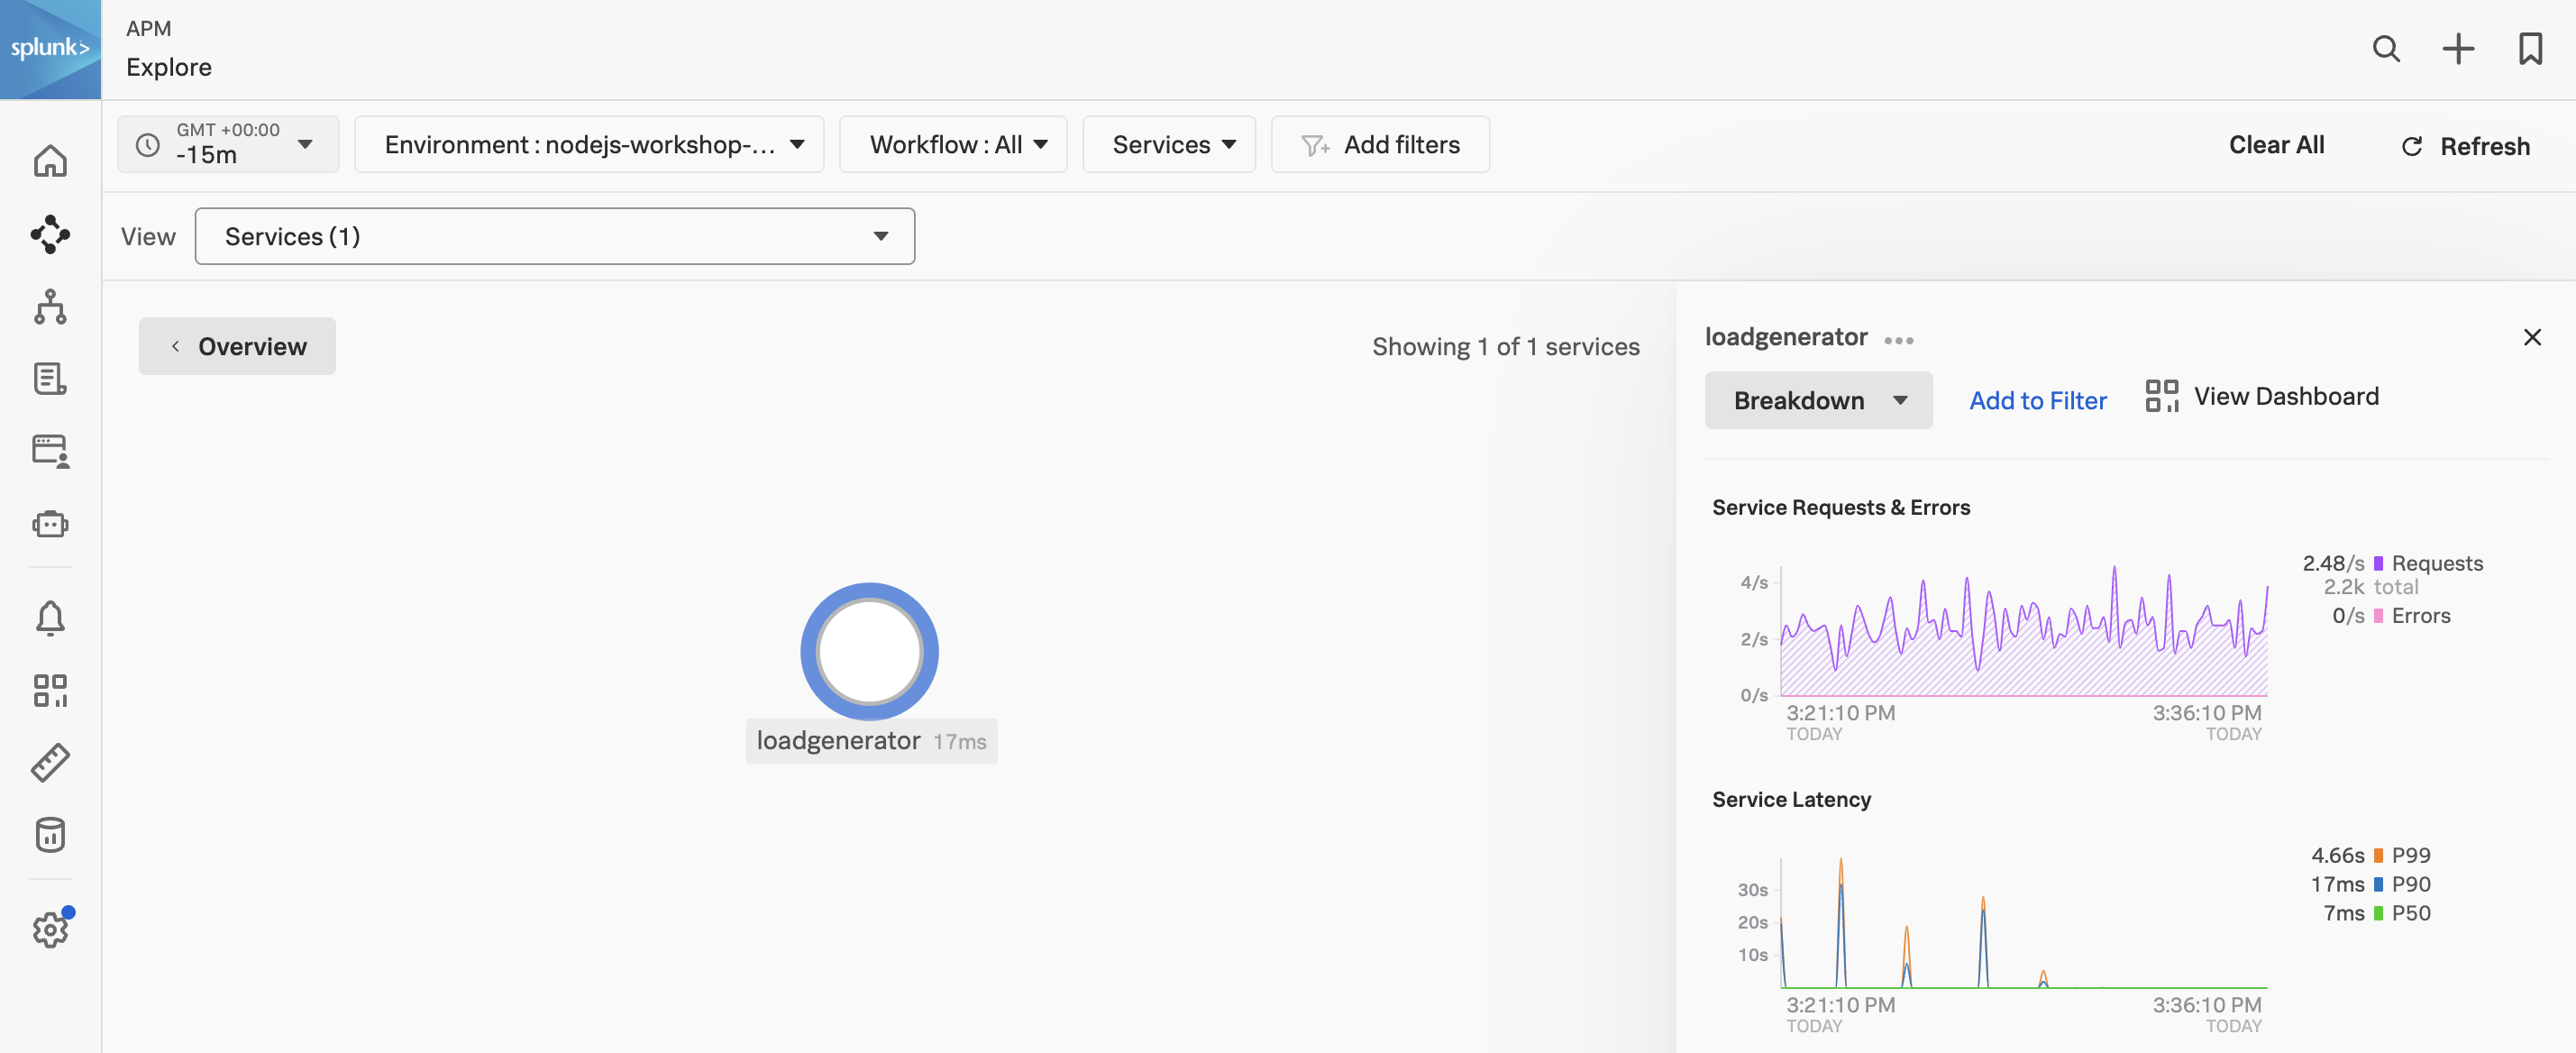
First, confirm that you can see your environment in APM. There should be a service called loadgenerator displayed in the Service map.
Next, we will patch the frontend deployment with an annotation to inject the NodeJS auto instrumentation. This will allow us to see the frontend service in APM. Note, that at this point we have not edited any code.
This will cause the opentelemetry-demo-frontend pod to restart.
The annotation value default/splunk-otel-collector refers to the instrumentation configuration named splunk-otel-collector in the default namespace.
If the chart is not installed in the default namespace, modify the annotation value to be {chart_namespace}/splunk-otel-collector.
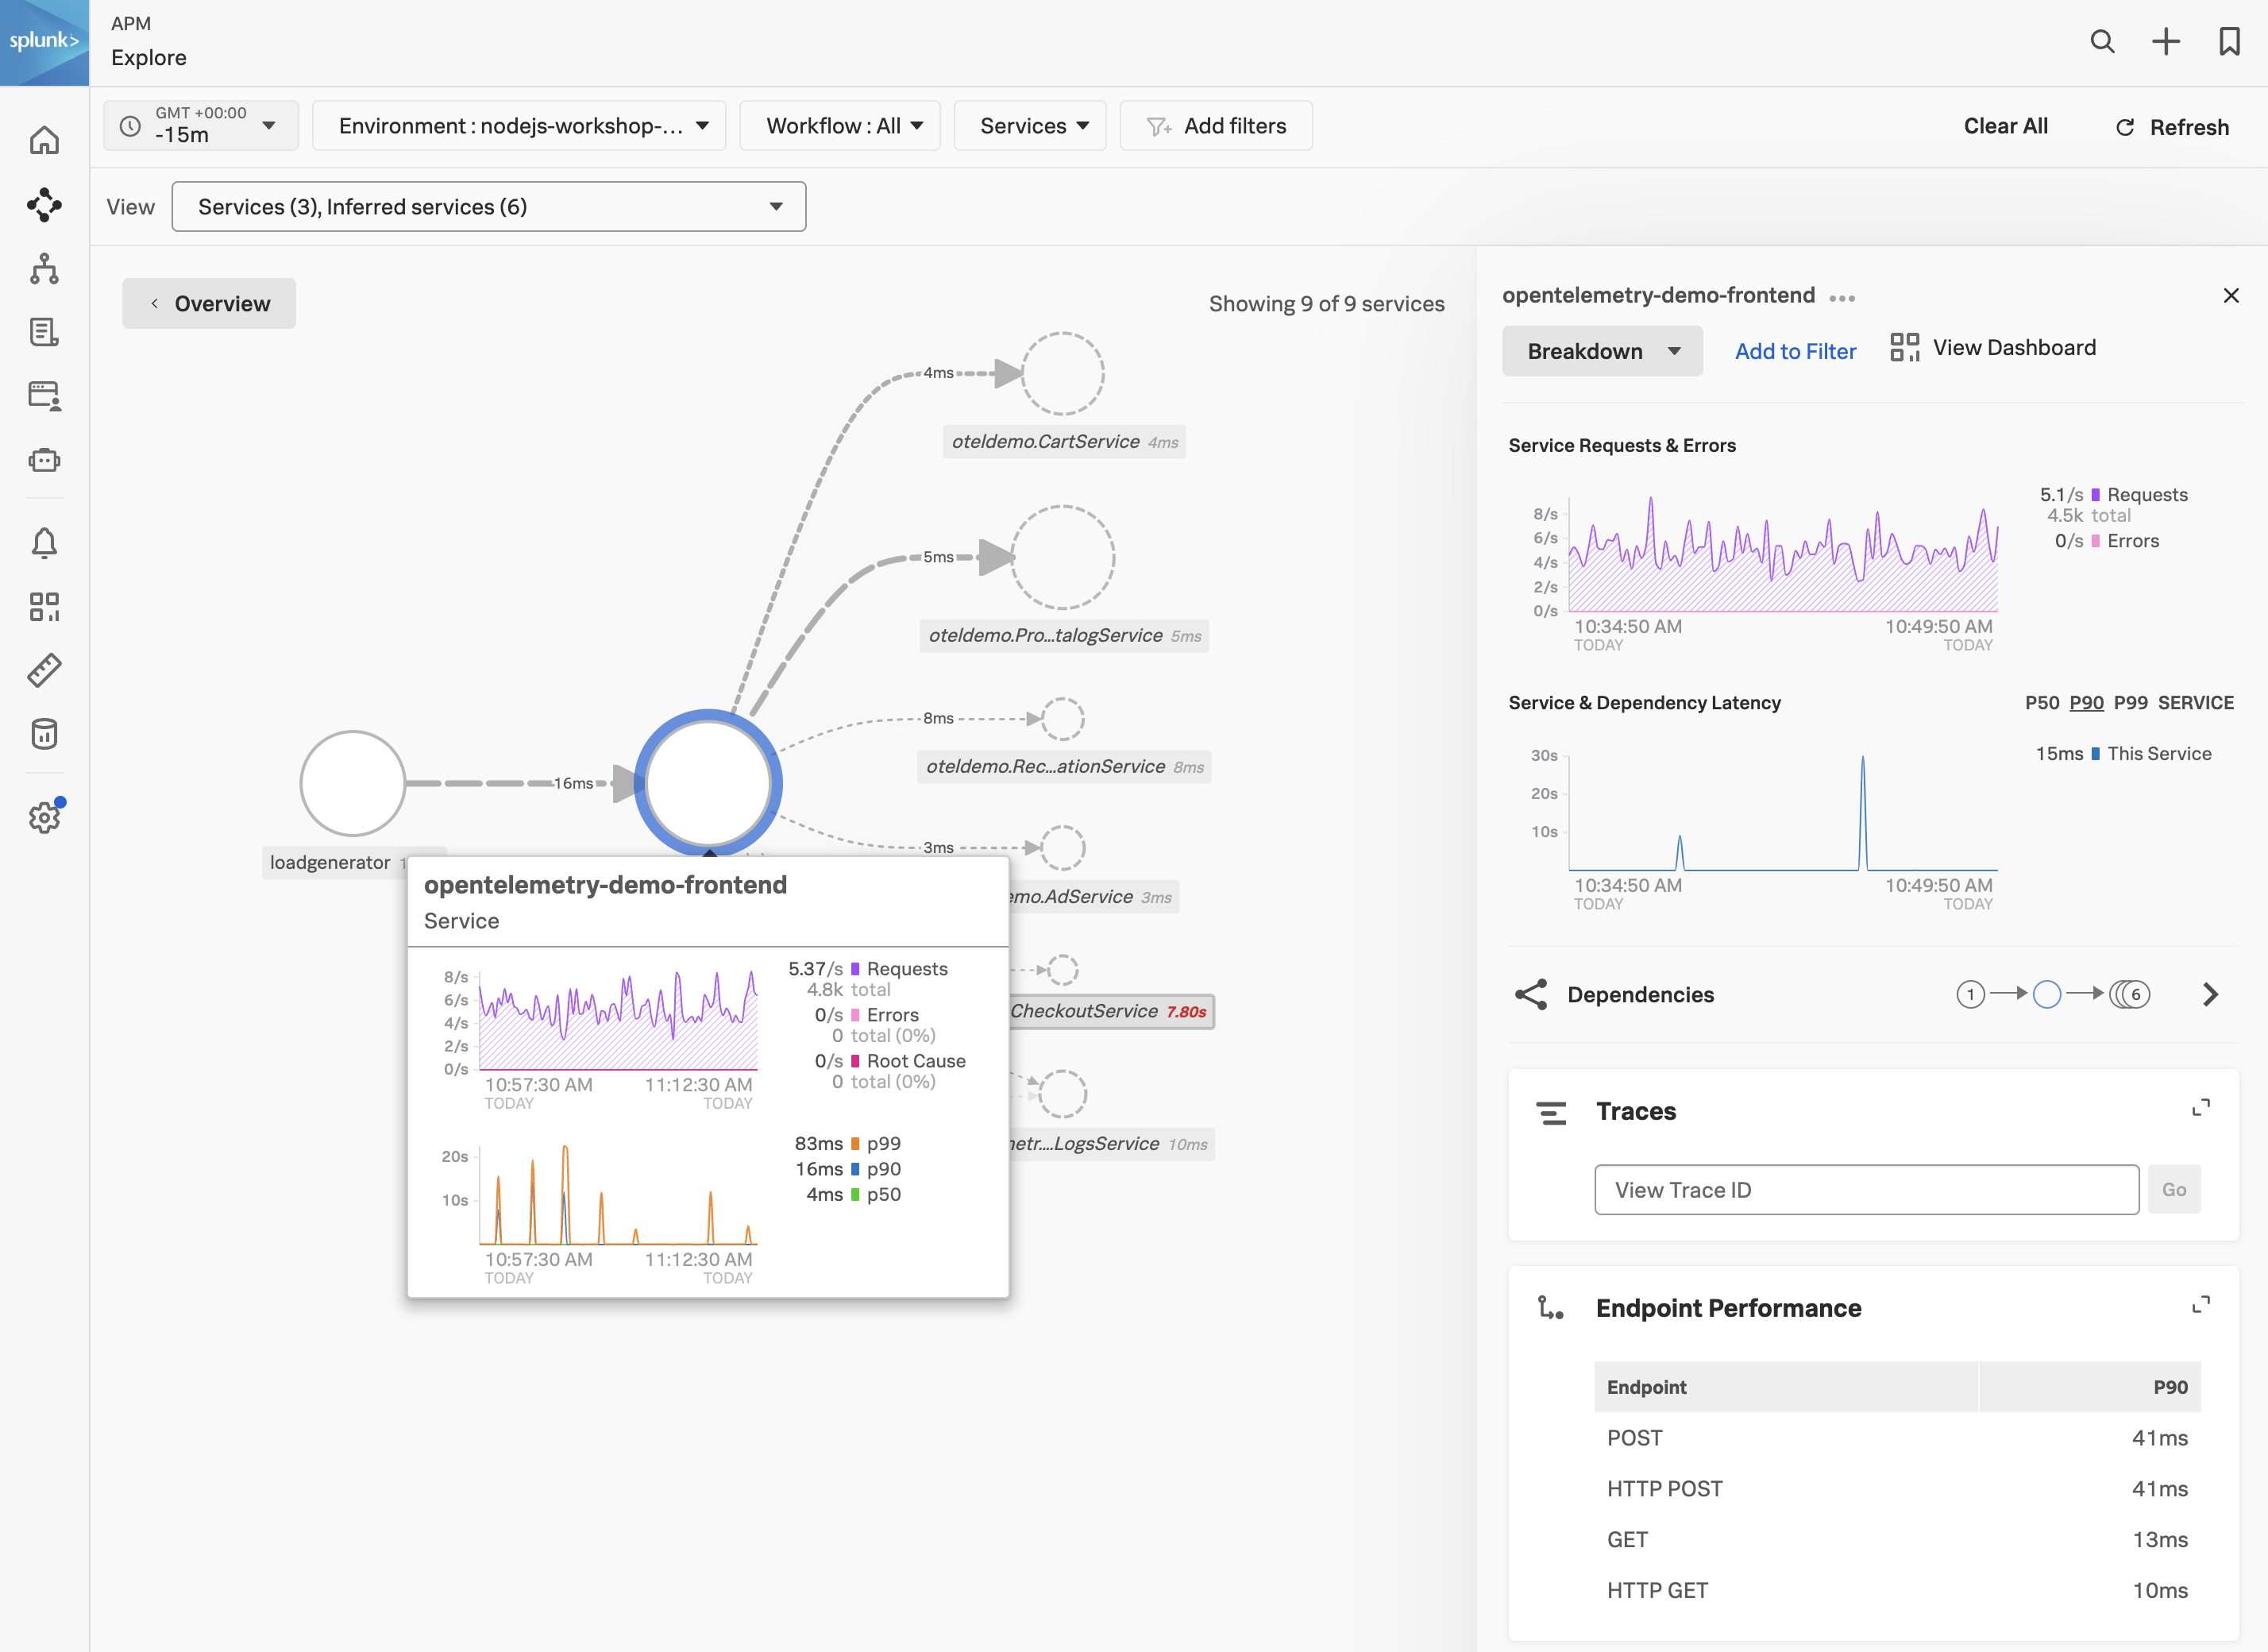
After a few minutes, you should see the frontend service in APM.
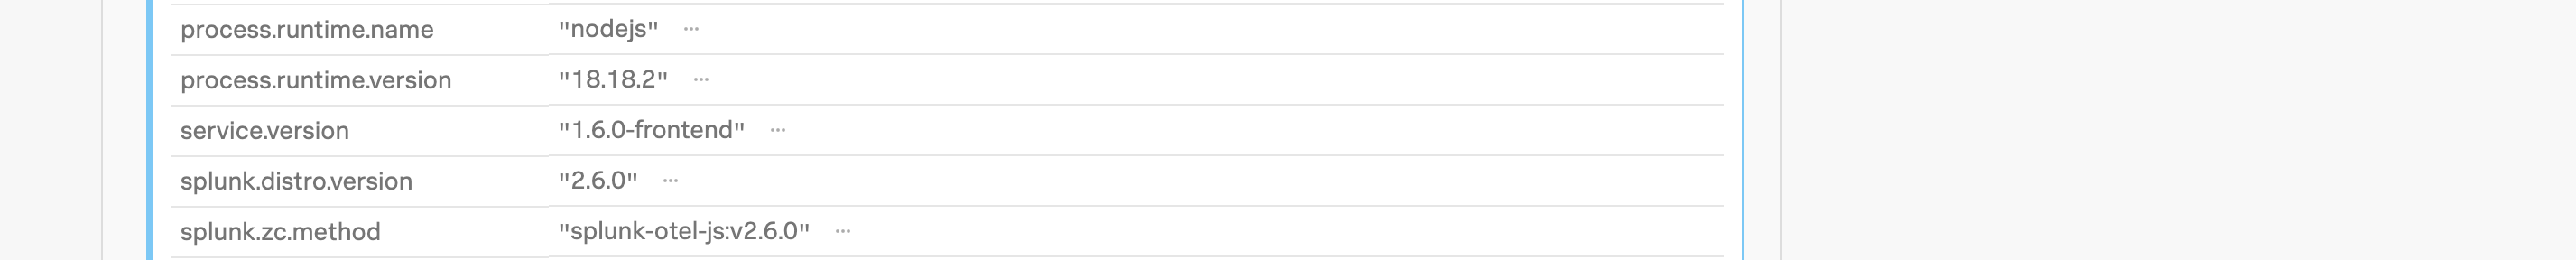
With the frontend service highlighted, click on the Traces tab to see the traces for the service. Select one of the traces and confirm that the trace contains metadata confirming that the Splunk Zero-Configuration Auto-Instrumentation for NodeJS is being used.
Zero Configuration - Payment Service
1. Patching the Payment Service
Finally, we will patch the paymentservice deployment with an annotation to inject the NodeJS auto instrumentation. This will allow us to see the paymentservice service in APM.
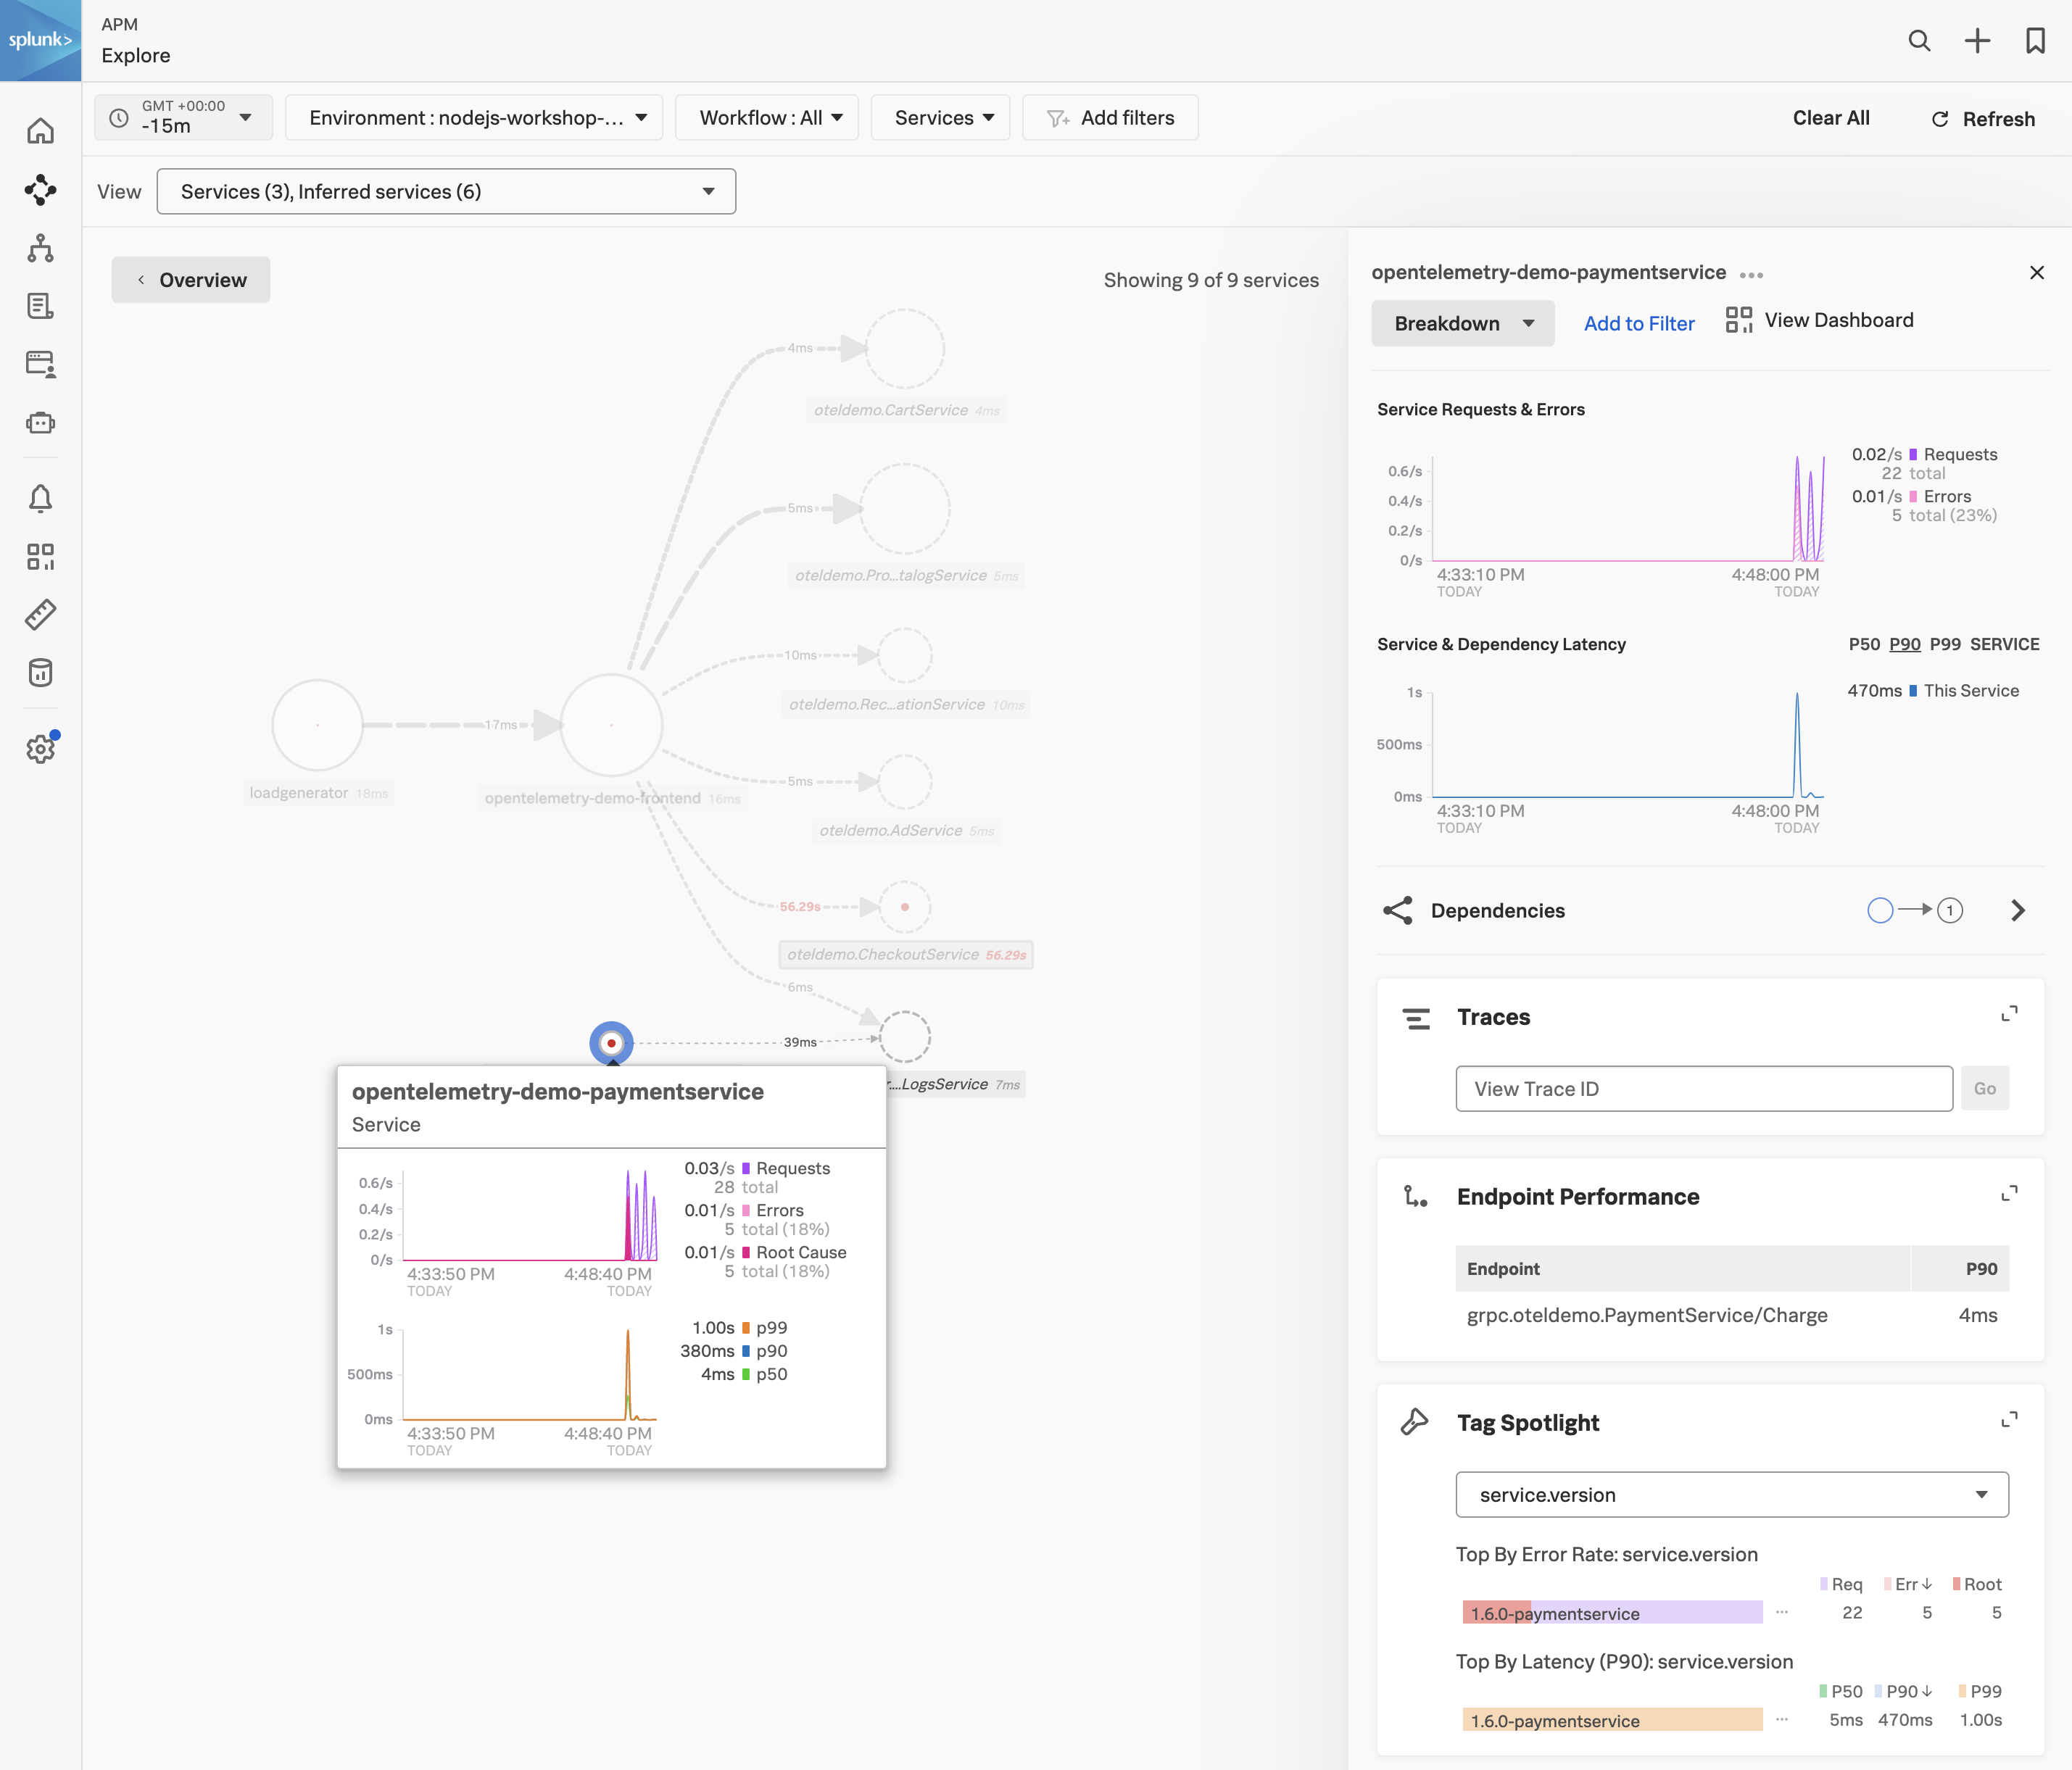
This will cause the opentelemetry-demo-paymentservice pod to restart and after a few minutes, you should see the paymentservice service in APM.
Code Profiling - Payment Service
1. AlwaysOn Profiling for the Payment Service
AlwaysOn Profiling is a feature of the Splunk Distribution of OpenTelemetry Collector that allows you to collect CPU and Memory profiling data for your services without having to modify your code. This is useful for troubleshooting performance issues in your services. Here are some of the benefits of AlwaysOn Profiling:
Perform continuous profiling of your applications. The profiler is always on once you activate it.
Collect code performance context and link it to trace data.
Explore memory usage and garbage collection of your application.
Analyze code bottlenecks that impact service performance.
Identify inefficiencies that increase the need for scaling up cloud resources.
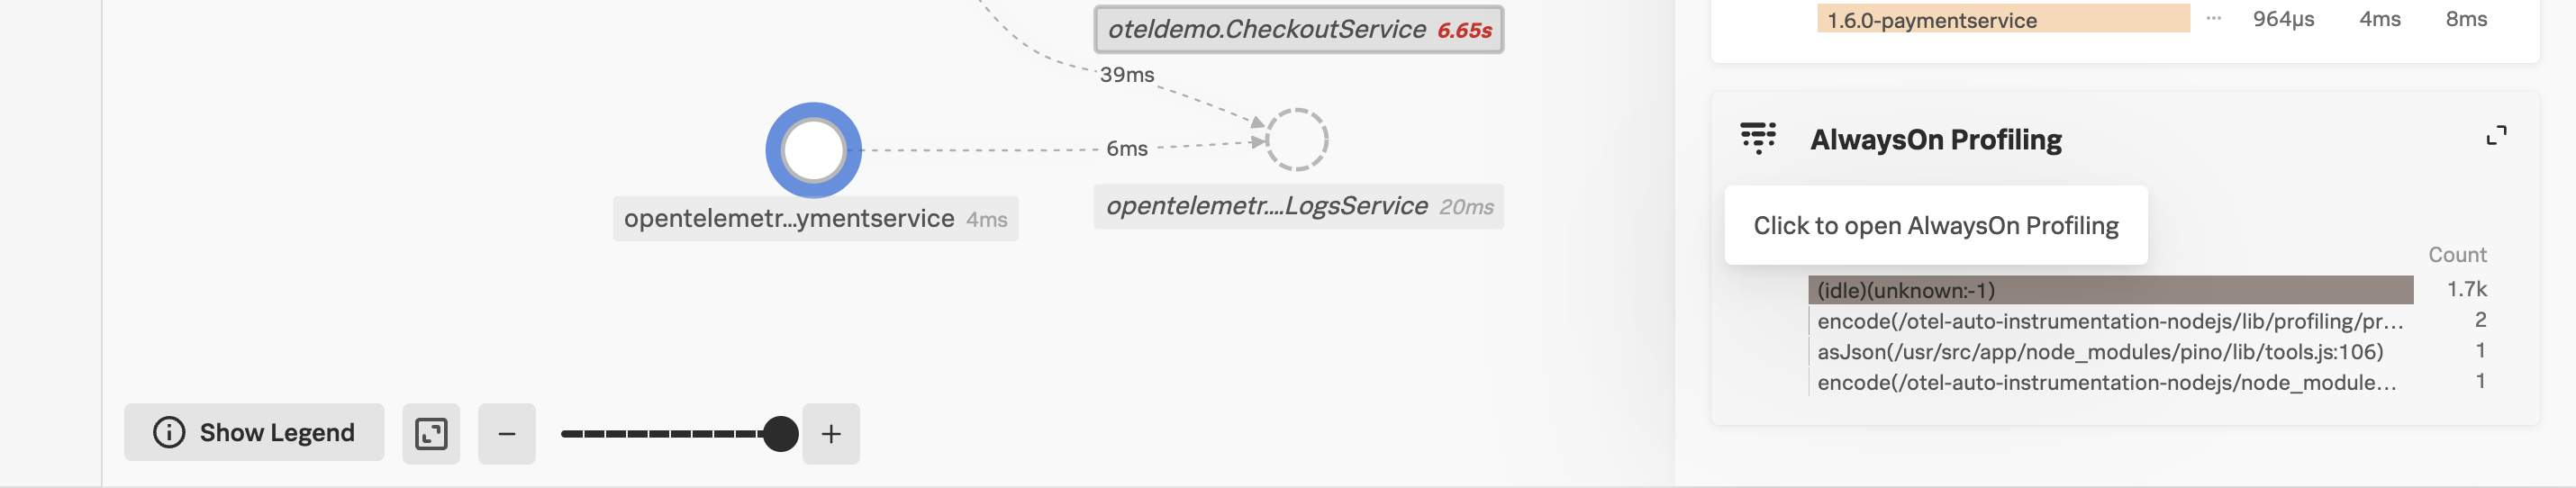
With the opentelemetry-demo-paymentservice selected, click on AlwaysOn Profiling to view the code profiling data for the service.
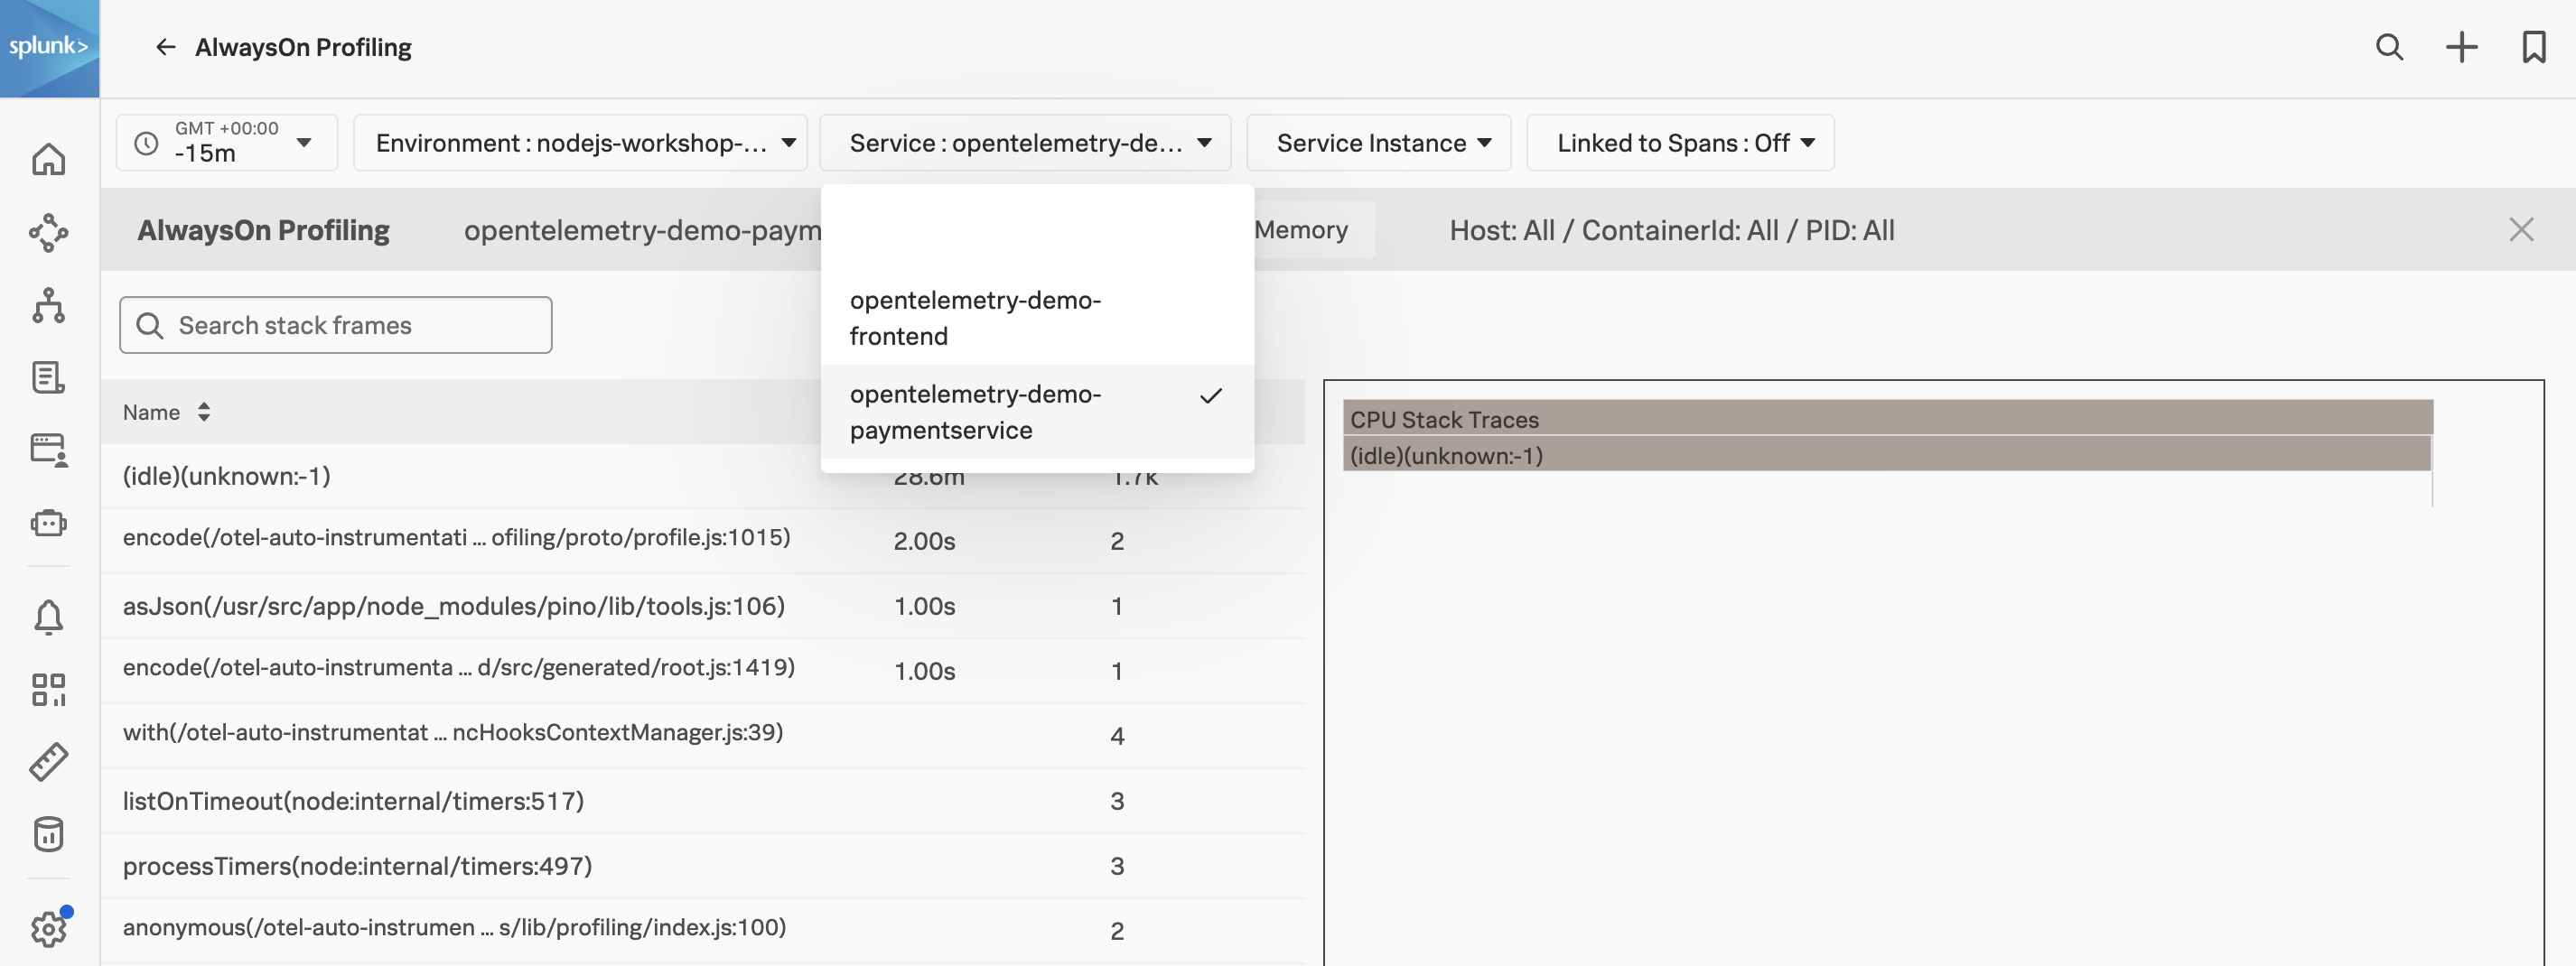
Here you can see the CPU and Memory profiling data for the paymentservice service. You can also see the CPU and Memory profiling data for the frontend service by selecting the opentelemetry-demofrontend service from the Service dropdown.
Logs - Payment Service
1. Viewing the logs for the Payment Service
Navigate back to APM from the main menu and under Services click on opentelemetry-demo-paymentservice. This will open up the Service map for the paymentservice service only.
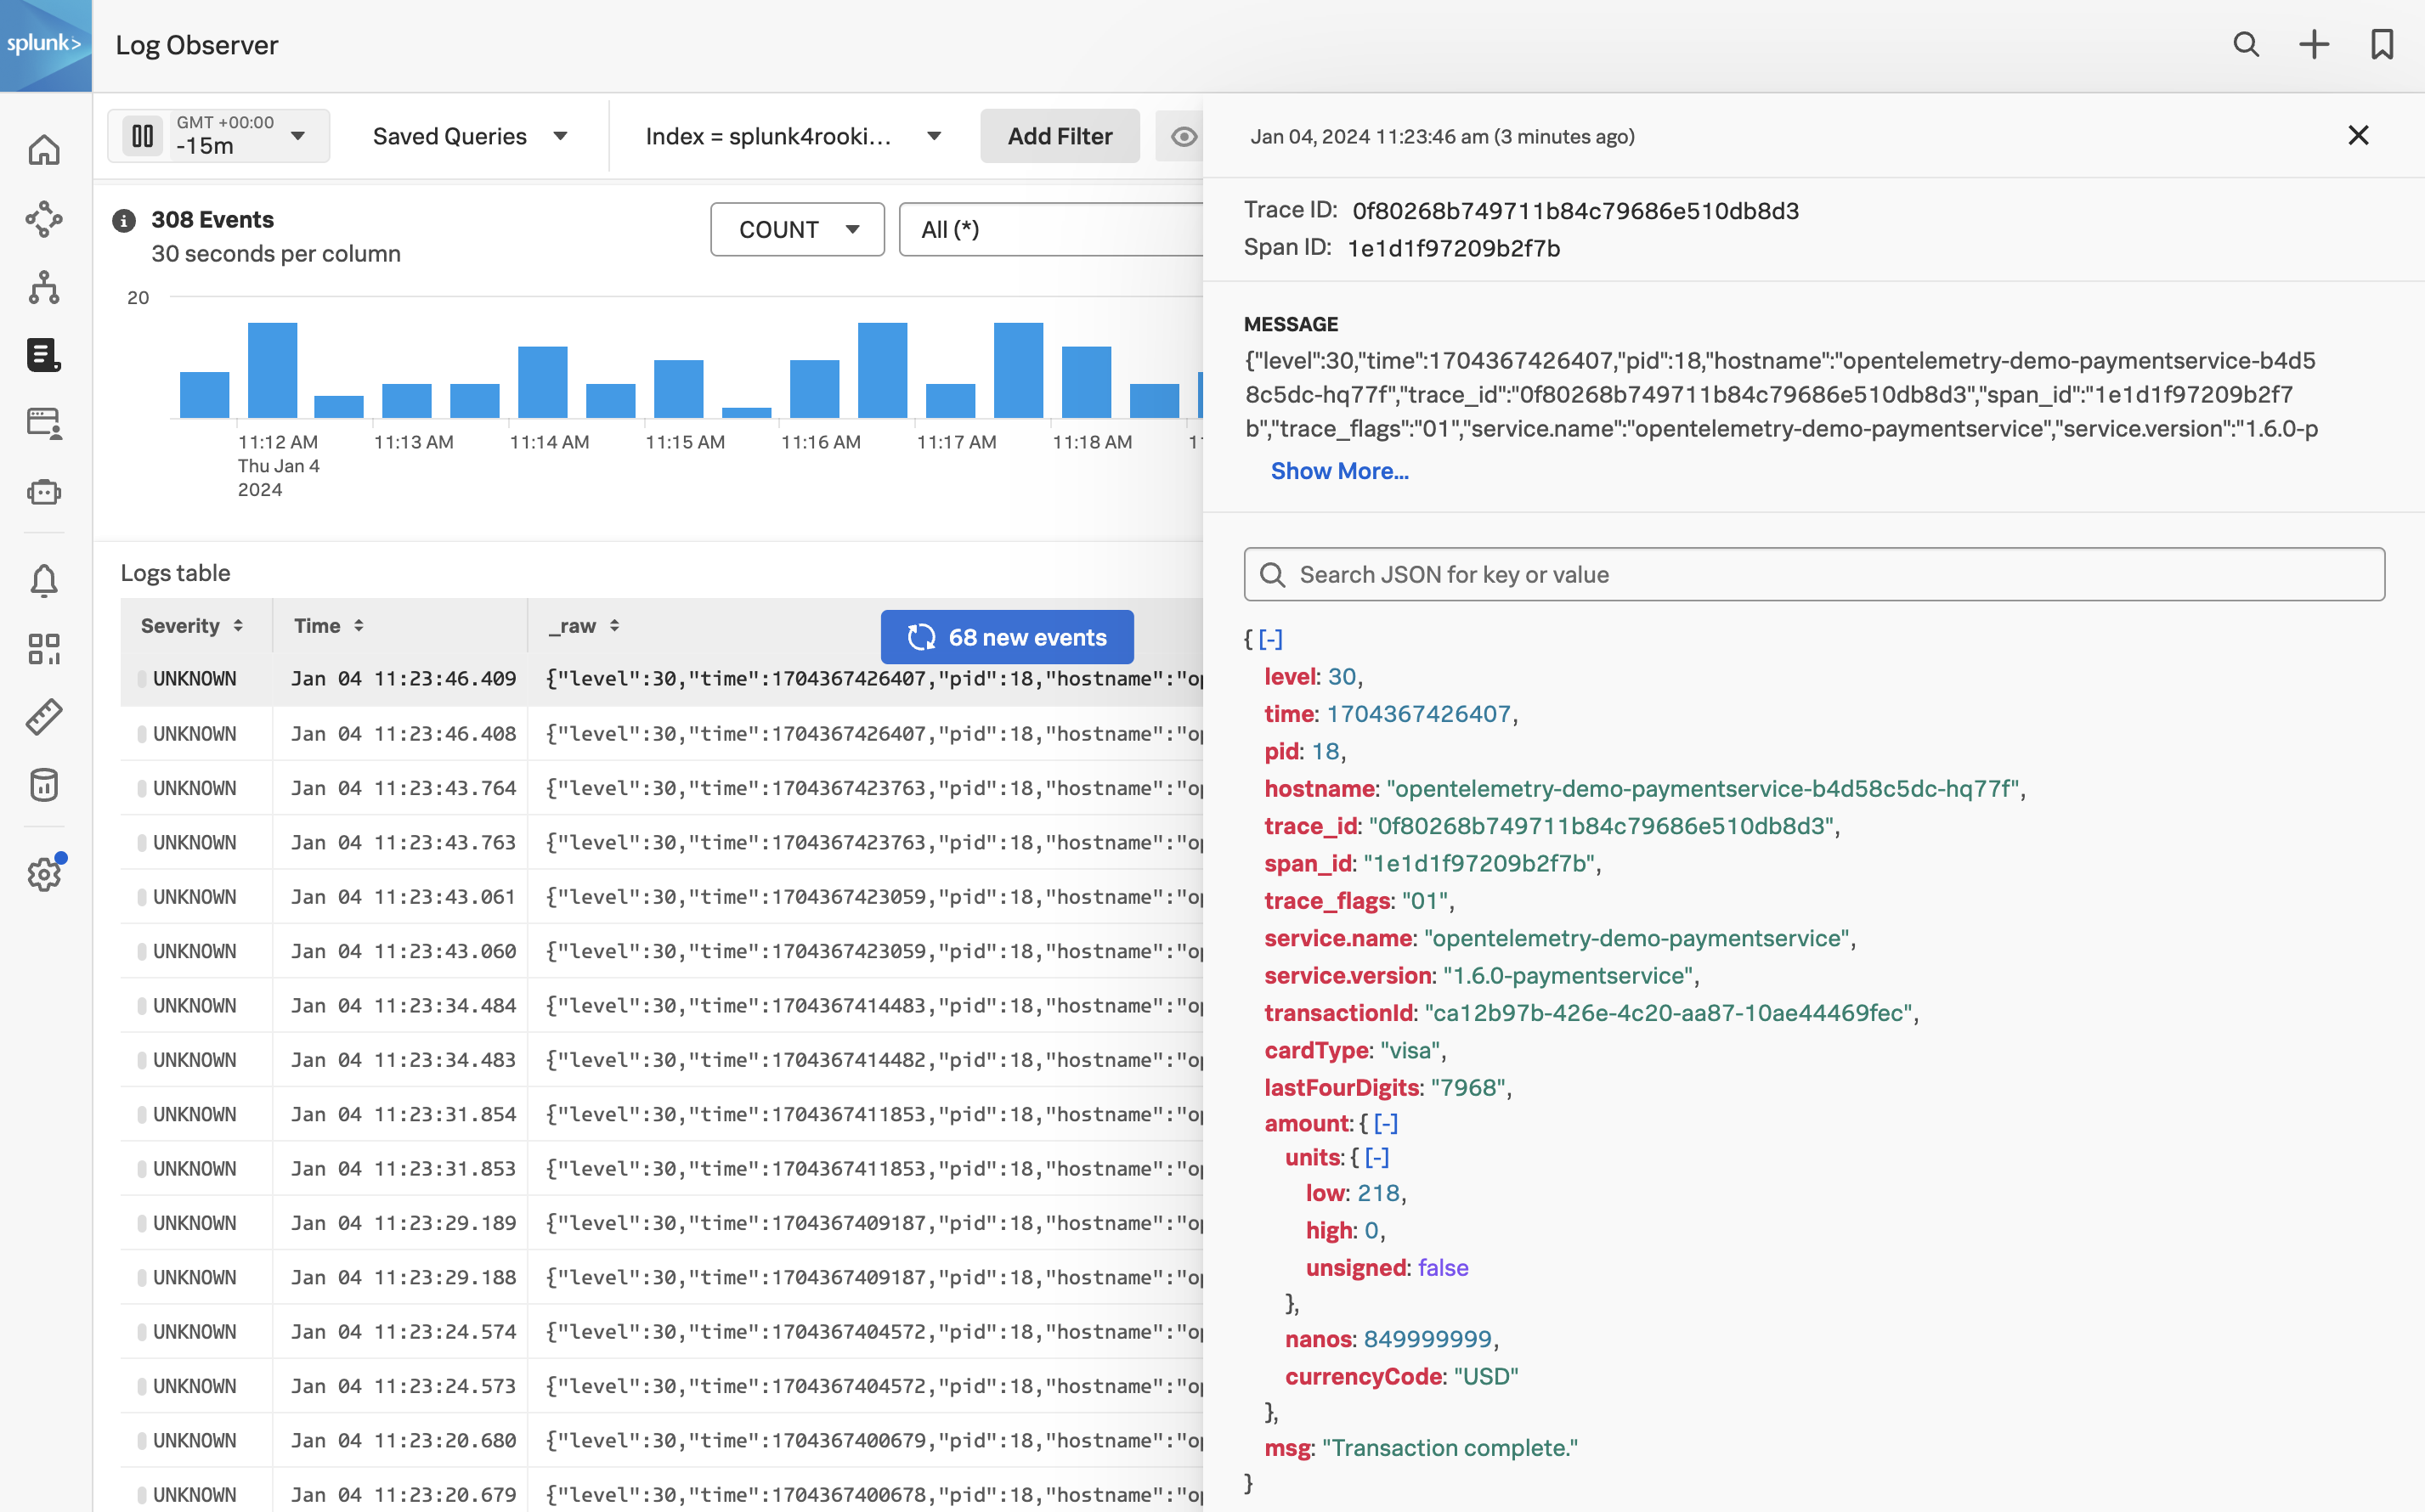
At the bottom of the page, click on the Logs(1) tab to view the logs for the paymentservice service.
Once in Log Observer select one of the log entries to view the metadata for the log entry.
Monitoring Horizontal Pod Autoscaling in Kubernetes
45 minutesAuthor
Robert Castley
This workshop will equip you with a basic understanding of monitoring Kubernetes using the Splunk OpenTelemetry Collector. During the workshop, you will deploy PHP/Apache and a load generator.
You will learn about OpenTelemetry Receivers, Kubernetes Namespaces, ReplicaSets, Kubernetes Horizontal Pod AutoScaling and how to monitor all this using the Splunk Observability Cloud. The main learnings from the workshop will be a better understanding of the Kubernetes Navigator (and Dashboards) in Splunk Observability Cloud as well as seeing Kubernetes metrics, events and Detectors.
For this workshop, Splunk has prepared an Ubuntu Linux instance in AWS/EC2 all pre-configured for you.
To get access to the instance that you will be using in the workshop, please visit the URL provided by the workshop leader.
Subsections of Monitoring Horizontal Pod Autoscaling in Kubernetes
Deploying the OpenTelemetry Collector in Kubernetes using a NameSpace
1. Kubernetes Navigator 2.0 UI
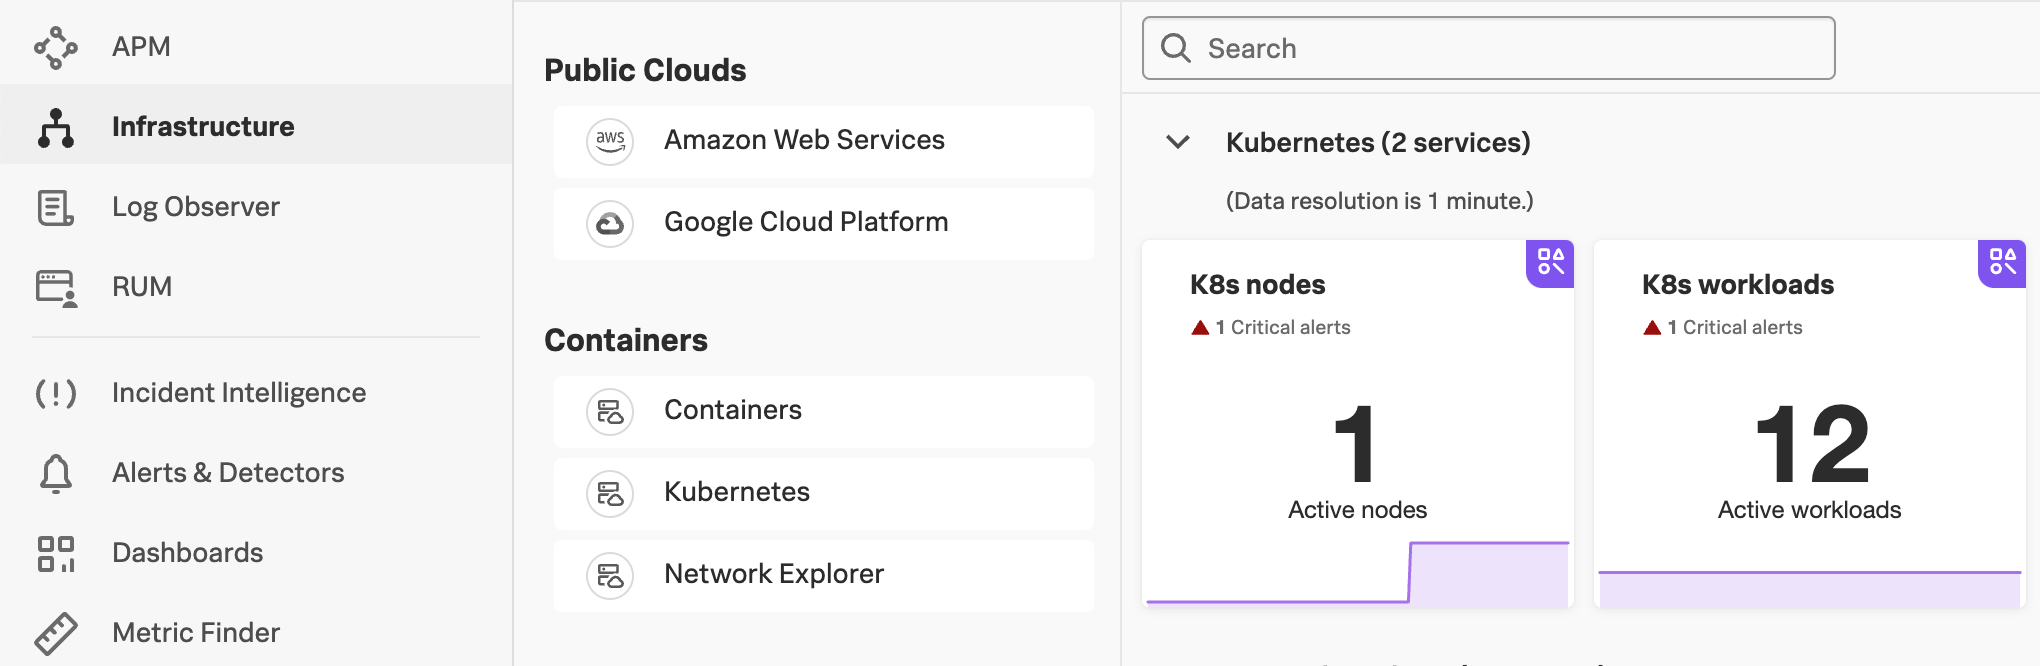
We will be starting this workshop using the new Kubernetes Navigator so please check that you are already using the new Navigator.
When you select Infrastructure from the main menu on the left, followed by selecting Kubernetes, you should see two service panes (K8s nodes and K8s workloads) for Kubernetes, similar to the ones below:
2. Connect to EC2 instance
You will be able to connect to the workshop instance by using SSH from your Mac, Linux or Windows device. Open the link to the sheet provided by your instructor. This sheet contains the IP addresses and the password for the workshop instances.
Info
Your workshop instance has been pre-configured with the correct Access Token and Realm for this workshop. There is no need for you to configure these.
3. Install Splunk OTel using Helm
Install the OpenTelemetry Collector using the Splunk Helm chart. First, add the Splunk Helm chart repository and update.
Using ACCESS_TOKEN=<REDACTED>
Using REALM=eu0
"splunk-otel-collector-chart" has been added to your repositories
Using ACCESS_TOKEN=<REDACTED>
Using REALM=eu0
Hang tight while we grab the latest from your chart repositories...
...Successfully got an update from the "splunk-otel-collector-chart" chart repository
Update Complete. ⎈Happy Helming!⎈
Install the OpenTelemetry Collector Helm with the following commands, do NOT edit this:
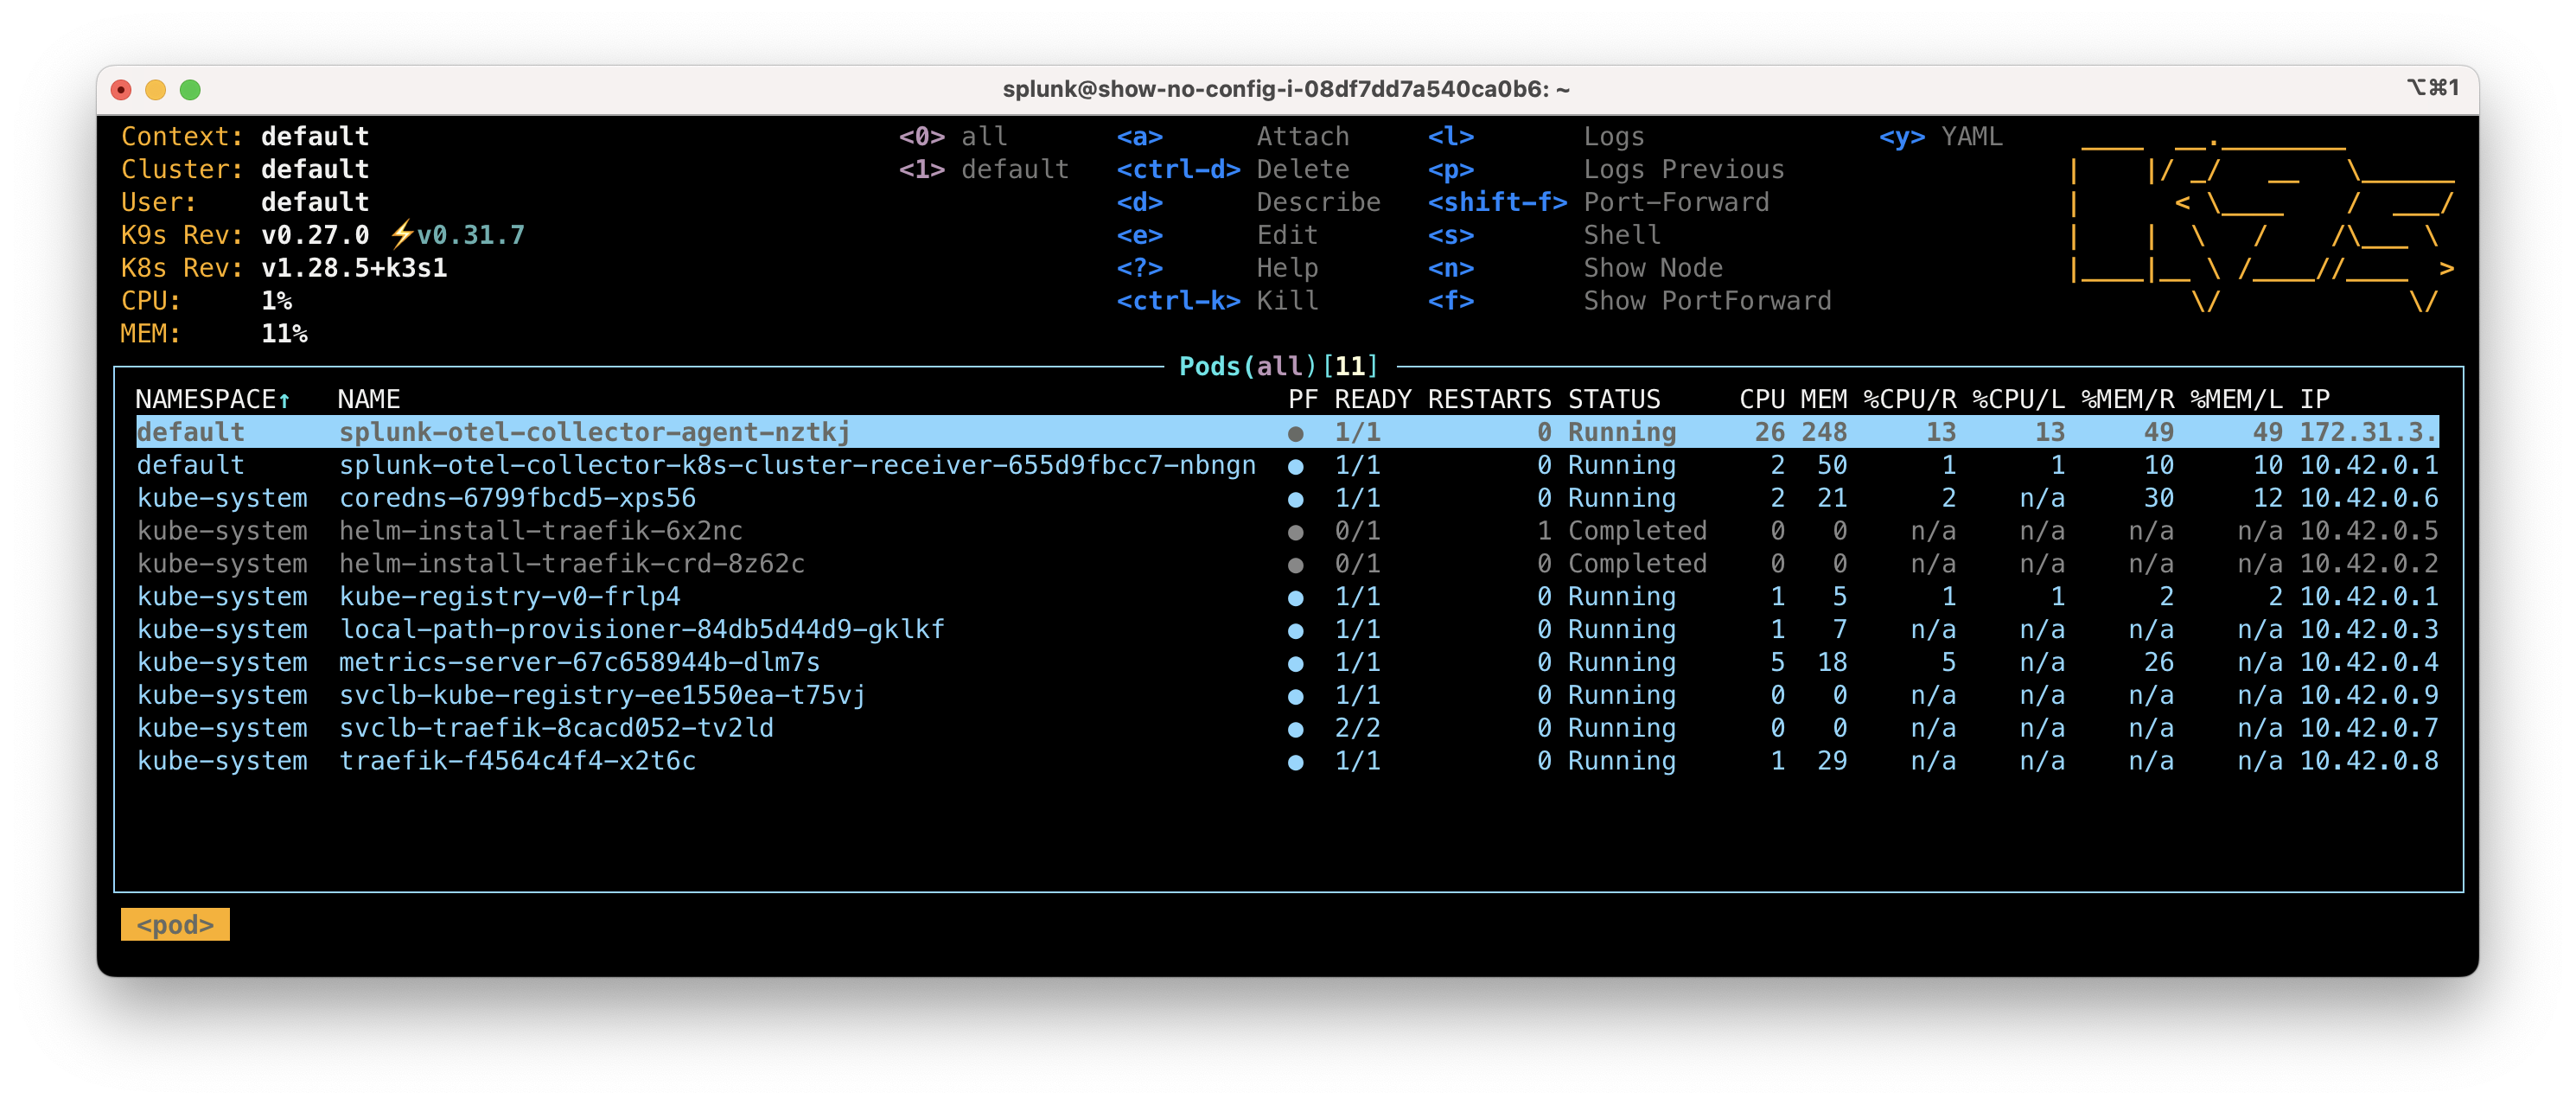
You can monitor the progress of the deployment by running kubectl get pods which should typically report that the new pods are up and running after about 30 seconds.
Ensure the status is reported as Running before continuing.
kubectl get pods
NAME                                                          READY   STATUS    RESTARTS   AGE
splunk-otel-collector-agent-pvstb                             2/2     Running   0          19s
splunk-otel-collector-k8s-cluster-receiver-6c454894f8-mqs8n   1/1     Running   0          19s
Use the label set by the helm install to tail logs (You will need to press ctrl + c to exit).
If you make an error installing the Splunk OpenTelemetry Collector you can start over by deleting the installation using:
helm delete splunk-otel-collector
Tour of the Kubernetes Navigator
1. Cluster vs Workload View
The Kubernetes Navigator offers you two separate use cases to view your Kubernetes data.
The K8s workloads are focusing on providing information in regards to workloads a.k.a. your deployments.
The K8s nodes are focusing on providing insight into the performance of clusters, nodes, pods and containers.
You will initially select either view depending on your need (you can switch between the view on the fly if required). The most common one we will use in this workshop is the workload view and we will focus on that specifically.
1.1 Finding your K8s Cluster Name
Your first task is to identify and find your cluster. The cluster will be named as determined by the preconfigured environment variable INSTANCE. To confirm the cluster name enter the following command in your terminal:
echo$INSTANCE-k3s-cluster
Please make a note of your cluster name as you will need this later in the workshop for filtering.
2. Workloads & Workload Details Pane
Go to the Infrastructure page in the Observability UI and select Kubernetes, this will offer you a set of Kubernetes services, one of them being the K8s workloads pane.
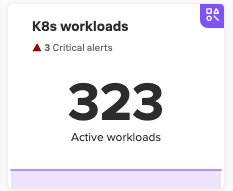
The pane will show a tiny graph giving you a bird’s eye view of the load being handled across those Workloads. Also, if there are any alerts for one of the workloads, you will see a small alert indicator as shown in the image below.
Click on the K8s workloads pane and you will be taken to the workload view.
Initially, you will see all the workloads for all clusters that are reported into your Observability Cloud Org. If an alert has fired for any of the workloads, it will be highlighted on the top right (as marked with a red stripe) in the image below. You can go directly to the alert by clicking it to expand it.
Now, let’s find your cluster by filtering on the field k8s.cluster.name in the filter toolbar (as marked with a blue stripe).
Note
You can enter a partial name into the search box, such as emea-ws-7*, to quickly find your Cluster.
Also, it’s a very good idea to switch the default time from the default -4h back to the last 15 minutes (-15m).
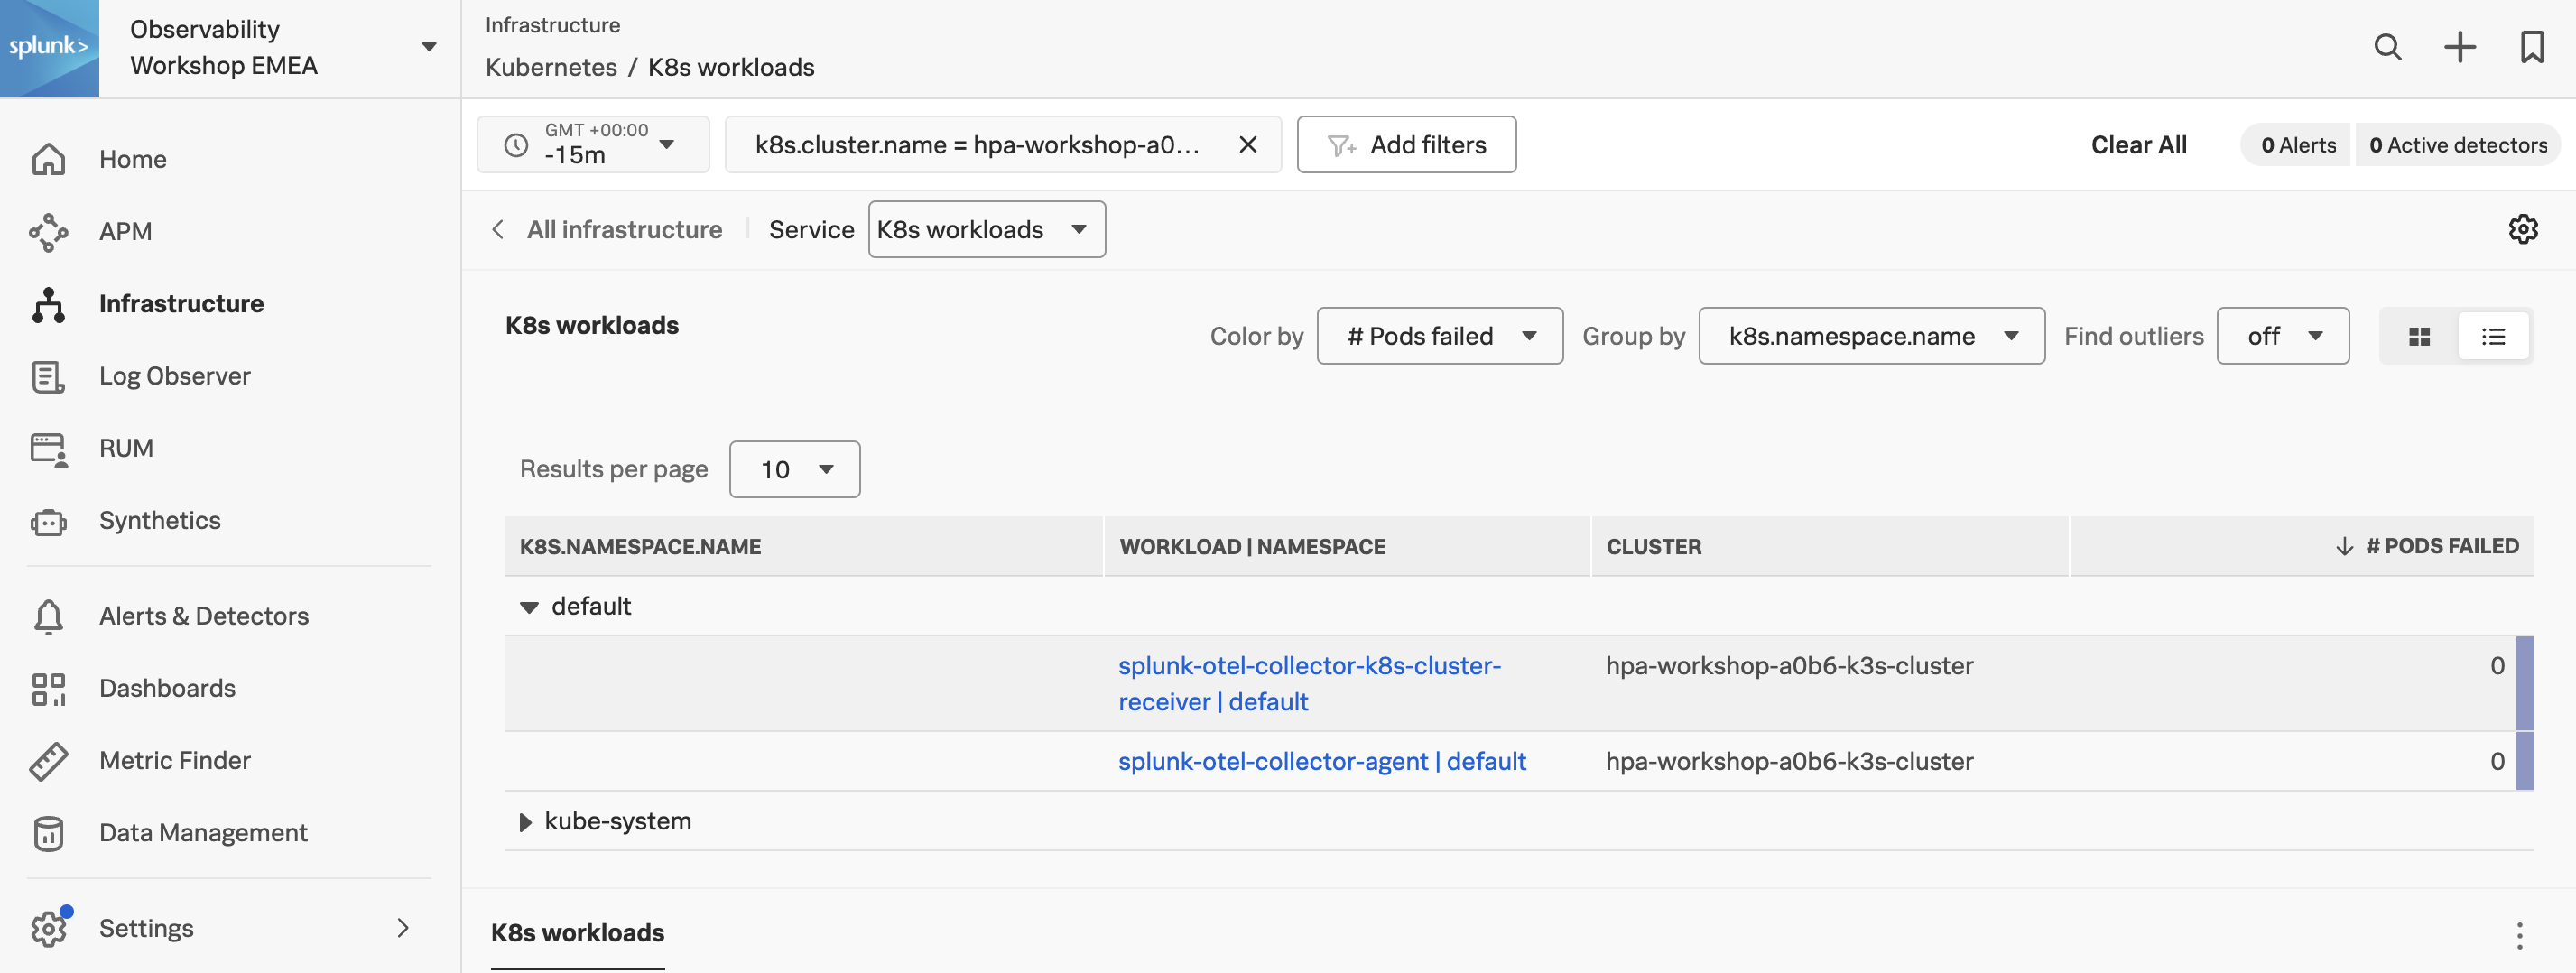
You should now just see information for your own cluster.
Workshop Question
How many workloads are running & how many namespaces are in your Cluster?
2.1 Using the Navigator Selection Chart
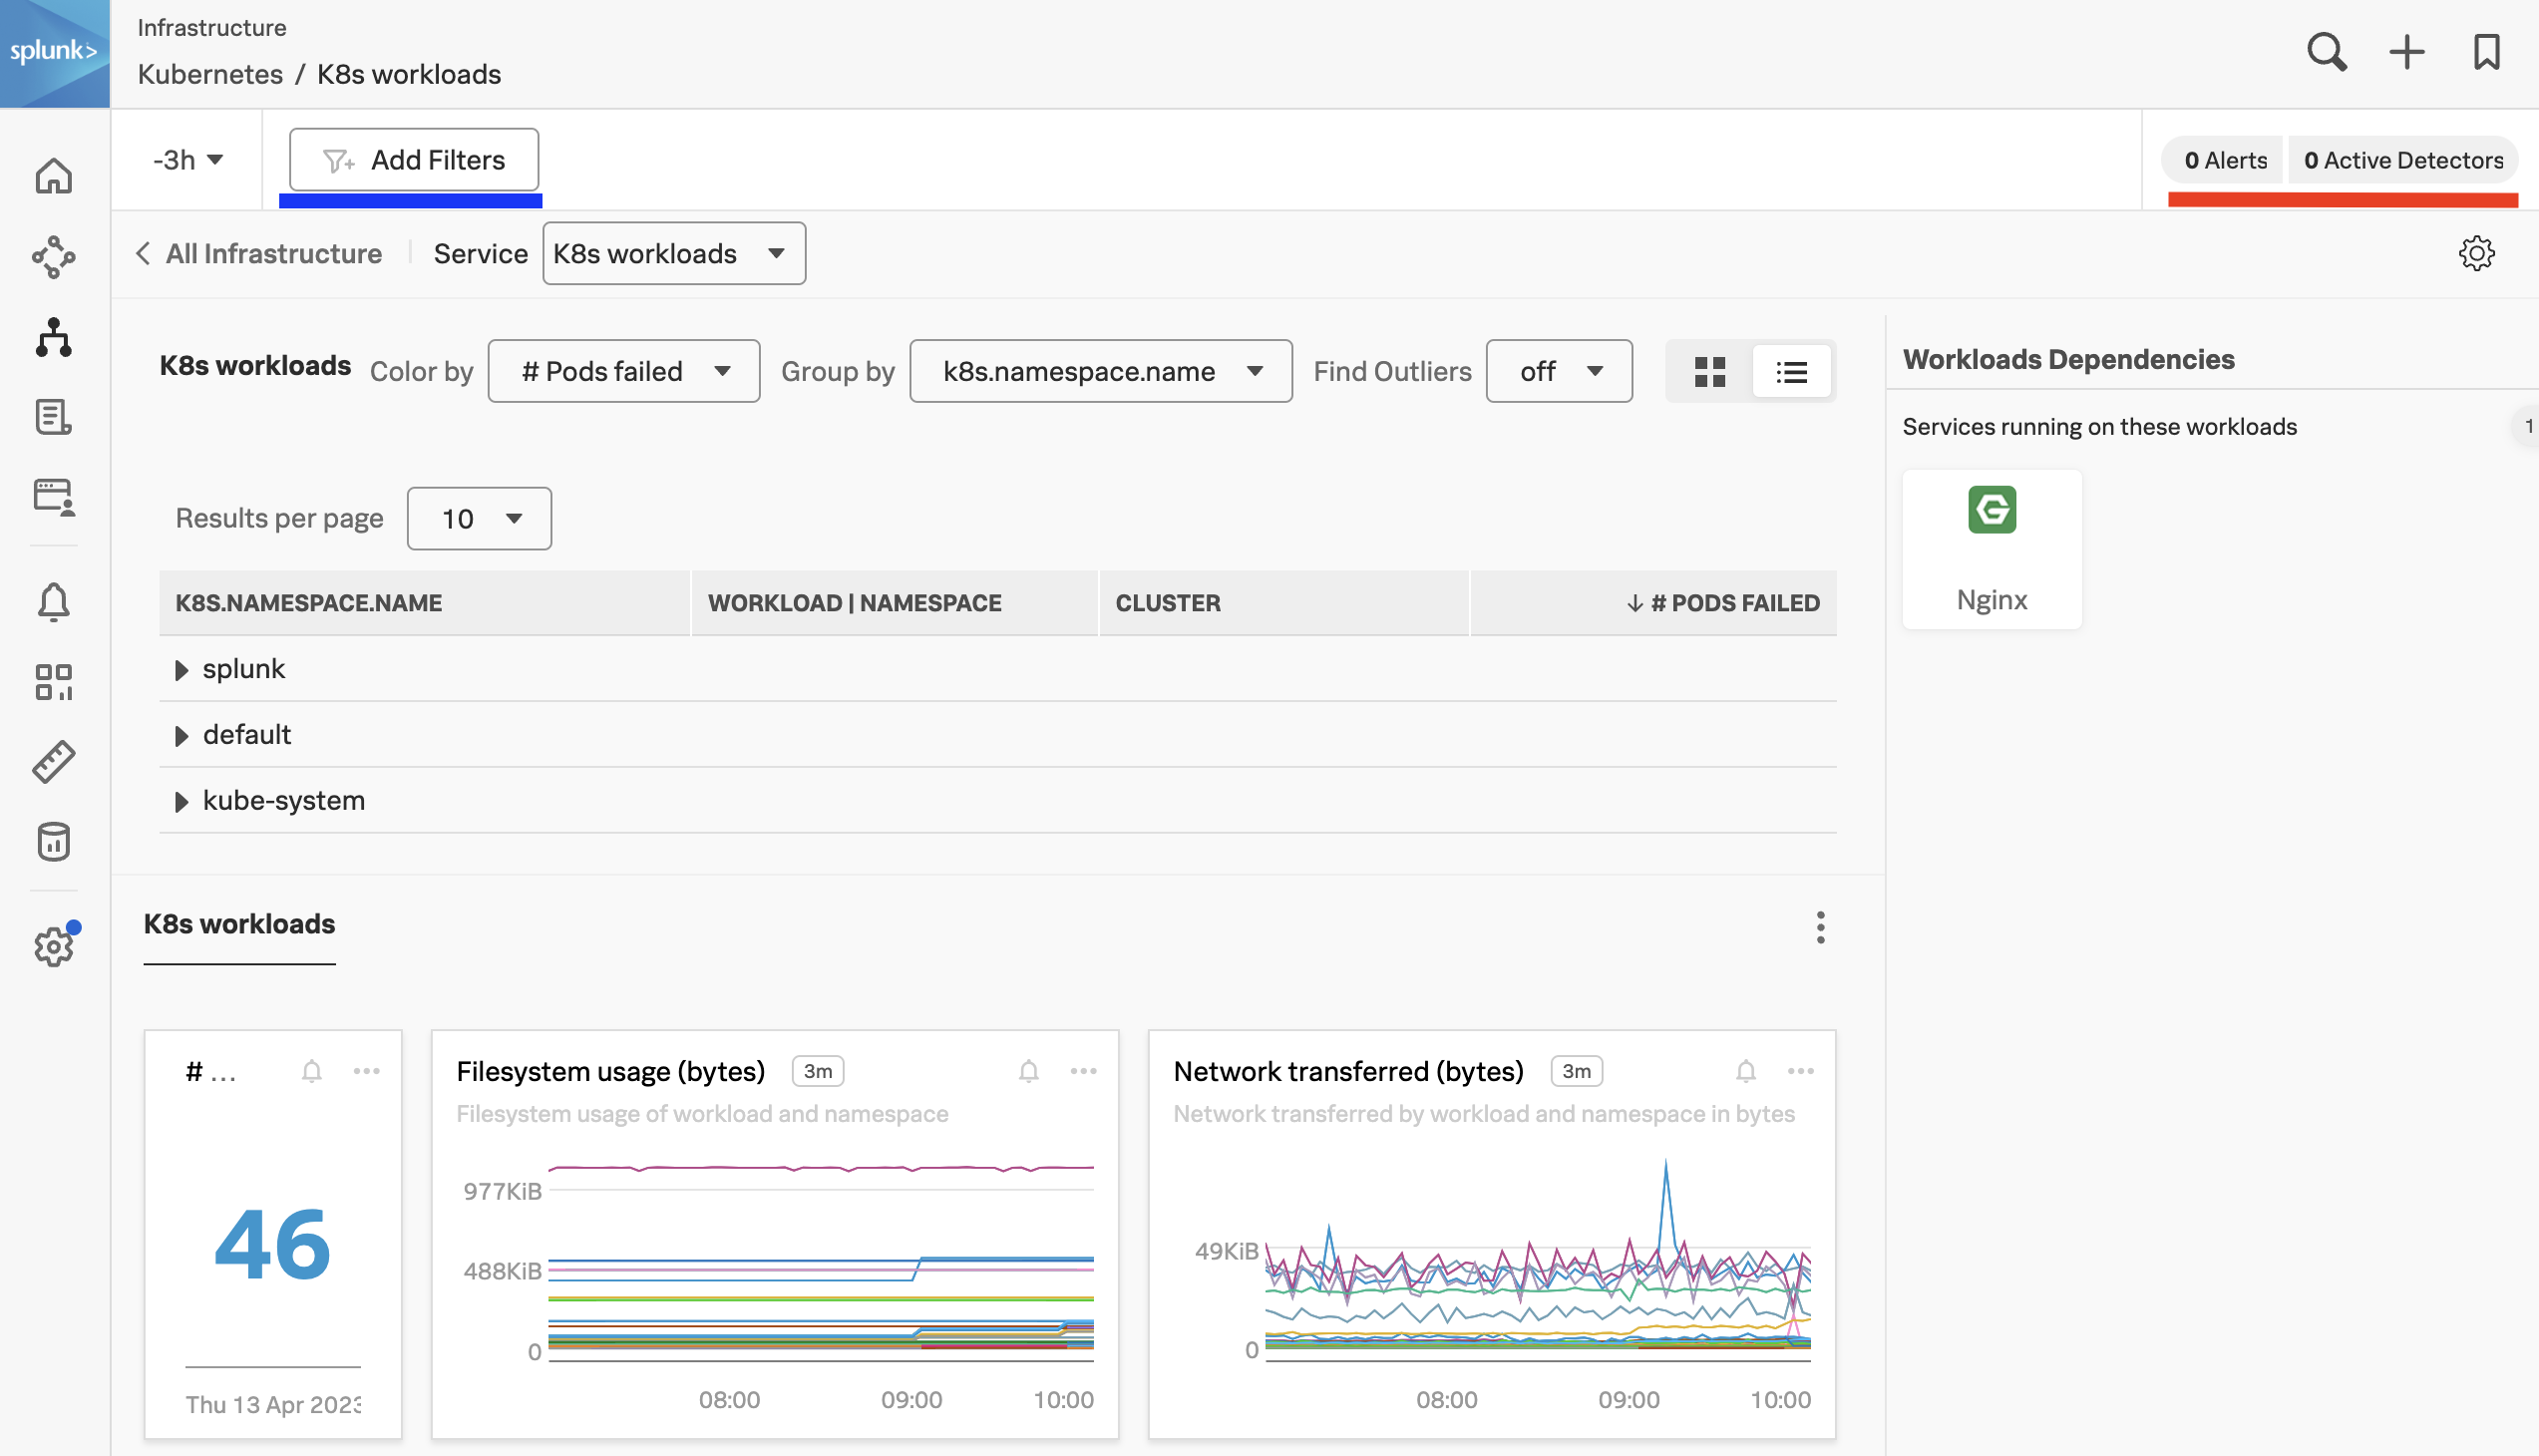
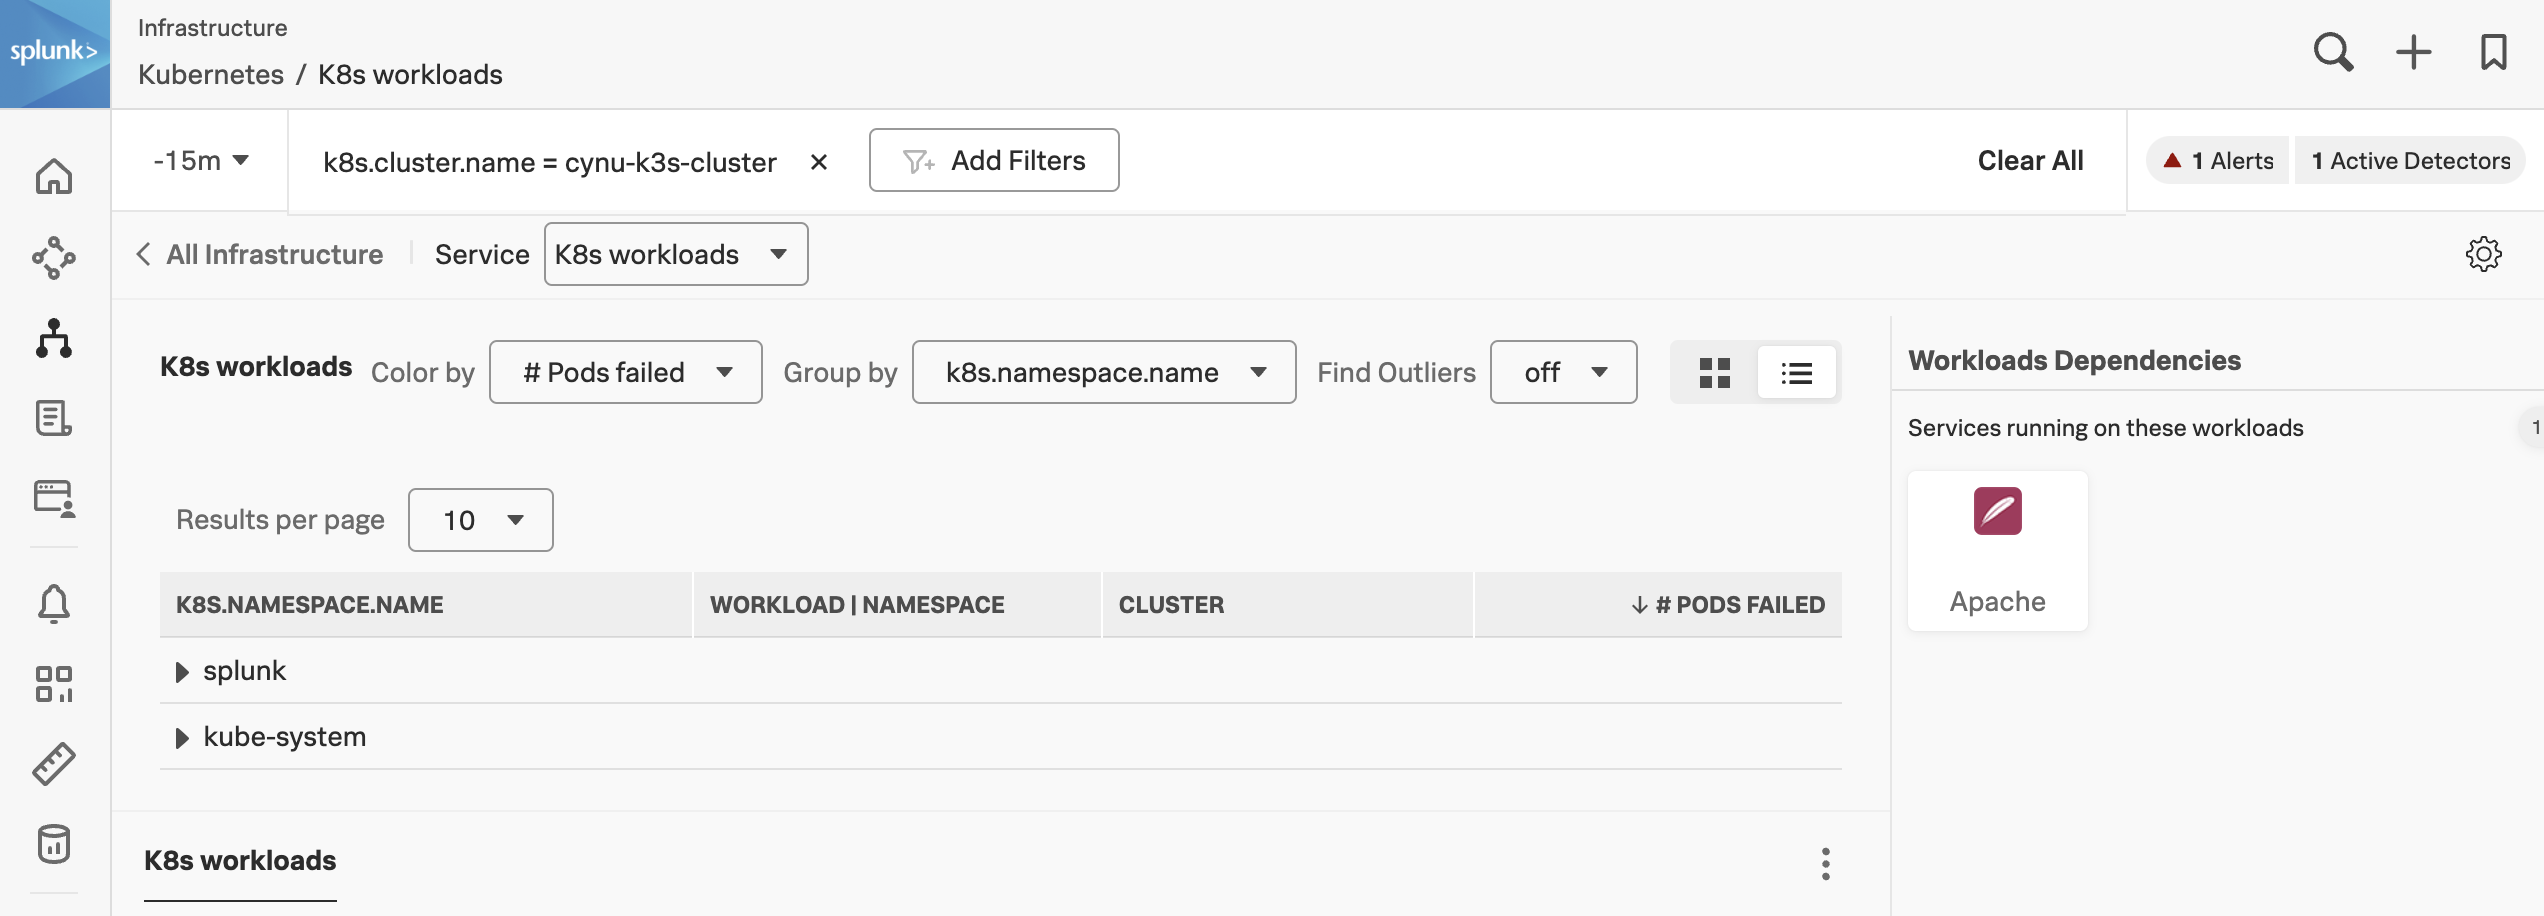
The K8s workloads table is a common feature used across most of the Navigators and will offer you a list view of the data you are viewing. In our case, it shows a list of Pods Failed grouped by k8s.namespace.name.
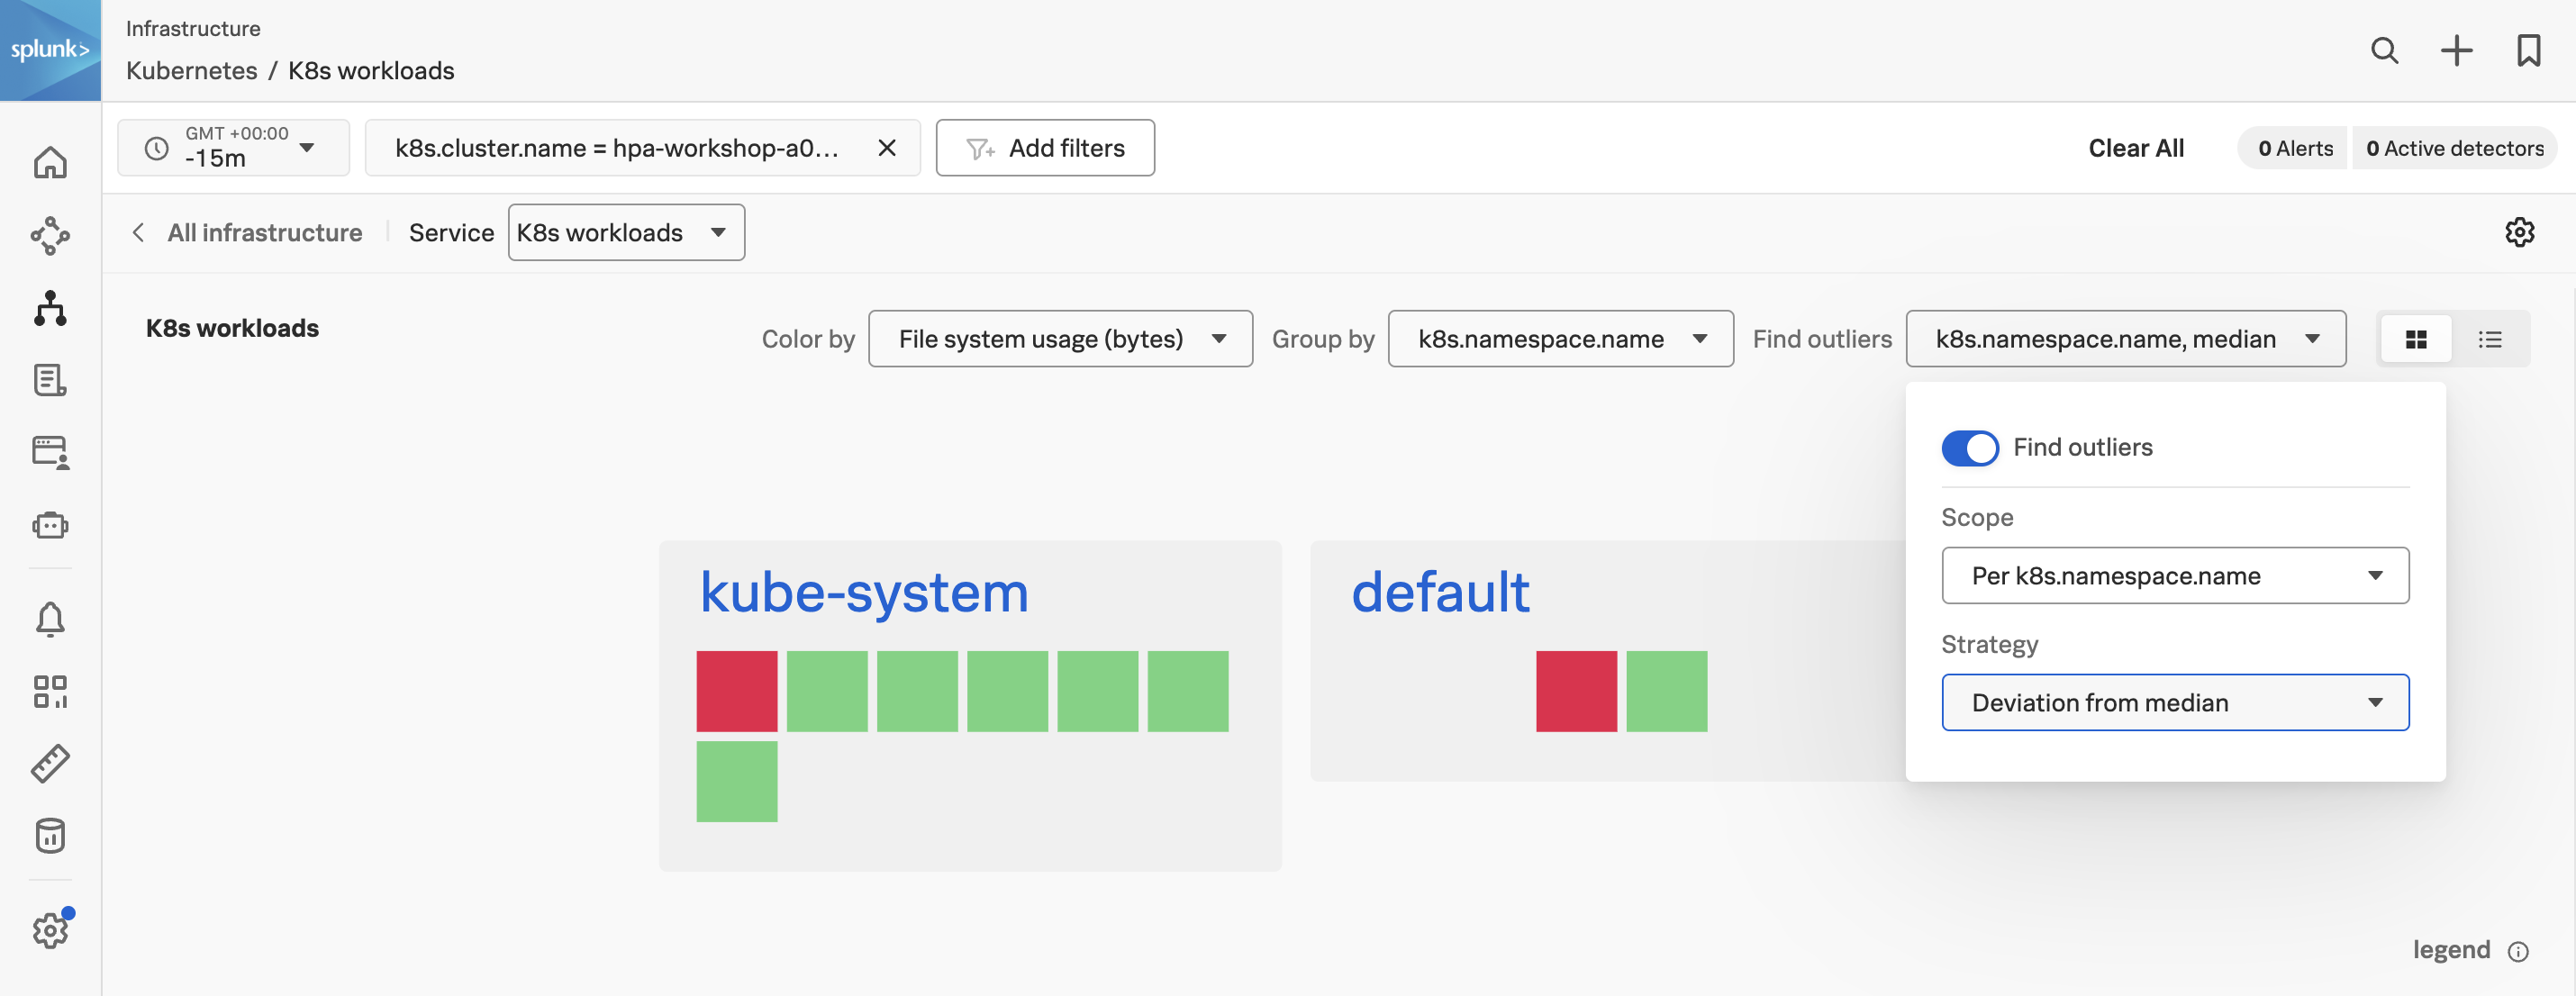
Now let’s change the list view to a heat map view by selecting either the Heat map icon or the List icon in the upper-right corner of the screen (as marked with the purple line).
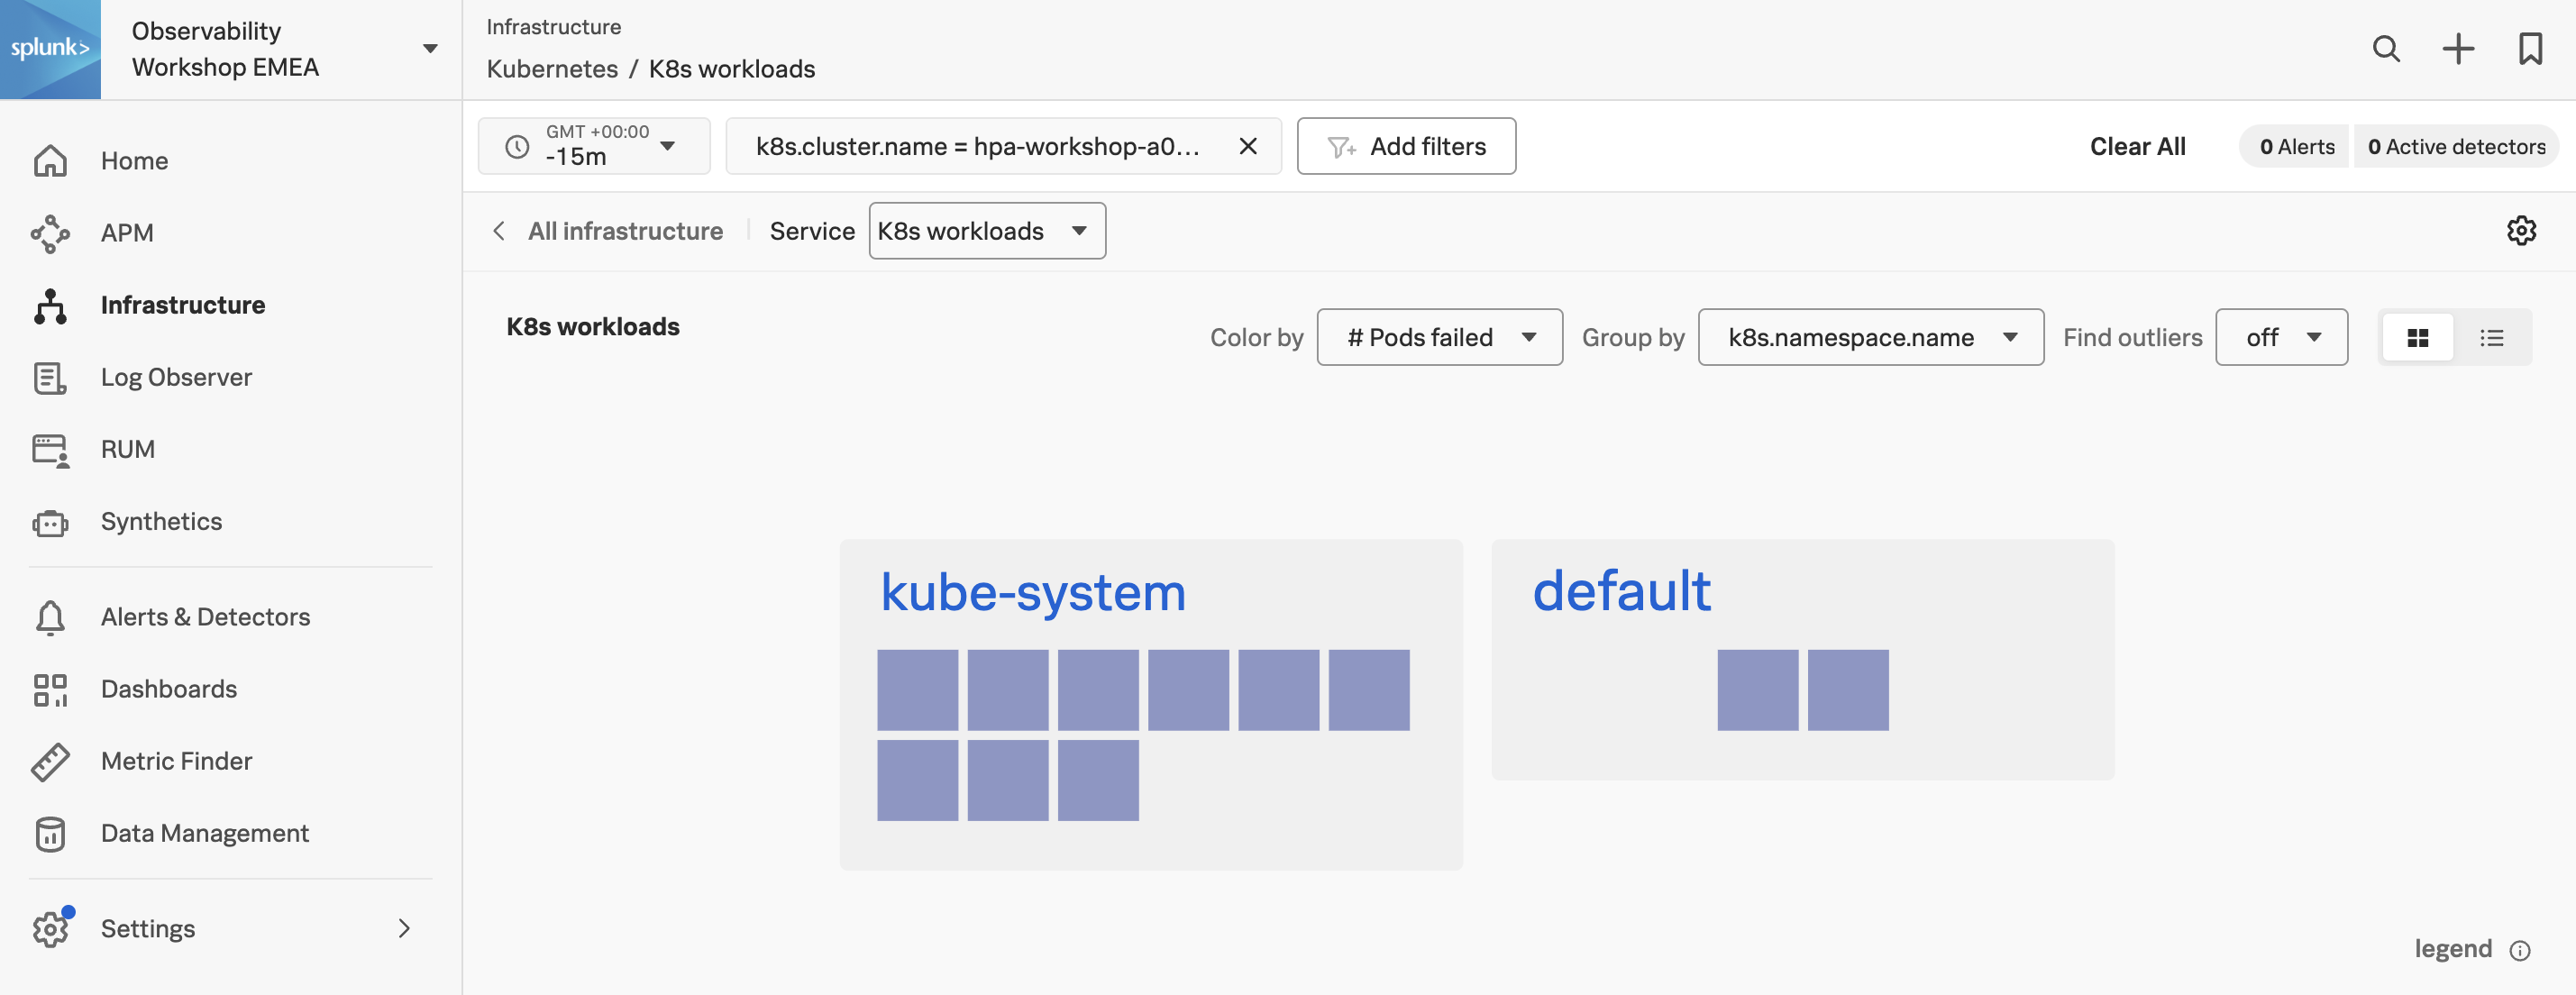
Changing this option will result in the following visualization:
In this view, you will note that each workload is now a colored square. These squares will change color according to the Color by option you selected, as marked by the first green line in the image above. The colors give a visual indication of health and/or usage. You can check the meaning by hovering over the legend exclamation icon
bottom right of the heatmaps.
Another valuable option in this screen is Find Outliers which provides historical analytics of your clusters based on what is selected in the Color by dropdown.
Now, let’s select the File system usage (bytes) from the Color by drop-down box, then click on the Find outliers drop-down as marked by a yellow line in the above image and make sure you change the Scope in the dialog to Per k8s.namespace.name and Deviation from Median as below:
The Find Outliers view is very useful when you need to view a selection of your workloads (or any service depending on the Navigator used) and quickly need to figure out if something has changed.
It will give you fast insight into items (workloads in our case) that are performing differently (both increased or decreased) which helps to make it easier to spot problems.
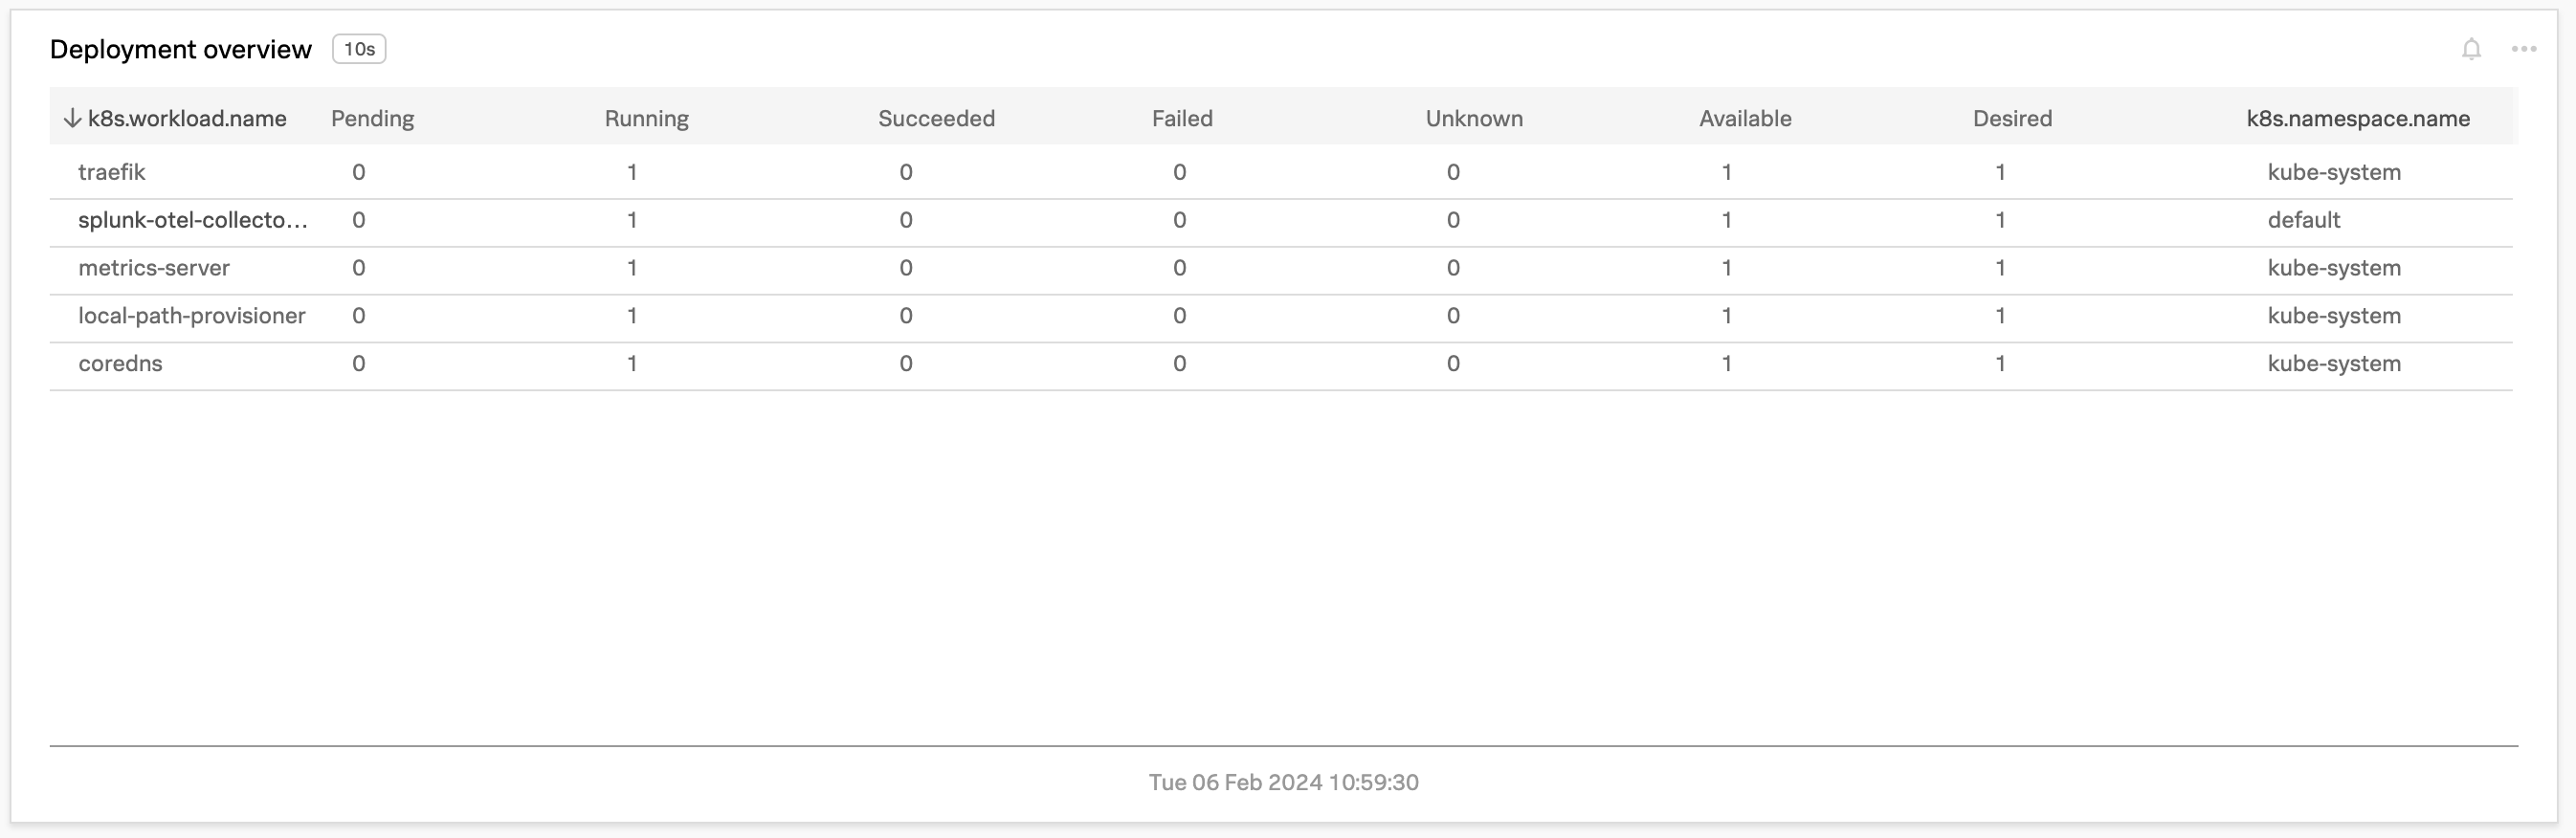
2.2 The Deployment Overview pane
The Deployment Overview pane gives you a quick insight into the status of your deployments. You can see at once if the pods of your deployments are Pending, Running, Succeeded, Failed or in an Unknown state.
Running: Pod is deployed and in a running state
Pending: Waiting to be deployed
Succeeded: Pod has been deployed and completed its job and is finished
Failed: Containers in the pod have run and returned some kind of error
Unknown: Kubernetes isn’t reporting any of the known states. (This may be during the starting or stopping of pods, for example).
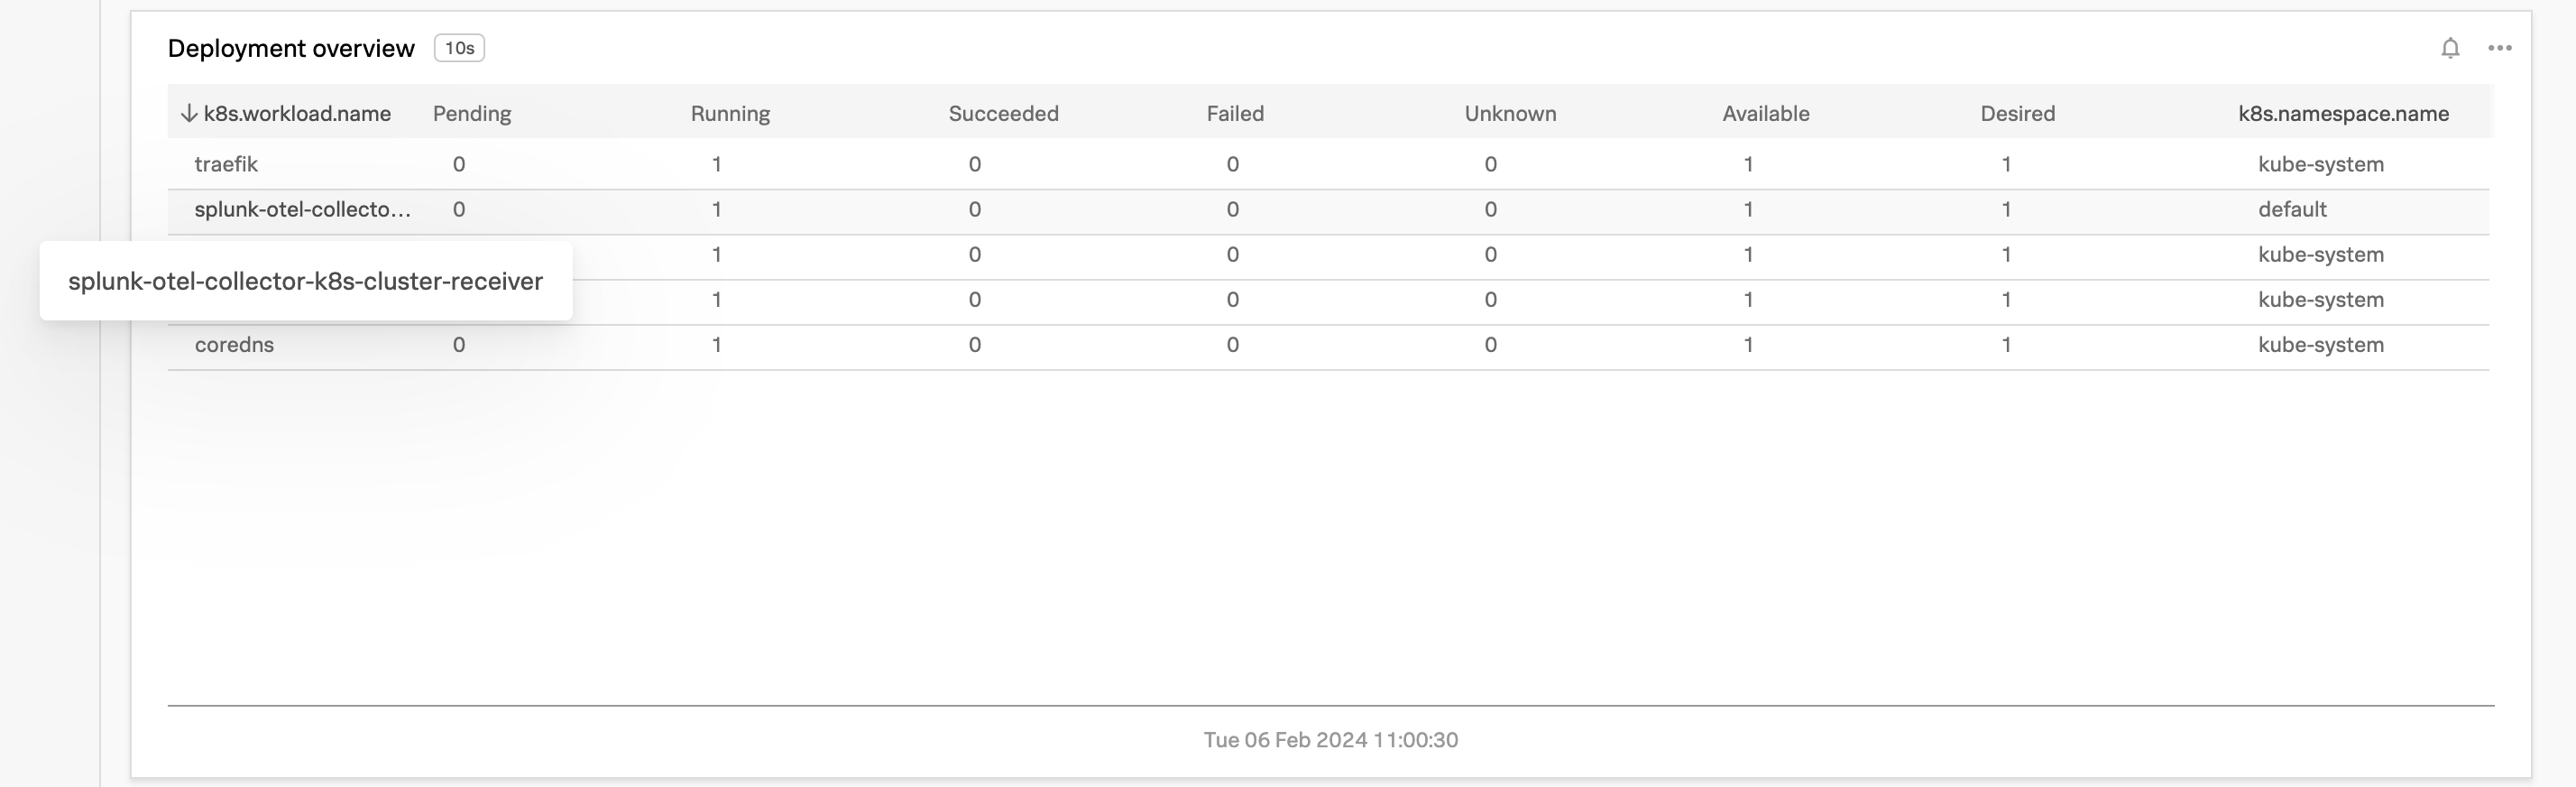
You can expand the Workload name by hovering your mouse on it, in case the name is longer than the chart allows.
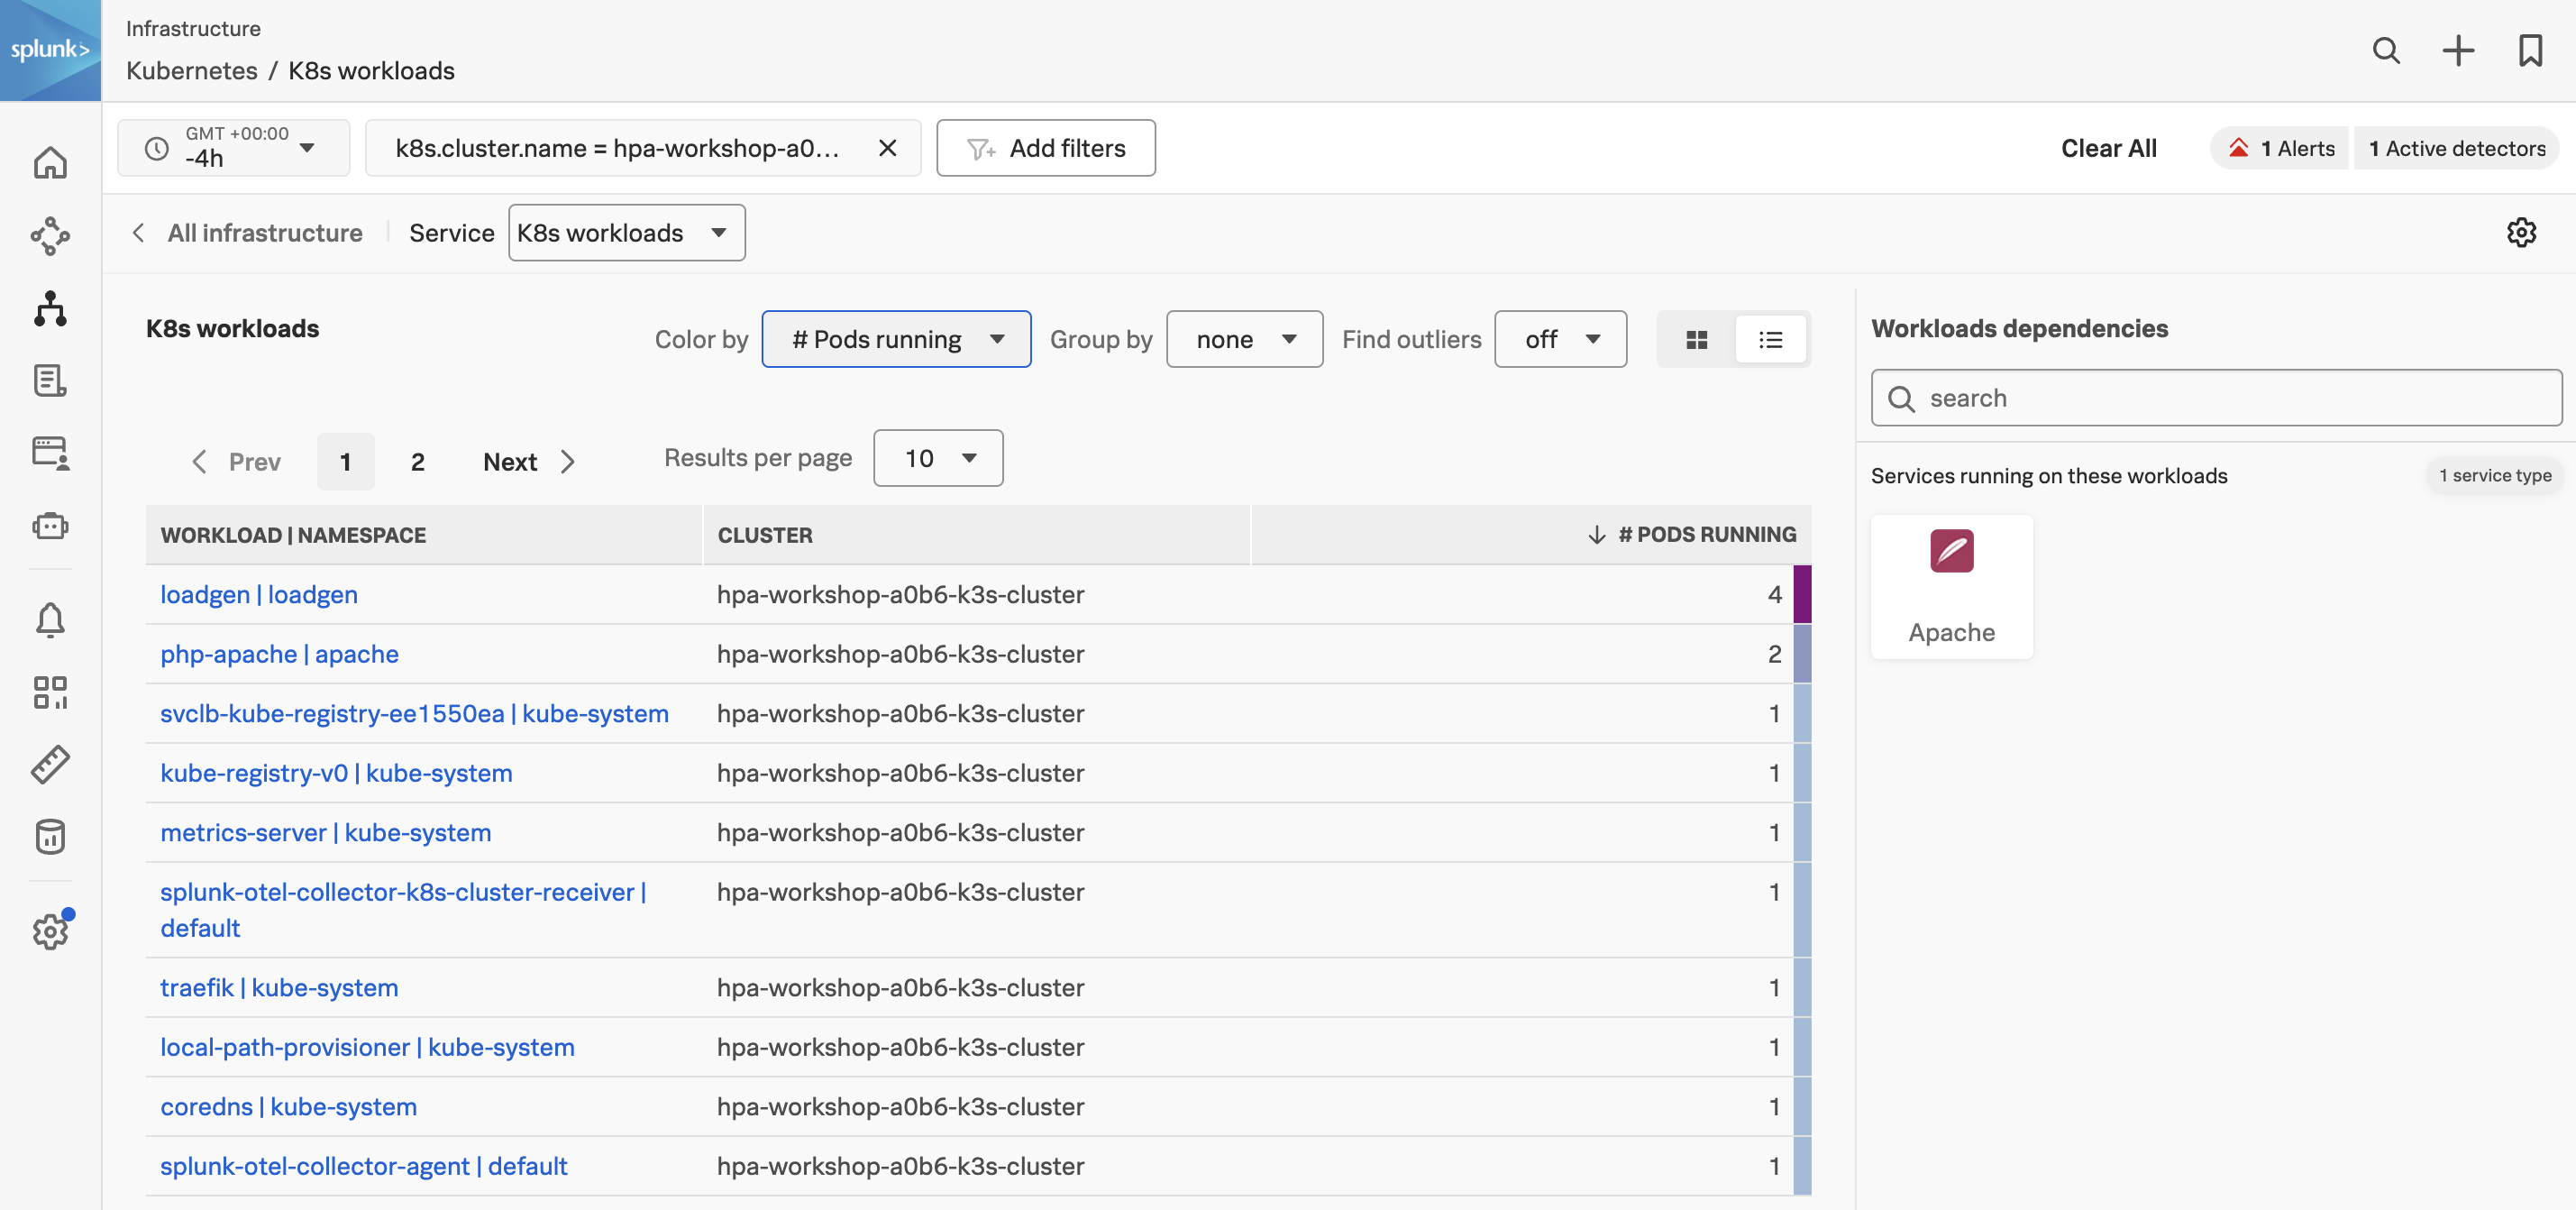
To filter to a specific workload, you can click on three dots … next to the workload name in the k8s.workload.name column and choose Filter from the dropdown box.
This will add the selected workload to your filters. It would then list a single workload in the default namespace.
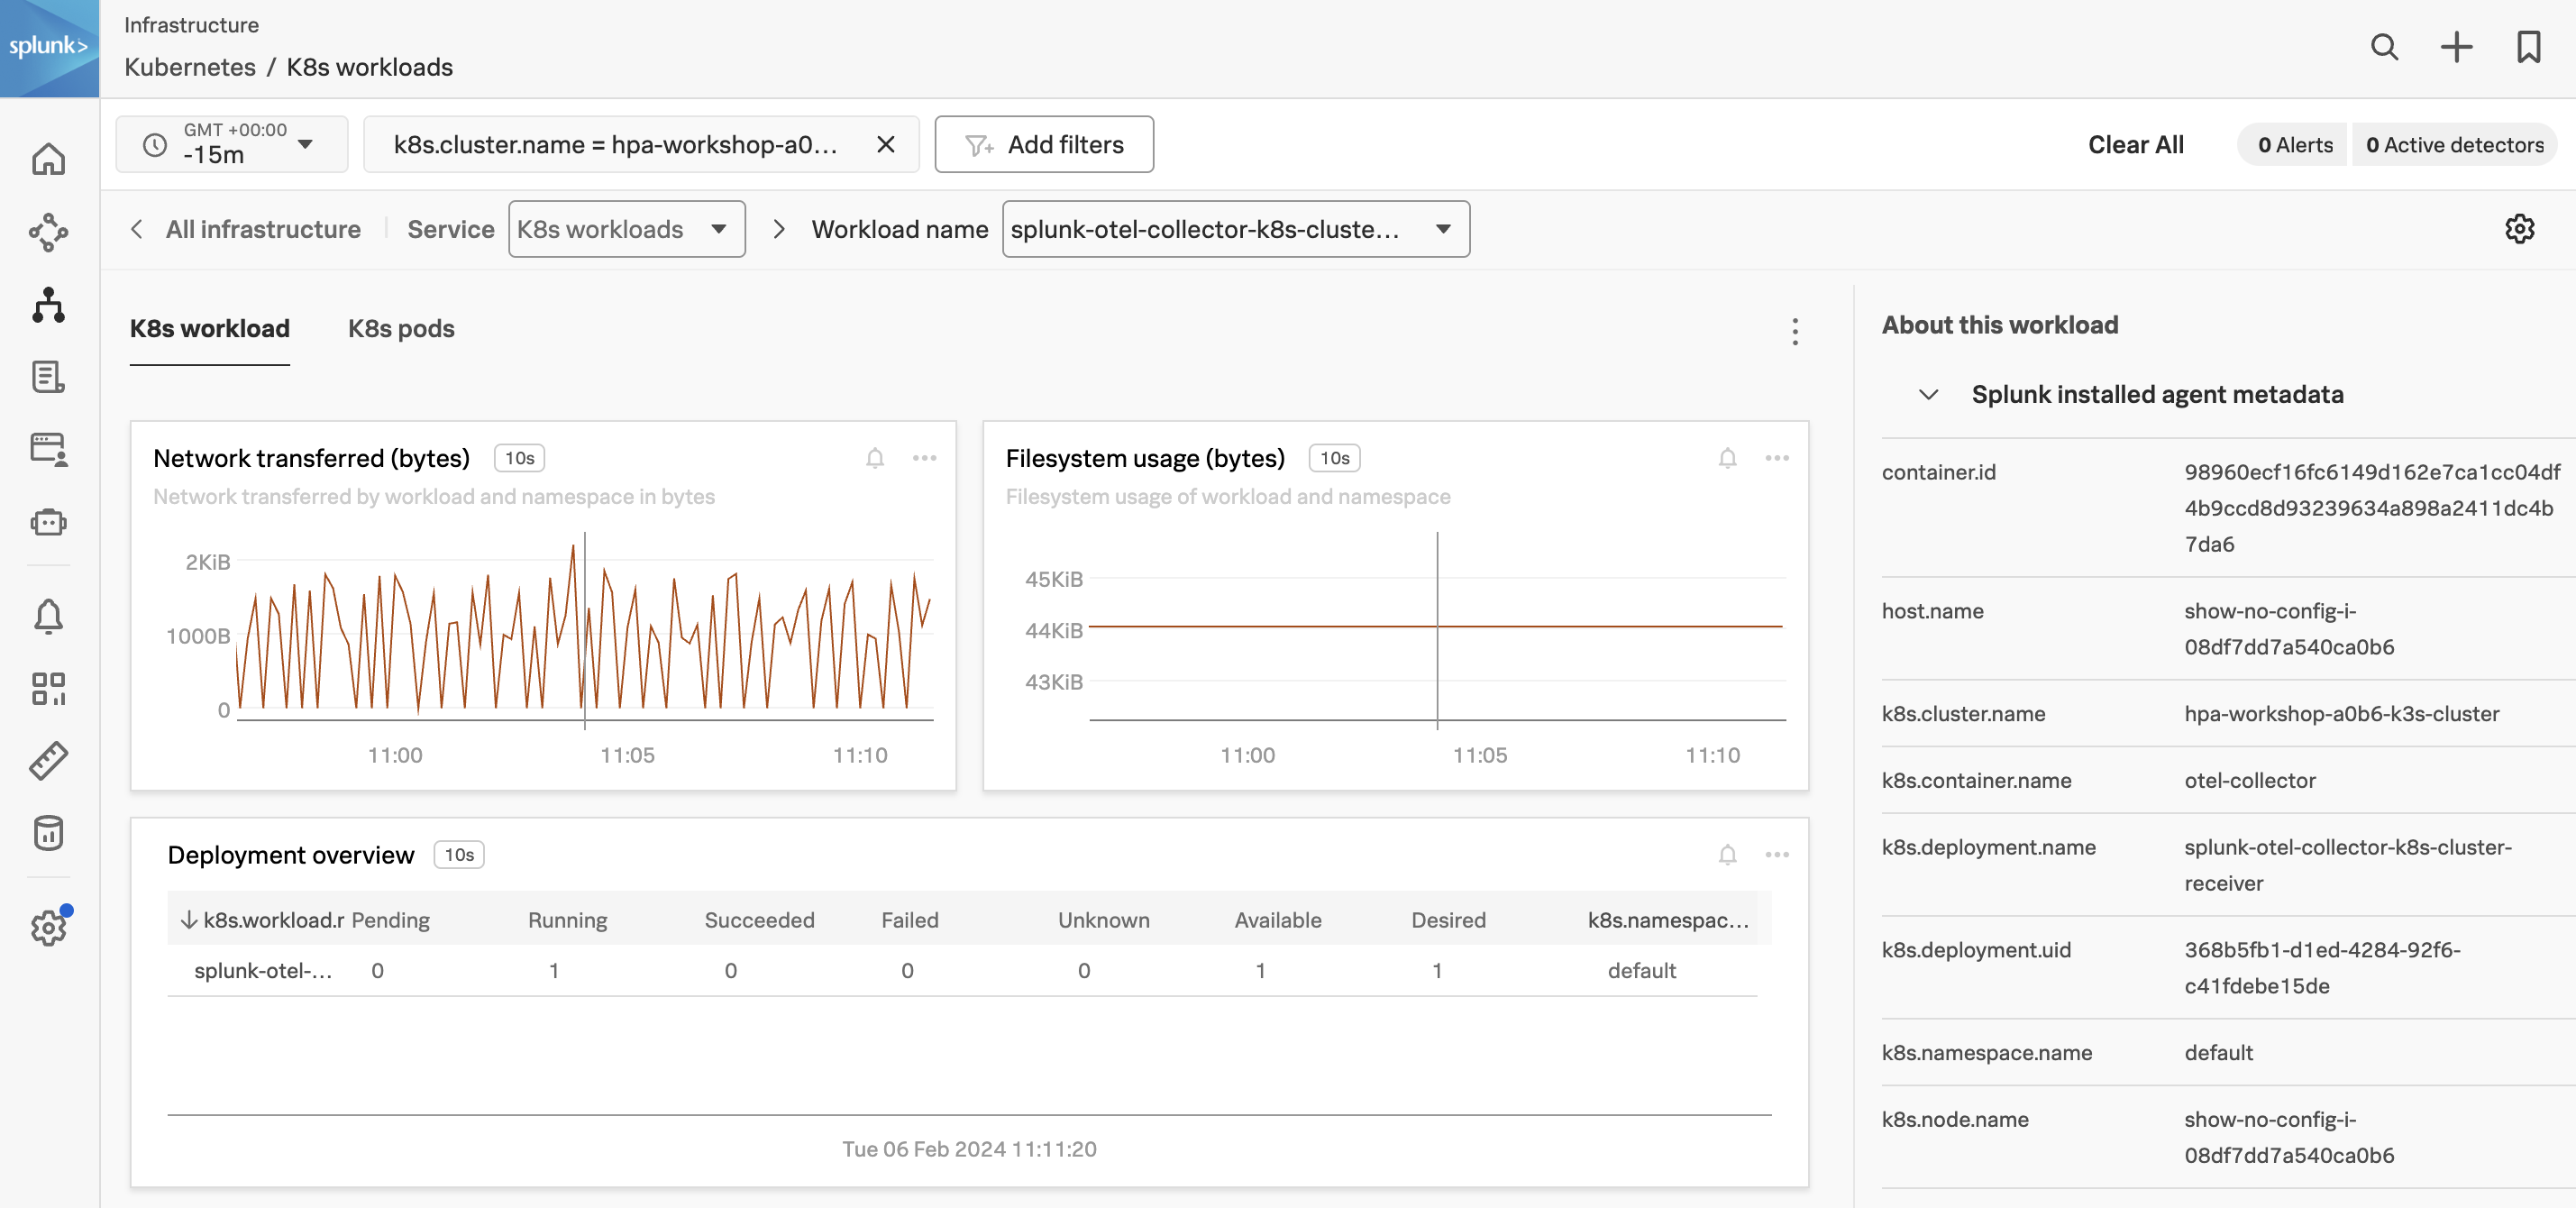
From the Heatmap above find the splunk-otel-collector-k8s-cluster-receiver in the default namespace and click on the square to see more information about the workload.
Workshop Question
What are the CPU request & CPU limit units for the otel-collector?
At this point, you can drill into the information of the pods, but that is outside the scope of this workshop.
3. Navigator Sidebar
Later in the workshop, you will deploy an Apache server into your cluster which will display an icon in the Navigator Sidebar.
In navigators for Kubernetes, you can track dependent services and containers in the navigator sidebar. To get the most out of the navigator sidebar you configure the services you want to track by configuring an extra dimension called service.name. For this workshop, we have already configured the extraDimensions in the collector configuration for monitoring Apache e.g.
extraDimensions:service.name:php-apache
The Navigator Sidebar will expand and a link to the discovered service will be added as seen in the image below:
This will allow for easy switching between Navigators. The same applies to your Apache server instance, it will have a Navigator Sidebar allowing you to quickly jump back to the Kubernetes Navigator.
Deploying PHP/Apache
1. Namespaces in Kubernetes
Most of our customers will make use of some kind of private or public cloud service to run Kubernetes. They often choose to have only a few large Kubernetes clusters as it is easier to manage centrally.
Namespaces are a way to organize these large Kubernetes clusters into virtual sub-clusters. This can be helpful when different teams or projects share a Kubernetes cluster as this will give them the easy ability to just see and work with their resources.
Any number of namespaces are supported within a cluster, each logically separated from others but with the ability to communicate with each other. Components are only visible when selecting a namespace or when adding the --all-namespaces flag to kubectl instead of allowing you to view just the components relevant to your project by selecting your namespace.
Most customers will want to install the applications into a separate namespace. This workshop will follow that best practice.
2. DNS and Services in Kubernetes
The Domain Name System (DNS) is a mechanism for linking various sorts of information with easy-to-remember names, such as IP addresses. Using a DNS system to translate request names into IP addresses makes it easy for end-users to reach their target domain name effortlessly.
Most Kubernetes clusters include an internal DNS service configured by default to offer a lightweight approach for service discovery. Even when Pods and Services are created, deleted, or shifted between nodes, built-in service discovery simplifies applications to identify and communicate with services on the Kubernetes clusters.
In short, the DNS system for Kubernetes will create a DNS entry for each Pod and Service. In general, a Pod has the following DNS resolution:
pod-name.my-namespace.pod.cluster-domain.example
For example, if a Pod in the default namespace has the Pod name my_pod, and the domain name for your cluster is cluster.local, then the Pod has a DNS name:
my_pod.default.pod.cluster.local
Any Pods exposed by a Service have the following DNS resolution available:
The above file contains an observation rule for Apache using the OTel receiver_creator. This receiver can instantiate other receivers at runtime based on whether observed endpoints match a configured rule.
The configured rules will be evaluated for each endpoint discovered. If the rule evaluates to true, then the receiver for that rule will be started as configured against the matched endpoint.
In the file above we tell the OpenTelemetry agent to look for Pods that match the name apache and have port 80 open. Once found, the agent will configure an Apache receiver to read Apache metrics from the configured URL. Note, the K8s DNS-based URL in the above YAML for the service.
To use the Apache configuration, you can upgrade the existing Splunk OpenTelemetry Collector Helm chart to use the otel-apache.yaml file with the following command:
The REVISION number of the deployment has changed, which is a helpful way to keep track of your changes.
Release "splunk-otel-collector" has been upgraded. Happy Helming!
NAME: splunk-otel-collector
LAST DEPLOYED: Tue Feb  6 11:17:15 2024
NAMESPACE: default
STATUS: deployed
REVISION: 2
TEST SUITE: None
5. Kubernetes ConfigMaps
A ConfigMap is an object in Kubernetes consisting of key-value pairs that can be injected into your application. With a ConfigMap, you can separate configuration from your Pods.
Using ConfigMap, you can prevent hardcoding configuration data. ConfigMaps are useful for storing and sharing non-sensitive, unencrypted configuration information.
The OpenTelemetry collector/agent uses ConfigMaps to store the configuration of the agent and the K8s Cluster receiver. You can/will always verify the current configuration of an agent after a change by running the following commands:
kubectl get cm
Workshop Question
How many ConfigMaps are used by the collector?
When you have a list of ConfigMaps from the namespace, select the one for the otel-agent and view it with the following command:
kubectl get cm splunk-otel-collector-otel-agent -o yaml
NOTE
The option -o yaml will output the content of the ConfigMap in a readable YAML format.
Workshop Question
Is the configuration from otel-apache.yaml visible in the ConfigMap for the collector agent?
6. Review PHP/Apache deployment YAML
Inspect the YAML file ~/workshop/k3s/php-apache.yaml and validate the contents using the following command:
cat ~/workshop/k3s/php-apache.yaml
This file contains the configuration for the PHP/Apache deployment and will create a new StatefulSet with a single replica of the PHP/Apache image.
A stateless application does not care which network it is using, and it does not need permanent storage. Examples of stateless apps may include web servers such as Apache, Nginx, or Tomcat.
What metrics for your Apache instance are being reported in the Apache Navigator?
Tip: Use the Navigator Sidebar and click on the service name.
Workshop Question
Using Log Observer what is the issue with the PHP/Apache deployment?
Tip: Adjust your filters to use: object = php-apache-svc and k8s.cluster.name = <your_cluster>.
Fix PHP/Apache Issue
1. Kubernetes Resources
Especially in Production Kubernetes Clusters, CPU and Memory are considered precious resources. Cluster Operators will normally require you to specify the amount of CPU and Memory your Pod or Service will require in the deployment, so they can have the Cluster automatically manage on which Node(s) your solution will be placed.
You do this by placing a Resource section in the deployment of your application/Pod
Example:
resources:limits:# Maximum amount of CPU & memory for peek usecpu:"8"# Maximum of 8 cores of CPU allowed at for peek usememory:"8Mi"# Maximum allowed 8Mb of memoryrequests:# Request are the expected amount of CPU & memory for normal usecpu:"6"# Requesting 4 cores of a CPUmemory:"4Mi"# Requesting 4Mb of memory
If your application or Pod will go over the limits set in your deployment, Kubernetes will kill and restart your Pod to protect the other applications on the Cluster.
Another scenario that you will run into is when there is not enough Memory or CPU on a Node. In that case, the Cluster will try to reschedule your Pod(s) on a different Node with more space.
If that fails, or if there is not enough space when you deploy your application, the Cluster will put your workload/deployment in schedule mode until there is enough room on any of the available Nodes to deploy the Pods according to their limits.
2. Fix PHP/Apache Deployment
Workshop Question
Before we start, let’s check the current status of the PHP/Apache deployment. Under Alerts & Detectors which detector has fired? Where else can you find this information?
To fix the PHP/Apache StatefulSet, edit ~/workshop/k3s/php-apache.yaml using the following commands to reduce the CPU resources:
vim ~/workshop/k3s/php-apache.yaml
Find the resources section and reduce the CPU limits to 1 and the CPU requests to 0.5:
Save the changes you have made. (Hint: Use Esc followed by :wq! to save your changes).
Now, we must delete the existing StatefulSet and re-create it. StatefulSets are immutable, so we must delete the existing one and re-create it with the new changes.
You can validate the changes have been applied by running the following command:
kubectl describe statefulset php-apache -n apache
Validate the Pod is now running in Splunk Observability Cloud.
Workshop Question
Is the Apache Web Servers dashboard showing any data now?
Tip: Don’t forget to use filters and time frames to narrow down your data.
Monitor the Apache web servers Navigator dashboard for a few minutes.
Workshop Question
What is happening with the # Hosts reporting chart?
4. Fix the memory issue
If you navigate back to the Apache dashboard, you will notice that metrics are no longer coming in. We have another resource issue and this time we are Out of Memory. Let’s edit the stateful set and increase the memory to what is shown in the image below:
kubectl edit will open the contents in the vi editor, use Esc followed by :wq! to save your changes.
Because StatefulSets are immutable, we must delete the existing Pod and let the StatefulSet re-create it with the new changes.
kubectl delete pod php-apache-0 -n apache
Validate the changes have been applied by running the following command:
kubectl describe statefulset php-apache -n apache
Deploy Load Generator
Now let’s apply some load against the php-apache pod. To do this, you will need to start a different Pod to act as a client. The container within the client Pod runs in an infinite loop, sending HTTP GETs to the php-apache service.
1. Review loadgen YAML
Inspect the YAML file ~/workshop/k3s/loadgen.yaml and validate the contents using the following command:
cat ~/workshop/k3s/loadgen.yaml
This file contains the configuration for the load generator and will create a new ReplicaSet with two replicas of the load generator image.
Once you have deployed the load generator, you can see the Pods running in the loadgen namespace. Use previous similar commands to check the status of the Pods from the command line.
Workshop Question
Which metrics in the Apache Navigator have now significantly increased?
4. Scale the load generator
A ReplicaSet is a process that runs multiple instances of a Pod and keeps the specified number of Pods constant. Its purpose is to maintain the specified number of Pod instances running in a cluster at any given time to prevent users from losing access to their application when a Pod fails or is inaccessible.
ReplicaSet helps bring up a new instance of a Pod when the existing one fails, scale it up when the running instances are not up to the specified number, and scale down or delete Pods if another instance with the same label is created. A ReplicaSet ensures that a specified number of Pod replicas are running continuously and helps with load-balancing in case of an increase in resource usage.
Let’s scale our ReplicaSet to 4 replicas using the following command:
Validate the replicas are running from both the command line and Splunk Observability Cloud:
kubectl get replicaset loadgen -n loadgen
Workshop Question
What impact can you see in the Apache Navigator?
Let the load generator run for around 2-3 minutes and keep observing the metrics in the Kubernetes Navigator and the Apache Navigator.
Setup Horizontal Pod Autoscaling (HPA)
In Kubernetes, a HorizontalPodAutoscaler automatically updates a workload resource (such as a Deployment or StatefulSet), to automatically scale the workload to match demand.
Horizontal scaling means that the response to increased load is to deploy more Pods. This is different from vertical scaling, which for Kubernetes would mean assigning more resources (for example: memory or CPU) to the Pods that are already running for the workload.
If the load decreases, and the number of Pods is above the configured minimum, the HorizontalPodAutoscaler instructs the workload resource (the Deployment, StatefulSet, or other similar resource) to scale back down.
1. Setup HPA
Inspect the ~/workshop/k3s/hpa.yaml file and validate the contents using the following command:
cat ~/workshop/k3s/hpa.yaml
This file contains the configuration for the Horizontal Pod Autoscaler and will create a new HPA for the php-apache deployment.
Once deployed, php-apache will autoscale when either the average CPU usage goes above 50% or the average memory usage for the deployment goes above 75%, with a minimum of 1 pod and a maximum of 4 pods.
kubectl apply -f ~/workshop/k3s/hpa.yaml
2. Validate HPA
kubectl get hpa -n apache
Go to the Workloads or Node Detail tab in Kubernetes and check the HPA deployment.
Workshop Question
How many additional php-apache-x pods have been created?
Workshop Question
Which metrics in the Apache Navigator have significantly increased again?
3. Increase the HPA replica count
Increase the maxReplicas to 8
kubectl edit hpa php-apache -n apache
Save the changes you have made. (Hint: Use Esc followed by :wq! to save your changes).
Workshop Questions
How many pods are now running?
How many are pending?
Why are they pending?
Congratulations! You have completed the workshop.
Making Your Observability Cloud Native With OpenTelemetry
1 hourAuthor
Robert Castley
Abstract
Organizations getting started with OpenTelemetry may begin by sending data directly to an observability backend. While this works well for initial testing, using the OpenTelemetry collector as part of your observability architecture provides numerous benefits and is recommended for any production deployment.
In this workshop, we will be focusing on using the OpenTelemetry collector and starting with the fundamentals of configuring the receivers, processors, and exporters ready to use with Splunk Observability Cloud. The journey will take attendees from novices to being able to start adding custom components to help solve for their business observability needs for their distributed platform.
Ninja Sections
Throughout the workshop there will be expandable Ninja Sections, these will be more hands on and go into further technical detail that you can explore within the workshop or in your own time.
Please note that the content in these sections may go out of date due to the frequent development being made to the OpenTelemetry project. Links will be provided in the event details are out of sync, please let us know if you spot something that needs updating.
By completing this workshop you will officially be an OpenTelemetry Collector Ninja!
Target Audience
This interactive workshop is for developers and system administrators who are interested in learning more about architecture and deployment of the OpenTelemetry Collector.
Prerequisites
Attendees should have a basic understanding of data collection
Command line and vim/vi experience.
A instance/host/VM running Ubuntu 20.04 LTS or 22.04 LTS.
Minimum requirements are an AWS/EC2 t2.micro (1 CPU, 1GB RAM, 8GB Storage)
Learning Objectives
By the end of this talk, attendees will be able to:
Understand the components of OpenTelemetry
Use receivers, processors, and exporters to collect and analyze data
Identify the benefits of using OpenTelemetry
Build a custom component to solve their business needs
Subsections of Making Your Observability Cloud Native With OpenTelemetry
Installing OpenTelemetry Collector Contrib
Download the OpenTelemetry Collector Contrib distribution
The first step in installing the Open Telemetry Collector is downloading it. For our lab, we will use the wget command to download the .deb package from the OpenTelemetry Github repository.
Selecting previously unselected package otelcol-contrib.
(Reading database ... 64218 files and directories currently installed.)
Preparing to unpack otelcol-contrib_0.96.0_linux_amd64.deb ...
Unpacking otelcol-contrib (0.96.0) ...
Setting up otelcol-contrib (0.96.0) ...
Created symlink /etc/systemd/system/multi-user.target.wants/otelcol-contrib.service → /lib/systemd/system/otelcol-contrib.service.
Subsections of Installing OpenTelemetry Collector Contrib
Installing OpenTelemetry Collector Contrib
Confirm the Collector is running
The collector should now be running. We will verify this as root using systemctl command. To exit the status just press q.
sudo systemctl status otelcol-contrib
● otelcol-contrib.service - OpenTelemetry Collector Contrib
     Loaded: loaded (/lib/systemd/system/otelcol-contrib.service; enabled; vendor preset: enabled)
     Active: active (running) since Tue 2023-05-16 08:23:23 UTC; 25s ago
   Main PID: 1415 (otelcol-contrib)
      Tasks: 5 (limit: 1141)
     Memory: 22.2M
        CPU: 125ms
     CGroup: /system.slice/otelcol-contrib.service
             └─1415 /usr/bin/otelcol-contrib --config=/etc/otelcol-contrib/config.yaml

May 16 08:23:39 ip-10-0-9-125 otelcol-contrib[1415]: NumberDataPoints #0
May 16 08:23:39 ip-10-0-9-125 otelcol-contrib[1415]: Data point attributes:
May 16 08:23:39 ip-10-0-9-125 otelcol-contrib[1415]:      -> exporter: Str(logging)
May 16 08:23:39 ip-10-0-9-125 otelcol-contrib[1415]:      -> service_instance_id: Str(df8a57f4-abdc-46b9-a847-acd62db1001f)
May 16 08:23:39 ip-10-0-9-125 otelcol-contrib[1415]:      -> service_name: Str(otelcol-contrib)
May 16 08:23:39 ip-10-0-9-125 otelcol-contrib[1415]:      -> service_version: Str(0.75.0)
May 16 08:23:39 ip-10-0-9-125 otelcol-contrib[1415]: StartTimestamp: 2023-05-16 08:23:39.006 +0000 UTC
May 16 08:23:39 ip-10-0-9-125 otelcol-contrib[1415]: Timestamp: 2023-05-16 08:23:39.006 +0000 UTC
May 16 08:23:39 ip-10-0-9-125 otelcol-contrib[1415]: Value: 0.000000
May 16 08:23:39 ip-10-0-9-125 otelcol-contrib[1415]:         {"kind": "exporter", "data_type": "metrics", "name": "logging"}
Because we will be making multiple configuration file changes, setting environment variables and restarting the collector, we need to stop the collector service and disable it from starting on boot.
An alternative approach would be to use the golang tool chain to build the binary locally by doing:
go install go.opentelemetry.io/collector/cmd/builder@v0.80.0
mv $(go env GOPATH)/bin/builder /usr/bin/ocb
(Optional) Docker
Why build your own collector?
The default distribution of the collector (core and contrib) either contains too much or too little in what they have to offer.
It is also not advised to run the contrib collector in your production environments due to the amount of components installed which more than likely are not needed by your deployment.
Benefits of building your own collector?
When creating your own collector binaries, (commonly referred to as distribution), means you build what you need.
The benefits of this are:
Smaller sized binaries
Can use existing go scanners for vulnerabilities
Include internal components that can tie in with your organization
Considerations for building your collector?
Now, this would not be a 🥷 Ninja zone if it didn’t come with some drawbacks:
Go experience is recommended if not required
No Splunk support
Responsibility for distribution and lifecycle management
It is important to note that the project is working towards stability but it does not mean changes made will not break your workflow. The team at Splunk provides increased support and a higher level of stability so they can provide a curated experience helping you with your deployment needs.
The Ninja Zone
Once you have all the required tools installed to get started, you will need to create a new file named otelcol-builder.yaml and we will follow this directory structure:
.
└── otelcol-builder.yaml
Once we have the file created, we need to add a list of components for it to install with some additional metadata.
For this example, we are going to create a builder manifest that will install only the components we need for the introduction config:
OpenTelemetry is configured through YAML files. These files have default configurations that we can modify to meet our needs. Let’s look at the default configuration that is supplied:
Congratulations! You have successfully downloaded and installed the OpenTelemetry Collector. You are well on your way to becoming an OTel Ninja. But first let’s walk through configuration files and different distributions of the OpenTelemetry Collector.
Note
Splunk does provide its own, fully supported, distribution of the OpenTelemetry Collector. This distribution is available to install from the Splunk GitHub Repository or via a wizard in Splunk Observability Cloud that will build out a simple installation script to copy and paste. This distribution includes many additional features and enhancements that are not available in the OpenTelemetry Collector Contrib distribution.
The Splunk Distribution of the OpenTelemetry Collector is production-tested; it is in use by the majority of customers in their production environments.
Customers that use our distribution can receive direct help from official Splunk support within SLAs.
Customers can use or migrate to the Splunk Distribution of the OpenTelemetry Collector without worrying about future breaking changes to its core configuration experience for metrics and traces collection (OpenTelemetry logs collection configuration is in beta). There may be breaking changes to the Collector’s metrics.
We will now walk through each section of the configuration file and modify it to send host metrics to Splunk Observability Cloud.
OpenTelemetry Collector Extensions
Now that we have the OpenTelemetry Collector installed, let’s take a look at extensions for the OpenTelemetry Collector. Extensions are optional and available primarily for tasks that do not involve processing telemetry data. Examples of extensions include health monitoring, service discovery, and data forwarding.
Extensions are configured in the same config.yaml file that we referenced in the installation step. Let’s edit the config.yaml file and configure the extensions. Note that the pprof and zpages extensions are already configured in the default config.yaml file. For the purpose of this workshop, we will only be updating the health_check extension to expose the port on all network interfaces on which we can access the health of the collector.
This extension enables an HTTP URL that can be probed to check the status of the OpenTelemetry Collector. This extension can be used as a liveness and/or readiness probe on Kubernetes. To learn more about the curl command, check out the curl man page.
Open a new terminal session and SSH into your instance to run the following command:
Performance Profiler extension enables the golang net/http/pprof endpoint. This is typically used by developers to collect performance profiles and investigate issues with the service. We will not be covering this in this workshop.
OpenTelemetry Collector Extensions
zPages
zPages are an in-process alternative to external exporters. When included, they collect and aggregate tracing and metrics information in the background; this data is served on web pages when requested. zPages are an extremely useful diagnostic feature to ensure the collector is running as expected.
ServiceZ gives an overview of the collector services and quick access to the pipelinez, extensionz, and featurez zPages. The page also provides build and runtime information.
PipelineZ provides insights on the running pipelines running in the collector. You can find information on type, if data is mutated, and you can also see information on the receivers, processors and exporters that are used for each pipeline.
For this, we will need to validate that our distribution has the file_storage extension installed. This can be done by running the command otelcol-contrib components which should show results like:
# ... truncated for clarityextensions:- file_storage
This extension provides exporters the ability to queue data to disk in the event that exporter is unable to send data to the configured endpoint.
In order to configure the extension, you will need to update your config to include the information below. First, be sure to create a /tmp/otel-data directory and give it read/write permissions:
extensions:...file_storage:directory:/tmp/otel-datatimeout:10scompaction:directory:/tmp/otel-dataon_start:trueon_rebound:truerebound_needed_threshold_mib:5rebound_trigger_threshold_mib:3# ... truncated for clarityservice:extensions:[health_check, pprof, zpages, file_storage]
Why queue data to disk?
This allows the collector to weather network interruptions (and even collector restarts) to ensure data is sent to the upstream provider.
Considerations for queuing data to disk?
There is a potential that this could impact data throughput performance due to disk performance.
Now that we have reviewed extensions, let’s dive into the data pipeline portion of the workshop. A pipeline defines a path the data follows in the Collector starting from reception, moving to further processing or modification, and finally exiting the Collector via exporters.
The data pipeline in the OpenTelemetry Collector is made up of receivers, processors, and exporters. We will first start with receivers.
OpenTelemetry Collector Receivers
Welcome to the receiver portion of the workshop! This is the starting point of the data pipeline of the OpenTelemetry Collector. Let’s dive in.
A receiver, which can be push or pull based, is how data gets into the Collector. Receivers may support one or more data sources. Generally, a receiver accepts data in a specified format, translates it into the internal format and passes it to processors and exporters defined in the applicable pipelines.
The Host Metrics Receiver generates metrics about the host system scraped from various sources. This is intended to be used when the collector is deployed as an agent which is what we will be doing in this workshop.
Let’s update the /etc/otel-contrib/config.yaml file and configure the hostmetrics receiver. Insert the following YAML under the receivers section, taking care to indent by two spaces.
sudo vi /etc/otelcol-contrib/config.yaml
receivers:hostmetrics:collection_interval:10sscrapers:# CPU utilization metricscpu:# Disk I/O metricsdisk:# File System utilization metricsfilesystem:# Memory utilization metricsmemory:# Network interface I/O metrics & TCP connection metricsnetwork:# CPU load metricsload:# Paging/Swap space utilization and I/O metricspaging:# Process count metricsprocesses:# Per process CPU, Memory and Disk I/O metrics. Disabled by default.# process:
OpenTelemetry Collector Receivers
Prometheus Receiver
You will also notice another receiver called prometheus. Prometheus is an open-source toolkit used by the OpenTelemetry Collector. This receiver is used to scrape metrics from the OpenTelemetry Collector itself. These metrics can then be used to monitor the health of the collector.
Let’s modify the prometheus receiver to clearly show that it is for collecting metrics from the collector itself. By changing the name of the receiver from prometheus to prometheus/internal, it is now much clearer as to what that receiver is doing. Update the configuration file to look like this:
The following screenshot shows an example dashboard of spme of the metrics the Prometheus internal receiver collects from the OpenTelemetry Collector. Here, we can see accepted and sent spans, metrics and log records.
Note
The following screenshot is an out-of-the-box (OOTB) dashboard from Splunk Observability Cloud that allows you to easily monitor your Splunk OpenTelemetry Collector install base.
OpenTelemetry Collector Receivers
Other Receivers
You will notice in the default configuration there are other receivers: otlp, opencensus, jaeger and zipkin. These are used to receive telemetry data from other sources. We will not be covering these receivers in this workshop and they can be left as they are.
To help observe short lived tasks like docker containers, kubernetes pods, or ssh sessions, we can use the receiver creator with observer extensions to create a new receiver as these services start up.
What do we need?
In order to start using the receiver creator and its associated observer extensions, they will need to be part of your collector build manifest.
Some short lived tasks may require additional configuration such as username, and password.
These values can be referenced via environment variables,
or use a scheme expand syntax such as ${file:./path/to/database/password}.
Please adhere to your organisation’s secret practices when taking this route.
The Ninja Zone
There are only two things needed for this ninja zone:
Make sure you have added receiver creater and observer extensions to the builder manifest.
Create the config that can be used to match against discovered endpoints.
To create the templated configurations, you can do the following:
receiver_creator:watch_observers:[host_observer]receivers:redis:rule:type == "port" && port == 6379config:password:${env:HOST_REDIS_PASSWORD}
extensions:health_check:endpoint:0.0.0.0:13133pprof:endpoint:0.0.0.0:1777zpages:endpoint:0.0.0.0:55679receivers:hostmetrics:collection_interval:10sscrapers:# CPU utilization metricscpu:# Disk I/O metricsdisk:# File System utilization metricsfilesystem:# Memory utilization metricsmemory:# Network interface I/O metrics & TCP connection metricsnetwork:# CPU load metricsload:# Paging/Swap space utilization and I/O metricspaging:# Process count metricsprocesses:# Per process CPU, Memory and Disk I/O metrics. Disabled by default.# process:otlp:protocols:grpc:http:opencensus:# Collect own metricsprometheus/internal:config:scrape_configs:- job_name:'otel-collector'scrape_interval:10sstatic_configs:- targets:['0.0.0.0:8888']jaeger:protocols:grpc:thrift_binary:thrift_compact:thrift_http:zipkin:processors:batch:exporters:logging:verbosity:detailedservice:pipelines:traces:receivers:[otlp, opencensus, jaeger, zipkin]processors:[batch]exporters:[logging]metrics:receivers:[otlp, opencensus, prometheus/internal]processors:[batch]exporters:[logging]extensions:[health_check, pprof, zpages]
Now that we have reviewed how data gets into the OpenTelemetry Collector through receivers, let’s now take a look at how the Collector processes the received data.
Warning
As the /etc/otelcol-contrib/config.yaml is not complete, please do not attempt to restart the collector at this point.
OpenTelemetry Collector Processors
Processors are run on data between being received and being exported. Processors are optional though some are recommended. There are a large number of processors included in the OpenTelemetry contrib Collector.
By default, only the batch processor is enabled. This processor is used to batch up data before it is exported. This is useful for reducing the number of network calls made to exporters. For this workshop, we will inherit the following defaults which are hard-coded into the Collector:
send_batch_size (default = 8192): Number of spans, metric data points, or log records after which a batch will be sent regardless of the timeout. send_batch_size acts as a trigger and does not affect the size of the batch. If you need to enforce batch size limits sent to the next component in the pipeline see send_batch_max_size.
timeout (default = 200ms): Time duration after which a batch will be sent regardless of size. If set to zero, send_batch_size is ignored as data will be sent immediately, subject to only send_batch_max_size.
send_batch_max_size (default = 0): The upper limit of the batch size. 0 means no upper limit on the batch size. This property ensures that larger batches are split into smaller units. It must be greater than or equal to send_batch_size.
The resourcedetection processor can be used to detect resource information from the host and append or override the resource value in telemetry data with this information.
By default, the hostname is set to the FQDN if possible, otherwise, the hostname provided by the OS is used as a fallback. This logic can be changed from using using the hostname_sources configuration option. To avoid getting the FQDN and use the hostname provided by the OS, we will set the hostname_sources to os.
If the workshop instance is running on an AWS/EC2 instance we can gather the following tags from the EC2 metadata API (this is not available on other platforms).
cloud.provider ("aws")
cloud.platform ("aws_ec2")
cloud.account.id
cloud.region
cloud.availability_zone
host.id
host.image.id
host.name
host.type
We will create another processor to append these tags to our metrics.
The attributes processor modifies attributes of a span, log, or metric. This processor also supports the ability to filter and match input data to determine if they should be included or excluded for specified actions.
It takes a list of actions that are performed in the order specified in the config. The supported actions are:
insert: Inserts a new attribute in input data where the key does not already exist.
update: Updates an attribute in input data where the key does exist.
upsert: Performs insert or update. Inserts a new attribute in input data where the key does not already exist and updates an attribute in input data where the key does exist.
delete: Deletes an attribute from the input data.
hash: Hashes (SHA1) an existing attribute value.
extract: Extracts values using a regular expression rule from the input key to target keys specified in the rule. If a target key already exists, it will be overridden.
We are going to create an attributes processor to insert a new attribute to all our host metrics called participant.name with a value of your name e.g. marge_simpson.
Warning
Ensure you replace INSERT_YOUR_NAME_HERE with your name and also ensure you do not use spaces in your name.
Later on in the workshop, we will use this attribute to filter our metrics in Splunk Observability Cloud.
One of the most recent additions to the collector was the notion of a connector, which allows you to join the output of one pipeline to the input of another pipeline.
An example of how this is beneficial is that some services emit metrics based on the amount of datapoints being exported, the number of logs containing an error status,
or the amount of data being sent from one deployment environment. The count connector helps address this for you out of the box.
Why a connector instead of a processor?
A processor is limited in what additional data it can produce considering it has to pass on the data it has processed making it hard to expose additional information. Connectors do not have to emit the data they receive which means they provide an opportunity to create the insights we are after.
For example, a connector could be made to count the number of logs, metrics, and traces that do not have the deployment environment attribute.
A very simple example with the output of being able to break down data usage by deployment environment.
Considerations with connectors
A connector only accepts data exported from one pipeline and receiver by another pipeline, this means you may have to consider how you construct your collector config to take advantage of it.
extensions:health_check:endpoint:0.0.0.0:13133pprof:endpoint:0.0.0.0:1777zpages:endpoint:0.0.0.0:55679receivers:hostmetrics:collection_interval:10sscrapers:# CPU utilization metricscpu:# Disk I/O metricsdisk:# File System utilization metricsfilesystem:# Memory utilization metricsmemory:# Network interface I/O metrics & TCP connection metricsnetwork:# CPU load metricsload:# Paging/Swap space utilization and I/O metricspaging:# Process count metricsprocesses:# Per process CPU, Memory and Disk I/O metrics. Disabled by default.# process:otlp:protocols:grpc:http:opencensus:# Collect own metricsprometheus/internal:config:scrape_configs:- job_name:'otel-collector'scrape_interval:10sstatic_configs:- targets:['0.0.0.0:8888']jaeger:protocols:grpc:thrift_binary:thrift_compact:thrift_http:zipkin:processors:batch:resourcedetection/system:detectors:[system]system:hostname_sources:[os]resourcedetection/ec2:detectors:[ec2]attributes/conf:actions:- key:participant.nameaction:insertvalue:"INSERT_YOUR_NAME_HERE"exporters:logging:verbosity:detailedservice:pipelines:traces:receivers:[otlp, opencensus, jaeger, zipkin]processors:[batch]exporters:[logging]metrics:receivers:[otlp, opencensus, prometheus]processors:[batch]exporters:[logging]extensions:[health_check, pprof, zpages]
OpenTelemetry Collector Exporters
An exporter, which can be push or pull-based, is how you send data to one or more backends/destinations. Exporters may support one or more data sources.
For this workshop, we will be using the otlphttp exporter. The OpenTelemetry Protocol (OTLP) is a vendor-neutral, standardised protocol for transmitting telemetry data. The OTLP exporter sends data to a server that implements the OTLP protocol. The OTLP exporter supports both gRPC and HTTP/JSON protocols.
To send metrics over HTTP to Splunk Observability Cloud, we will need to configure the otlphttp exporter.
Let’s edit our /etc/otelcol-contrib/config.yaml file and configure the otlphttp exporter. Insert the following YAML under the exporters section, taking care to indent by two spaces e.g.
We will also change the verbosity of the logging exporter to prevent the disk from filling up. The default of detailed is very noisy.
Next, we need to define the metrics_endpoint and configure the target URL.
Note
If you are an attendee at a Splunk-hosted workshop, the instance you are using has already been configured with a Realm environment variable. We will reference that environment variable in our configuration file. Otherwise, you will need to create a new environment variable and set the Realm e.g.
exportREALM="us1"
The URL to use is https://ingest.${env:REALM}.signalfx.com/v2/datapoint/otlp. (Splunk has Realms in key geographical locations around the world for data residency).
The otlphttp exporter can also be configured to send traces and logs by defining a target URL for traces_endpoint and logs_endpoint respectively. Configuring these is outside the scope of this workshop.
By default, gzip compression is enabled for all endpoints. This can be disabled by setting compression: none in the exporter configuration. We will leave compression enabled for this workshop and accept the default as this is the most efficient way to send data.
To send metrics to Splunk Observability Cloud, we need to use an Access Token. This can be done by creating a new token in the Splunk Observability Cloud UI. For more information on how to create a token, see Create a token. The token needs to be of type INGEST.
Note
If you are an attendee at a Splunk-hosted workshop, the instance you are using has already been configured with an Access Token (which has been set as an environment variable). We will reference that environment variable in our configuration file. Otherwise, you will need to create a new token and set it as an environment variable e.g.
exportACCESS_TOKEN=<replace-with-your-token>
The token is defined in the configuration file by inserting X-SF-TOKEN: ${env:ACCESS_TOKEN} under a headers: section:
extensions:health_check:endpoint:0.0.0.0:13133pprof:endpoint:0.0.0.0:1777zpages:endpoint:0.0.0.0:55679receivers:hostmetrics:collection_interval:10sscrapers:# CPU utilization metricscpu:# Disk I/O metricsdisk:# File System utilization metricsfilesystem:# Memory utilization metricsmemory:# Network interface I/O metrics & TCP connection metricsnetwork:# CPU load metricsload:# Paging/Swap space utilization and I/O metricspaging:# Process count metricsprocesses:# Per process CPU, Memory and Disk I/O metrics. Disabled by default.# process:otlp:protocols:grpc:http:opencensus:# Collect own metricsprometheus/internal:config:scrape_configs:- job_name:'otel-collector'scrape_interval:10sstatic_configs:- targets:['0.0.0.0:8888']jaeger:protocols:grpc:thrift_binary:thrift_compact:thrift_http:zipkin:processors:batch:resourcedetection/system:detectors:[system]system:hostname_sources:[os]resourcedetection/ec2:detectors:[ec2]attributes/conf:actions:- key:participant.nameaction:insertvalue:"INSERT_YOUR_NAME_HERE"exporters:logging:verbosity:normalotlphttp/splunk:metrics_endpoint:https://ingest.${env:REALM}.signalfx.com/v2/datapoint/otlpheaders:X-SF-TOKEN:${env:ACCESS_TOKEN}service:pipelines:traces:receivers:[otlp, opencensus, jaeger, zipkin]processors:[batch]exporters:[logging]metrics:receivers:[otlp, opencensus, prometheus]processors:[batch]exporters:[logging]extensions:[health_check, pprof, zpages]
Of course, you can easily configure the metrics_endpoint to point to any other solution that supports the OTLP protocol.
Next, we need to enable the receivers, processors and exporters we have just configured in the service section of the config.yaml.
OpenTelemetry Collector Service
The Service section is used to configure what components are enabled in the Collector based on the configuration found in the receivers, processors, exporters, and extensions sections.
Info
If a component is configured, but not defined within the Service section then it is not enabled.
The service section consists of three sub-sections:
extensions
pipelines
telemetry
In the default configuration, the extension section has been configured to enable health_check, pprof and zpages, which we configured in the Extensions module earlier.
service:extensions:[health_check, pprof, zpages]
So lets configure our Metric Pipeline!
Subsections of OpenTelemetry Collector Service
OpenTelemetry Collector Service
Hostmetrics Receiver
If you recall from the Receivers portion of the workshop, we defined the Host Metrics Receiver to generate metrics about the host system, which are scraped from various sources. To enable the receiver, we must include the hostmetrics receiver in the metrics pipeline.
In the metrics pipeline, add hostmetrics to the metrics receivers section.
Earlier in the workshop, we also renamed the prometheus receiver to reflect that is was collecting metrics internal to the collector, renaming it to prometheus/internal.
We now need to enable the prometheus/internal receiver under the metrics pipeline. Update the receivers section to include prometheus/internal under the metrics pipeline:
We also added resourcedetection/system and resourcedetection/ec2 processors so that the collector can capture the instance hostname and AWS/EC2 metadata. We now need to enable these two processors under the metrics pipeline.
Update the processors section to include resourcedetection/system and resourcedetection/ec2 under the metrics pipeline:
Also in the Processors section of this workshop, we added the attributes/conf processor so that the collector will insert a new attribute called participant.name to all the metrics. We now need to enable this under the metrics pipeline.
Update the processors section to include attributes/conf under the metrics pipeline:
In the Exporters section of the workshop, we configured the otlphttp exporter to send metrics to Splunk Observability Cloud. We now need to enable this under the metrics pipeline.
Update the exporters section to include otlphttp/splunk under the metrics pipeline:
The collector captures internal signals about its behavior this also includes additional signals from running components.
The reason for this is that components that make decisions about the flow of data need a way to surface that information
as metrics or traces.
Why monitor the collector?
This is somewhat of a chicken and egg problem of, “Who is watching the watcher?”, but it is important that we can surface this information. Another interesting part of the collector’s history is that it existed before the Go metrics’ SDK was considered stable so the collector exposes a Prometheus endpoint to provide this functionality for the time being.
Considerations
Monitoring the internal usage of each running collector in your organization can contribute a significant amount of new Metric Time Series (MTS). The Splunk distribution has curated these metrics for you and would be able to help forecast the expected increases.
The Ninja Zone
To expose the internal observability of the collector, some additional settings can be adjusted:
service:telemetry:logs:level:<info|warn|error>development:<true|false>encoding:<console|json>disable_caller:<true|false>disable_stacktrace:<true|false>output_paths:[<stdout|stderr>, paths...]error_output_paths:[<stdout|stderr>, paths...]initial_fields:key:valuemetrics:level:<none|basic|normal|detailed># Address binds the promethues endpoint to scrapeaddress:<hostname:port>
extensions:health_check:endpoint:0.0.0.0:13133pprof:endpoint:0.0.0.0:1777zpages:endpoint:0.0.0.0:55679receivers:hostmetrics:collection_interval:10sscrapers:# CPU utilization metricscpu:# Disk I/O metricsdisk:# File System utilization metricsfilesystem:# Memory utilization metricsmemory:# Network interface I/O metrics & TCP connection metricsnetwork:# CPU load metricsload:# Paging/Swap space utilization and I/O metricspaging:# Process count metricsprocesses:# Per process CPU, Memory and Disk I/O metrics. Disabled by default.# process:otlp:protocols:grpc:http:opencensus:# Collect own metricsprometheus/internal:config:scrape_configs:- job_name:'otel-collector'scrape_interval:10sstatic_configs:- targets:['0.0.0.0:8888']jaeger:protocols:grpc:thrift_binary:thrift_compact:thrift_http:zipkin:processors:batch:resourcedetection/system:detectors:[system]system:hostname_sources:[os]resourcedetection/ec2:detectors:[ec2]attributes/conf:actions:- key:participant.nameaction:insertvalue:"INSERT_YOUR_NAME_HERE"exporters:logging:verbosity:normalotlphttp/splunk:metrics_endpoint:https://ingest.${env:REALM}.signalfx.com/v2/datapoint/otlpheaders:X-SF-TOKEN:${env:ACCESS_TOKEN}service:pipelines:traces:receivers:[otlp, opencensus, jaeger, zipkin]processors:[batch]exporters:[logging]metrics:receivers:[hostmetrics, otlp, opencensus, prometheus/internal]processors:[batch, resourcedetection/system, resourcedetection/ec2, attributes/conf] exporters:[logging, otlphttp/splunk]extensions:[health_check, pprof, zpages]
Tip
It is recommended that you validate your configuration file before restarting the collector. You can do this by using the built-in validate command:
Now that we have configured the OpenTelemetry Collector to send metrics to Splunk Observability Cloud, let’s take a look at the data in Splunk Observability Cloud. If you have not received an invite to Splunk Observability Cloud, your instructor will provide you with login credentials.
Before that, let’s make things a little more interesting and run a stress test on the instance. This in turn will light up the dashboards.
Once you are logged into Splunk Observability Cloud, using the left-hand navigation, navigate to Dashboards from the main menu. This will take you to the Teams view. At the top of this view click on All Dashboards :
In the search box, search for OTel Contrib:
Info
If the dashboard does not exist, then your instructor will be able to quickly add it. If you are not attending a Splunk hosted version of this workshop then the Dashboard Group to import can be found at the bottom of this page.
Click on the OTel Contrib Dashboard dashboard to open it:
Click in the Participant Name box, at the top of the dashboard, and select the name you configured for participant.name in the config.yaml in the drop-down list or start typing the name to search for it:
You can now see the host metrics for the host upon which you configured the OpenTelemetry Collector.
Building a component for the Open Telemetry Collector requires three key parts:
The Configuration - What values are exposed to the user to configure
The Factory - Make the component using the provided values
The Business Logic - What the component needs to do
For this, we will use the example of building a component that works with Jenkins so that we can track important DevOps metrics of our project(s).
The metrics we are looking to measure are:
Lead time for changes - “How long it takes for a commit to get into production”
Change failure rate - “The percentage of deployments causing a failure in production”
Deployment frequency - “How often a [team] successfully releases to production”
Mean time to recover - “How long does it take for a [team] to recover from a failure in production”
These indicators were identified Google’s DevOps Research and Assesment (DORA)[^1] team to help
show performance of a software development team. The reason for choosing Jenkins CI is that we remain in the same Open Source Software ecosystem which we can serve as the example for the vendor managed CI tools to adopt in future.
Instrument Vs Component
There is something to consider when improving level of Observability within your organisation
since there are some trade offs that get made.
Pros
Cons
(Auto) Instrumented
Does not require an external API to be monitored in order to observe the system.
Changing instrumentation requires changes to the project.
Gives system owners/developers to make changes in their observability.
Requires additional runtime dependancies.
Understands system context and can corrolate captured data with Exemplars.
Can impact performance of the system.
Component
- Changes to data names or semantics can be rolled out independently of the system’s release cycle.
Breaking API changes require a coordinated release between system and collector.
Updating/extending data collected is a seemless user facing change.
Captured data semantics can unexpectedly break that does not align with a new system release.
Does not require the supporting teams to have a deep understanding of observability practice.
Strictly external / exposed information can be surfaced from the system.
Subsections of OpenTelemetry Collector Development
OpenTelemetry Collector Development
Project Setup Ninja
Note
The time to finish this section of the workshop can vary depending on experience.
A complete solution can be found here in case you’re stuck or want to follow
along with the instructor.
To get started developing the new Jenkins CI receiver, we first need to set up a Golang project.
The steps to create your new Golang project is:
Create a new directory named ${HOME}/go/src/jenkinscireceiver and change into it
The actual directory name or location is not strict, you can choose your own development directory to make it in.
Initialize the golang module by going go mod init splunk.conf/workshop/example/jenkinscireceiver
This will create a file named go.mod which is used to track our direct and indirect dependencies
Eventually, there will be a go.sum which is the checksum value of the dependencies being imported.
module splunk.conf/workshop/example/jenkinscireceiver

go 1.20
OpenTelemetry Collector Development
Building The Configuration
The configuration portion of the component is how the user is able to have their inputs over the component,
so the values that is used for the configuration need to be:
Intuitive for users to understand what that field controls
Be explicit in what is required and what is optional
The bad configuration highlights how doing the opposite of the recommendations of configuration practices impacts the usability
of the component. It doesn’t make it clear what field values should be, it includes features that can be pushed to existing processors,
and the field naming is not consistent with other components that exist in the collector.
The good configuration keeps the required values simple, reuses field names from other components, and ensures the component focuses on
just the interaction between Jenkins and the collector.
The code tab shows how much is required to be added by us and what is already provided for us by shared libraries within the collector.
These will be explained in more detail once we get to the business logic. The configuration should start off small and will change
once the business logic has started to include additional features that is needed.
Write the code
In order to implement the code needed for the configuration, we are going to create a new file named config.go with the following content:
packagejenkinscireceiverimport("go.opentelemetry.io/collector/config/confighttp""go.opentelemetry.io/collector/receiver/scraperhelper""splunk.conf/workshop/example/jenkinscireceiver/internal/metadata")typeConfigstruct{// HTTPClientSettings contains all the values
// that are commonly shared across all HTTP interactions
// performed by the collector.
confighttp.HTTPClientSettings`mapstructure:",squash"`// ScraperControllerSettings will allow us to schedule
// how often to check for updates to builds.
scraperhelper.ScraperControllerSettings`mapstructure:",squash"`// MetricsBuilderConfig contains all the metrics
// that can be configured.
metadata.MetricsBuilderConfig`mapstructure:",squash"`}
OpenTelemetry Collector Development
Component Review
To recap the type of component we will need to capture metrics from Jenkins:
The business use case an extension helps solves for are:
Having shared functionality that requires runtime configuration
Indirectly helps with observing the runtime of the collector
This is commonly referred to pull vs push based data collection, and you read more about the details in the Receiver Overview.
The business use case a processor solves for is:
Adding or removing data, fields, or values
Observing and making decisions on the data
Buffering, queueing, and reordering
The thing to keep in mind is the data type flowing through a processor needs to forward
the same data type to its downstream components. Read through Processor Overview for the details.
The business use case an exporter solves for:
Send the data to a tool, service, or storage
The OpenTelemetry collector does not want to be “backend”, an all-in-one observability suite, but rather
keep to the principles that founded OpenTelemetry to begin with; A vendor agnostic Observability for all.
To help revisit the details, please read through Exporter Overview.
This is a component type that was missed in the workshop since it is a relatively new addition to the collector, but the best way to think about a connector is that it is like a processor that allows it to be used across different telemetry types and pipelines. Meaning that a connector can accept data as logs, and output metrics, or accept metrics from one pipeline and provide metrics on the data it has observed.
The business case that a connector solves for:
Converting from different telemetry types
logs to metrics
traces to metrics
metrics to logs
Observing incoming data and producing its own data
Accepting metrics and generating analytical metrics of the data.
There was a brief overview within the Ninja section as part of the Processor Overview,
and be sure what the project for updates for new connector components.
From the component overviews, it is clear that developing a pull-based receiver for Jenkins.
OpenTelemetry Collector Development
Designing The Metrics
To help define and export the metrics captured by our receiver, we will be using, mdatagen, a tool developed for the collector that turns YAML defined metrics into code.
---# Type defines the name to reference the component# in the configuration filetype:jenkins# Status defines the component type and the stability levelstatus:class:receiverstability:development:[metrics]# Attributes are the expected fields reported# with the exported values.attributes:job.name:description:The name of the associated Jenkins jobtype:stringjob.status:description:Shows if the job had passed, or failedtype:stringenum:- failed- success- unknown# Metrics defines all the pontentially exported values from this receiver. metrics:jenkins.jobs.count:enabled:truedescription:Provides a count of the total number of configured jobsunit:"{Count}"gauge:value_type:intjenkins.job.duration:enabled:truedescription:Show the duration of the jobunit:"s"gauge:value_type:intattributes:- job.name- job.statusjenkins.job.commit_delta:enabled:truedescription:The calculation difference of the time job was finished minus commit timestampunit:"s"gauge:value_type:intattributes:- job.name- job.status
// To generate the additional code needed to capture metrics,
// the following command to be run from the shell:
// go generate -x ./...
//go:generate go run github.com/open-telemetry/opentelemetry-collector-contrib/cmd/mdatagen@v0.80.0 metadata.yaml
packagejenkinscireceiver// There is no code defined within this file.
Create these files within the project folder before continuing onto the next section.
Building The Factory
The Factory is a software design pattern that effectively allows for an object, in this case a jenkinscireceiver, to be created dynamically with the provided configuration. To use a more real-world example, it would be going to a phone store, asking for a phone
that matches your exact description, and then providing it to you.
Run the following command go generate -x ./... , it will create a new folder, jenkinscireceiver/internal/metadata, that contains all code required to export the defined metrics. The required code is:
packagejenkinscireceiverimport("errors""go.opentelemetry.io/collector/component""go.opentelemetry.io/collector/config/confighttp""go.opentelemetry.io/collector/receiver""go.opentelemetry.io/collector/receiver/scraperhelper""splunk.conf/workshop/example/jenkinscireceiver/internal/metadata")funcNewFactory()receiver.Factory{returnreceiver.NewFactory(metadata.Type,newDefaultConfig,receiver.WithMetrics(newMetricsReceiver,metadata.MetricsStability),)}funcnewMetricsReceiver(_context.Context,setreceiver.CreateSettings,cfgcomponent.Config,consumerconsumer.Metrics)(receiver.Metrics,error){// Convert the configuration into the expected type
conf,ok:=cfg.(*Config)if!ok{returnnil,errors.New("can not convert config")}sc,err:=newScraper(conf,set)iferr!=nil{returnnil,err}returnscraperhelper.NewScraperControllerReceiver(&conf.ScraperControllerSettings,set,consumer,scraperhelper.AddScraper(sc),)}
packagejenkinscireceiverimport("go.opentelemetry.io/collector/config/confighttp""go.opentelemetry.io/collector/receiver/scraperhelper""splunk.conf/workshop/example/jenkinscireceiver/internal/metadata")typeConfigstruct{// HTTPClientSettings contains all the values
// that are commonly shared across all HTTP interactions
// performed by the collector.
confighttp.HTTPClientSettings`mapstructure:",squash"`// ScraperControllerSettings will allow us to schedule
// how often to check for updates to builds.
scraperhelper.ScraperControllerSettings`mapstructure:",squash"`// MetricsBuilderConfig contains all the metrics
// that can be configured.
metadata.MetricsBuilderConfig`mapstructure:",squash"`}funcnewDefaultConfig()component.Config{return&Config{ScraperControllerSettings:scraperhelper.NewDefaultScraperControllerSettings(metadata.Type),HTTPClientSettings:confighttp.NewDefaultHTTPClientSettings(),MetricsBuilderConfig:metadata.DefaultMetricsBuilderConfig(),}}
packagejenkinscireceivertypescraperstruct{}funcnewScraper(cfg*Config,setreceiver.CreateSettings)(scraperhelper.Scraper,error){// Create a our scraper with our values
s:=scraper{// To be filled in later
}returnscraperhelper.NewScraper(metadata.Type,s.scrape)}func(scraper)scrape(ctxcontext.Context)(pmetric.Metrics,error){// To be filled in
returnpmetrics.NewMetrics(),nil}
---dist:name:otelcoldescription:"Conf workshop collector"output_path:./distversion:v0.0.0-experimentalextensions:- gomod:github.com/open-telemetry/opentelemetry-collector-contrib/extension/basicauthextension v0.80.0- gomod:github.com/open-telemetry/opentelemetry-collector-contrib/extension/healthcheckextension v0.80.0receivers:- gomod:go.opentelemetry.io/collector/receiver/otlpreceiver v0.80.0- gomod:github.com/open-telemetry/opentelemetry-collector-contrib/receiver/jaegerreceiver v0.80.0- gomod:github.com/open-telemetry/opentelemetry-collector-contrib/receiver/prometheusreceiver v0.80.0- gomod:splunk.conf/workshop/example/jenkinscireceiver v0.0.0path:./jenkinscireceiverprocessors:- gomod:go.opentelemetry.io/collector/processor/batchprocessor v0.80.0exporters:- gomod:go.opentelemetry.io/collector/exporter/loggingexporter v0.80.0- gomod:go.opentelemetry.io/collector/exporter/otlpexporter v0.80.0- gomod:go.opentelemetry.io/collector/exporter/otlphttpexporter v0.80.0# This replace is a go directive that allows for redefine# where to fetch the code to use since the default would be from a remote project.replaces:- splunk.conf/workshop/example/jenkinscireceiver => ./jenkinscireceiver
Once you have written these files into the project with the expected contents run, go mod tidy, which will fetch all the remote dependencies and update go.mod and generate the go.sum files.
OpenTelemetry Collector Development
Building The Business Logic
At this point, we have a custom component that currently does nothing so we need to add in the required
logic to capture this data from Jenkins.
From this point, the steps that we need to take are:
Create a client that connect to Jenkins
Capture all the configured jobs
Report the status of the last build for the configured job
Calculate the time difference between commit timestamp and job completion.
The changes will be made to scraper.go.
To be able to connect to the Jenkins server, we will be using the package,
“github.com/yosida95/golang-jenkins”,
which provides the functionality required to read data from the jenkins server.
Then we are going to utilise some of the helper functions from the,
“go.opentelemetry.io/collector/receiver/scraperhelper” ,
library to create a start function so that we can connect to the Jenkins server once component has finished starting.
packagejenkinscireceiverimport("context"jenkins"github.com/yosida95/golang-jenkins""go.opentelemetry.io/collector/component""go.opentelemetry.io/collector/pdata/pmetric""go.opentelemetry.io/collector/receiver""go.opentelemetry.io/collector/receiver/scraperhelper""splunk.conf/workshop/example/jenkinscireceiver/internal/metadata")typescraperstruct{mb*metadata.MetricsBuilderclient*jenkins.Jenkins}funcnewScraper(cfg*Config,setreceiver.CreateSettings)(scraperhelper.Scraper,error){s:=&scraper{mb:metadata.NewMetricsBuilder(cfg.MetricsBuilderConfig,set),}returnscraperhelper.NewScraper(metadata.Type,s.scrape,scraperhelper.WithStart(func(ctxcontext.Context,hcomponent.Host)error{client,err:=cfg.ToClient(h,set.TelemetrySettings)iferr!=nil{returnerr}// The collector provides a means of injecting authentication
// on our behalf, so this will ignore the libraries approach
// and use the configured http client with authentication.
s.client=jenkins.NewJenkins(nil,cfg.Endpoint)s.client.SetHTTPClient(client)returnnil}),)}func(sscraper)scrape(ctxcontext.Context)(pmetric.Metrics,error){// To be filled in
returnpmetric.NewMetrics(),nil}
This finishes all the setup code that is required in order to initialise a Jenkins receiver.
From this point on, we will be focuses on the scrape method that has been waiting to be filled in.
This method will be run on each interval that is configured within the configuration (by default, every minute).
The reason we want to capture the number of jobs configured so we can see the growth of our Jenkins server,
and measure of many projects have onboarded. To do this we will call the jenkins client to list all jobs,
and if it reports an error, return that with no metrics, otherwise, emit the data from the metric builder.
func(sscraper)scrape(ctxcontext.Context)(pmetric.Metrics,error){jobs,err:=s.client.GetJobs()iferr!=nil{returnpmetric.Metrics{},err}// Recording the timestamp to ensure
// all captured data points within this scrape have the same value.
now:=pcommon.NewTimestampFromTime(time.Now())// Casting to an int64 to match the expected type
s.mb.RecordJenkinsJobsCountDataPoint(now,int64(len(jobs)))// To be filled in
returns.mb.Emit(),nil}
In the last step, we were able to capture all jobs ands report the number of jobs
there was. Within this step, we are going to examine each job and use the report values
to capture metrics.
func(sscraper)scrape(ctxcontext.Context)(pmetric.Metrics,error){jobs,err:=s.client.GetJobs()iferr!=nil{returnpmetric.Metrics{},err}// Recording the timestamp to ensure
// all captured data points within this scrape have the same value.
now:=pcommon.NewTimestampFromTime(time.Now())// Casting to an int64 to match the expected type
s.mb.RecordJenkinsJobsCountDataPoint(now,int64(len(jobs)))for_,job:=rangejobs{// Ensure we have valid results to start off with
var(build=job.LastCompletedBuildstatus=metadata.AttributeJobStatusUnknown)// This will check the result of the job, however,
// since the only defined attributes are
// `success`, `failure`, and `unknown`.
// it is assume that anything did not finish
// with a success or failure to be an unknown status.
switchbuild.Result{case"aborted","not_built","unstable":status=metadata.AttributeJobStatusUnknowncase"success":status=metadata.AttributeJobStatusSuccesscase"failure":status=metadata.AttributeJobStatusFailed}s.mb.RecordJenkinsJobDurationDataPoint(now,int64(job.LastCompletedBuild.Duration),job.Name,status,)}returns.mb.Emit(),nil}
The final step is to calculate how long it took from
commit to job completion to help infer our DORA metrics.
func(sscraper)scrape(ctxcontext.Context)(pmetric.Metrics,error){jobs,err:=s.client.GetJobs()iferr!=nil{returnpmetric.Metrics{},err}// Recording the timestamp to ensure
// all captured data points within this scrape have the same value.
now:=pcommon.NewTimestampFromTime(time.Now())// Casting to an int64 to match the expected type
s.mb.RecordJenkinsJobsCountDataPoint(now,int64(len(jobs)))for_,job:=rangejobs{// Ensure we have valid results to start off with
var(build=job.LastCompletedBuildstatus=metadata.AttributeJobStatusUnknown)// Previous step here
// Ensure that the `ChangeSet` has values
// set so there is a valid value for us to reference
iflen(build.ChangeSet.Items)==0{continue}// Making the assumption that the first changeset
// item is the most recent change.
change:=build.ChangeSet.Items[0]// Record the difference from the build time
// compared against the change timestamp.
s.mb.RecordJenkinsJobCommitDeltaDataPoint(now,int64(build.Timestamp-change.Timestamp),job.Name,status,)}returns.mb.Emit(),nil}
Once all of these steps have been completed, you now have built a custom Jenkins CI receiver!
Whats next?
There are more than likely features that would be desired from component that you can think of, like:
Can I include the branch name that the job used?
Can I include the project name for the job?
How I calculate the collective job durations for project?
How do I validate the changes work?
Please take this time to play around, break it, change things around, or even try to capture logs from the builds.
Splunk Synthetic Scripting
45 minutesAuthor
Robert Castley
Proactively monitor the performance of your web app before problems affect your users. With Splunk Synthetic Monitoring, technical and business teams create detailed tests to proactively monitor the speed and reliability of websites, web apps, and resources over time, at any stage in the development cycle.
Splunk Synthetic Monitoring offers the most comprehensive and in-depth capabilities for uptime and web performance optimization as part of the only complete observability suite, Splunk Observability Cloud.
Easily set up monitoring for APIs, service endpoints and end-user experience. With Splunk Synthetic Monitoring, go beyond basic uptime and performance monitoring and focus on proactively finding and fixing issues, optimizing web performance, and ensuring customers get the best user experience.
With Splunk Synthetic Monitoring you can:
Detect and resolve issues fast across critical user flows, business transactions and API endpoints
Prevent web performance issues from affecting customers with an intelligent web optimization engine
And improve the performance of all page resources and third-party dependencies
Subsections of Splunk Synthetic Scripting
1. Real Browser Test
Introduction
This workshop walks you through using the Chrome DevTools Recorder to create a synthetic transaction against a Splunk demonstration instance.
The exported JSON from the Chrome DevTools Recorder will then be used to create a Splunk Synthetic Monitoring Real Browser Test.
In addition, you will also get to learn other Splunk Synthetic Monitoring checks like API Test and Uptime Test.
Pre-requisites
Google Chrome Browser installed
Access to Splunk Observability Cloud
Subsections of 1. Real Browser Test
1.1 Recording a test
Open the starting URL
Open the starting URL for the workshop in Chrome. Click on the appropriate link below to open the site in a new tab.
Note
The starting URL for the workshop is different for EMEA and AMER/APAC. Please use the correct URL for your region.
Next, open the Developer Tools (in the new tab that was opened above) by pressing Ctrl + Shift + I on Windows or Cmd + Option + I on a Mac, then select Recorder from the top-level menu or the More tools flyout menu.
Note
Site elements might change depending on viewport width. Before recording, set your browser window to the correct width for the test you want to create (Desktop, Tablet, or Mobile). Change the DevTools “dock side” to pop out as a separate window if it helps.
Create a new recording
With the Recorder panel open in the DevTools window. Click on the Create a new recording button to start.
For the Recording Name use your initials to prefix the name of the recording e.g. <your initials> - Online Boutique. Click on Start Recording to start recording your actions.
Now that we are recording, complete the following actions on the site:
Click on Vintage Camera Lens
Click on Add to Cart
Click on Place Order
Click on End recording in the Recorder panel.
Exporting the recording
Click on the Export button:
Select JSON as the format, then click on Save
Congratulations! You have successfully created a recording using the Chrome DevTools Recorder. Next, we will use this recording to create a Real Browser Test in Splunk Synthetic Monitoring.
{"title":"RWC - Online Boutique","steps":[{"type":"setViewport","width":1430,"height":1016,"deviceScaleFactor":1,"isMobile":false,"hasTouch":false,"isLandscape":false},{"type":"navigate","url":"https://online-boutique-eu.splunko11y.com/","assertedEvents":[{"type":"navigation","url":"https://online-boutique-eu.splunko11y.com/","title":"Online Boutique"}]},{"type":"click","target":"main","selectors":[["div:nth-of-type(2) > div:nth-of-type(2) a > div"],["xpath//html/body/main/div/div/div[2]/div[2]/div/a/div"],["pierce/div:nth-of-type(2) > div:nth-of-type(2) a > div"]],"offsetY":170,"offsetX":180,"assertedEvents":[{"type":"navigation","url":"https://online-boutique-eu.splunko11y.com/product/66VCHSJNUP","title":""}]},{"type":"click","target":"main","selectors":[["aria/ADD TO CART"],["button"],["xpath//html/body/main/div[1]/div/div[2]/div/form/div/button"],["pierce/button"],["text/Add to Cart"]],"offsetY":35.0078125,"offsetX":46.4140625,"assertedEvents":[{"type":"navigation","url":"https://online-boutique-eu.splunko11y.com/cart","title":""}]},{"type":"click","target":"main","selectors":[["aria/PLACE ORDER"],["div > div > div.py-3 button"],["xpath//html/body/main/div/div/div[4]/div/form/div[4]/button"],["pierce/div > div > div.py-3 button"],["text/Place order"]],"offsetY":29.8125,"offsetX":66.8203125,"assertedEvents":[{"type":"navigation","url":"https://online-boutique-eu.splunko11y.com/cart/checkout","title":""}]}]}
1.2 Create Real Browser Test
In Splunk Observability Cloud, navigate to Synthetics and click on Add new test.
From the dropdown select Browser test.
You will then be presented with the Browser test content configuration page.
1.3 Import JSON
To begin configuring our test, we need to import the JSON that we exported from the Chrome DevTools Recorder. To enable the Import button, we must first give our test a name e.g. <your initials> - Online Boutique.
Once the Import button is enabled, click on it and either drop the JSON file that you exported from the Chrome DevTools Recorder or upload the file.
Once the JSON file has been uploaded, click on Continue to edit steps
Before we make any edits to the test, let’s first configure the settings, click on < Return to test
1.4 Settings
The simple settings allow you to configure the basics of the test:
Name: The name of the test (e.g. RWC - Online Boutique).
Details:
Locations: The locations where the test will run from.
Device: Emulate different devices and connection speeds. Also, the viewport will be adjusted to match the chosen device.
Frequency: How often the test will run.
Round-robin: If multiple locations are selected, the test will run from one location at a time, rather than all locations at once.
Active: Set the test to active or inactive.
![Return to Test]For this workshop, we will configure the locations that we wish to monitor from. Click in the Locations field and you will be presented with a list of global locations (over 50 in total).
Select the following locations:
AWS - N. Virginia
AWS - London
AWS - Melbourne
Once complete, scroll down and click on Click on Submit to save the test.
The test will now be scheduled to run every 5 minutes from the 3 locations that we have selected. This does take a few minutes for the schedule to be created.
So whilst we wait for the test to be scheduled, click on Edit test so we can go through the Advanced settings.
1.5 Advanced Settings
Click on Advanced, these settings are optional and can be used to further configure the test.
Note
In the case of this workshop, we will not be using any of these settings as this is for informational purposes only.
Security:
TLS/SSL validation: When activated, this feature is used to enforce the validation of expired, invalid hostname, or untrusted issuer on SSL/TLS certificates.
Authentication: Add credentials to authenticate with sites that require additional security protocols, for example from within a corporate network. By using concealed global variables in the Authentication field, you create an additional layer of security for your credentials and simplify the ability to share credentials across checks.
Custom Content:
Custom headers: Specify custom headers to send with each request. For example, you can add a header in your request to filter out requests from analytics on the back end by sending a specific header in the requests. You can also use custom headers to set cookies.
Cookies: Set cookies in the browser before the test starts. For example, to prevent a popup modal from randomly appearing and interfering with your test, you can set cookies. Any cookies that are set will apply to the domain of the starting URL of the check. Splunk Synthetics Monitoring uses the public suffix list to determine the domain.
Host overrides: Add host override rules to reroute requests from one host to another. For example, you can create a host override to test an existing production site against page resources loaded from a development site or a specific CDN edge node.
Next, we will edit the test steps to provide more meaningful names for each step.
1.6 Edit test steps
To edit the steps click on the + Edit steps or synthetic transactions button. From here, we are going to give meaningful names to each step.
For each of the four steps, we are going to give them a meaningful name.
Step 1 replace the text Go to URL with HomePage - Online Boutique
Step 2 enter the text Select Vintage Camera Lens.
Step 3 enter Add to Cart.
Step 4 enter Place Order.
Click < Return to test to return to the test configuration page and click Save to save the test.
You will be returned to the test dashboard where you will see test results start to appear.
Congratulations! You have successfully created a Real Browser Test in Splunk Synthetic Monitoring. Next, we will look into a test result in more detail.
1.7 View test results
In the Scatterplot from the previous step, click on one of the dots to drill into the test run data. Preferably, select the most recent test run (farthest to the right).
API Test
The API Test provides a flexible way to check the functionality and performance of API endpoints. The shift toward API-first development has magnified the necessity to monitor the back-end services that provide your core front-end functionality.
Whether you’re interested in testing the multi-step API interactions or you want to gain visibility into the performance of your endpoints, the API Test can help you accomplish your goals.
Subsections of API Test
Global Variables
Global Variables
View the global variable that we’ll use to perform our API test. Click on Global Variables under the cog. The global variable named env.encoded_auth will be the one that we’ll use to build the spotify API transaction.
Create new API test
Create a new API test
Create a new API test by clicking on the Add new test button and select API test from the dropdown. Name the test using your initials followed by Spotify API e.g. RWC - Spotify API
Authentication Request
Add Authentication Request
Click on + Add requests and enter the request step name e.g. Authenticate with Spotify API.
Expand the Request section, from the drop-down change the request method to POST and enter the following URL:
https://accounts.spotify.com/api/token
In the Payload body section enter the following:
grant_type=client_credentials
Next, add two request headers with the following key/value pairings:
CONTENT-TYPE: application/x-www-form-urlencoded
AUTHORIZATION: Basic {{env.encoded_auth}}
Expand the Validation section and add the following extraction:
Extract from Response bodyJSON$.access_tokenasaccess_token.
This will parse the JSON payload that is received from the Spotify API, extract the access token and store it as a custom variable.
Search Request
Add Search Request
Click on + Add Request to add the next step. Name the step Search for Tracks named “Up around the bend”.
Expand the Request section and change the request method to GET and enter the following URL: