Application Performance Monitoring Overview

5 minutes  

Splunk APM provides a NoSample™ end-to-end visibility of every service and its dependency to solve problems quicker across monoliths and microservices. Teams can immediately detect problems from new deployments, confidently troubleshoot by scoping and isolating the source of an issue, and optimize service performance by understanding how back-end services impact end users and business workflows.

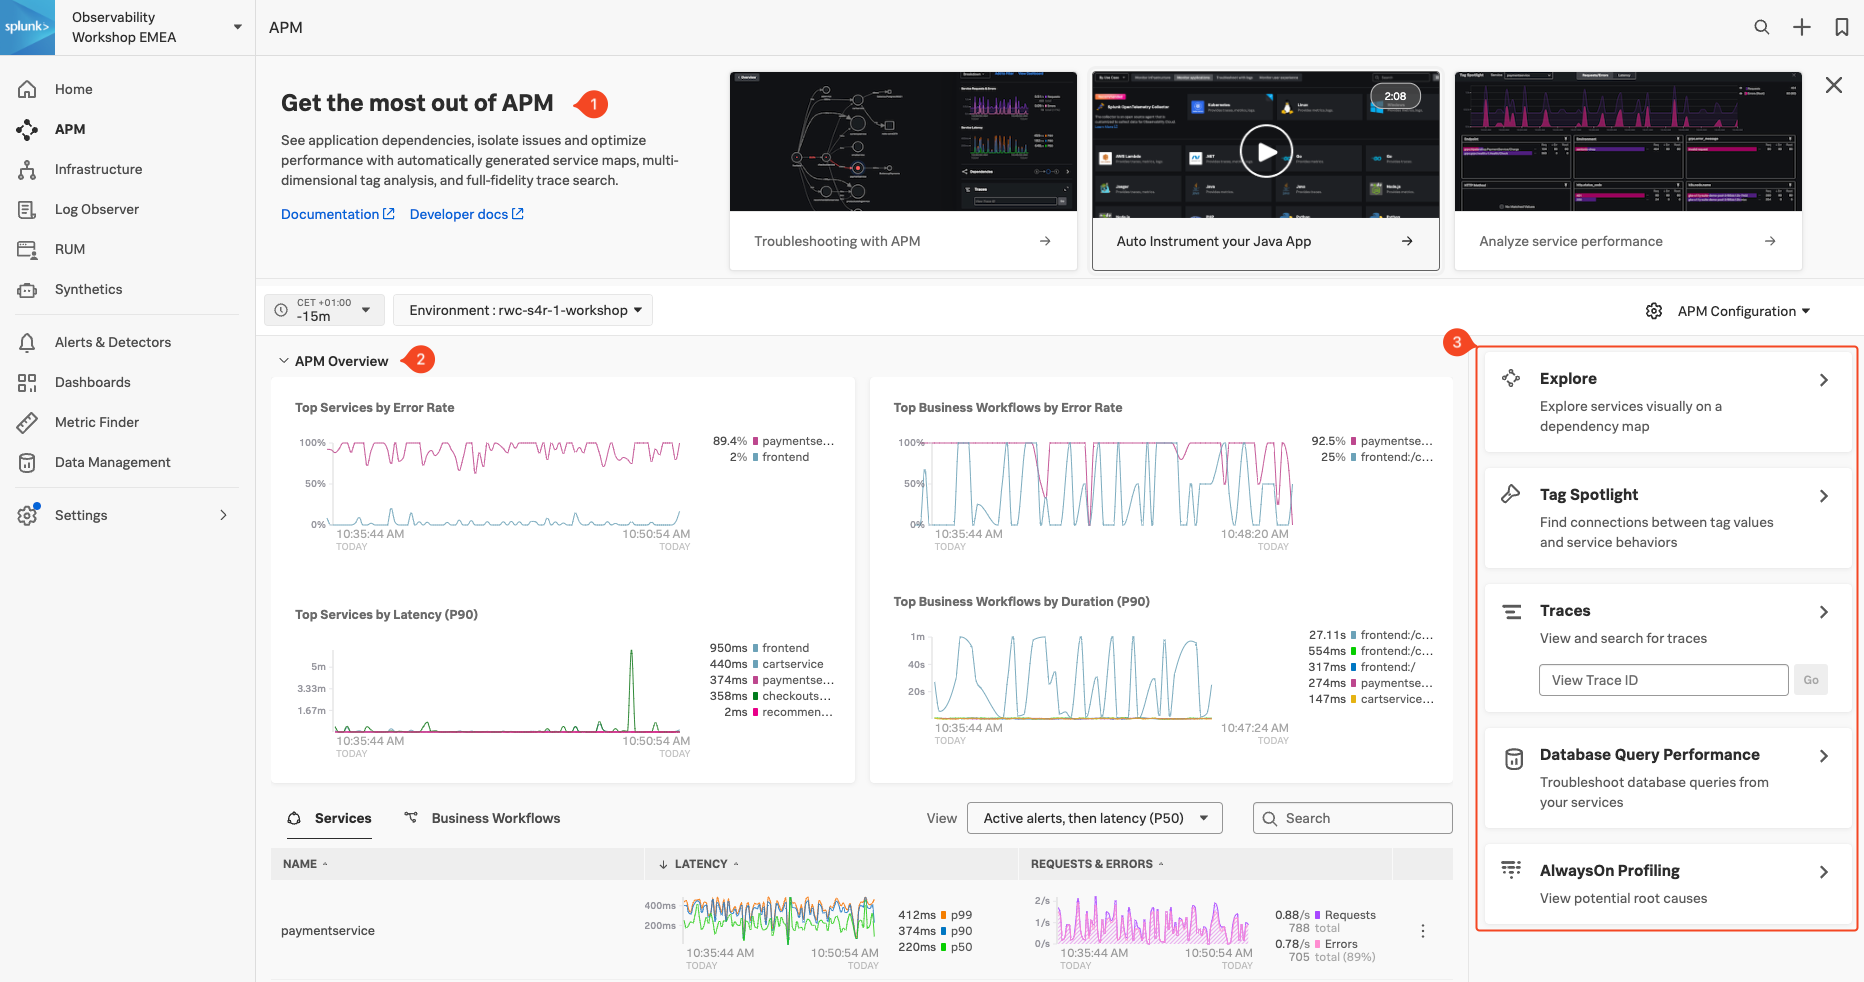
Real-time monitoring and alerting: Splunk provides out-of-the-box service dashboards and automatically detects and alerts on RED metrics (rate, error and duration) when there is a sudden change. 
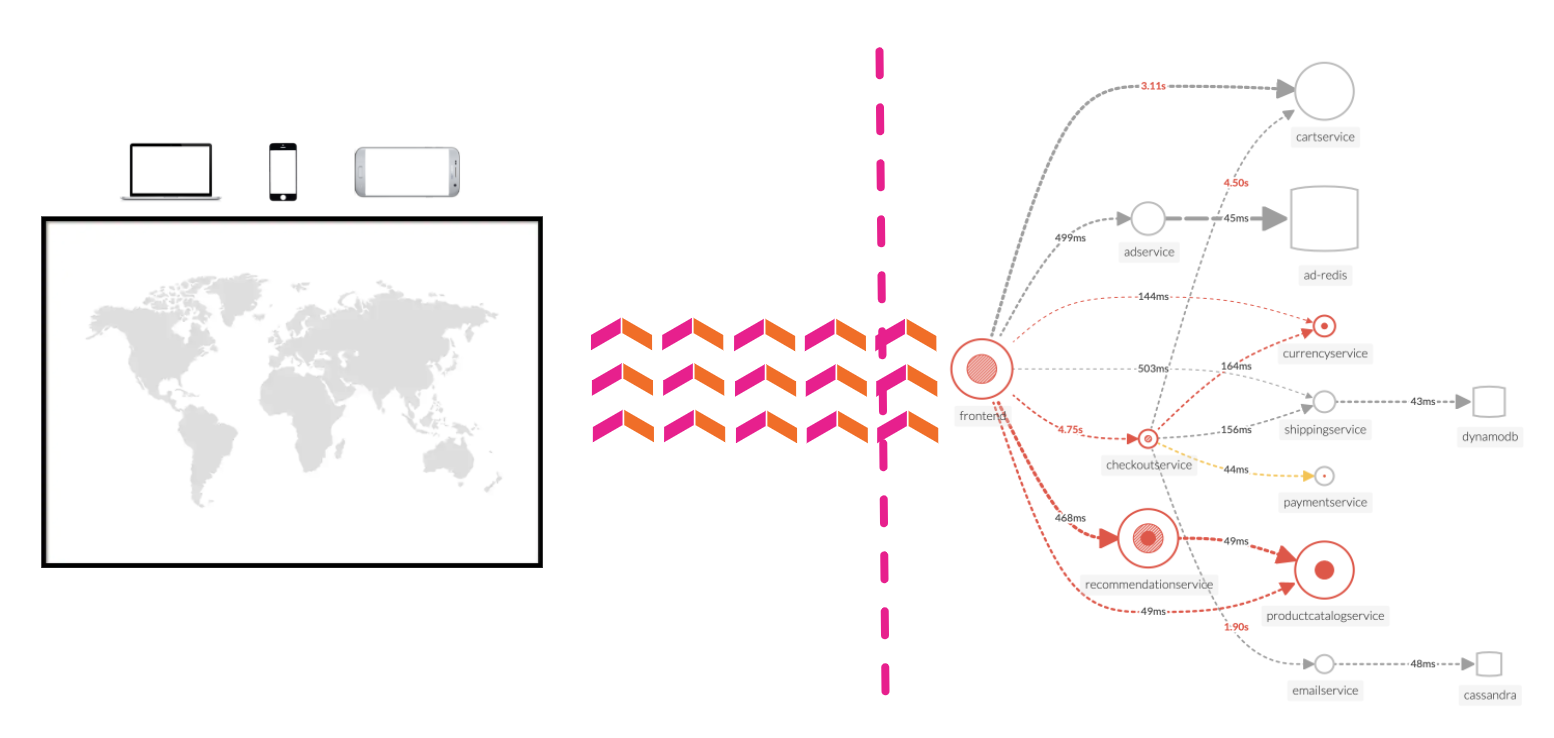
Dynamic telemetry maps: Easily visualize service performance in modern production environments in real-time. End-to-end visibility of service performance from infrastructure, applications, end users, and all dependencies helps quickly scope new issues and troubleshoot more effectively.
Intelligent tagging and analysis: View all tags from your business, infrastructure and applications in one place to easily compare new trends in latency or errors to their specific tag values.
AI-directed troubleshooting identifies the most impactful issues: Instead of manually digging through individual dashboards, isolate problems more efficiently. Automatically identify anomalies and the sources of errors that impact services and customers the most.
Complete distributed tracing analyses every transaction: Identify problems in your cloud-native environment more effectively. Splunk distributed tracing visualizes and correlates every transaction from the back-end and front-end in context with your infrastructure, business workflows and applications.
Full stack correlation: Within Splunk Observability, APM links traces, metrics, logs and profiling together to easily understand the performance of every component and its dependency across your stack.
Monitor database query performance: Easily identify how slow and high execution queries from SQL and NoSQL databases impact your services, endpoints and business workflows — no instrumentation required.

Architecture Overview Architecture Overview

Last Modified Mar 22, 2024

Subsections of Application Performance Monitoring Overview

Application Performance Monitoring Home page

Click APM in the main menu, the APM Home Page is made up of 3 distinct sections:

APM page APM page

  1. Onboarding Pane Pane: Training videos and links to documentation to get you started with Splunk APM.
  2. APM Overview Pane: Real-time metrics for the Top Services and Top Business Workflows.
  3. Functions Pane: Links for deeper analysis of your services, tags, traces, database query performance and code profiling.

The APM Overview pan provides a high-level view of the health of your application. It includes a summary of the services, latency and errors in your application. It also includes a list of the top services by error rate and the top business workflows by error rate (a business workflow is the start-to-finish journey of the collection of traces associated with a given activity or transaction and enables monitoring of end-to-end KPIs and identifying root causes and bottlenecks).

About Environments

To easily differentiate between multiple applications, Splunk uses environments. The naming convention for workshop environments is [NAME OF WORKSHOP]-workshop. Your instructor will provide you with the correct one to select.

Exercise
  • Verify that the time window we are working with is set to the last 15 minutes (-15m).
  • Change the environment to the workshop one by selecting its name from the drop-down box and make sure that is the only one selected.

What can you conclude from the Top Services by Error Rate chart?

The paymentservice has a high error rate

If you scroll down the Overview Page you will notice some services listed have Inferred Service next to them.

Splunk APM can infer the presence of the remote service, or inferred service if the span calling the remote service has the necessary information. Examples of possible inferred services include databases, HTTP endpoints, and message queues. Inferred services are not instrumented, but they are displayed on the service map and the service list.

Next, let’s check out Splunk Log Observer (LO).