Splunk RUM

15 minutes  
Persona

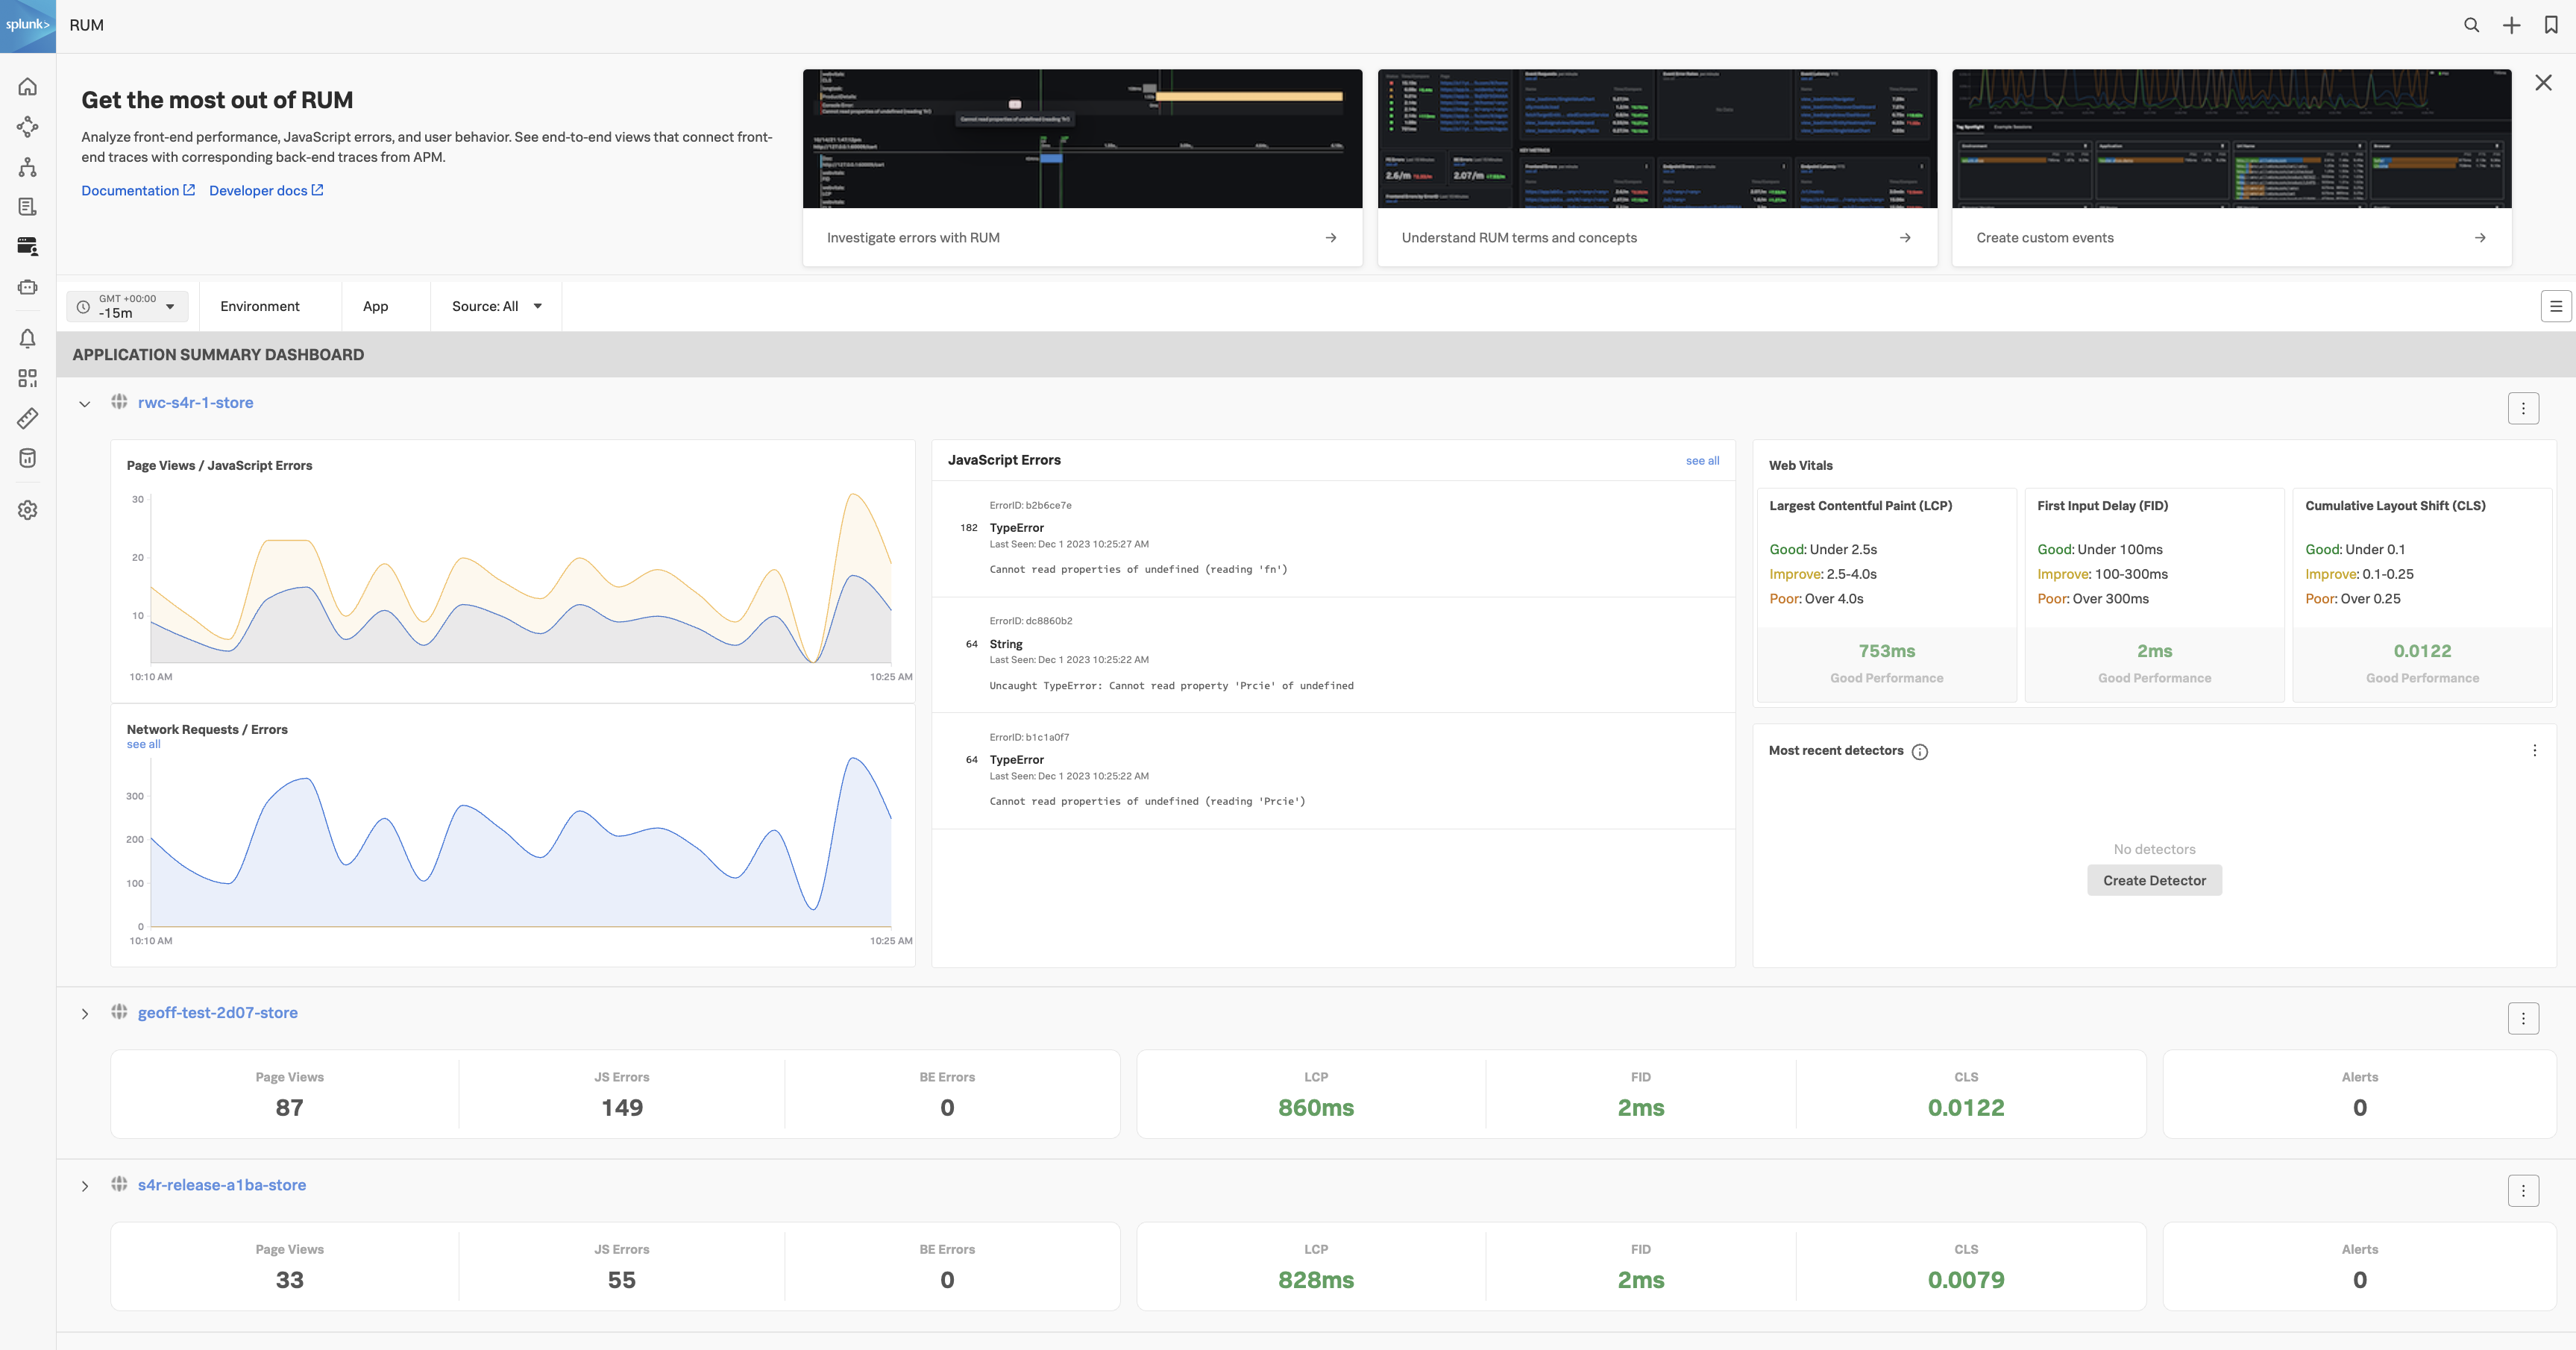
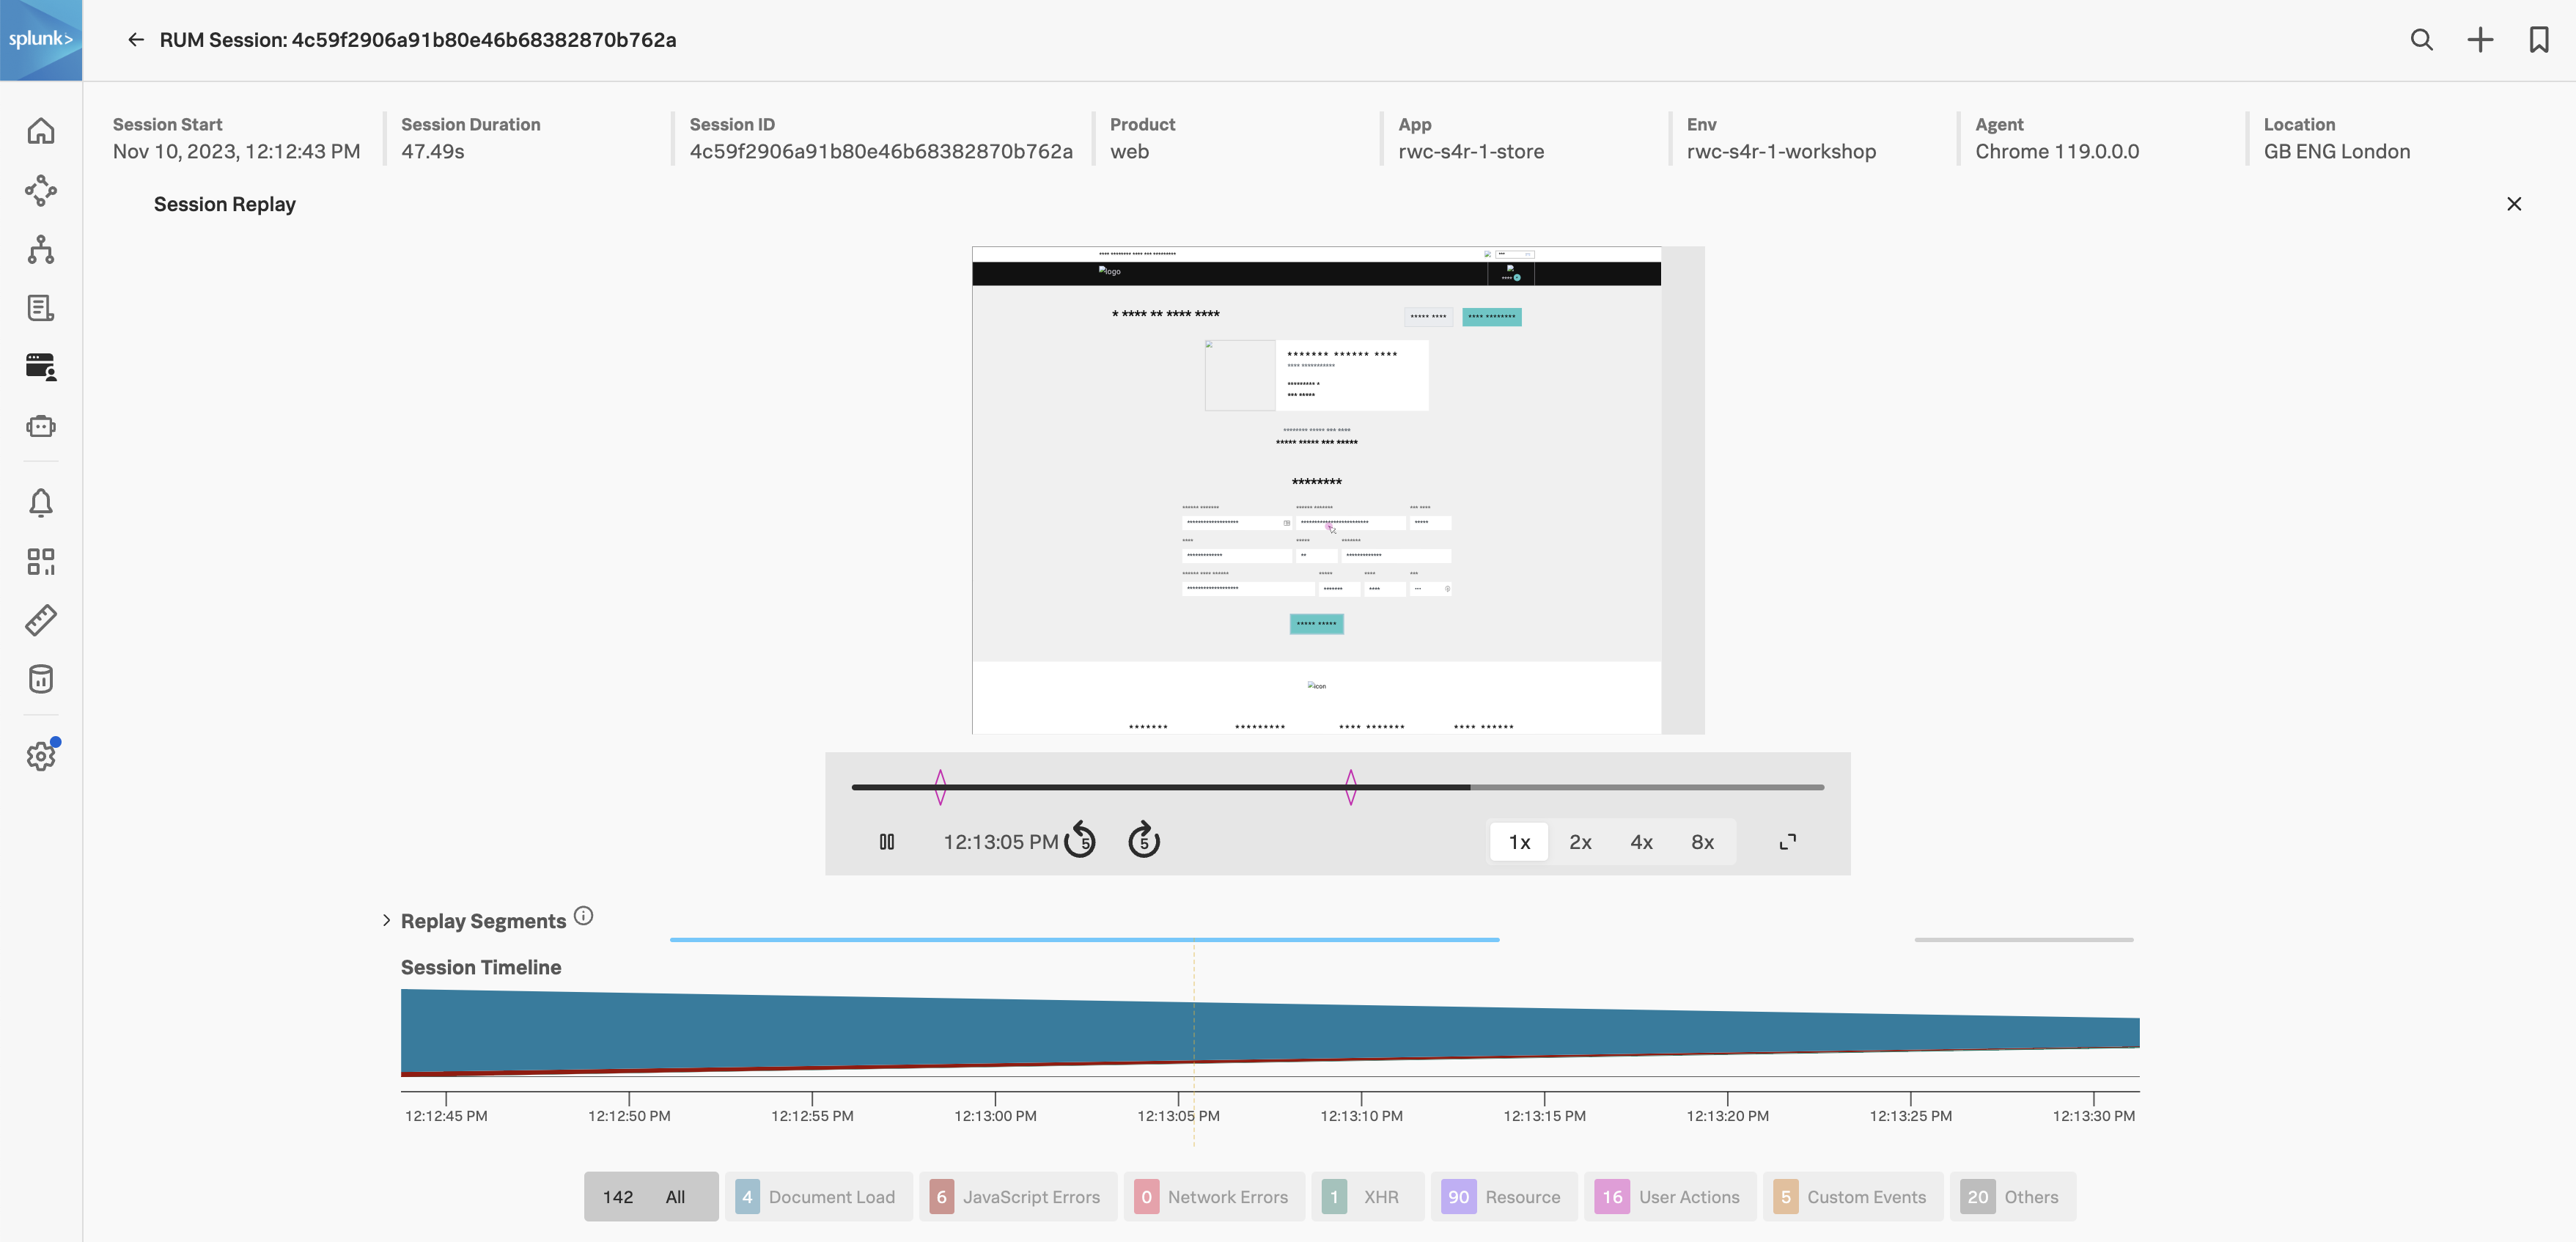
You are a frontend engineer, or an SRE tasked to do the first triage of a performance issue. You have been asked to investigate a potential customer satisfaction issue with the Online Boutique application.

We are going to examine the real user data that has been provided by the telemetry received from all participants’ browser sessions. The goal is to find a browser, mobile or tablet session that performed poorly and begin the troubleshooting process.

Last Modified Apr 3, 2024

Subsections of Splunk RUM

1. RUM Dashboard

In Splunk Observability Cloud from the main menu, click on RUM. you arrive at the RUM Home page, this view has already been covered in the short introduction earlier.

multiple apps multiple apps

Exercise
  • Make sure you select your workshop by ensuring the drop-downs are set/selected as follows:
    • The Time frame is set to -15m.
    • The Environment selected is [NAME OF WORKSHOP]-workshop.
    • The App selected is [NAME OF WORKSHOP]-store.
    • The Source is set to All.
  • Next, click on the [NAME OF WORKSHOP]-store above the Page Views / JavaScript Errors chart.
  • This will bring up a new dashboard view breaking down the metrics by UX Metrics, Front-end Health, Back-end Health and Custom Events and comparing them to historic metrics (1 hour by default).

RUM Dashboard RUM Dashboard

  • UX Metrics: Page Views, Page Load and Web Vitals metrics.
  • Front-end Health: Breakdown of Javascript Errors and Long Task duration and count.
  • Back-end Health: Network Errors and Requests and Time to First Byte.
  • Custom Events: RED metrics (Rate, Error & Duration) for custom events.
Exercise
  • Click through each of the tabs (UX Metrics, Front-end Health, Back-end Health and Custom Events) and examine the data.

If you examine the charts in the Custom Events Tab, what chart shows clearly the latency Spikes?

It is the Custom Event Latency chart

Last Modified Dec 4, 2023

2. Tag Spotlight

Exercise
  • Make sure you are on the Custom Events tab by selecting it.

  • Have a look at the Custom Event Latency chart. The metrics shown here show the application latency. The comparison metrics to the side show the latency compared to 1 hour ago (which is selected in the top filter bar).

  • Click on the see all link under the chart title.

RUM Tag Spotlight RUM Tag Spotlight

In this dashboard view, you are presented with all the tags associated with the RUM data. Tags are key-value pairs that are used to identify the data. In this case, the tags are automatically generated by the OpenTelemetry instrumentation. The tags are used to filter the data and to create the charts and tables. The Tag Spotlight view allows you to drill down into a user session.

Exercise
  • Change the timeframe to Last 1 hour.
  • Click Add Filters, select OS Version, click != and select Synthetics and RUMLoadGen then click the Apply Filter button.
  • Find the Custom Event Name chart, locate PlaceOrder in the list, click on it and select Add to filter.
  • Notice the large spikes in the graph across the top.
  • Click on the User Sessions tab.
  • Click on the Duration heading twice to sort the sessions by duration (longest at the top).
  • Click on the above the table and select Sf Geo City from the list of additional columns and click Save

We now have a User Session table that is sorted by longest duration descending and includes the cities of all the users that have been shopping on the site. We could apply more filters to further narrow down the data e.g. OS version, browser version, etc.

RUM Tag Spotlight RUM Tag Spotlight

Last Modified Dec 4, 2023

3. Session Replay

Sessions

A session is a collection of traces that correspond to the actions a single user takes when interacting with an application. By default, a session lasts until 15 minutes have passed from the last event captured in the session. The maximum session duration is 4 hours.

Exercise
  • In the User Sessions table, click on the top Session ID with the longest Duration (over 20 seconds or longer), this will take you to the RUM Session view.

RUM Session RUM Session

Exercise
  • Click the RUM Session Replay Replay button. RUM Session Replay allows you to replay and see the user session. This is a great way to see exactly what the user experienced.
  • Click the button to start the replay.

RUM Session RUM Session

RUM Session Replay can redact information, by default text is redacted. You can also redact images (which has been done for this workshop example). This is useful if you are replaying a session that contains sensitive information. You can also change the playback speed and pause the replay.

Tip

When playing back the session, notice how the mouse movements are captured. This is useful to see where the user is focusing their attention.

Last Modified Dec 4, 2023

4. User Sessions

Exercise
  • Close the RUM Session Replay by clicking on the X in the top right corner. We had set a filter on PlaceOrder in the previous exercise. It should be selected here as well, as shown in the screenshot below (1).
  • Note the length of the span, this is the time it took to complete the order, not good!
  • Scroll down the page and you will see the Tags metadata (which is used in Tag Spotlight). After the tags, we come to the waterfall which shows the page objects that have been loaded (HTML, CSS, images, JavaScript etc.)
  • Keep scrolling down the page until you come to a blue APM link (the one with /cart/checkout at the end of the URL) and hover over it.

RUM Session RUM Session

This brings up the APM Performance Summary. Having this end-to-end (RUM to APM) view is very useful when troubleshooting issues.

Exercise
  • You will see paymentservice (2) and checkoutservice (3) are in an error state as per the screenshot above.
  • Under Workflow Name click on front-end:/cart/checkout, this will bring up the APM Service Map.

RUM to APM RUM to APM