Splunk Log Observer

20 minutes  
Persona

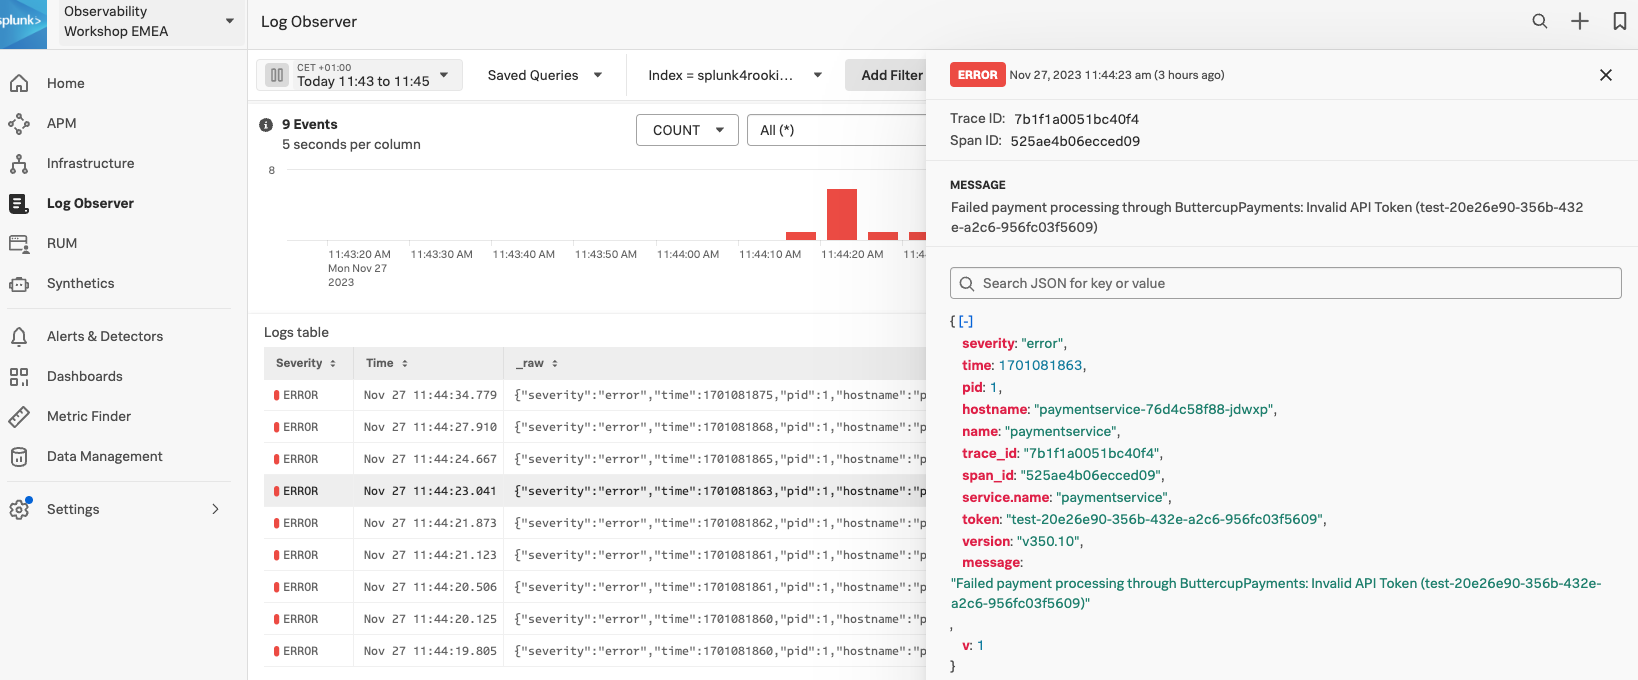
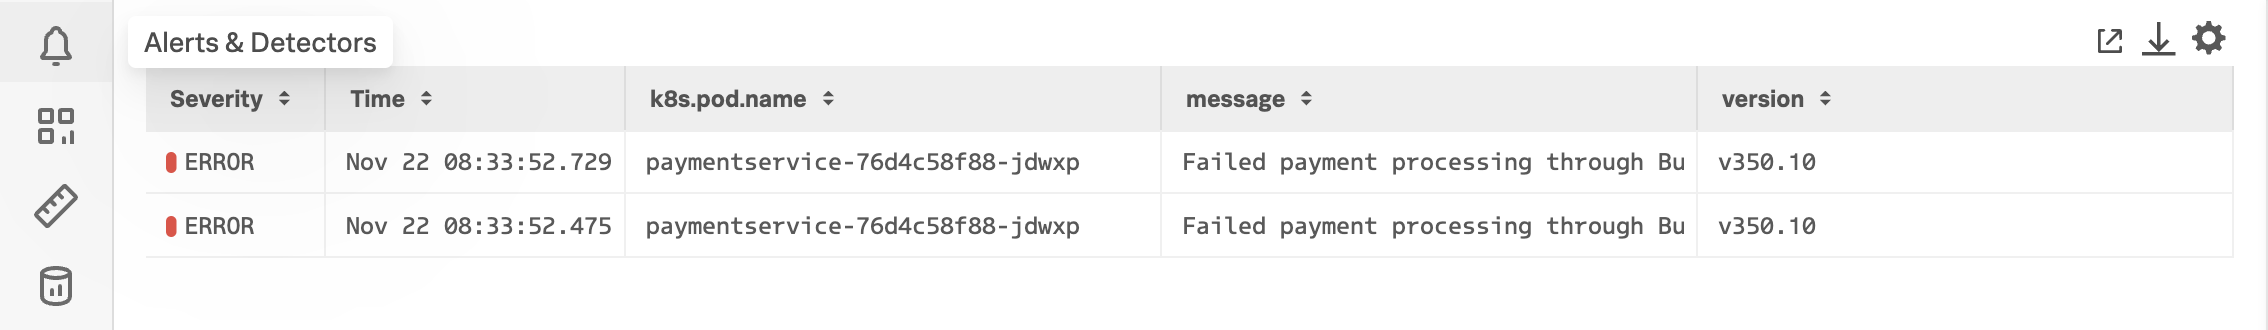
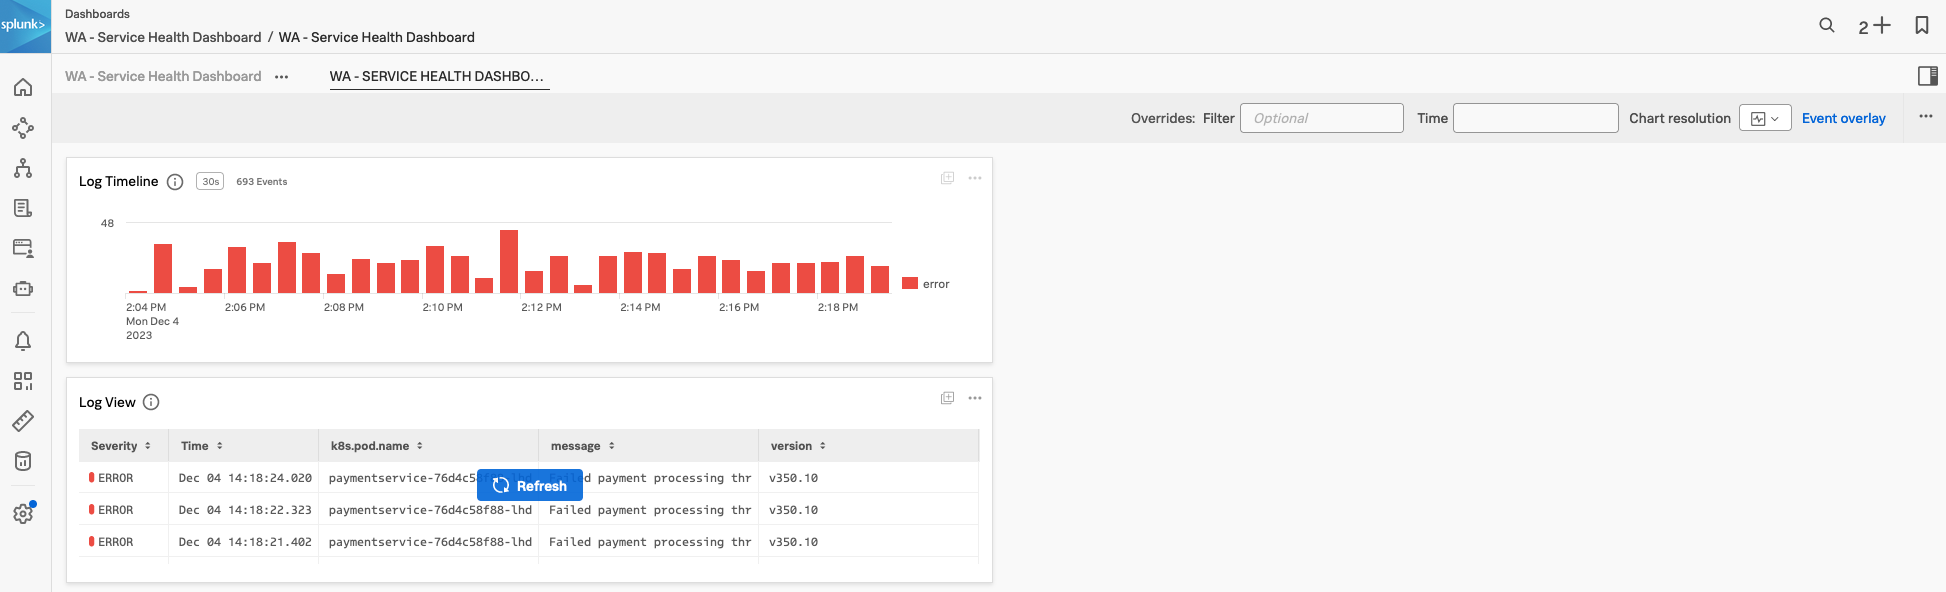
Remaining in your back-end developer role, you need to inspect the logs from your application to determine the root cause of the issue.

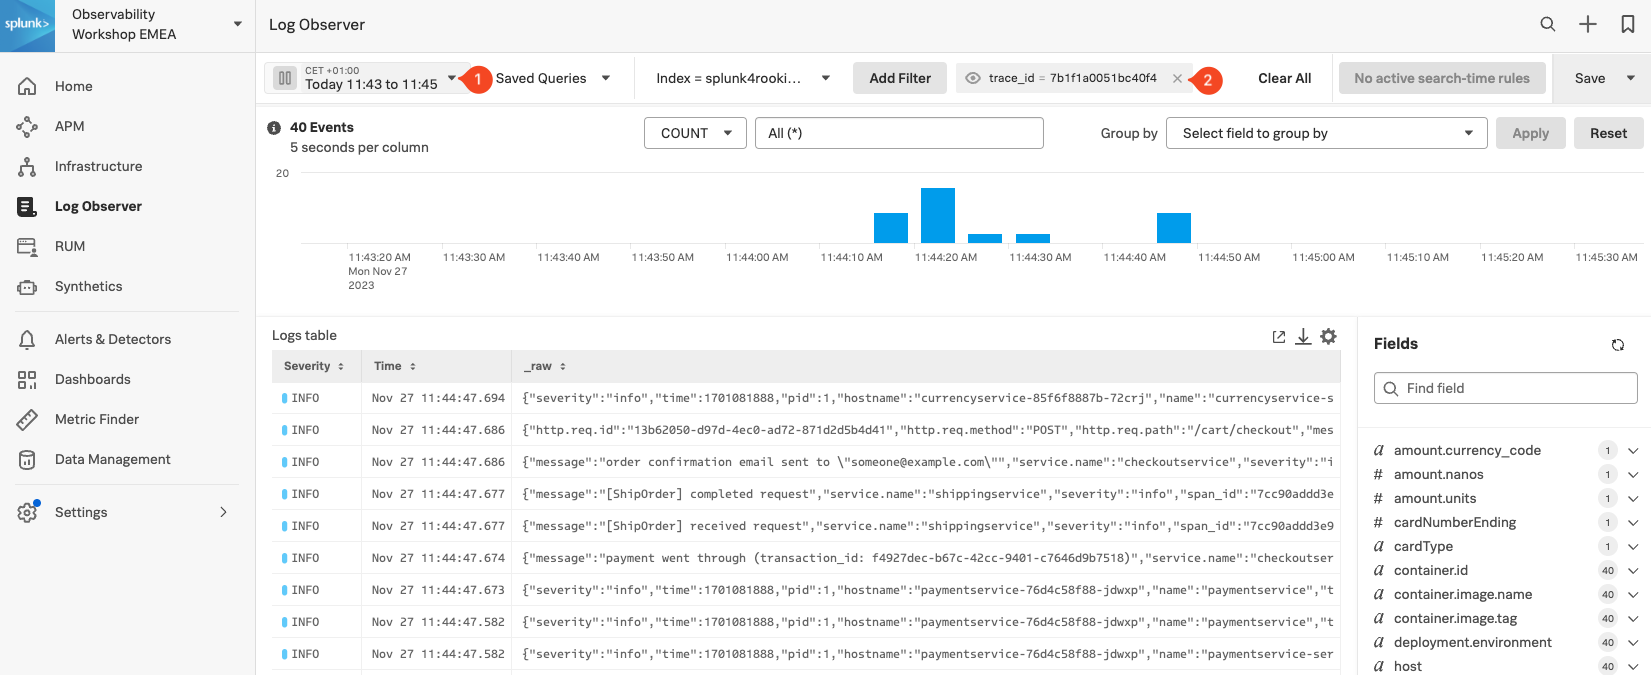
Using the content related to the APM trace (logs) we will now use Splunk Log Observer to drill down further to understand exactly what the problem is.

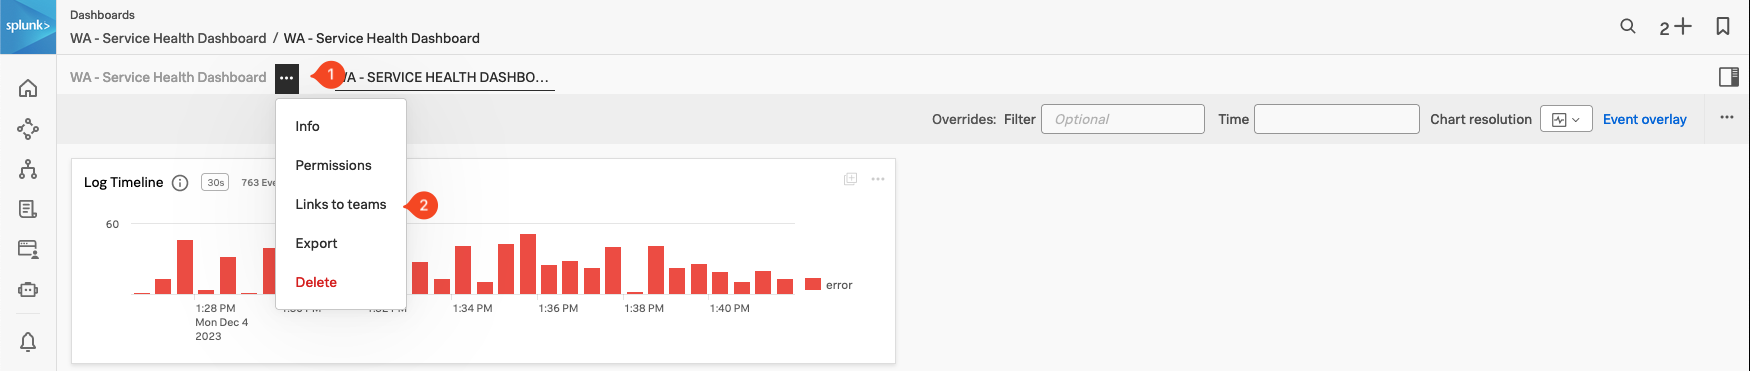
Related Content is a powerful feature that allows you to jump from one component to another and is available for metrics, traces and logs.

Last Modified Apr 3, 2024

Subsections of Splunk Log Observer

1. Log Filtering

Log Observer (LO), can be used in multiple ways. In the quick tour, you used the LO no-code interface to search for specific entries in the logs. This section, however, assumes you have arrived in LO from a trace in APM using the Related Content link.

The advantage of this is, as it was with the link between RUM & APM, that you are looking at your logs within the context of your previous actions. In this case, the context is the time frame (1), which matches that of the trace and the filter (2) which is set to the trace_id.

Trace Logs Trace Logs

This view will include all the log lines from all applications or services that participated in the back-end transaction started by the end-user interaction with the Online Boutique.

Even in a small application such as our Online Boutique, the sheer amount of logs found can make it hard to see the specific log lines that matter to the actual incident we are investigating.

Exercise

We need to focus on just the Error messages in the logs:

  • Click on the Group By drop-down box and use the filter to find Severity.
  • Once selected click the Apply button (notice that the chart legend changes to show debug, error and info). legend legend
  • Selecting just the error logs can be done by either clicking on the word error (1) in the legend, followed by selecting Add to filter.
  • You could also add the service name, sf_service=paymentservice, to the filter if there are error lines for multiple services, but in our case, this is not necessary. Error Logs Error Logs

Next, we will look at log entries in detail.

Last Modified Dec 1, 2023

2. Viewing Log Entries

Before we look at a specific log line, let’s quickly recap what we have done so far and why we are here based on the 3 pillars of Observability:

MetricsTracesLogs
Do I have a problem?Where is the problem?What is the problem?
  • Using metrics we identified we have a problem with our application. This was obvious from the error rate in the Service Dashboards as it was higher than it should be.
  • Using traces and span tags we found where the problem is. The paymentservice comprises of two versions, v350.9 and v350.10, and the error rate was 100% for v350.10.
  • We did see that this error from the paymentservice v350.10 caused multiple retries and a long delay in the response back from the Online Boutique checkout.
  • From the trace, using the power of Related Content, we arrived at the log entries for the failing paymentservice version. Now, we can determine what the problem is.
Exercise
  • Click on an error entry in the log table (make sure it says hostname: "paymentservice-xxxx" in case there is a rare error from a different service in the list too.

Based on the message, what would you tell the development team to do to resolve the issue?

The development team needs to rebuild and deploy the container with a valid API Token or rollback to v350.9.

Log Message Log Message

  • Click on the X in the log message pane to close it.
Congratulations

You have successfully used Splunk Observability Cloud to understand why you experienced a poor user experience whilst shopping at the Online Boutique. You used RUM, APM and logs to understand what happened in your service landscape and subsequently, found the underlying cause, all based on the 3 pillars of Observability, metrics, traces and logs

You also learned how to use Splunk’s intelligent tagging and analysis with Tag Spotlight to detect patterns in your applications’ behavior and to use the full stack correlation power of Related Content to quickly move between the different components whilst keeping in context of the issue.

In the next part of the workshop, we will move from problem-finding mode into mitigation, prevention and process improvement mode.

Next up, creating log charts in a custom dashboard.

Last Modified Dec 4, 2023

3. Log Timeline Chart

Once you have a specific view in Log Observer, it is very useful to be able to use that view in a dashboard, to help in the future with reducing the time to detect or resolve issues. As part of the workshop, we will create an example custom dashboard that will use these charts.

Let’s look at creating a Log Timeline chart. The Log Timeline chart is used for visualizing log messages over time. It is a great way to see the frequency of log messages and to identify patterns. It is also a great way to see the distribution of log messages across your environment. These charts can be saved to a custom dashboard.

Exercise

First, we will reduce the amount of information to only the columns we are interested in:

  • Click on the Configure Table icon above the Logs table to open the Table Settings, untick _raw and ensure the following fields are selected k8s.pod.name, message and version. Log Table Settings Log Table Settings
  • Remove the fixed time from the time picker, and set it to the Last 15 minutes.
  • To make this work for all traces, remove the trace_id from the filter and add the fields sf_service=paymentservice and sf_environment=[WORKSHOPNAME].
  • Click Save and select Save to Dashboard. save it save it
  • In the chart creation dialog box that appears, for the Chart name use Log Timeline.
  • Click Select Dashboard and then click New dashboard in the Dashboard Selection dialog box.
  • In the New dashboard dialog box, enter a name for the new dashboard (no need to enter a description). Use the following format: Initials - Service Health Dashboard and click Save
  • Ensure the new dashboard is highlighted in the list (1) and click OK (2). Save dashboard Save dashboard
  • Ensure that Log Timeline is selected as the Chart Type. log timeline log timeline
  • Click the Save button (do not click Save and goto dashboard at this time).

Next, we will create a Log View chart.

Last Modified Apr 18, 2024

4. Log View Chart

The next chart type that can be used with logs is the Log View chart type. This chart will allow us to see log messages based on predefined filters.

As with the previous Log Timeline chart, we will add a version of this chart to our Customer Health Service Dashboard:

Exercise
  • After the previous exercise make sure you are still in Log Observer.
  • The filters should be the same as the previous exercise, with the time picker set to the Last 15 minutes and filtering on severity=error, sf_service=paymentservice and sf_environment=[WORKSHOPNAME].
  • Make sure we have the header with just the fields we wanted.
  • Click again on Save and then Save to Dashboard.
  • This will again provide you with the Chart creation dialog.
  • For the Chart name use Log View.
  • This time Click Select Dashboard and search for the Dashboard you created in the previous exercise. You can start by typing your initials in the search box (1). search dashboard search dashboard
  • Click on your dashboard name to highlight it (2) and click OK (3).
  • This will return you to the create chart dialog.
  • Ensure Log View is selected as the Chart Type. log view log view
  • To see your dashboard click Save and go to dashboard.
  • The result should be similar to the dashboard below: Custom Dashboard Custom Dashboard
  • As the last step in this exercise, let us add your dashboard to your workshop team page, this will make it easy to find later in the workshop.
  • At the top of the page, click on the to the left of your dashboard name (1). linking linking
  • Select Link to teams from the drop-down (2).
  • In the following Link to teams dialog box, find the Workshop team that your instructor will have provided for you and click Done.

In the next session, we will look at Splunk Synthetics and see how we can automate the testing of web-based applications.