Custom Service Health Dashboard 🏥

15 minutes  
Persona

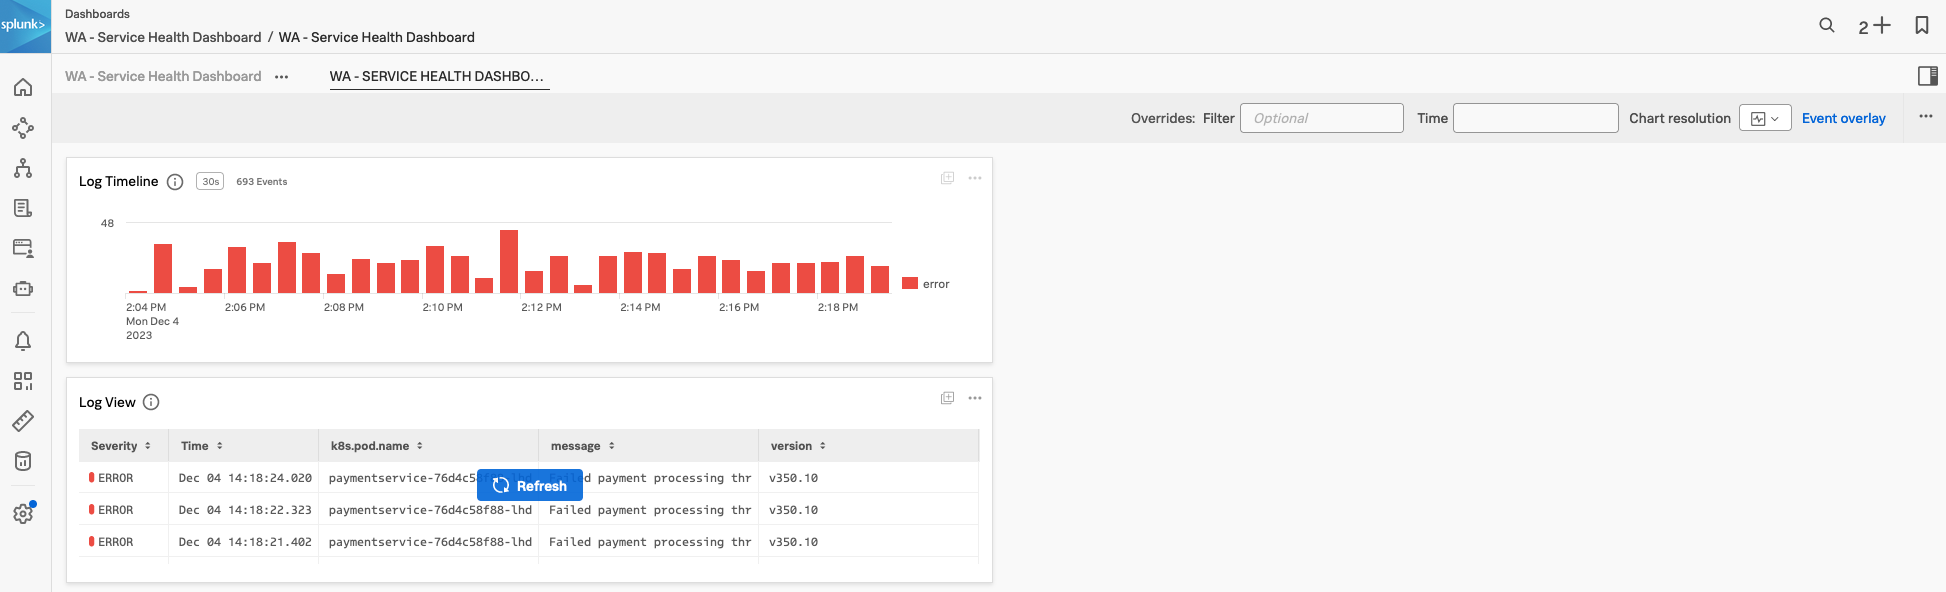
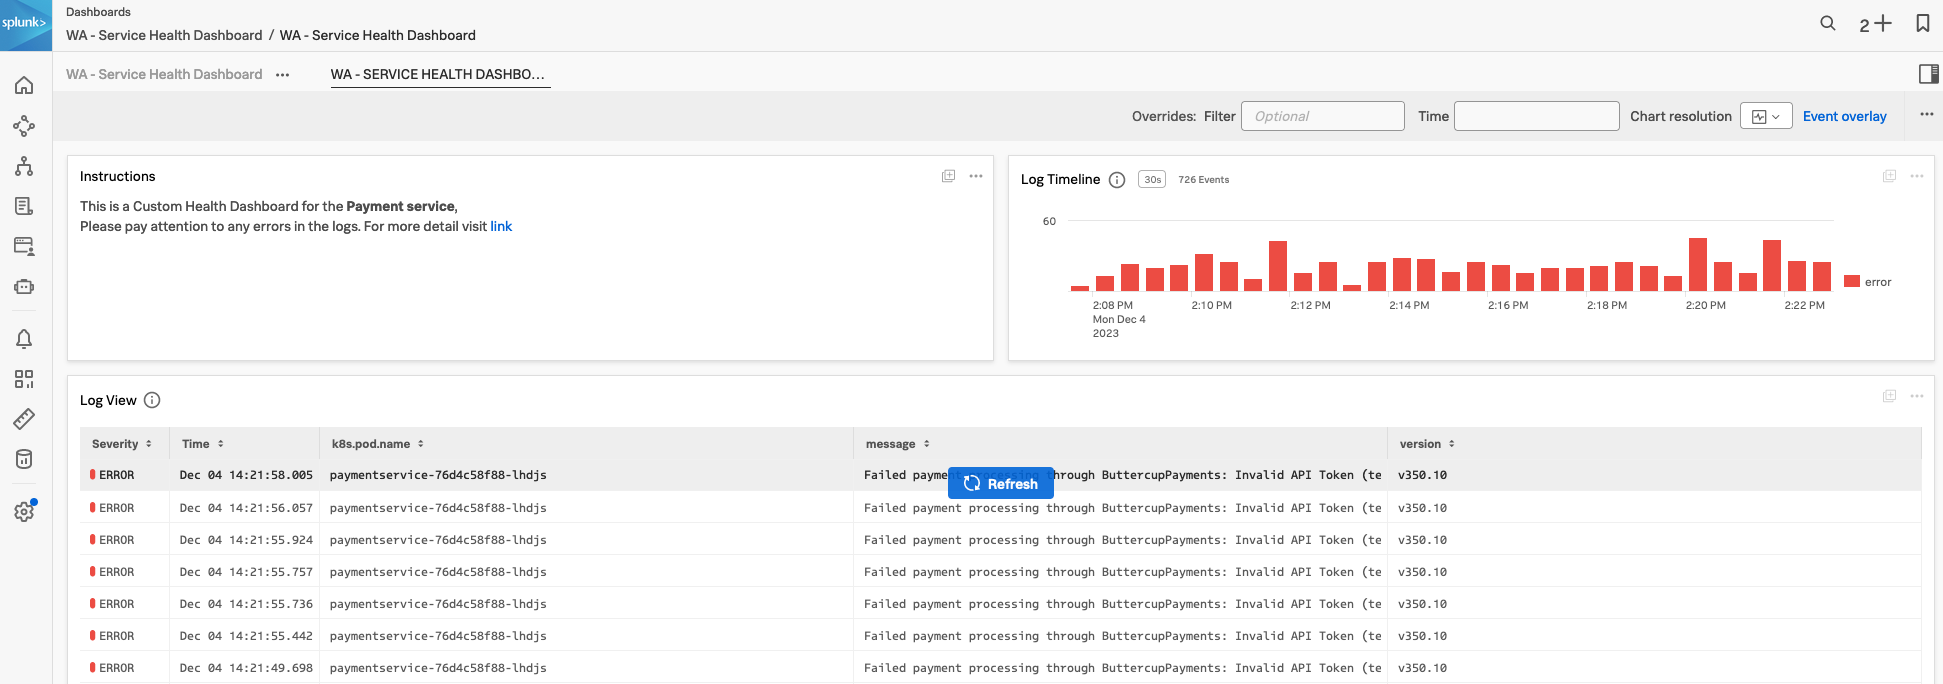
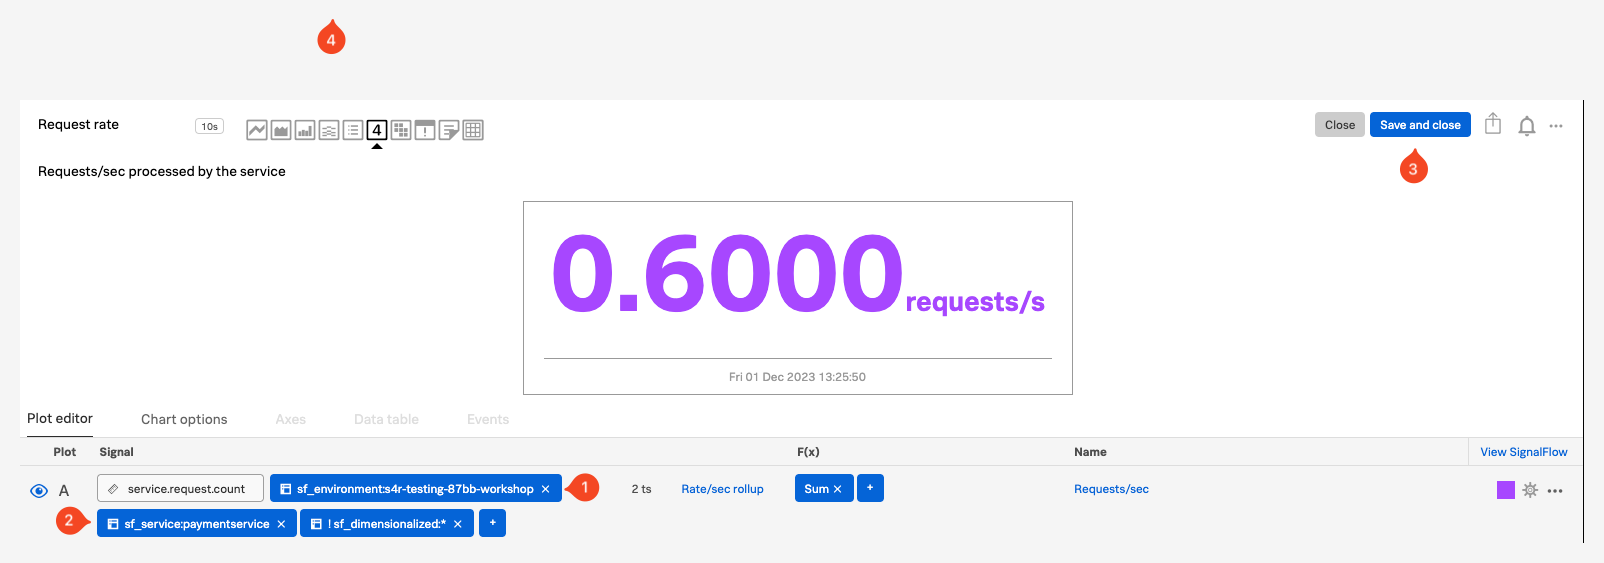
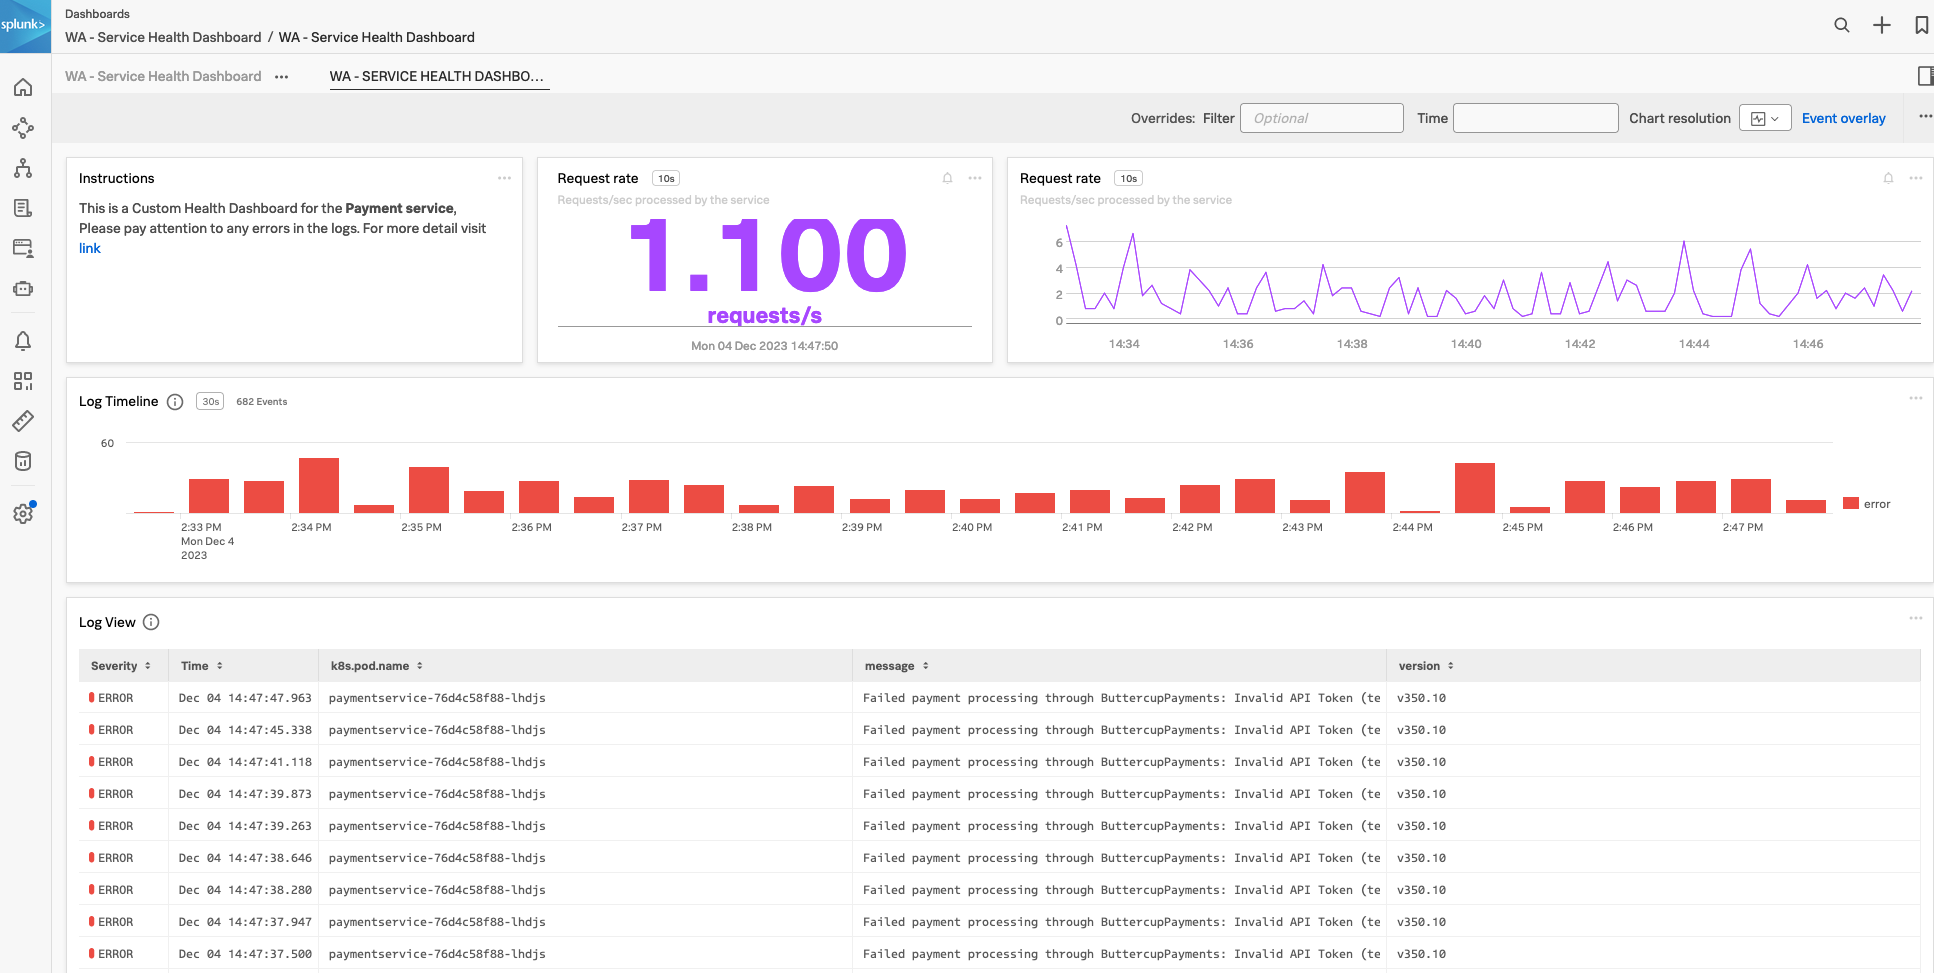
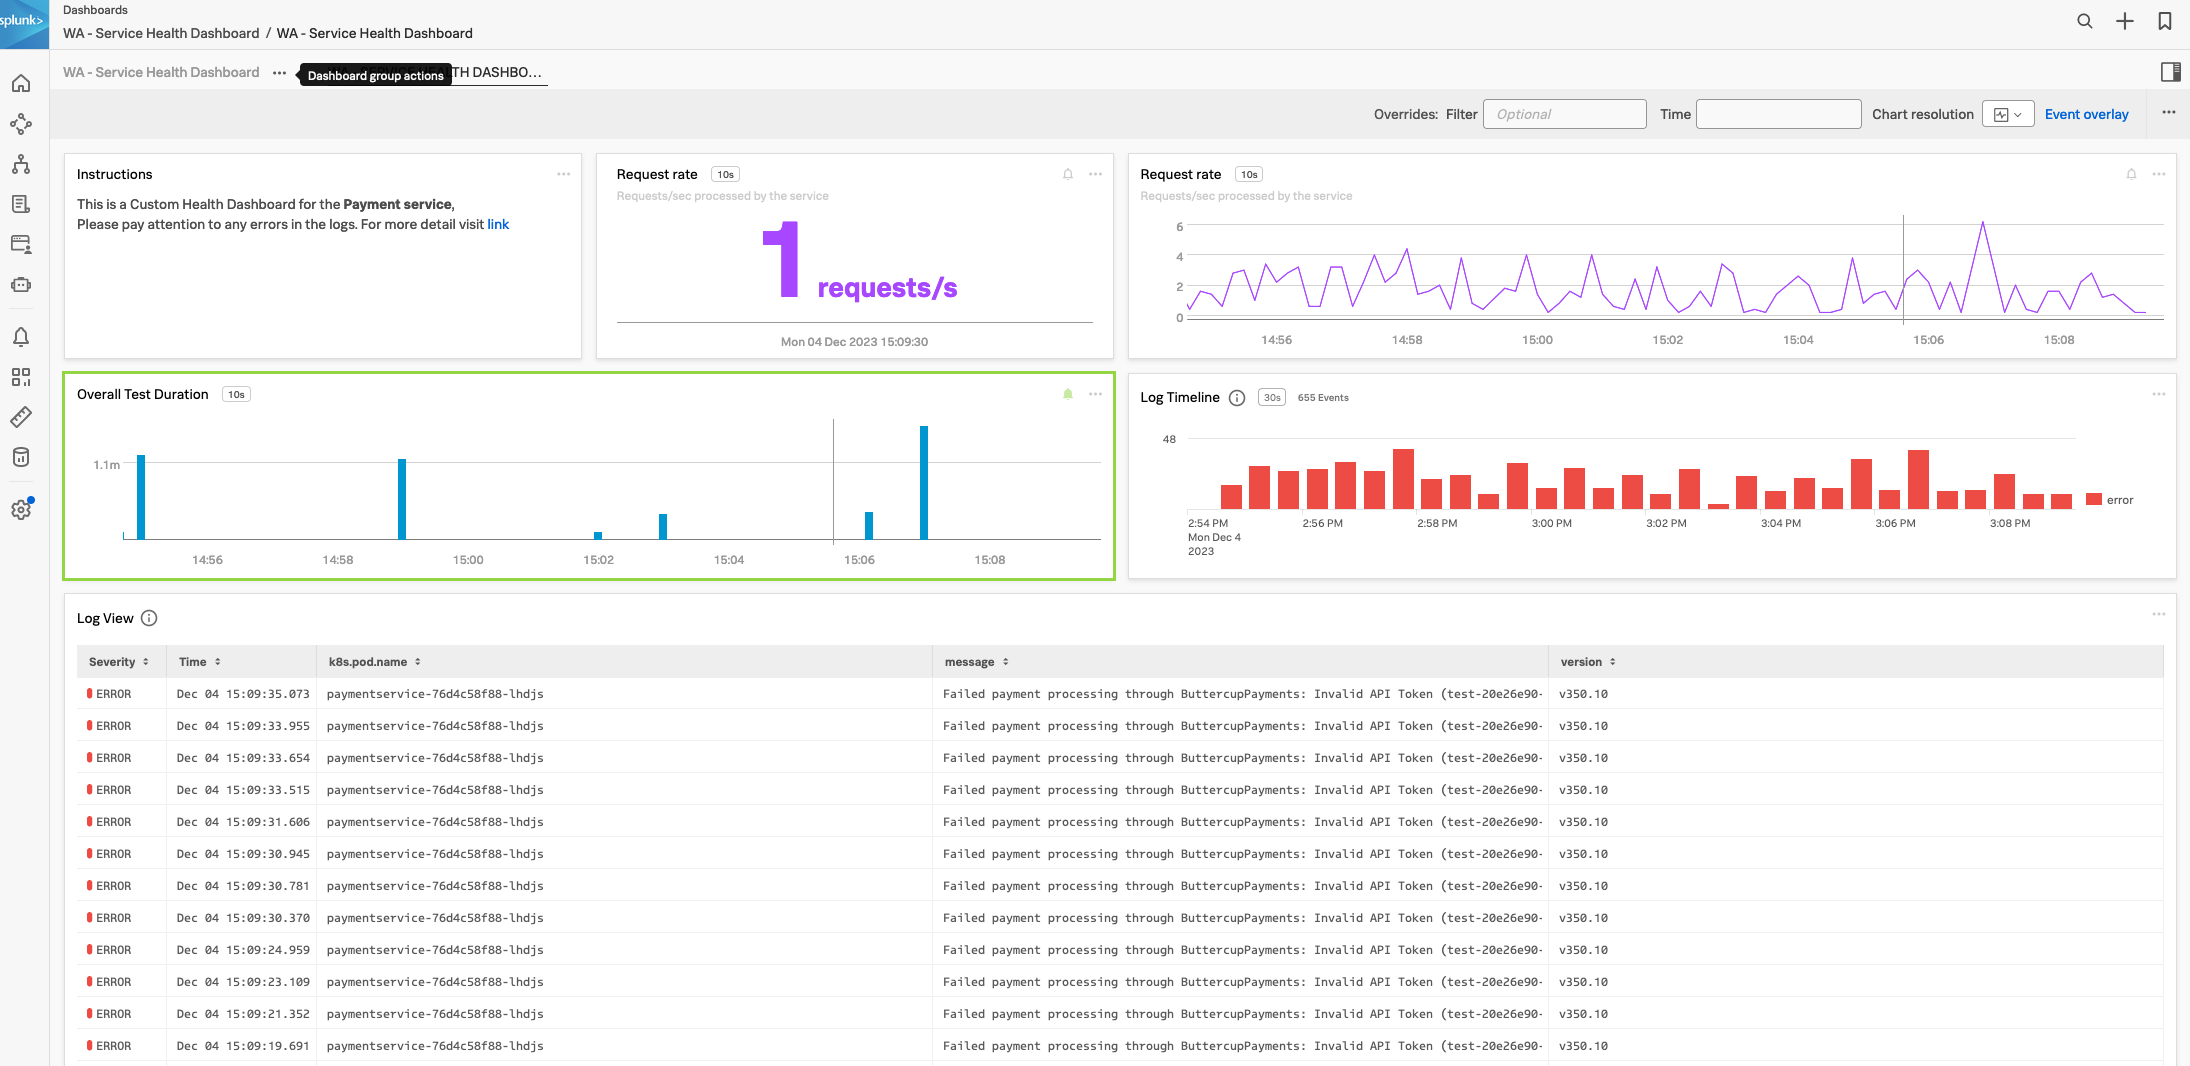
As the SRE hat suits you let’s keep it on as you have been asked to build a custom Service Health Dashboard for the paymentservice. The requirement is to display RED metrics, logs and Synthetic test duration results.

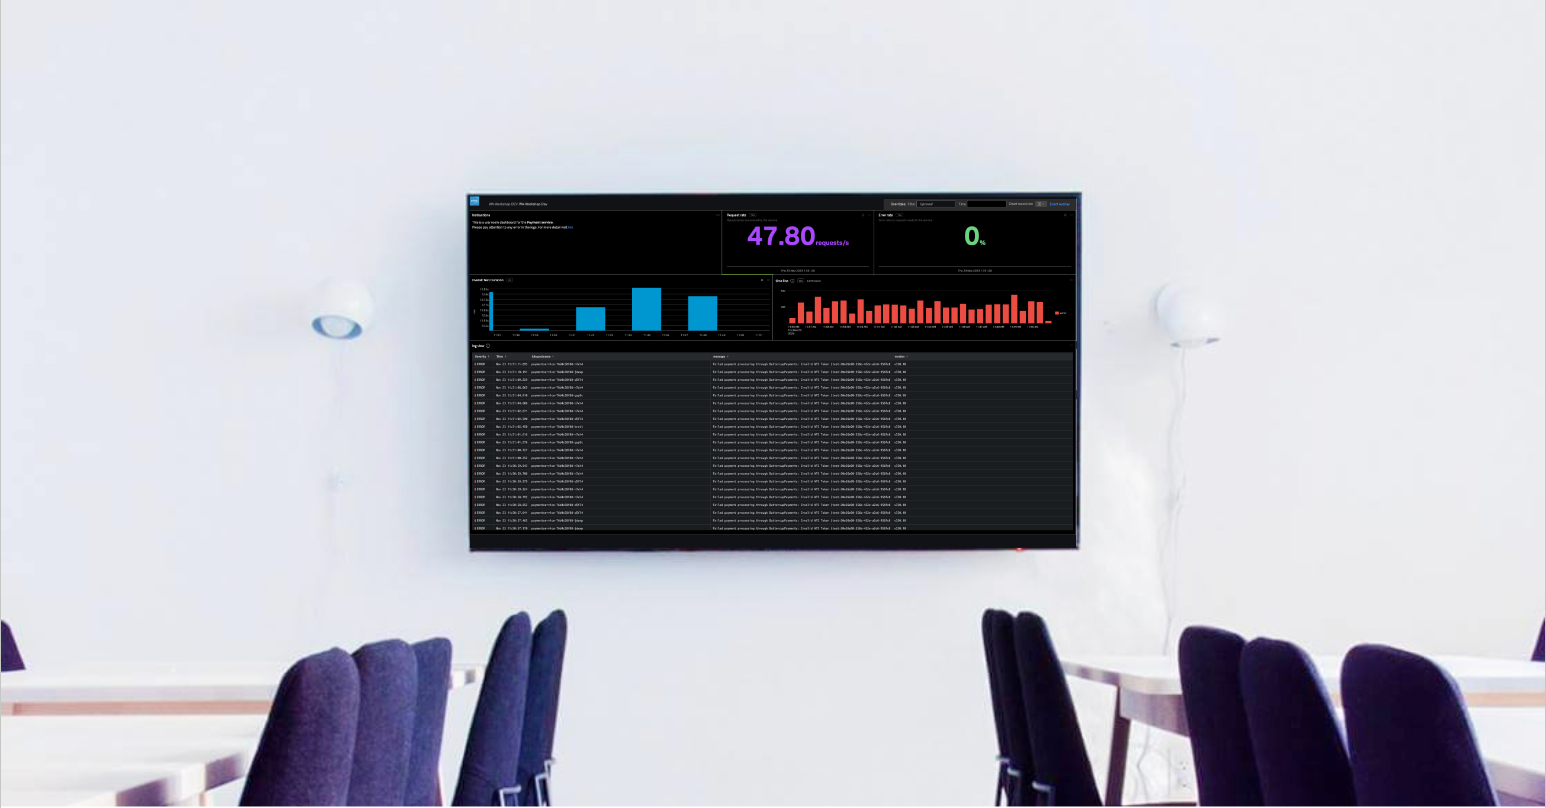
It is common for development and SRE teams to require a summary of the health of their applications and/or services. More often or not these are displayed on wall-mounted TVs. Splunk Observability Cloud has the perfect solution for this by creating custom dashboards.

In this section we are going to build a Service Health Dashboard we can use to display on teams’ monitors or TVs.

Last Modified Apr 3, 2024

Subsections of Custom Service Health Dashboard 🏥

Enhancing the Dashboard

As we already saved some useful log charts in a dashboard in the Log Observer exercise, we are going to extend that dashboard.

Wall mounted Wall mounted

Exercise
  • To get back to your dashboard with the two log charts, click on Dashboards from the main menu and you will be taken to your Team Dashboard view. Under Dashboards click in Search dashboards to search for your Service Health Dashboard group.
  • Click on the name and this will bring up your previously saved dashboard. log list log list
  • Even if the log information is useful, it will need more information to have it make sense for our team so let’s add a bit more information
  • The first step is adding a description chart to the dashboard. Click on the New text note and replace the text in the note with the following text and then click the Save and close button and name the chart Instructions
Information to use with text note
This is a Custom Health Dashboard for the **Payment service**,  
Please pay attention to any errors in the logs.
For more detail visit [link](https://https://www.splunk.com/en_us/products/observability.html)
  • The charts are not in a nice order, let’s correct that and rearrange the charts so that they are useful.
  • Move your mouse over the top edge of the Instructions chart, your mouse pointer will change to a . This will allow you to drag the chart in the dashboard. Drag the Instructions chart to the top left location and resize it to a 1/3rd of the page by dragging the right-hand edge.
  • Drag and add the Log Timeline view chart next to the Instruction chart, resize it so it fills the other 2/3rd of the page to be the error rate chart next to the two the chart and resize it so it fills the page
  • Next, resize the Log lines chart to be the width of the page and resize it the make it at least twice as long.
  • You should have something similar to the dashboard below: Initial Dashboard Initial Dashboard

This looks great, let’s continue and add more meaningful charts.

Last Modified Dec 4, 2023

Adding Copied Charts

In this section, we are going to use the Copy and Paste functionality to extend our dashboard. Remember we copied some charts during the APM Service Dashboard section, we will now add those charts to our dashboard.

Exercise
  • Select the 2+ at the top of the page and select Paste charts, this will create the charts in your custom dashboard.
  • The chart currently shows data for all Environments and Services, so let’s add a filter for our environment and the paymentservice.
  • Click on the 3 dots at the top right side of the Request Rate single value chart. This will open the chart in edit mode.
  • In the new screen, click on the x in the sf_environment:* x button (1) in the middle of the screen to close it.
  • Click on the + to add a new filter and select sf_environment then pick the [WORKSHOPNAME] from the drop-down and hit Apply. The button will change to sf_environment:[WORKSHOPNAME]
  • Do the same with for the sf_service. button (2), close it and create a new filter for sf_service. Only this time change it to paymentservice. edit chart edit chart
  • Click the Save and close button (3).
  • Repeat the previous 4 steps for the Request Rate text chart
  • Click Save after you have update the two charts.
  • As the new pasted charts appeared at the bottom of our dashboard, we need to re-organize our dashboard again.
  • Using the drag and drop and resizing skills you learned earlier, make your dashboard look like the image below. New dashboard look New dashboard look

Next, we are going to create a custom chart based on our Synthetic test that is running.

Last Modified Dec 4, 2023

Adding a Custom Chart

In this part of the workshop we are going to create a chart that we will add to our dashboard, we will also link it to the detector we previously built. This will allow us to see the behavior of our test and get alerted if one or more of our test runs breach its SLA.

Exercise
  • At the top of the dashboard click on the + and select Chart. new chart screen new chart screen
  • First, use the Untitled chart input field and name the chart Overall Test Duration.
  • For this exercise we want a bar or column chart, so click on the 3rd icon in the chart option box.
  • In the Plot editor enter synthetics.run.duration.time.ms (this is runtime in duration for our test) in the Signal box and hit enter.
  • Right now we see different colored bars, a different color for each region the test runs from. As this is not needed we can change that behavior by adding some analytics.
  • Click the Add analytics button.
  • From the drop-down choose the Mean option, then pick mean:aggregation and click outside the dialog box. Notice how the chart changes to a single color as the metrics are now aggregated.
  • The x-axis does not currently represent time to change this click on the settings icon at the end of the plot line. The following following dialog will open: signal setup signal setup
  • Change the Display units (2) in the drop-down box from None to Time (autoscaling)/Milliseconds(ms). The drop-down changes to Millisecond and the x-axis of the chart now represents the test duration time.
  • Close the dialog, either by clicking on the settings icon or the close button.
  • Add our detector by clicking the Link Detector button and start typing the name of the detector you created earlier.
  • Click on the detector name to select it.
  • Notice that a colored border appears around the chart, indicating the status of the alert, along with a bell icon at the top of the dashboard as shown below: detector added detector added
  • Click the Save and close button.
  • In the dashboard, move the charts so they look like the screenshot below: Service Health Dashboard Service Health Dashboard
  • For the final task, click three dots at the top of the page (next to Event Overlay) and click on View fullscreen. This will be the view you would use on the TV monitor on the wall (press Esc to go back).
Tip

In your spare time have a try at adding another custom chart to the dashboard using RUM metrics. You could copy a chart from the out-of-the-box RUM applications dashboard group. Or you could use the RUM metric rum.client_error.count to create a chart that shows the number of client errors in the application.

Finally, we will run through a workshop wrap-up.