Subsections of Profiling Workshop
Build the Sample Application
10 minutes
Introduction
For this workshop, we’ll be using a Java-based application called The Door Game. It will be hosted in Kubernetes.
Pre-requisites
You will start with an EC2 instance and perform some initial steps in order to get to the following state:
- Deploy the Splunk distribution of the OpenTelemetry Collector
- Deploy the MySQL database container and populate data
- Build and deploy the
doorgame application container
Initial Steps
The initial setup can be completed by executing the following steps on the command line of your EC2 instance.
You’ll be asked to enter a name for your environment. Please use profiling-workshop-yourname (where yourname is replaced by your actual name).
cd workshop/profiling
./1-deploy-otel-collector.sh
./2-deploy-mysql.sh
./3-deploy-doorgame.sh
Let’s Play The Door Game
Now that the application is deployed, let’s play with it and generate some observability data.
Get the external IP address for your application instance using the following command:
kubectl describe svc doorgame | grep "LoadBalancer Ingress"
The output should look like the following:
LoadBalancer Ingress: 52.23.184.60
You should be able to access The Door Game application by pointing your browser to port 81 of the provided IP address. For example:
You should be met with The Door Game intro screen:

Click Let's Play to start the game:

Did you notice that it took a long time after clicking Let's Play before we could actually start playing the game?
Let’s use Splunk Observability Cloud to determine why the application startup is so slow.
Troubleshoot Game Startup
10 minutes
Let’s use Splunk Observability Cloud to determine why the game started so slowly.
View your application in Splunk Observability Cloud
Note: when the application is deployed for the first time, it may take a few minutes for the data to appear.
Navigate to APM, then use the Environment dropdown to select your environment (i.e. profiling-workshop-name).
If everything was deployed correctly, you should see doorgame displayed in the list of services:
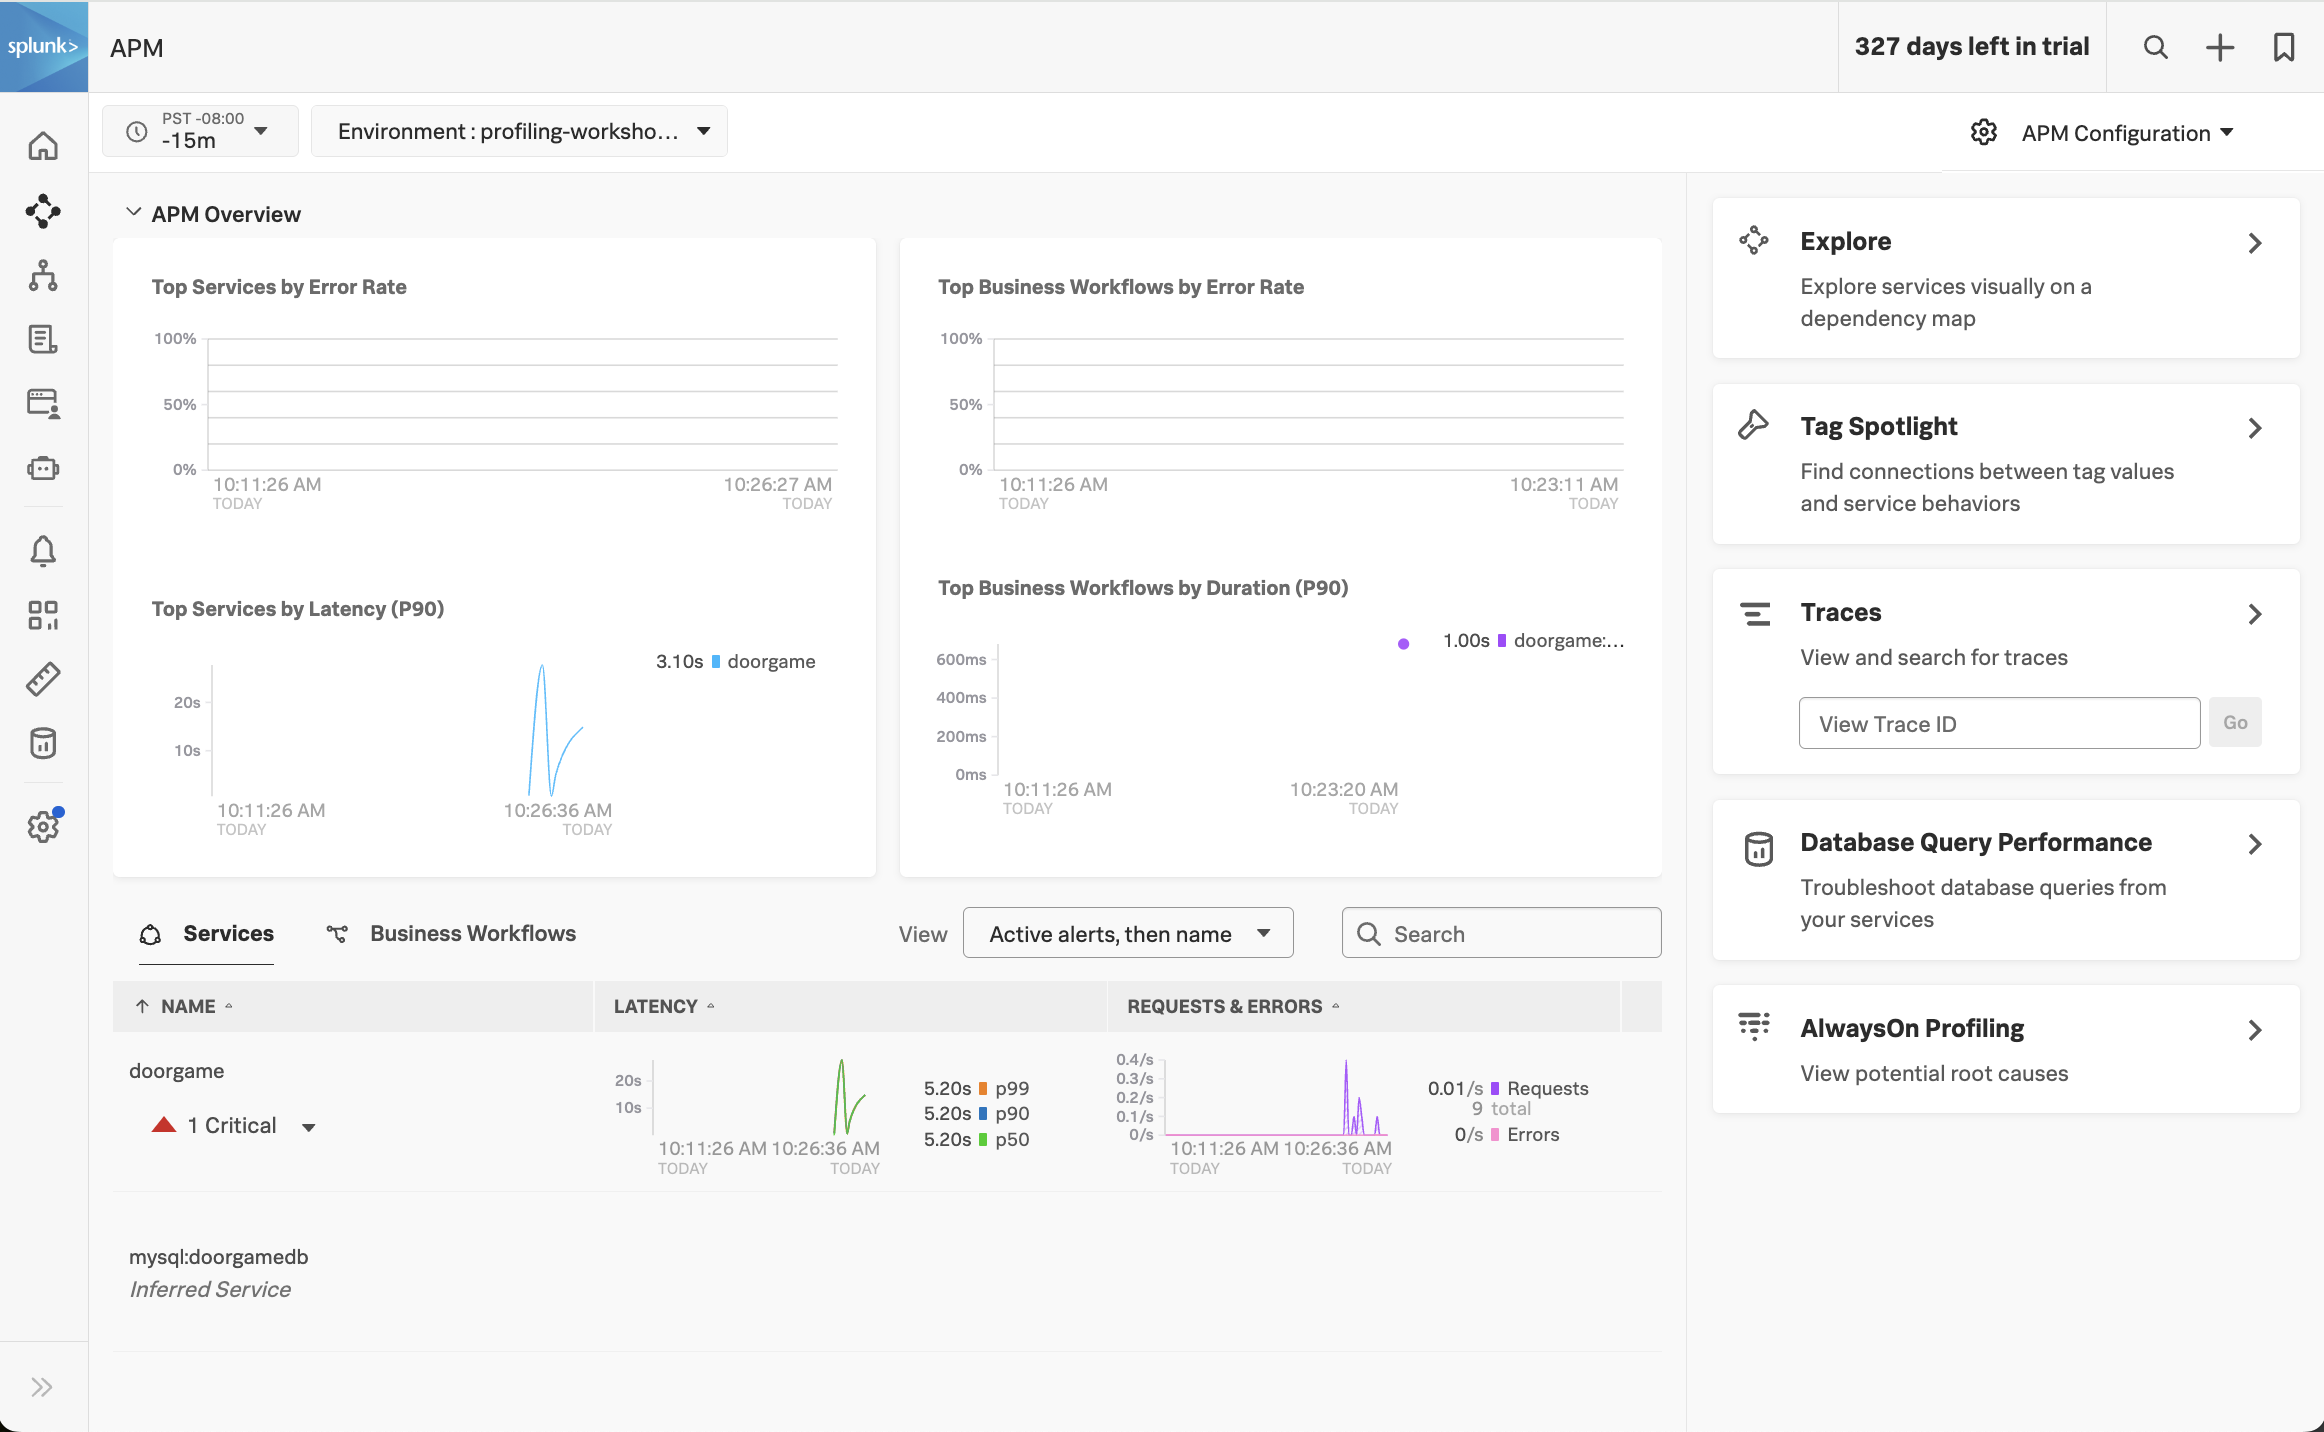
Click on Explore on the right-hand side to view the service map. We should the doorgame application on the service map:
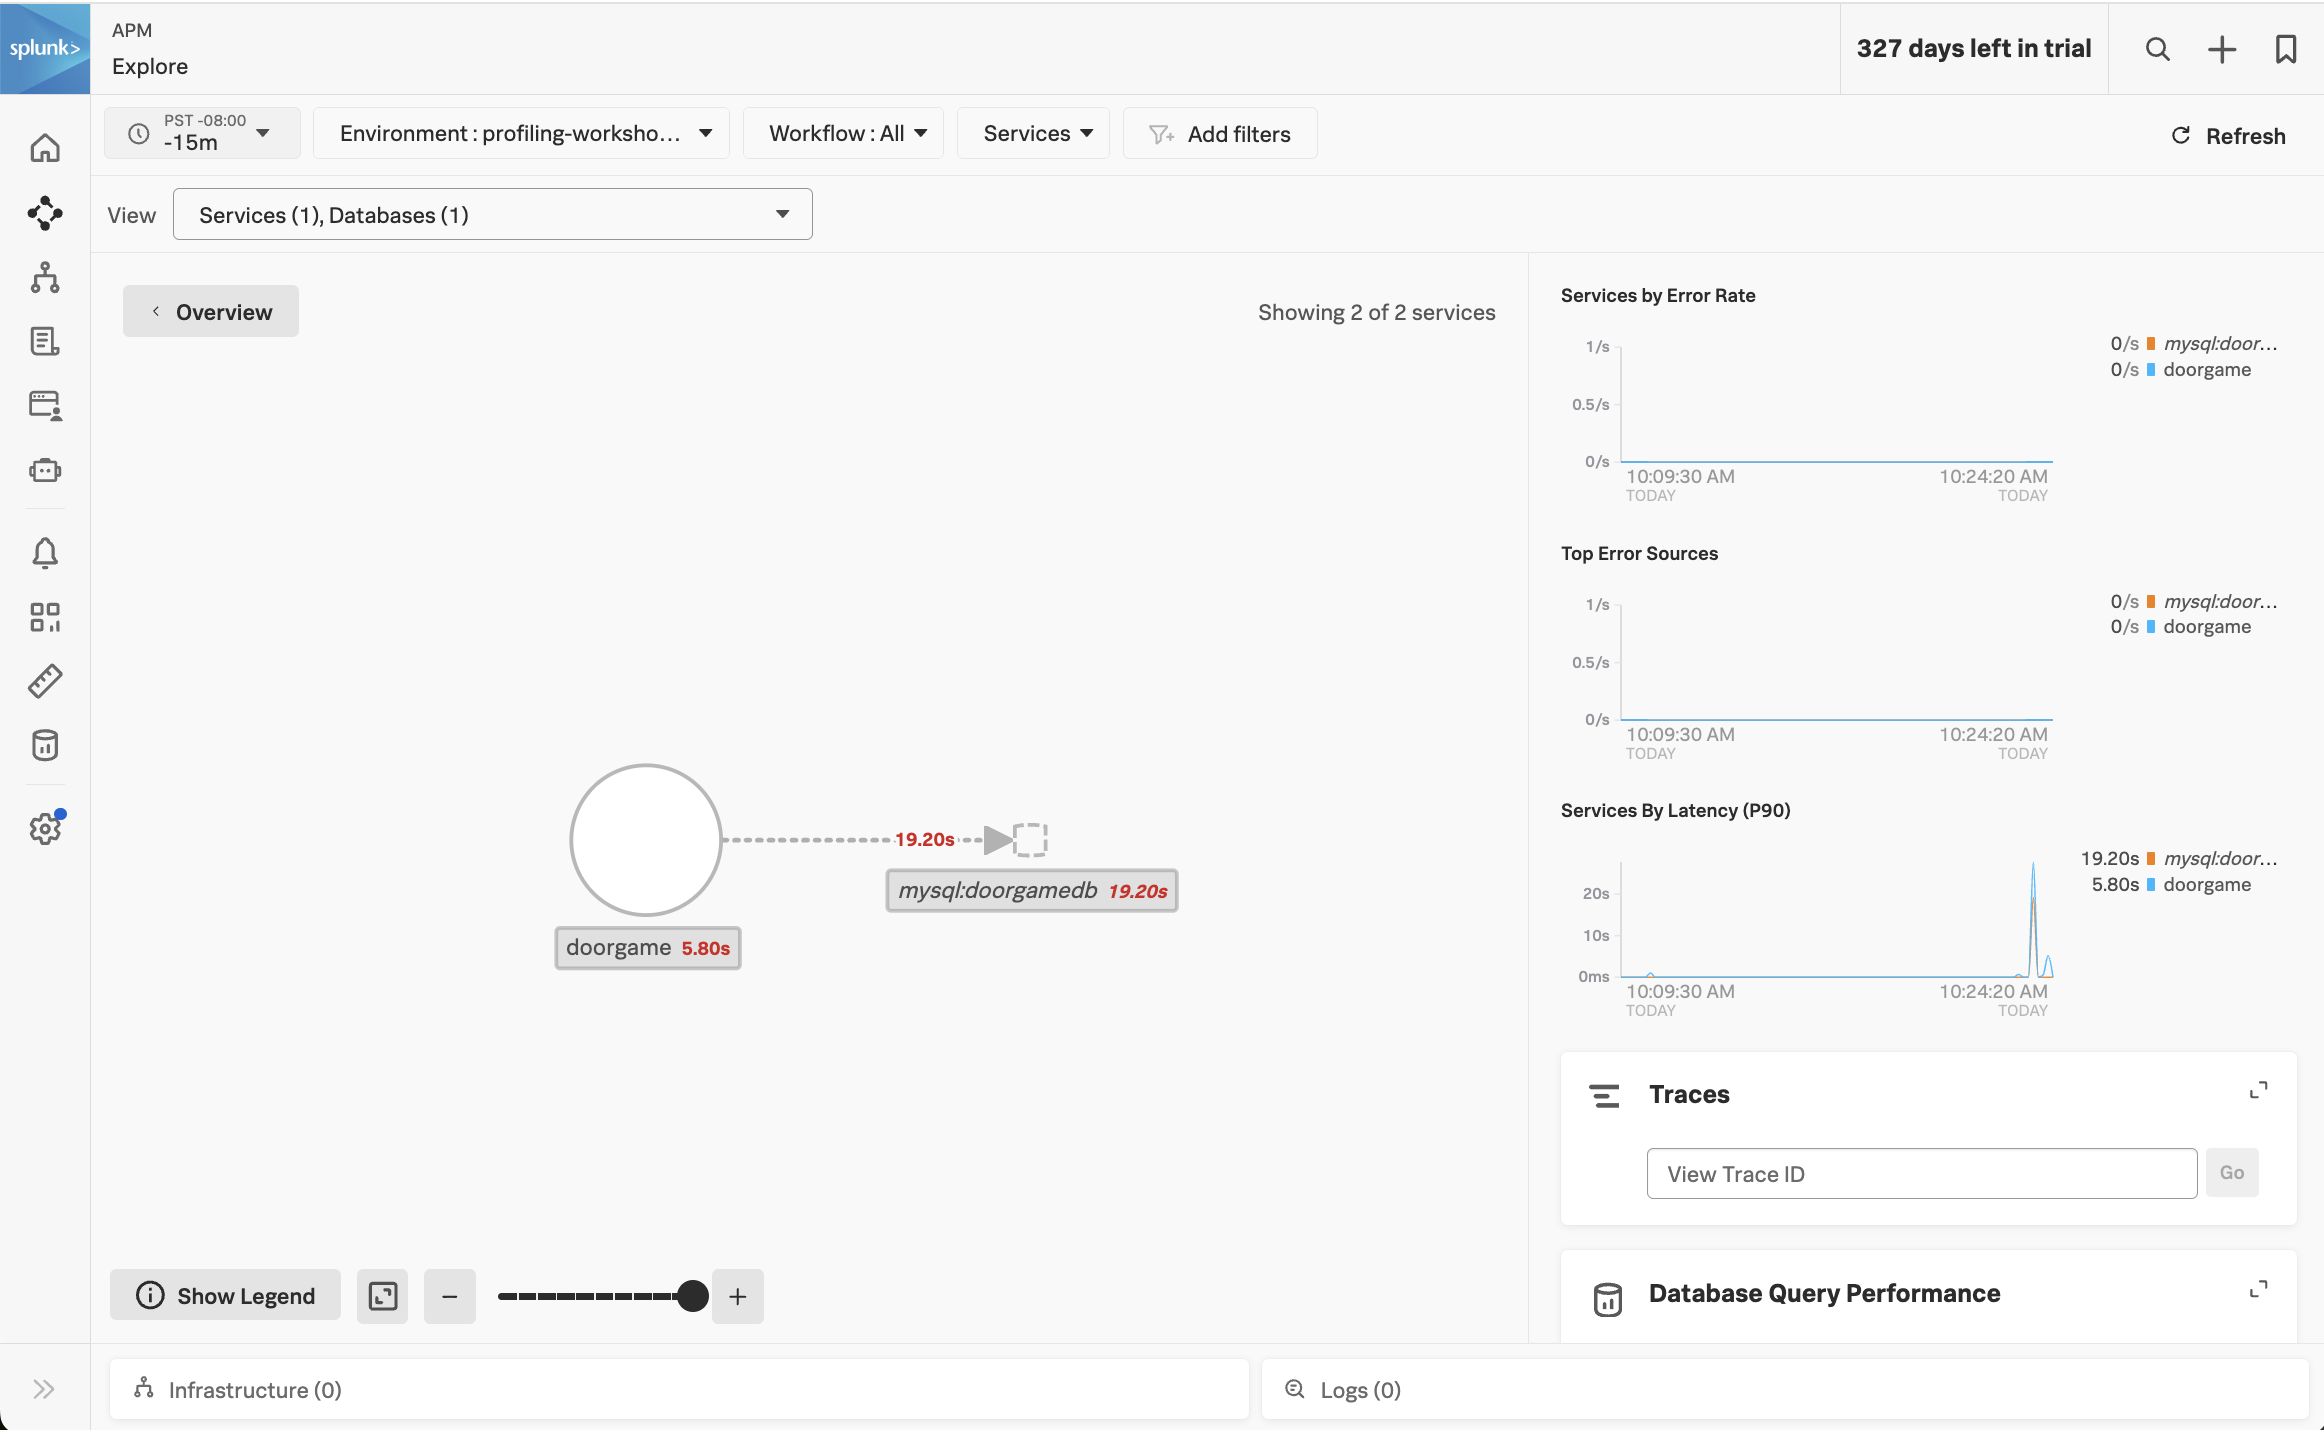
Notice how the majority of the time is being spent in the MySQL database. We can get more details by clicking on Database Query Performance on the right-hand side.

This view shows the SQL queries that took the most amount of time. Ensure that the Compare to dropdown is set to None, so we can focus on current performance.
We can see that one query in particular is taking a long time:
select * from doorgamedb.users, doorgamedb.organizations
(do you notice anything unusual about this query?)
Let’s troubleshoot further by clicking on one of the spikes in the latency graph. This brings up a list of example traces that include this slow query:

Click on one of the traces to see the details:

In the trace, we can see that the DoorGame.startNew operation took 25.8 seconds, and 17.6 seconds of this was associated with the slow SQL query we found earlier.
What did we accomplish?
To recap what we’ve done so far:
- We’ve deployed our application and are able to access it successfully.
- The application is sending traces to Splunk Observability Cloud successfully.
- We started troubleshooting the slow application startup time, and found a slow SQL query that seems to be the root cause.
To troubleshoot further, it would be helpful to get deeper diagnostic data that tells us what’s happening inside our JVM, from both a memory (i.e. JVM heap) and CPU perspective. We’ll tackle that in the next section of the workshop.
Enable AlwaysOn Profiling
20 minutes
Let’s learn how to enable the memory and CPU profilers, verify their operation,
and use the results in Splunk Observability Cloud to find out why our application startup is slow.
Update the application configuration
We will need to pass additional configuration arguments to the Splunk OpenTelemetry Java agent in order to
enable both profilers. The configuration is documented here
in detail, but for now we just need the following settings:
SPLUNK_PROFILER_ENABLED="true"
SPLUNK_PROFILER_MEMORY_ENABLED="true"
Since our application is deployed in Kubernetes, we can update the Kubernetes manifest file to set these environment variables. Open the doorgame/doorgame.yaml file for editing, and ensure the values of the following environment variables are set to “true”:
- name: SPLUNK_PROFILER_ENABLED
  value: "true"
- name: SPLUNK_PROFILER_MEMORY_ENABLED
  value: "true"
Next, let’s redeploy the Door Game application by running the following command:
cd workshop/profiling
kubectl apply -f doorgame/doorgame.yaml
After a few seconds, a new pod will be deployed with the updated application settings.
Confirm operation
To ensure the profiler is enabled, let’s review the application logs with the following commands:
kubectl logs -l app=doorgame --tail=100 | grep JfrActivator
You should see a line in the application log output that shows the profiler is active:
[otel.javaagent 2024-02-05 19:01:12:416 +0000] [main] INFO com.splunk.opentelemetry.profiler.JfrActivator - Profiler is active.```
This confirms that the profiler is enabled and sending data to the OpenTelemetry collector deployed in our Kubernetes cluster, which in turn sends profiling data to Splunk Observability Cloud.
Profiling in APM
Visit http://<your IP address>:81 and play a few more rounds of The Door Game.
Then head back to Splunk Observability Cloud, click on APM, and click on the doorgame service at the bottom of the screen.
Click on “Traces” on the right-hand side to load traces for this service. Filter on traces involving the doorgame service and the GET new-game operation (since we’re troubleshooting the game startup sequence):
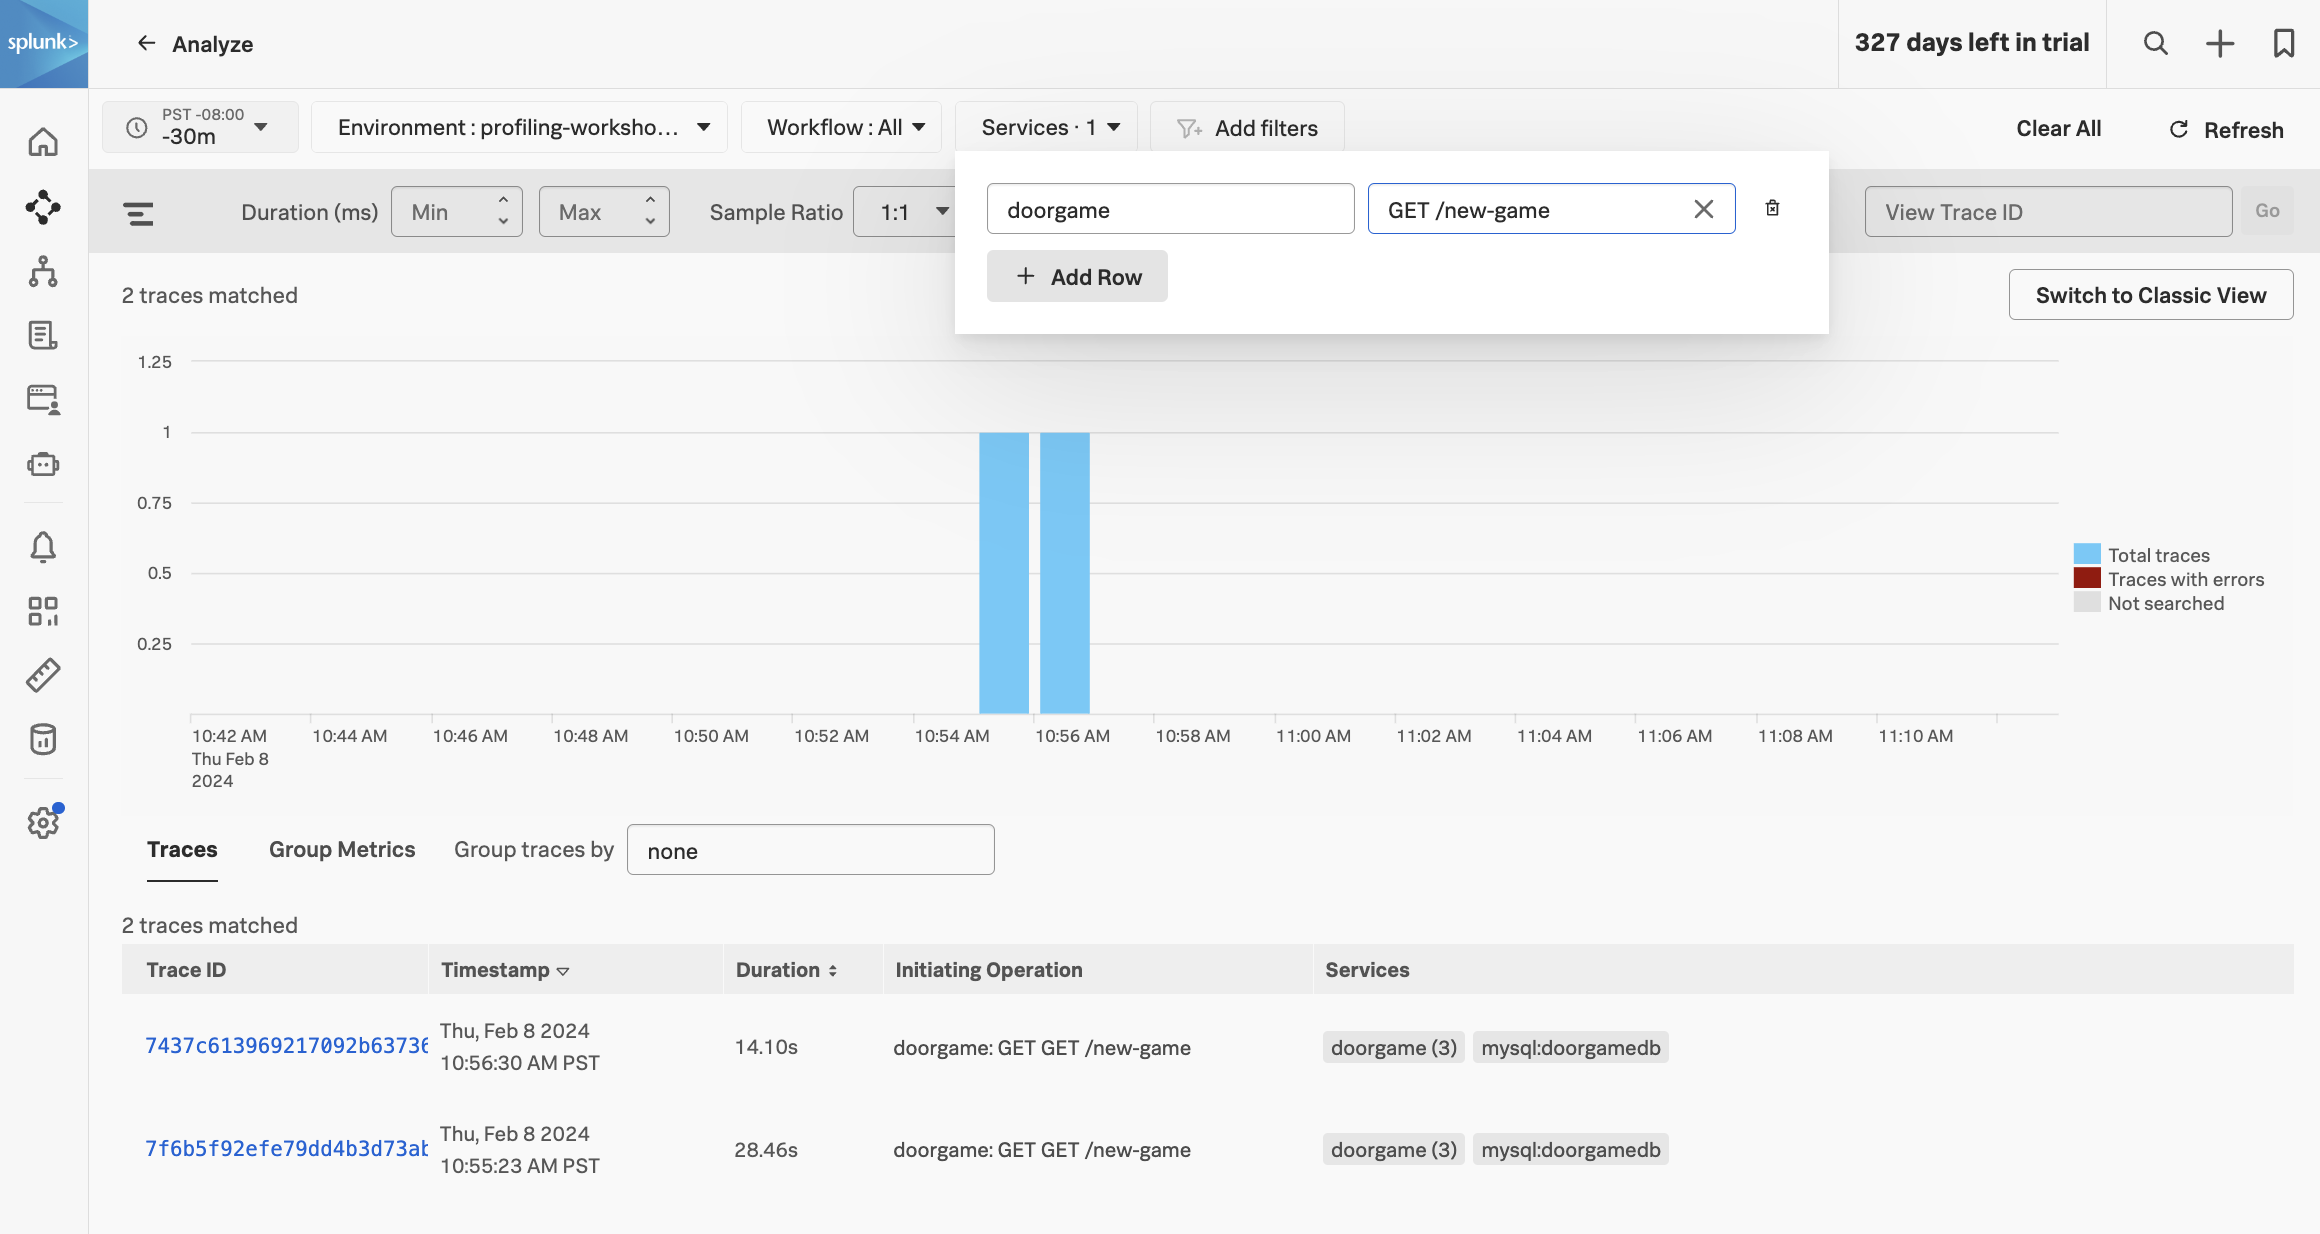
Selecting one of these traces brings up the following screen:

You can see that the spans now include “Call Stacks”, which is a result of us enabling CPU and memory profiling earlier.
Click on the span named doorgame: SELECT doorgamedb, then click on CPU stack traces on the right-hand side:

This brings up the CPU call stacks captured by the profiler.
Let’s open the AlwaysOn Profiler to review the CPU stack trace in more detail. We can do this by clicking on the Span link beside View in AlwaysOn Profiler:
The AlwaysOn Profiler includes both a table and a flamegraph. Take some time to explore this view by doing some of the following:
- click a table item and notice the change in flamegraph
- navigate the flamegraph by clicking on a stack frame to zoom in, and a parent frame to zoom out
- add a search term like
splunk or jetty to highlight some matching stack frames
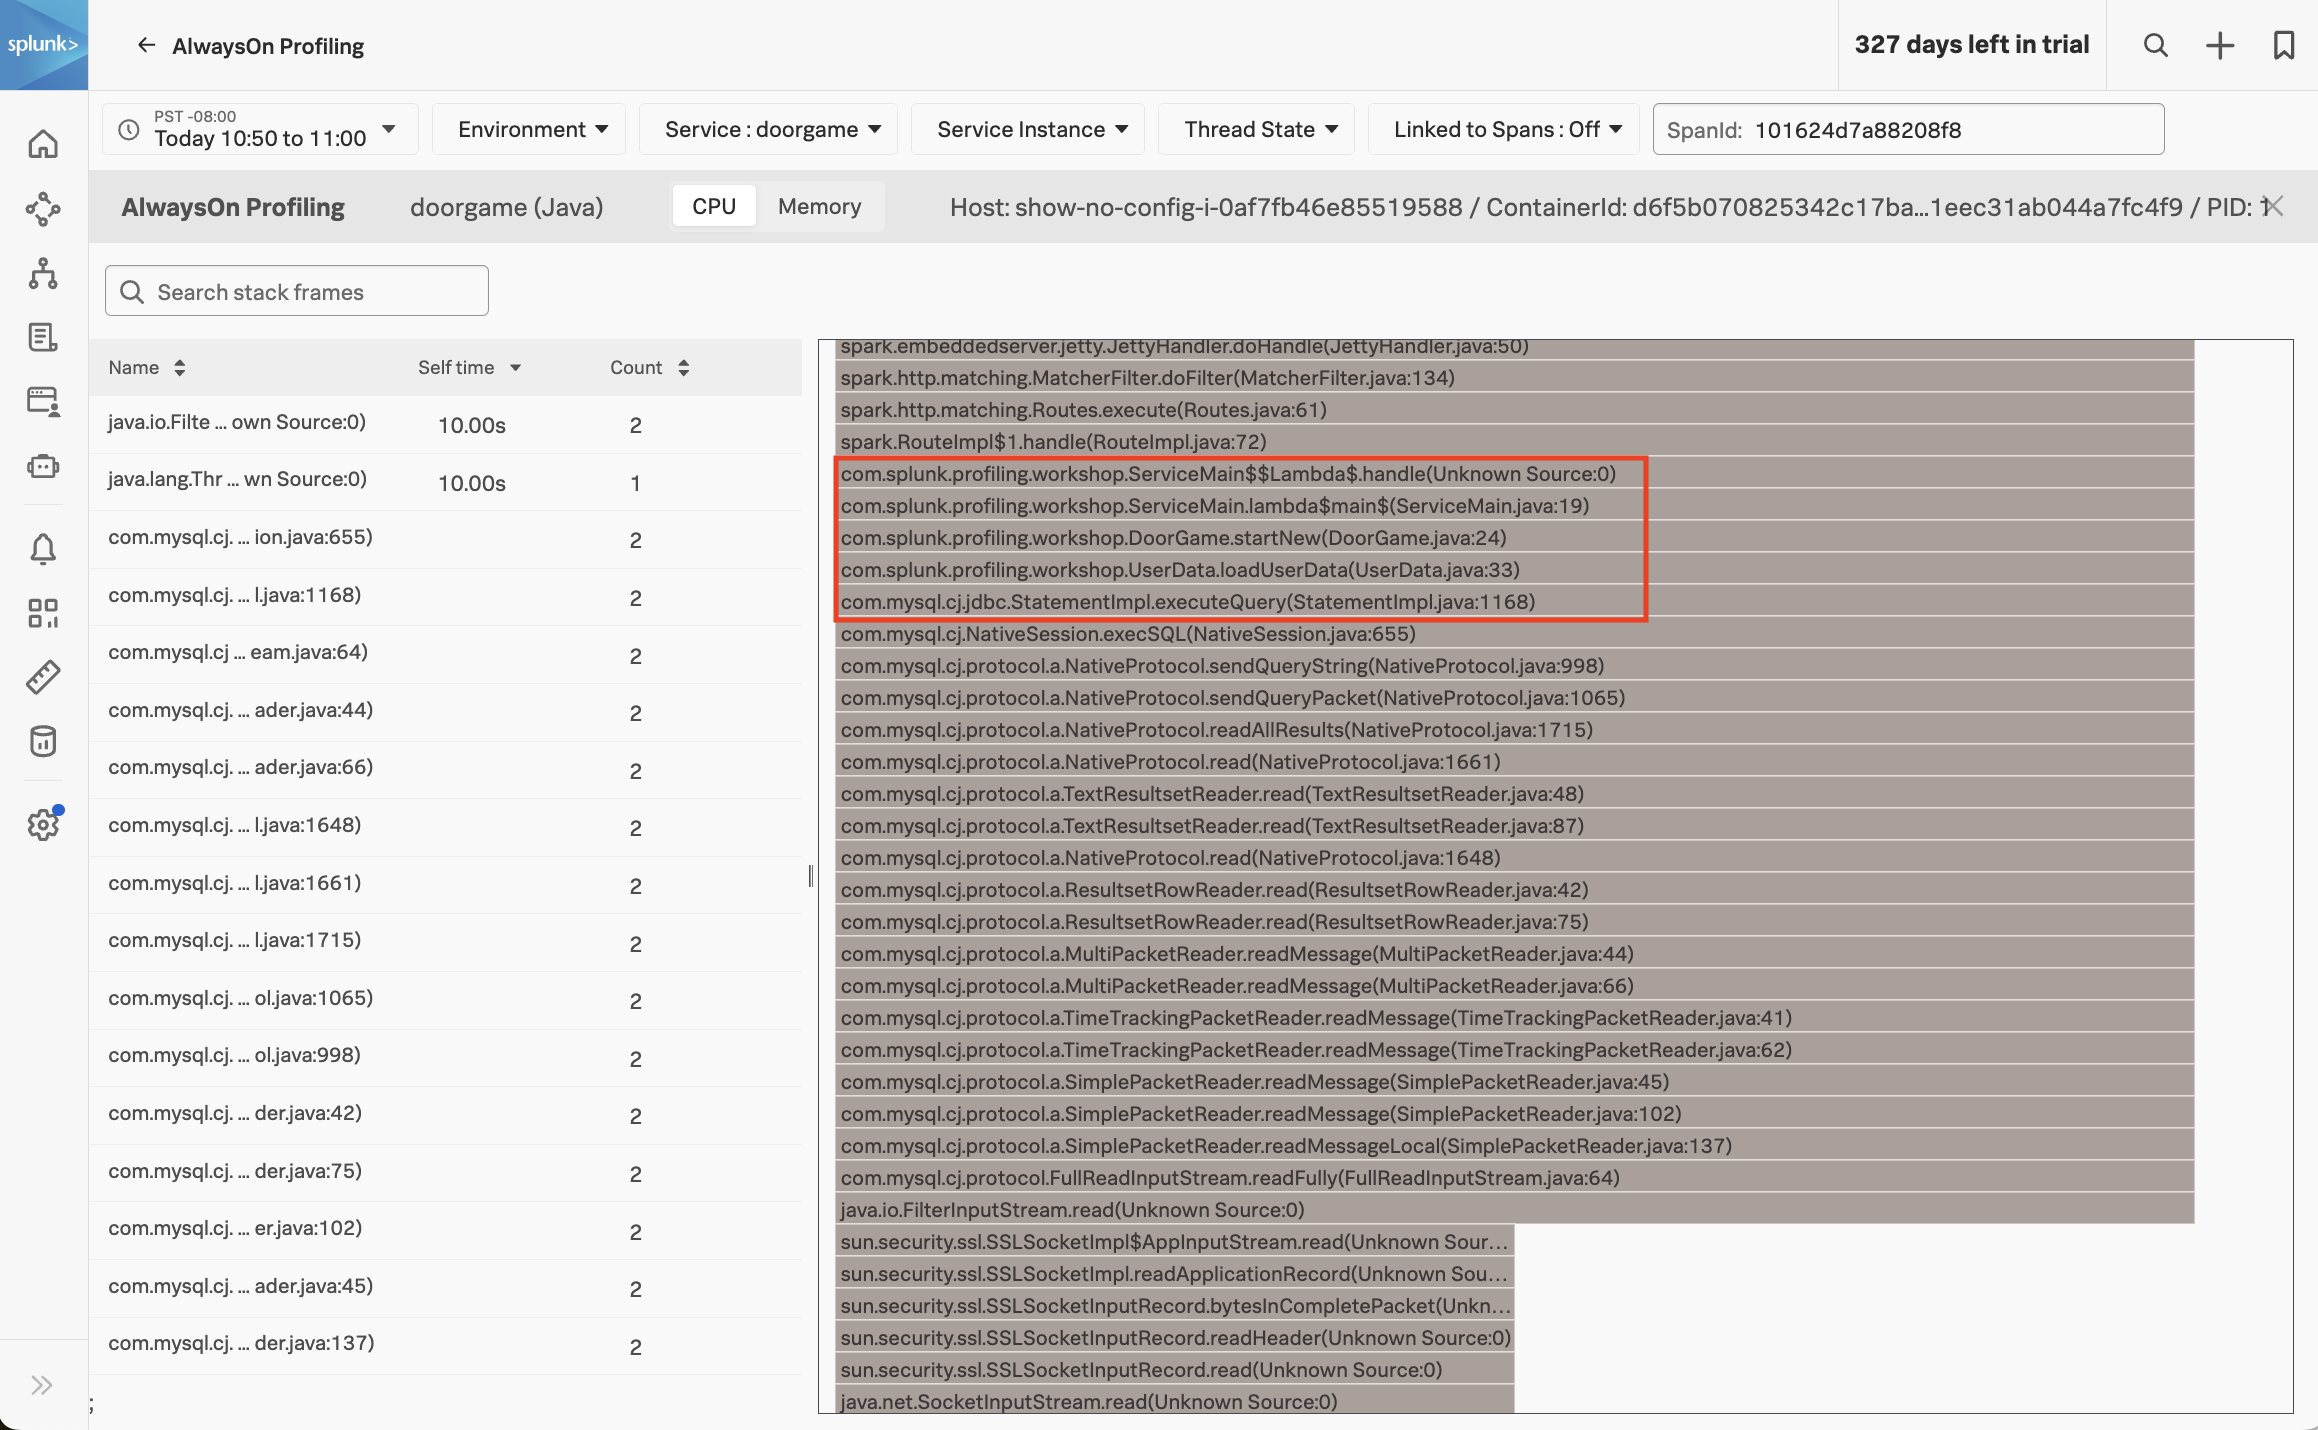
Let’s have a closer look at the stack trace, starting with the DoorGame.startNew method (since we already know that it’s the slowest part of the request)
com.splunk.profiling.workshop.DoorGame.startNew(DoorGame.java:24)
com.splunk.profiling.workshop.UserData.loadUserData(UserData.java:33)
com.mysql.cj.jdbc.StatementImpl.executeQuery(StatementImpl.java:1168)
com.mysql.cj.NativeSession.execSQL(NativeSession.java:655)
com.mysql.cj.protocol.a.NativeProtocol.sendQueryString(NativeProtocol.java:998)
com.mysql.cj.protocol.a.NativeProtocol.sendQueryPacket(NativeProtocol.java:1065)
com.mysql.cj.protocol.a.NativeProtocol.readAllResults(NativeProtocol.java:1715)
com.mysql.cj.protocol.a.NativeProtocol.read(NativeProtocol.java:1661)
com.mysql.cj.protocol.a.TextResultsetReader.read(TextResultsetReader.java:48)
com.mysql.cj.protocol.a.TextResultsetReader.read(TextResultsetReader.java:87)
com.mysql.cj.protocol.a.NativeProtocol.read(NativeProtocol.java:1648)
com.mysql.cj.protocol.a.ResultsetRowReader.read(ResultsetRowReader.java:42)
com.mysql.cj.protocol.a.ResultsetRowReader.read(ResultsetRowReader.java:75)
com.mysql.cj.protocol.a.MultiPacketReader.readMessage(MultiPacketReader.java:44)
com.mysql.cj.protocol.a.MultiPacketReader.readMessage(MultiPacketReader.java:66)
com.mysql.cj.protocol.a.TimeTrackingPacketReader.readMessage(TimeTrackingPacketReader.java:41)
com.mysql.cj.protocol.a.TimeTrackingPacketReader.readMessage(TimeTrackingPacketReader.java:62)
com.mysql.cj.protocol.a.SimplePacketReader.readMessage(SimplePacketReader.java:45)
com.mysql.cj.protocol.a.SimplePacketReader.readMessage(SimplePacketReader.java:102)
com.mysql.cj.protocol.a.SimplePacketReader.readMessageLocal(SimplePacketReader.java:137)
com.mysql.cj.protocol.FullReadInputStream.readFully(FullReadInputStream.java:64)
java.io.FilterInputStream.read(Unknown Source:0)
sun.security.ssl.SSLSocketImpl$AppInputStream.read(Unknown Source:0)
sun.security.ssl.SSLSocketImpl.readApplicationRecord(Unknown Source:0)
sun.security.ssl.SSLSocketInputRecord.bytesInCompletePacket(Unknown Source:0)
sun.security.ssl.SSLSocketInputRecord.readHeader(Unknown Source:0)
sun.security.ssl.SSLSocketInputRecord.read(Unknown Source:0)
java.net.SocketInputStream.read(Unknown Source:0)
java.net.SocketInputStream.read(Unknown Source:0)
java.lang.ThreadLocal.get(Unknown Source:0)
We can interpret the stack trace as follows:
- When starting a new Door Game, a call is made to load user data.
- This results in executing a SQL query to load the user data (which is related to the slow SQL query we saw earlier).
- We then see calls to read data in from the database.
So, what does this all mean? It means that our application startup is slow since it’s spending time loading user data. In fact, the profiler has told us the exact line of code where this happens:
com.splunk.profiling.workshop.UserData.loadUserData(UserData.java:33)
Let’s open the corresponding source file (./doorgame/src/main/java/com/splunk/profiling/workshop/UserData.java) and look at this code in more detail:
public class UserData {

    static final String DB_URL = "jdbc:mysql://mysql/DoorGameDB";
    static final String USER = "root";
    static final String PASS = System.getenv("MYSQL_ROOT_PASSWORD");
    static final String SELECT_QUERY = "select * FROM DoorGameDB.Users, DoorGameDB.Organizations";

    HashMap<String, User> users;

    public UserData() {
        users = new HashMap<String, User>();
    }

    public void loadUserData() {

        // Load user data from the database and store it in a map
        Connection conn = null;
        Statement stmt = null;
        ResultSet rs = null;

        try{
            conn = DriverManager.getConnection(DB_URL, USER, PASS);
            stmt = conn.createStatement();
            rs = stmt.executeQuery(SELECT_QUERY);
            while (rs.next()) {
                User user = new User(rs.getString("UserId"), rs.getString("FirstName"), rs.getString("LastName"));
                users.put(rs.getString("UserId"), user);
            }
Here we can see the application logic in action. It establishes a connection to the database, then executes the SQL query we saw earlier:
select * FROM DoorGameDB.Users, DoorGameDB.Organizations
It then loops through each of the results, and loads each user into a HashMap object, which is a collection of User objects.
We have a good understanding of why the game startup sequence is so slow, but how do we fix it?
For more clues, let’s have a look at the other part of AlwaysOn Profiling: memory profiling. To do this, click on the Memory tab in AlwaysOn profiling:
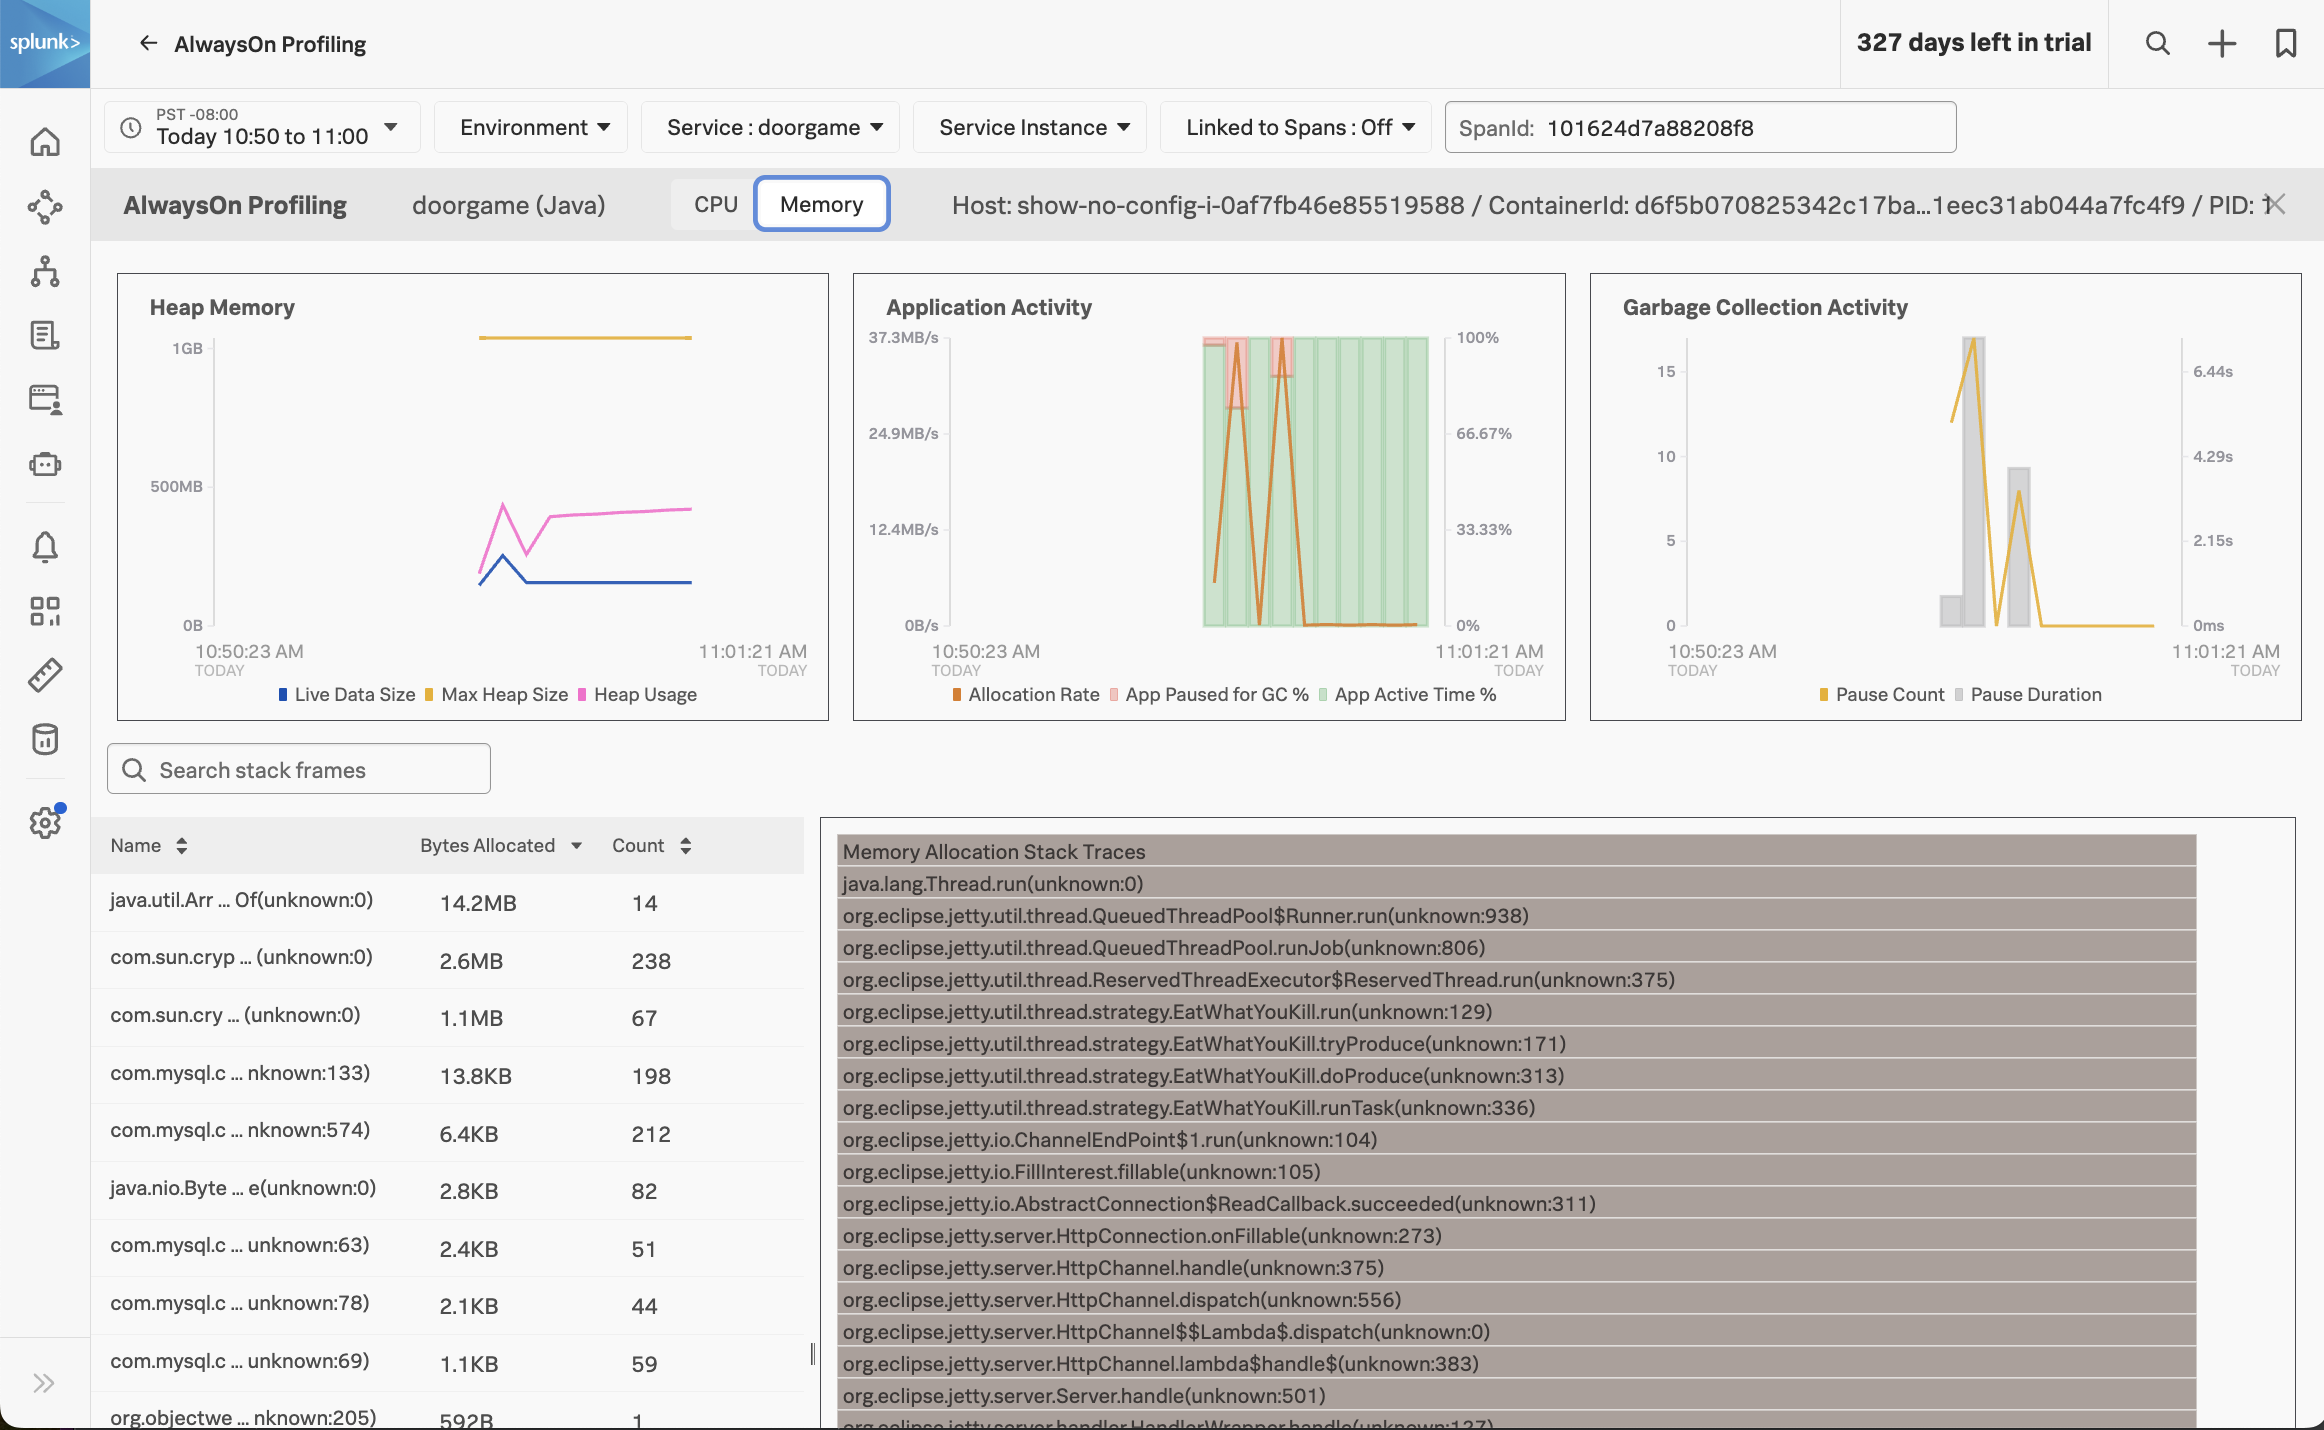
At the top of this view, we can see how much heap memory our application is using, the heap memory allocation rate, and garbage collection activity.
We can see that our application is using about 400 MB out of the max 1 GB heap size, which seems excessive for such a simple application. We can also see that some garbage collection occurred, which caused our application to pause (and probably annoyed those wanting to play the Game Door).
At the bottom of the screen, which can see which methods in our Java application code are associated with the most heap memory usage. Click on the first item in the list to show the Memory Allocation Stack Traces associated with the java.util.Arrays.copyOf method specifically:

With help from the profiler, we can see that the loadUserData method not only consumes excessive CPU time, but it also consumes excessive memory when storing the user data in the HashMap collection object.
What did we accomplish?
We’ve come a long way already!
- We learned how to enable the profiler in the Splunk OpenTelemetry Java instrumentation agent.
- We learned how to verify in the agent output that the profiler is enabled.
- We have explored several profiling related workflows in APM:
- How to navigate to AlwaysOn Profiling from the troubleshooting view
- How to explore the flamegraph and method call duration table through navigation and filtering
- How to identify when a span has sampled call stacks associated with it
- How to explore heap utilization and garbage collection activity
- How to view memory allocation stack traces for a particular method
In the next section, we’ll apply a fix to our application to resolve the slow startup performance.
Fix Application Startup Slowness
10 minutes
In this section, we’ll use what we learned from the profiling data in Splunk Observability Cloud to resolve the slowness we saw when starting our application.
Examining the Source Code
Open the corresponding source file once again (./doorgame/src/main/java/com/splunk/profiling/workshop/UserData.java) and focus on the following code:
public class UserData {

    static final String DB_URL = "jdbc:mysql://mysql/DoorGameDB";
    static final String USER = "root";
    static final String PASS = System.getenv("MYSQL_ROOT_PASSWORD");
    static final String SELECT_QUERY = "select * FROM DoorGameDB.Users, DoorGameDB.Organizations";

    HashMap<String, User> users;

    public UserData() {
        users = new HashMap<String, User>();
    }

    public void loadUserData() {

        // Load user data from the database and store it in a map
        Connection conn = null;
        Statement stmt = null;
        ResultSet rs = null;

        try{
            conn = DriverManager.getConnection(DB_URL, USER, PASS);
            stmt = conn.createStatement();
            rs = stmt.executeQuery(SELECT_QUERY);
            while (rs.next()) {
                User user = new User(rs.getString("UserId"), rs.getString("FirstName"), rs.getString("LastName"));
                users.put(rs.getString("UserId"), user);
            }
After speaking with a database engineer, you discover that the SQL query being executed includes a cartesian join:
select * FROM DoorGameDB.Users, DoorGameDB.Organizations
Cartesian joins are notoriously slow, and shouldn’t be used, in general.
Upon further investigation, you discover that there are 10,000 rows in the user table, and 1,000 rows in the organization table. When we execute a cartesian join using both of these tables, we end up with 10,000 x 1,000 rows being returned, which is 10,000,000 rows!
Furthermore, the query ends up returning duplicate user data, since each record in the user table is repeated for each organization.
So when our code executes this query, it tries to load 10,000,000 user objects into the HashMap, which explains why it takes so long to execute, and why it consumes so much heap memory.
Let’s Fix That Bug
After consulting the engineer that originally wrote this code, we determined that the join with the Organizations table was inadvertent.
So when loading the users into the HashMap, we simply need to remove this table from the query.
Open the corresponding source file once again (./doorgame/src/main/java/com/splunk/profiling/workshop/UserData.java) and change the following line of code:
static final String SELECT_QUERY = "select * FROM DoorGameDB.Users, DoorGameDB.Organizations";
to:
static final String SELECT_QUERY = "select * FROM DoorGameDB.Users";
Now the method should perform much more quickly, and less memory should be used, as it’s loading the correct number of users into the HashMap (10,000 instead of 10,000,000).
Rebuild and Redeploy Application
Let’s test our changes by using the following commands to re-build and re-deploy the Door Game application:
cd workshop/profiling
./5-redeploy-doorgame.sh
Once the application has been redeployed successfully, visit The Door Game again to confirm that your fix is in place:
http://<your IP address>:81
Clicking Let's Play should take us to the game more quickly now (though performance could still be improved):

Start the game a few more times, then return to Splunk Observability Cloud to confirm that the latency of the GET new-game operation has decreased.
What did we accomplish?
- We discovered why our SQL query was so slow.
- We applied a fix, then rebuilt and redeployed our application.
- We confirmed that the application starts a new game more quickly.
In the next section, we’ll explore continue playing the game and fix any remaining performance issues that we find.
Fix In Game Slowness
10 minutes
Now that our game startup slowness has been resolved, let’s play several rounds of the Door Game and ensure the rest of the game performs quickly.
As you play the game, do you notice any other slowness? Let’s look at the data in Splunk Observability Cloud to put some numbers on what we’re seeing.
Navigate to APM then click on Traces on the right-hand side of the screen. Sort the traces by Duration in descending order:
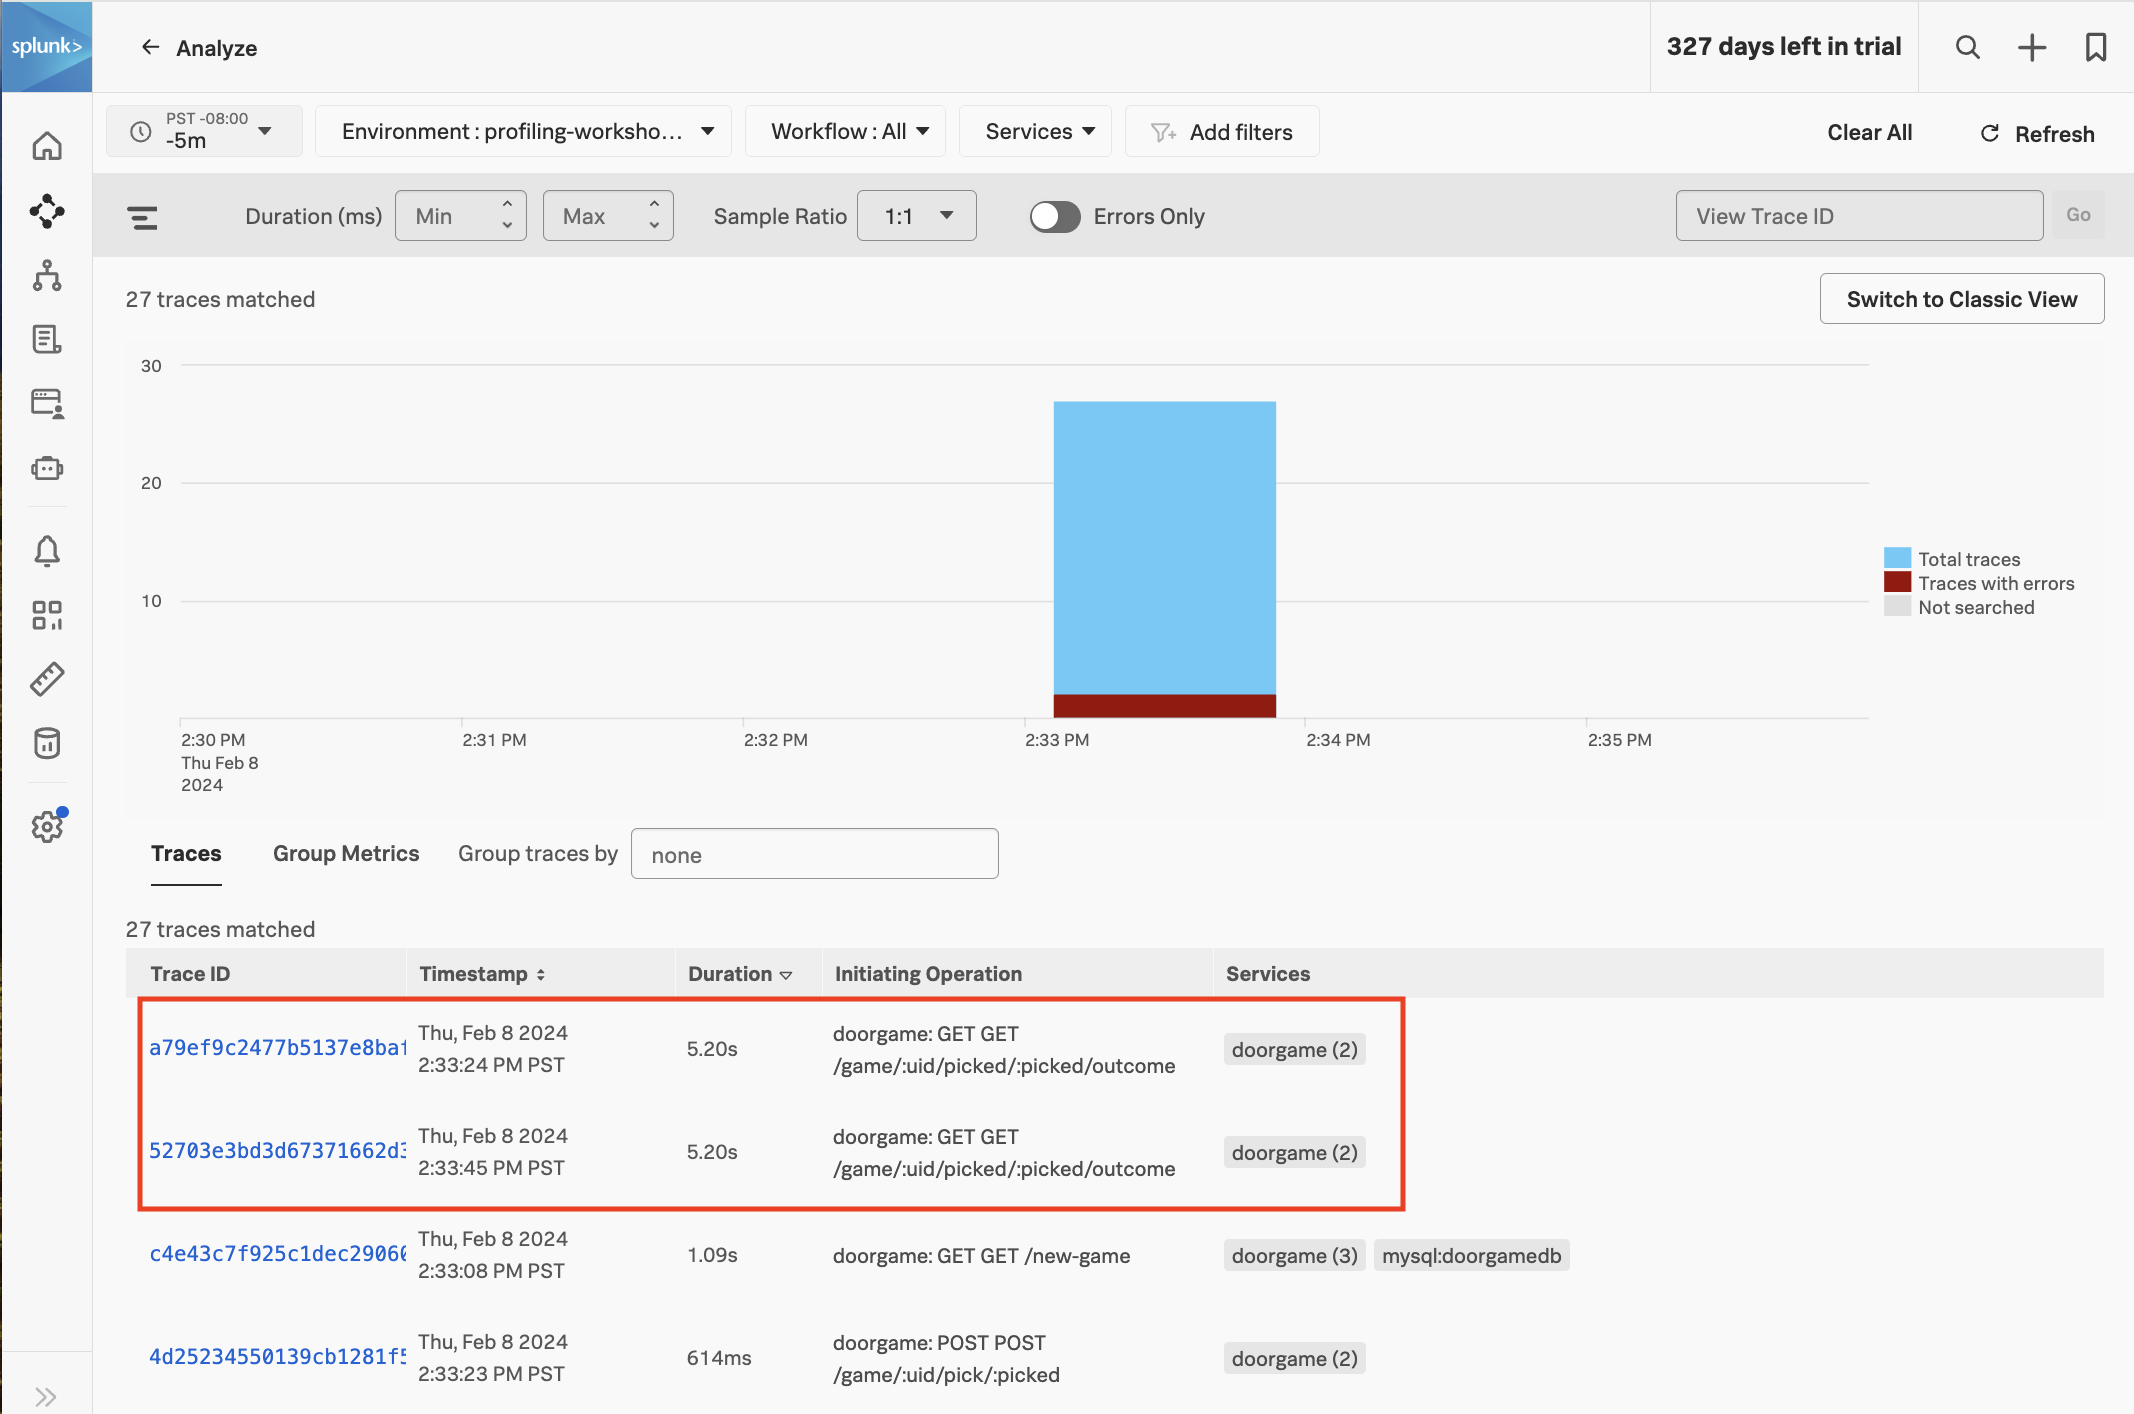
We can see that a few of the traces with an operation of GET /game/:uid/picked/:picked/outcome have a duration of just over five seconds. This explains why we’re still seeing some slowness when we play the app (note that the slowness is no longer on the game startup operation, GET /new-game, but rather a different operation used while actually playing the game).
Let’s click on one of the slow traces and take a closer look. Since profiling is still enabled, call stacks have been captured as part of this trace. Click on the child span in the waterfall view, then click CPU Stack Traces:

At the bottom of the call stack, we can see that the thread was busy sleeping:
com.splunk.profiling.workshop.ServiceMain$$Lambda$.handle(Unknown Source:0)
com.splunk.profiling.workshop.ServiceMain.lambda$main$(ServiceMain.java:34)
com.splunk.profiling.workshop.DoorGame.getOutcome(DoorGame.java:41)
com.splunk.profiling.workshop.DoorChecker.isWinner(DoorChecker.java:14)
com.splunk.profiling.workshop.DoorChecker.checkDoorTwo(DoorChecker.java:30)
com.splunk.profiling.workshop.DoorChecker.precheck(DoorChecker.java:36)
com.splunk.profiling.workshop.Util.sleep(Util.java:9)
java.util.concurrent.TimeUnit.sleep(Unknown Source:0)
java.lang.Thread.sleep(Unknown Source:0)
java.lang.Thread.sleep(Native Method:0)
The call stack tells us a story – reading from the bottom up, it lets us describe
what is happening inside the service code. A developer, even one unfamiliar with the
source code, should be able to look at this call stack to craft a narrative like:
We are getting the outcome of a game. We leverage the DoorChecker to
see if something is the winner, but the check for door two somehow issues
a precheck() that, for some reason, is deciding to sleep for a long time.
Our workshop application is left intentionally simple – a real-world service might see the
thread being sampled during a database call or calling into an un-traced external service.
It is also possible that a slow span is executing a complicated business process,
in which case maybe none of the stack traces relate to each other at all.
The longer a method or process is, the greater chance we will have call stacks
sampled during its execution.
Let’s Fix That Bug
By using the profiling tool, we were able to determine that our application is slow
when issuing the DoorChecker.precheck() method from inside DoorChecker.checkDoorTwo().
Let’s open the doorgame/src/main/java/com/splunk/profiling/workshop/DoorChecker.java source file in our editor.
By quickly glancing through the file, we see that there are methods for checking
each door, and all of them call precheck(). In a real service, we might be uncomfortable
simply removing the precheck() call because there could be unseen/unaccounted side
effects.
Down on line 29 we see the following:
    private boolean checkDoorTwo(GameInfo gameInfo) {
        precheck(2);
        return gameInfo.isWinner(2);
    }

    private void precheck(int doorNum) {
        long extra = (int)Math.pow(70, doorNum);
        sleep(300 + extra);
    }
With our developer hat on, we notice that the door number is zero based, so
the first door is 0, the second is 1, and the 3rd is 2 (this is conventional).
The extra value is used as extra/additional sleep time, and it is computed by taking
70^doorNum (Math.pow performs an exponent calculation). That’s odd, because this means:
- door 0 => 70^0 => 1ms
- door 1 => 70^1 => 70ms
- door 2 => 70^2 => 4900ms
We’ve found the root cause of our slow bug! This also explains why the first two doors
weren’t ever very slow.
We have a quick chat with our product manager and team lead, and we agree that the precheck()
method must stay but that the extra padding isn’t required. Let’s remove the extra variable
and make precheck now read like this:
    private void precheck(int doorNum) {
        sleep(300);
    }
Now all doors will have a consistent behavior. Save your work and then rebuild and redeploy the application using the following command:
cd workshop/profiling
./5-redeploy-doorgame.sh
Once the application has been redeployed successfully, visit The Door Game again to confirm that your fix is in place:
http://<your IP address>:81
What did we accomplish?
- We found another performance issue with our application that impacts game play.
- We used the CPU call stacks included in the trace to understand application behavior.
- We learned how the call stack can tell us a story and point us to suspect lines of code.
- We identified the slow code and fixed it to make it faster.
Summary
3 minutes
In this workshop, we accomplished the following:
- We deployed our application and captured traces with Splunk Observability Cloud.
- We used Database Query Performance to find a slow-running query that impacted the game startup time.
- We enabled AlwaysOn Profiling and used it to confirm which line of code was causing the increased startup time and memory usage.
- We found another application performance issue and used AlwaysOn Profiling again to find the problematic line of code.
- We applied fixes for both of these issues and verified the result using Splunk Observability Cloud.
Enabling AlwaysOn Profiling and utilizing Database Query Performance for your applications will let you get even more value from the data you’re sending to Splunk Observability Cloud.
Now that you’ve completed this workshop, you have the knowledge you need to start collecting deeper diagnostic data from your own applications!
To get started with Database Query Performance today, check out Monitor Database Query Performance.
And to get started with AlwaysOn Profiling, check out Introduction to AlwaysOn Profiling for Splunk APM
For more help, feel free to ask a Splunk Expert.