Synthetics

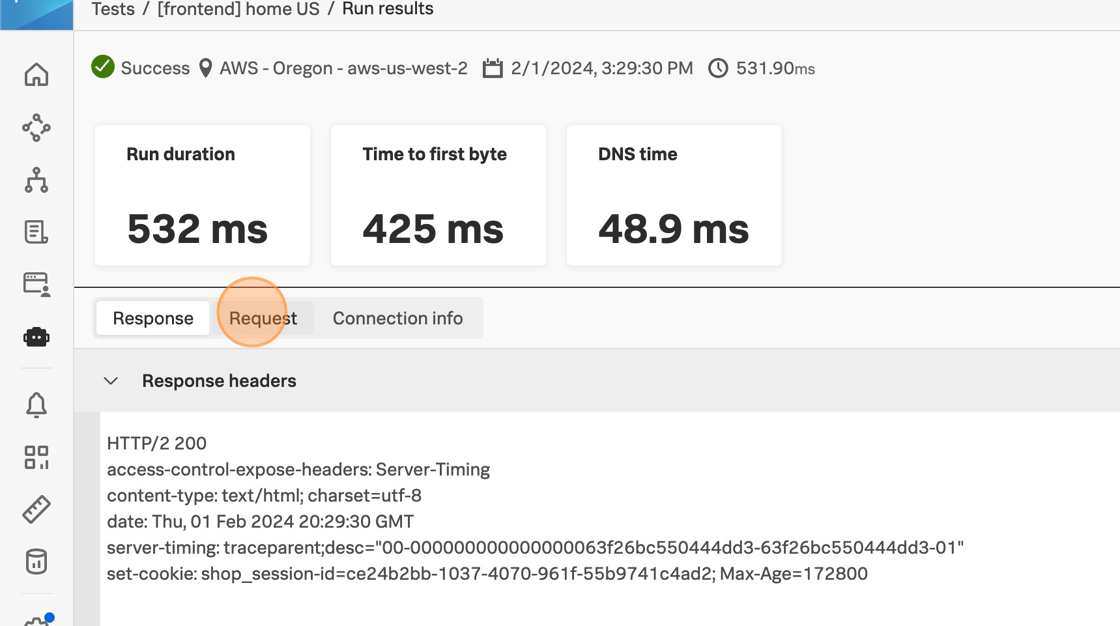
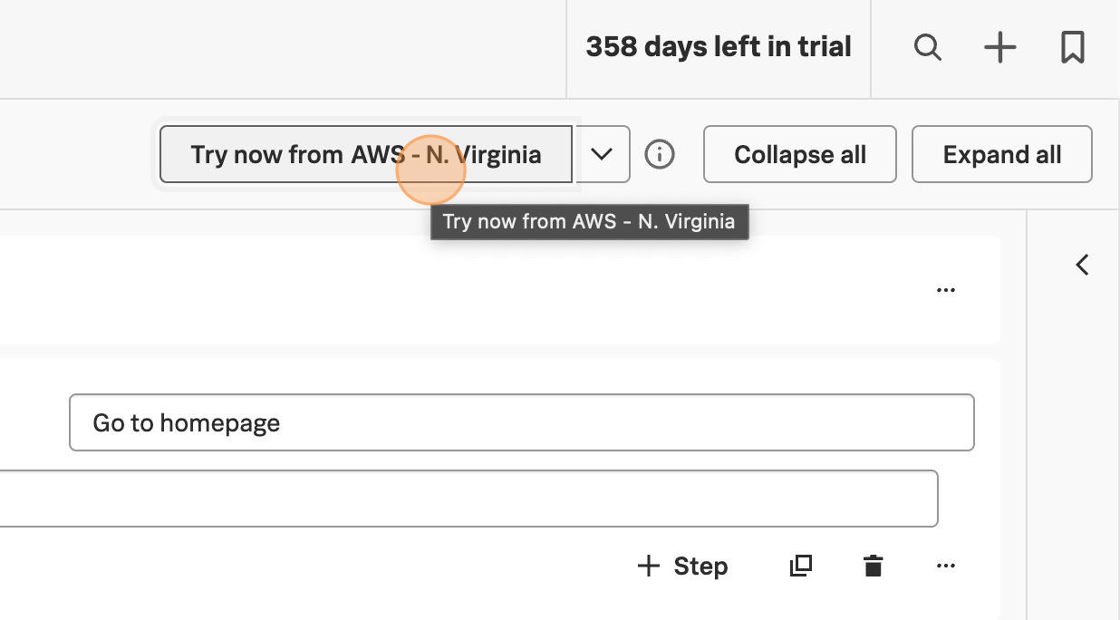
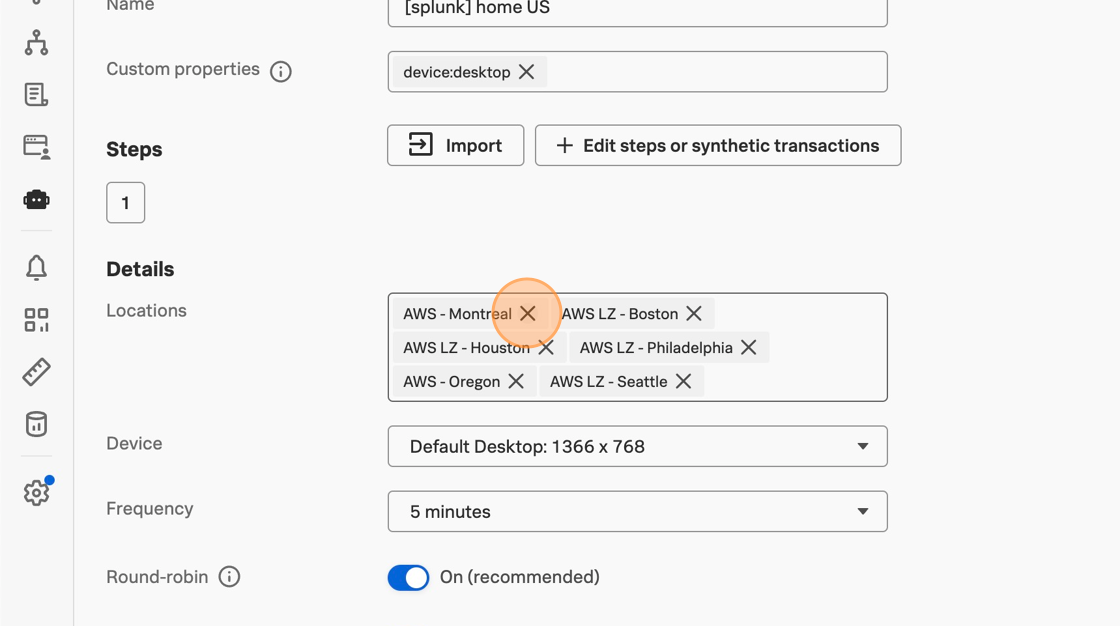
Let’s quickly set up some tests in Synthetics to immediately start understanding our end user experience, without waiting for real users to interact with our app.

We can capture not only the performance and availability of our own apps and endpoints, but also those third parties we rely on any time of the day or night.

Tip

If you find that your tests are being bot-blocked, see the docs for tips on how to allow Synthetic testing. if you need to test something that is not accessible externally, see private location instructions.

Last Modified Mar 19, 2024

Subsections of Synthetics

Uptime Test

5 minutes  

Introduction

The simplest way to keep an eye on endpoint availability is with an Uptime test. This lightweight test can run internally or externally around the world, as frequently as every minute. Because this is the easiest (and cheapest!) test to set up, and because this is ideal for monitoring availability of your most critical enpoints and ports, let’s start here.

Pre-requisites

  • Publicly accessible HTTP(S) endpoint(s) to test
  • Access to Splunk Observability Cloud
Last Modified Apr 2, 2024

Subsections of Uptime Test

Creating a test

  1. Open Synthetics o11y nav with Synthetics icon highlighted

  2. Click the Add new test button on the right side of the screen, then select Uptime and HTTP test. image image

  3. Name your test with your team name (provided by your workshop instructor), your initials, and any other details you’d like to include, like geographic region.

  4. For now let’s test a GET request. Fill in the URL field. You can use one of your own, or one of ours like https://online-boutique-eu.splunko11y.com, https://online-boutique-us.splunko11y.com, or https://www.splunk.com.

  5. Click Try now to validate that the endpoint is accessible before the selected location before saving the test. Try now does not count against your subscription usage, so this is a good practice to make sure you’re not wasting real test runs on a misconfigured test. image image

    Tip

    A common reason for Try now to fail is that there is a non-2xx response code. If that is expected, add a Validation for the correct response code.

  6. Add any additional validations needed, for example: response code, response header, and response size. Advanced settings for test configuration Advanced settings for test configuration

  7. Add and remove any locations you’d like. Keep in mind where you expect your endpoint to be available.

  8. Change the frequency to test your more critical endpoints more often, up to one minute. image image

  9. Make sure “Round-robin” is on so the test will run from one location at a time, rather than from all locations at once.

    • If an endpoint is highly critical, think about if it is worth it to have all locations tested at the same time every single minute. If you have automations built in with a webhook from a detector, or if you have strict SLAs you need to track, this could be worth it to have as much coverage as possible. But if you are doing more manual investigation, or if this is a less critical endpoint, you could be wasting test runs that are executing while an issue is being investigated.
    • Remember that your license is based on the number of test runs per month. Turning Round-robin off will multiply the number of test runs by the number of locations you have selected.
  10. When you are ready for the test to start running, make sure “Active” is on, then scroll down and click Submit to save the test configuration. image image

Now the test will start running with your saved configuration. Take a water break, then we’ll look at the results!

Last Modified Apr 27, 2024

Understanding results

  1. Click into a test summary view and play with the Performance KPIs chart filters to see how you can slice and dice your data. This is a good place to get started understanding trends. Later, we will see what custom charts look like, so you can tailor dashboards to the KPIs you care about most. KPI chart filters KPI chart filters

    Workshop Question: Using the Performance KPIs chart

    What metrics are available? Is your data consistent across time and locations? Do certain locations run slower than others? Are there any spikes or failures?

  2. Click into a recent run either in the chart or in the table below. image image

  3. If there are failures, look at the response to see if you need to add a response code assertion (302 is a common one), if there is some authorization needed, or different request headers added. Here we have information about this particular test run including if it succeeded or failed, the location, timestamp, and duration in addition to the other Uptime test metrics. Click through to see the response, request, and connection info as well. image image If you need to edit the test for it to run successfully, click the test name in the top left breadcrumb on this run result page, then click Edit test on the top right of the test overview page. Remember to scroll down and click Submit to save your changes after editing the test configuration.

  4. In addition to the test running successfully, there are other metrics to measure the health of your endpoints. For example, Time to First Byte(TTFB) is a great indicator of performance, and you can optimize TTFB to improve end user experience.

  5. Go back to the test overview page and change the Performance KPIs chart to display First Byte time, and change the interval if needed to better see trends in the data. Performance KPIs for Uptime Tests Performance KPIs for Uptime Tests In the example above, we can see that TTFB varies consistently between locations. Knowing this, we can keep location in mind when reporting on metrics. We could also improve the experience, for example by serving users in those locations an endpoint hosted closer to them, which should reduce network latency. We can also see some slight variations in the results over time, but overall we already have a good idea of our baseline for this endpoint’s KPIs. When we have a baseline, we can alert on worsening metrics as well as visualize improvements.

    Tip

    We are not setting a detector on this test yet, to make sure it is running consistently and successfully. If you are testing a highly critical endpoint and want to be alerted on it ASAP (and have tolerance for potential alert noise), jump to Single Test Detectors.

Once you have your Uptime test running successfully, let’s move on to the next test type.

Last Modified Mar 21, 2024

API Test

5 minutes  

The API test provides a flexible way to check the functionality and performance of API endpoints. The shift toward API-first development has magnified the necessity to monitor the back-end services that provide your core front-end functionality.

Whether you’re interested in testing multi-step API interactions or you want to gain visibility into the performance of your endpoints, the API Test can help you accomplish your goals.

This excercise will walk through a multi-step test on the Spotify API. You can also use it as a reference to build tests on your own APIs or on those of your critical third parties.

API test result API test result

Last Modified Apr 2, 2024

Subsections of API Test

Global Variables

Global variables allow us to use stored strings in multiple tests, so we only need to update them in one place.

View the global variable that we’ll use to perform our API test. Click on Global Variables under the cog icon. The global variable named env.encoded_auth will be the one that we’ll use to build the spotify API transaction.

placeholder placeholder

Last Modified Mar 21, 2024

Create new API test

Create a new API test by clicking on the Add new test button and select API test from the dropdown. Name the test using your team name, your initials, and Spotify API e.g. [Daisy] RWC - Spotify API

placeholder placeholder

Last Modified Mar 21, 2024

Authentication Request

Click on + Add requests and enter the request step name e.g. Authenticate with Spotify API.

placeholder placeholder

Expand the Request section, from the drop-down change the request method to POST and enter the following URL:

https://accounts.spotify.com/api/token

In the Payload body section enter the following:

grant_type=client_credentials

Next, add two + Request headers with the following key/value pairings:

  • CONTENT-TYPE: application/x-www-form-urlencoded
  • AUTHORIZATION: Basic {{env.encoded_auth}}

Expand the Validation section and add the following extraction:

  • Extract from Response body JSON $.access_token as access_token

This will parse the JSON payload that is received from the Spotify API, extract the access token and store it as a custom variable.

Add payload token Add payload token

Last Modified Mar 21, 2024

Search Request

Click on + Add Request to add the next step. Name the step Search for Tracks named “Up around the bend”.

Expand the Request section and change the request method to GET and enter the following URL:

https://api.spotify.com/v1/search?q=Up%20around%20the%20bend&type=track&offset=0&limit=5

Next, add two request headers with the following key/value pairings:

  • CONTENT-TYPE: application/json
  • AUTHORIZATION: Bearer {{custom.access_token}}
    • This uses the custom variable we created in the previous step!

Add search request Add search request

Expand the Validation section and add the following extraction:

  • Extract from Response body JSON $.tracks.items[0].id as track.id

Add search payload Add search payload

To validate the test before saving, change the location as needed and click Try now. See the docs for more information on the try now feature.

try now try now

When the validation is successful, click on < Return to test to return to the test configuration page. And then click Save to save the API test.

Extra credit

Have more time to work on this test? Take a look at the Response Body in one of your run results. What additional steps would make this test more thorough? Edit the test, and use the Try now feature to validate any changes you make before you save the test.

Last Modified Mar 21, 2024

View results

Wait for a few minutes for the test to provision and run. Once you see the test has run successfully, click on the run to view the results:

API test result API test result

Resources

Last Modified Mar 21, 2024

Single Page Browser Test

5 minutes  

We have started testing our endpoints, now let’s test the front end browser experience.

Starting with a single page browser test will let us capture how first- and third-party resources impact how our end users experience our browser-based site. It also allows us to start to understand our user experience metrics before introducing the complexity of multiple steps in one test.

A page where your users commonly “land” is a good choice to start with a single page test. This could be your site homepage, a section main page, or any other high-traffic URL that is important to you and your end users.

  1. Click Add new test and select Browser test

  2. Include your team name and initials in the test name. Add to the Name and Custom properties to describe the scope of the test (like Desktop for device type). Then click + Edit steps

  3. Change the transaction label (top left) and step name (on the right) to something readable that describes the step. Add the URL you’d like to test. Your workshop instructor can provide you with a URL as well. In the below example, the transaction is “Home” and the step name is “Go to homepage”.

    Transaction and step label Transaction and step label

  4. To validate the test, change the location as needed and click Try now. See the docs for more information on the try now feature.

  5. Wait for the test validation to complete. If the test validation failed, double check your URL and test location and try again. With Try now you can see what the result of the test will be if it were saved and run as-is.

    Try Now browser test results Try Now browser test results

  6. Click < Return to test to continue the configuration.

  7. Edit the locations you want to use, keeping in mind any regional rules you have for your site.

  8. You can edit the Device and Frequency or leave them at their default values for now. Click Submit to save the test and start running it.

Bonus Exercise

Have a few spare seconds? Copy this test and change just the title and device type, and save. Now you have visibility into the end user experience on another device and connection speed!

While our Synthetic tests are running, let’s see how RUM is instrumented to start getting data from our real users.