Subsections of RUM
Overview
The aim of this Splunk Real User Monitoring (RUM) workshop is to let you:
- Shop for items on the Online Boutique to create traffic, and create RUM User Sessions that you can view in the Splunk Observability Suite.
- See an overview of the performance of all your application(s) in the Application Summary Dashboard
- Examine the performance of a specific website with RUM metrics.
In order to reach this goal, we will use an online boutique to order various products. While shopping on the online boutique you will create what is called a User Session.
You may encounter some issues with this web site, and you will use Splunk RUM to identify the issues, so they can be resolved by the developers.
The workshop host will provide you with a URL for an online boutique store that has RUM enabled.
Each of these Online Boutiques are also being visited by a few synthetic users; this will allow us to generate more live data to be analyzed later.
RUM instrumentation in a browser app
- Check the HEAD section of the Online-boutique webpage in your browser
- Find the code that instruments RUM
1. Browse to the Online Boutique
Your workshop instructor will provide you with the Online Boutique URL that has RUM installed so that you can complete the next steps.
2. Inspecting the HTML source
The changes needed for RUM are placed in the <head> section of the hosts Web page. Right click to view the page source or to inspect the code. Below is an example of the <head> section with RUM:
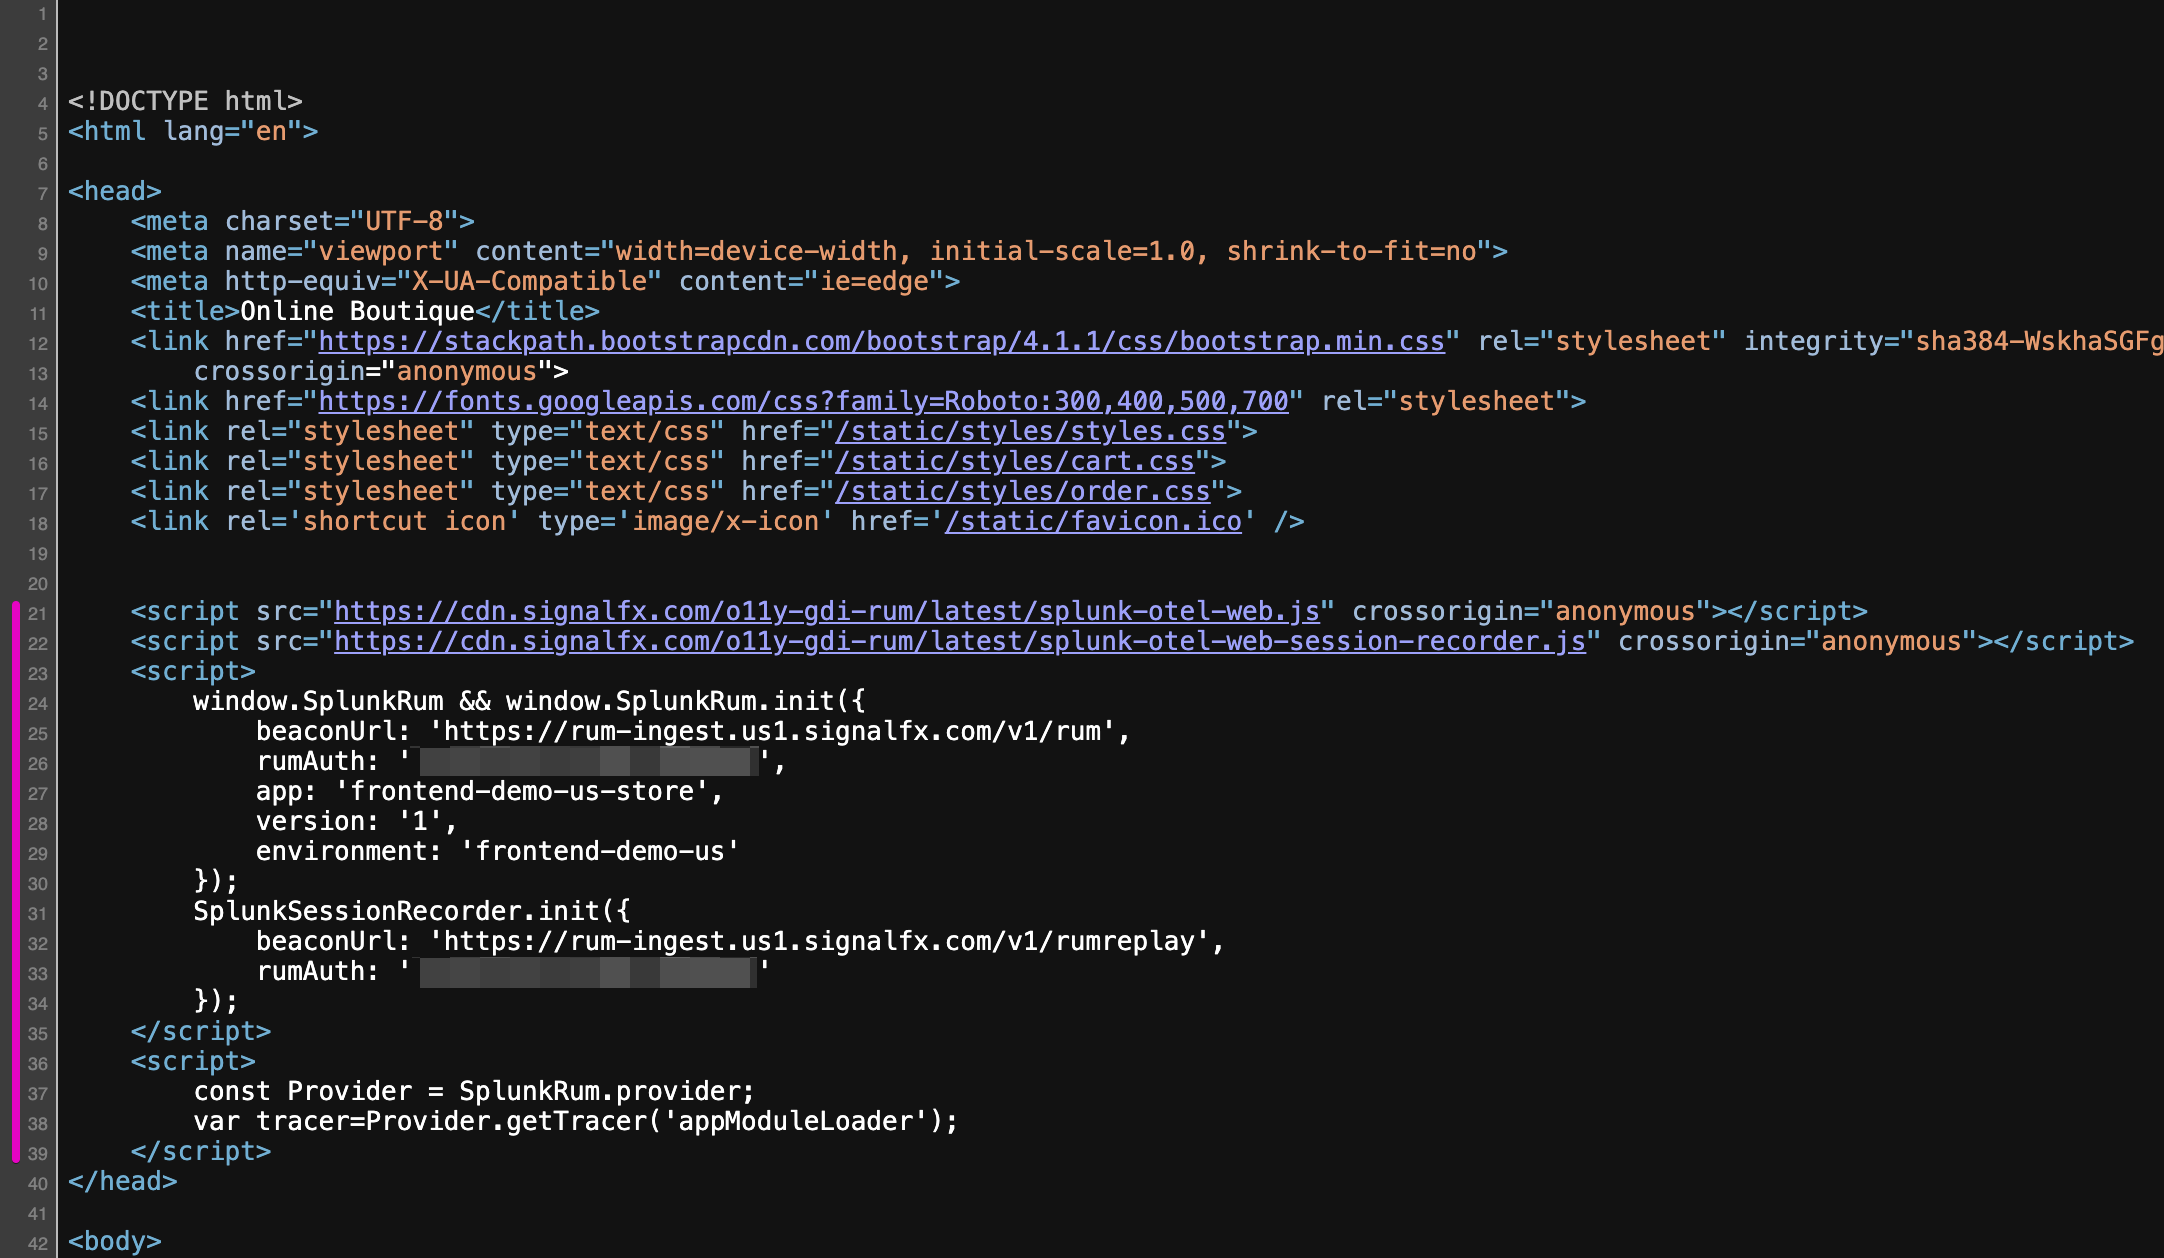
This code enables RUM Tracing, Session Replay, and Custom Events to better understand performance in the context of user workflows:
- The first part is to indicate where to download the Splunk Open Telemetry Javascript file from:
https://cdn.signalfx.com/o11y-gdi-rum/latest/splunk-otel-web.js (this can also be hosted locally if so required). - The next section defines the location where to send the traces to in the beacon url:
{beaconUrl: "https://rum-ingest.eu0.signalfx.com/v1/rum" - The RUM Access Token:
rumAuth: "<redacted>". - Identification tags
app and environment to indentify in the SPLUNK RUM UI e.g. app: "online-boutique-us-store", environment: "online-boutique-us"} (these values will be different in your workshop)
The above lines 21 and 23-30 are all that is required to enable RUM on your website!
Lines 22 and 31-34 are optional if you want Session Replay instrumented.
Line 36-39 var tracer=Provider.getTracer('appModuleLoader'); will add a Custom Event for every page change, allowing you to better track your website conversions and usage. This may or may not be instrumented for this workshop.
Exercise
Time to shop! Take a minute to open the workshop store URL in as many browsers and devices as you’d like, shop around, add items to cart, checkout, and feel free to close the shopping browsers when you’re finished. Keep in mind this is a lightweight demo shop site, so don’t be alarmed if the cart doesn’t match the item you picked!
RUM Landing Page
- Visit the RUM landing page and and check the overview of the performance of all your RUM enabled applications with the Application Summary Dashboard (Both Mobile and Web based)
1. Visit the RUM Landing Page
Login into Splunk Observability. From the left side menu bar select RUM  . This will bring you to your the RUM Landing Page.
The goal of this page is to give you in a single page, a clear indication of the health, performance and potential errors found in your application(s) and allow you to dive deeper into the information about your User Sessions collected from your web page/App. You will have a pane for each of your active RUM applications. (The view below is the default expanded view)
If you have multiple applications, (which will be the case when every attendee is using their own ec2 instance for the RUM workshop), the pane view may be automatically reduced by collapsing the panes as shown below:

You can expanded a condensed RUM Application Summary View to the full dashboard by clicking on the small browser  or Mobile
  icon. (Depending on the type of application: Mobile or Browser based) on the left in front of the applications name, highlighted by the red arrow.
First find the right application to use for the workshop:
If you are participating in a stand alone RUM workshop, the workshop leader will tell you the name of the application to use, in the case of a combined workshop, it will follow the naming convention we used for IM and APM and use the ec2 node name as a unique id like jmcj-store as shown as the last app in the screenshot above.
RUM Application Summary Dashboard consists of 6 major sections. The first is the selection header, where you can set/filter a number of options:
- A drop down for the Time Window you’re reviewing (You are looking at the past 15 minutes by default)
- A drop down to select the Environment you want to look at. This allows you to focus on just the subset of applications belonging to that environment, or Select all to view all available.
- A drop down list with the various Apps being monitored. You can use the one provided by the workshop host or select your own. This will focus you on just one application.
- A drop down to select the Source, Browser or Mobile applications to view. For the Workshop leave All selected.
- A hamburger menu located at the right of the header allowing you to configure some settings of your Splunk RUM application. (We will visit this in a later section).

For the workshop lets do a deeper dive into the Application Summary screen in the next section: Check Health Browser Application
A common application deployment pattern is to have multiple, distinct application environments that don’t interact directly with each other but that are all being monitored by Splunk APM or RUM: for instance, quality assurance (QA) and production environments, or multiple distinct deployments in different datacenters, regions or cloud providers.
Check Browser Applications health at a glance
- Get familiar with the UI and options available from this landing page
- Identify Page Views/JavaScript Errors and Request/Errors in a single viewCheck the Web Vitals metrics and any Detector that has fired for in relation to your Browser Application
Application Summary Dashboard
As seen in the previous section the RUM Application Summary Dashboard consists of 5 major sections.The first section is the selection header, where you can collapse the Pane via the  Browser icon or the > in front of the application name, which is jmcj-store in the example below. It also provides access to the Application Overview page if you click the link with your application name which is jmcj-store in the example below.
Further, you can also open the Application Overview or App Health Dashboard via the triple dot  menu on the right.

For now, let’s look at the high level information we get on the application summary dashboard.
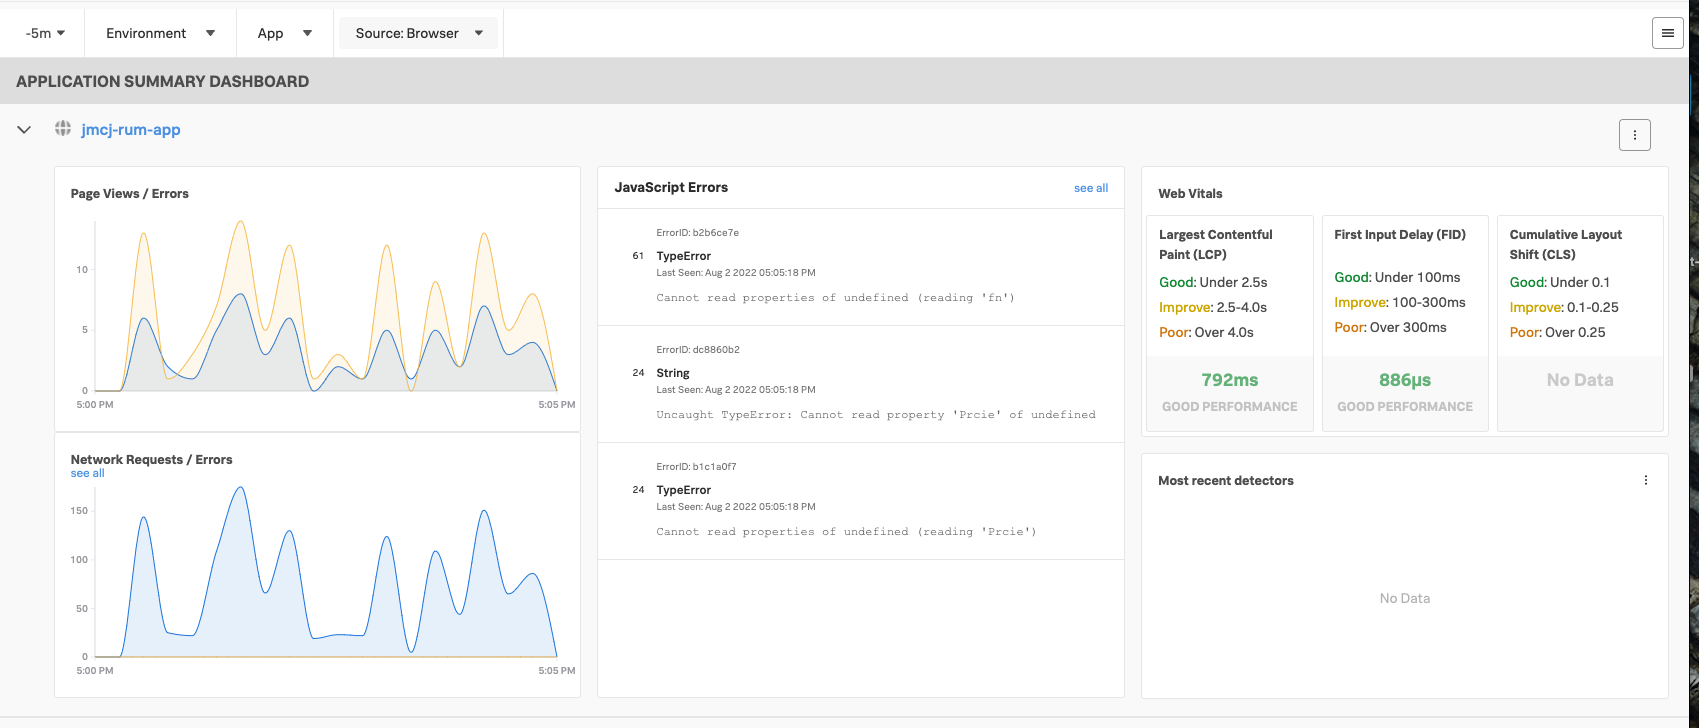
The RUM Application Summary Dashboard is focused on providing you with at a glance highlights of the status of your application.
2. Page Views / JavaScript Errors & Network Requests / Errors
The first section shows Page Views / JavaScript Errors, & Network Requests and Errors charts show the quantity and trend of these issues in your application. This could be Javascript errors, or failed network calls to back end services.
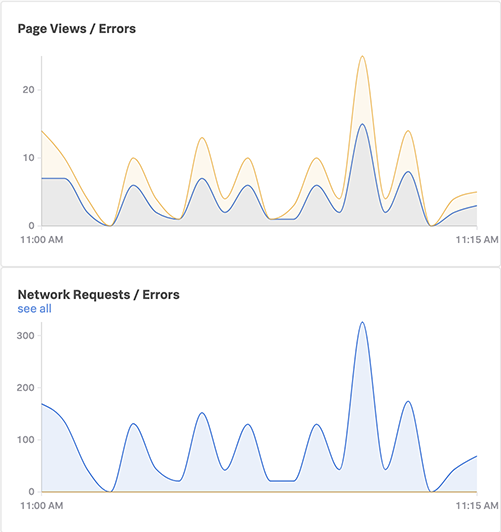
In the example above you can see that there are no failed network calls in the Network chart, but in the Page View chart you can see that a number of pages do experience some errors. These are often not visible for regular users, but can seriously impact the performance of your web site.
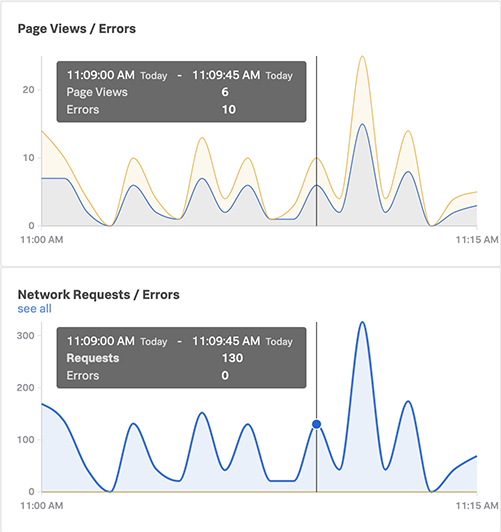
You can see the count of the Page Views / Network Requests / Errors by hovering over the charts.
3. JavaScript Errors
With the second section of the RUM Application Summary Dashboard we are showing you an overview of the JavaScript errors occurring in your application, along with a count of each error.

In the example above you can see there are three JavaScript errors, one that appears 29 times in the selected time slot, and the other two each appear 12 times.
If you click on one of the errors a pop-out opens that will show a summary (below) of the errors over time, along with a Stack Trace of the JavaScript error, giving you an indication of where the problems occurred. (We will see this in more detail in one of the following sections)

4. Web Vitals
The next section of the RUM Application Summary Dashboard is showing you Google’s Core Web Vitals, three metrics that are not only used by Google in its search ranking system, but also quantify end user experience in terms of loading, interactivity, and visual stability.
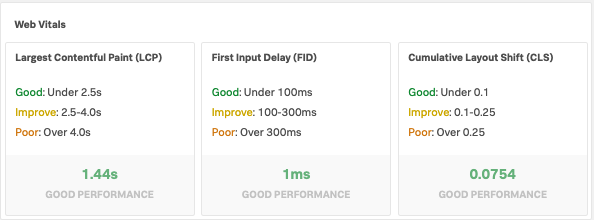
As you can see our site is well behaved and scores Good for all three Metrics. These metrics can be used to identify the effect changes to your application have, and help you improve the performance of your site.
If you click on any of the Metrics shown in the Web Vitals pane you will be taken to the corresponding Tag Spotlight Dashboard. e.g. clicking on the Largest Contentful Paint (LCP) chartlet, you will be taken to a dashboard similar to the screen shot below, that gives you timeline and table views for how this metric has performed. This should allow you to spot trends and identify where the problem may be more common, such as an operating system, geolocation, or browser version.

5. Most Recent Detectors
The final section of the RUM Application Summary Dashboard is focused on providing you an overview of recent detectors that have triggered for your application. We have created a detector for this screen shot but your pane will be empty for now. We will add some detectors to your site and make sure they are triggered in one of the next sections.

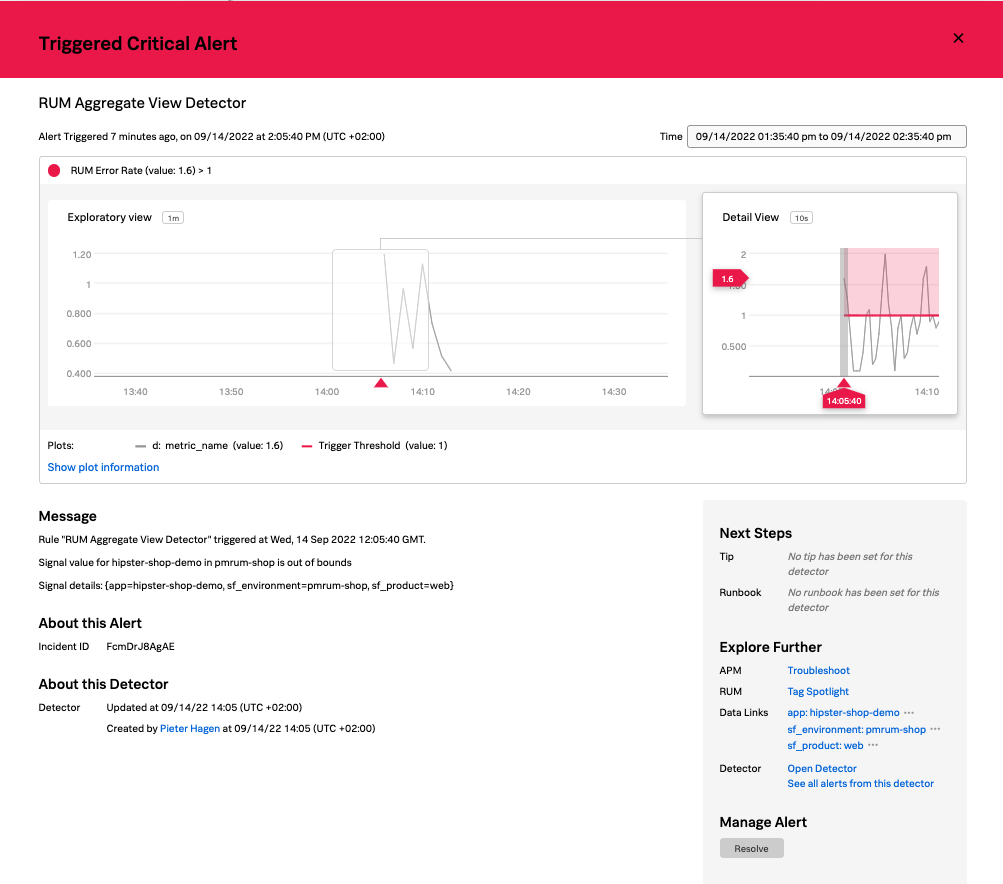
In the screen shot you can see we have a critical alert for the RUM Aggregated View Detector, and a Count, how often this alert has triggered in the selected time window. If you happen to have an alert listed, you can click on the name of the Alert (that is shown as a blue link) and you will be taken to the Alert Overview page showing the details of the alert (Note: this will move you away from the current page, Please use the Back option of your browser to return to the overview page).
Exercise
Please take a few minutes to experiment with the RUM Application Summary Dashboard and the underlying chart and dashboards before going on to the next section.
Analyzing RUM Metrics
- See RUM Metrics and Session information in the RUM UI
- See correlated APM traces in the RUM & APM UI
1. RUM Overview Pages
From your RUM Application Summary Dashboard you can see detailed information by opening the Application Overview Page via the tripple dot  menu on the right by selecting Open Application Overview or by clicking the link with your application name which is jmcj-rum-app in the example below.

This will take you to the RUM Application Overview Page screen as shown below.
2. RUM Browser Overview
The RUM UI consists of five major sections. The first is the selection header, where you can set/filter a number of options:
- A drop down for the time window you’re reviewing (You are looking at the past 15 minutes in this case)
- A drop down to select the Comparison window (You are comparing current performance on a rolling window - in this case compared to 1 hour ago)
- A drop down with the available Environments to view
- A drop down list with the Various Web apps
- Optionally a drop down to select Browser or Mobile metrics (Might not be available in your workshop)

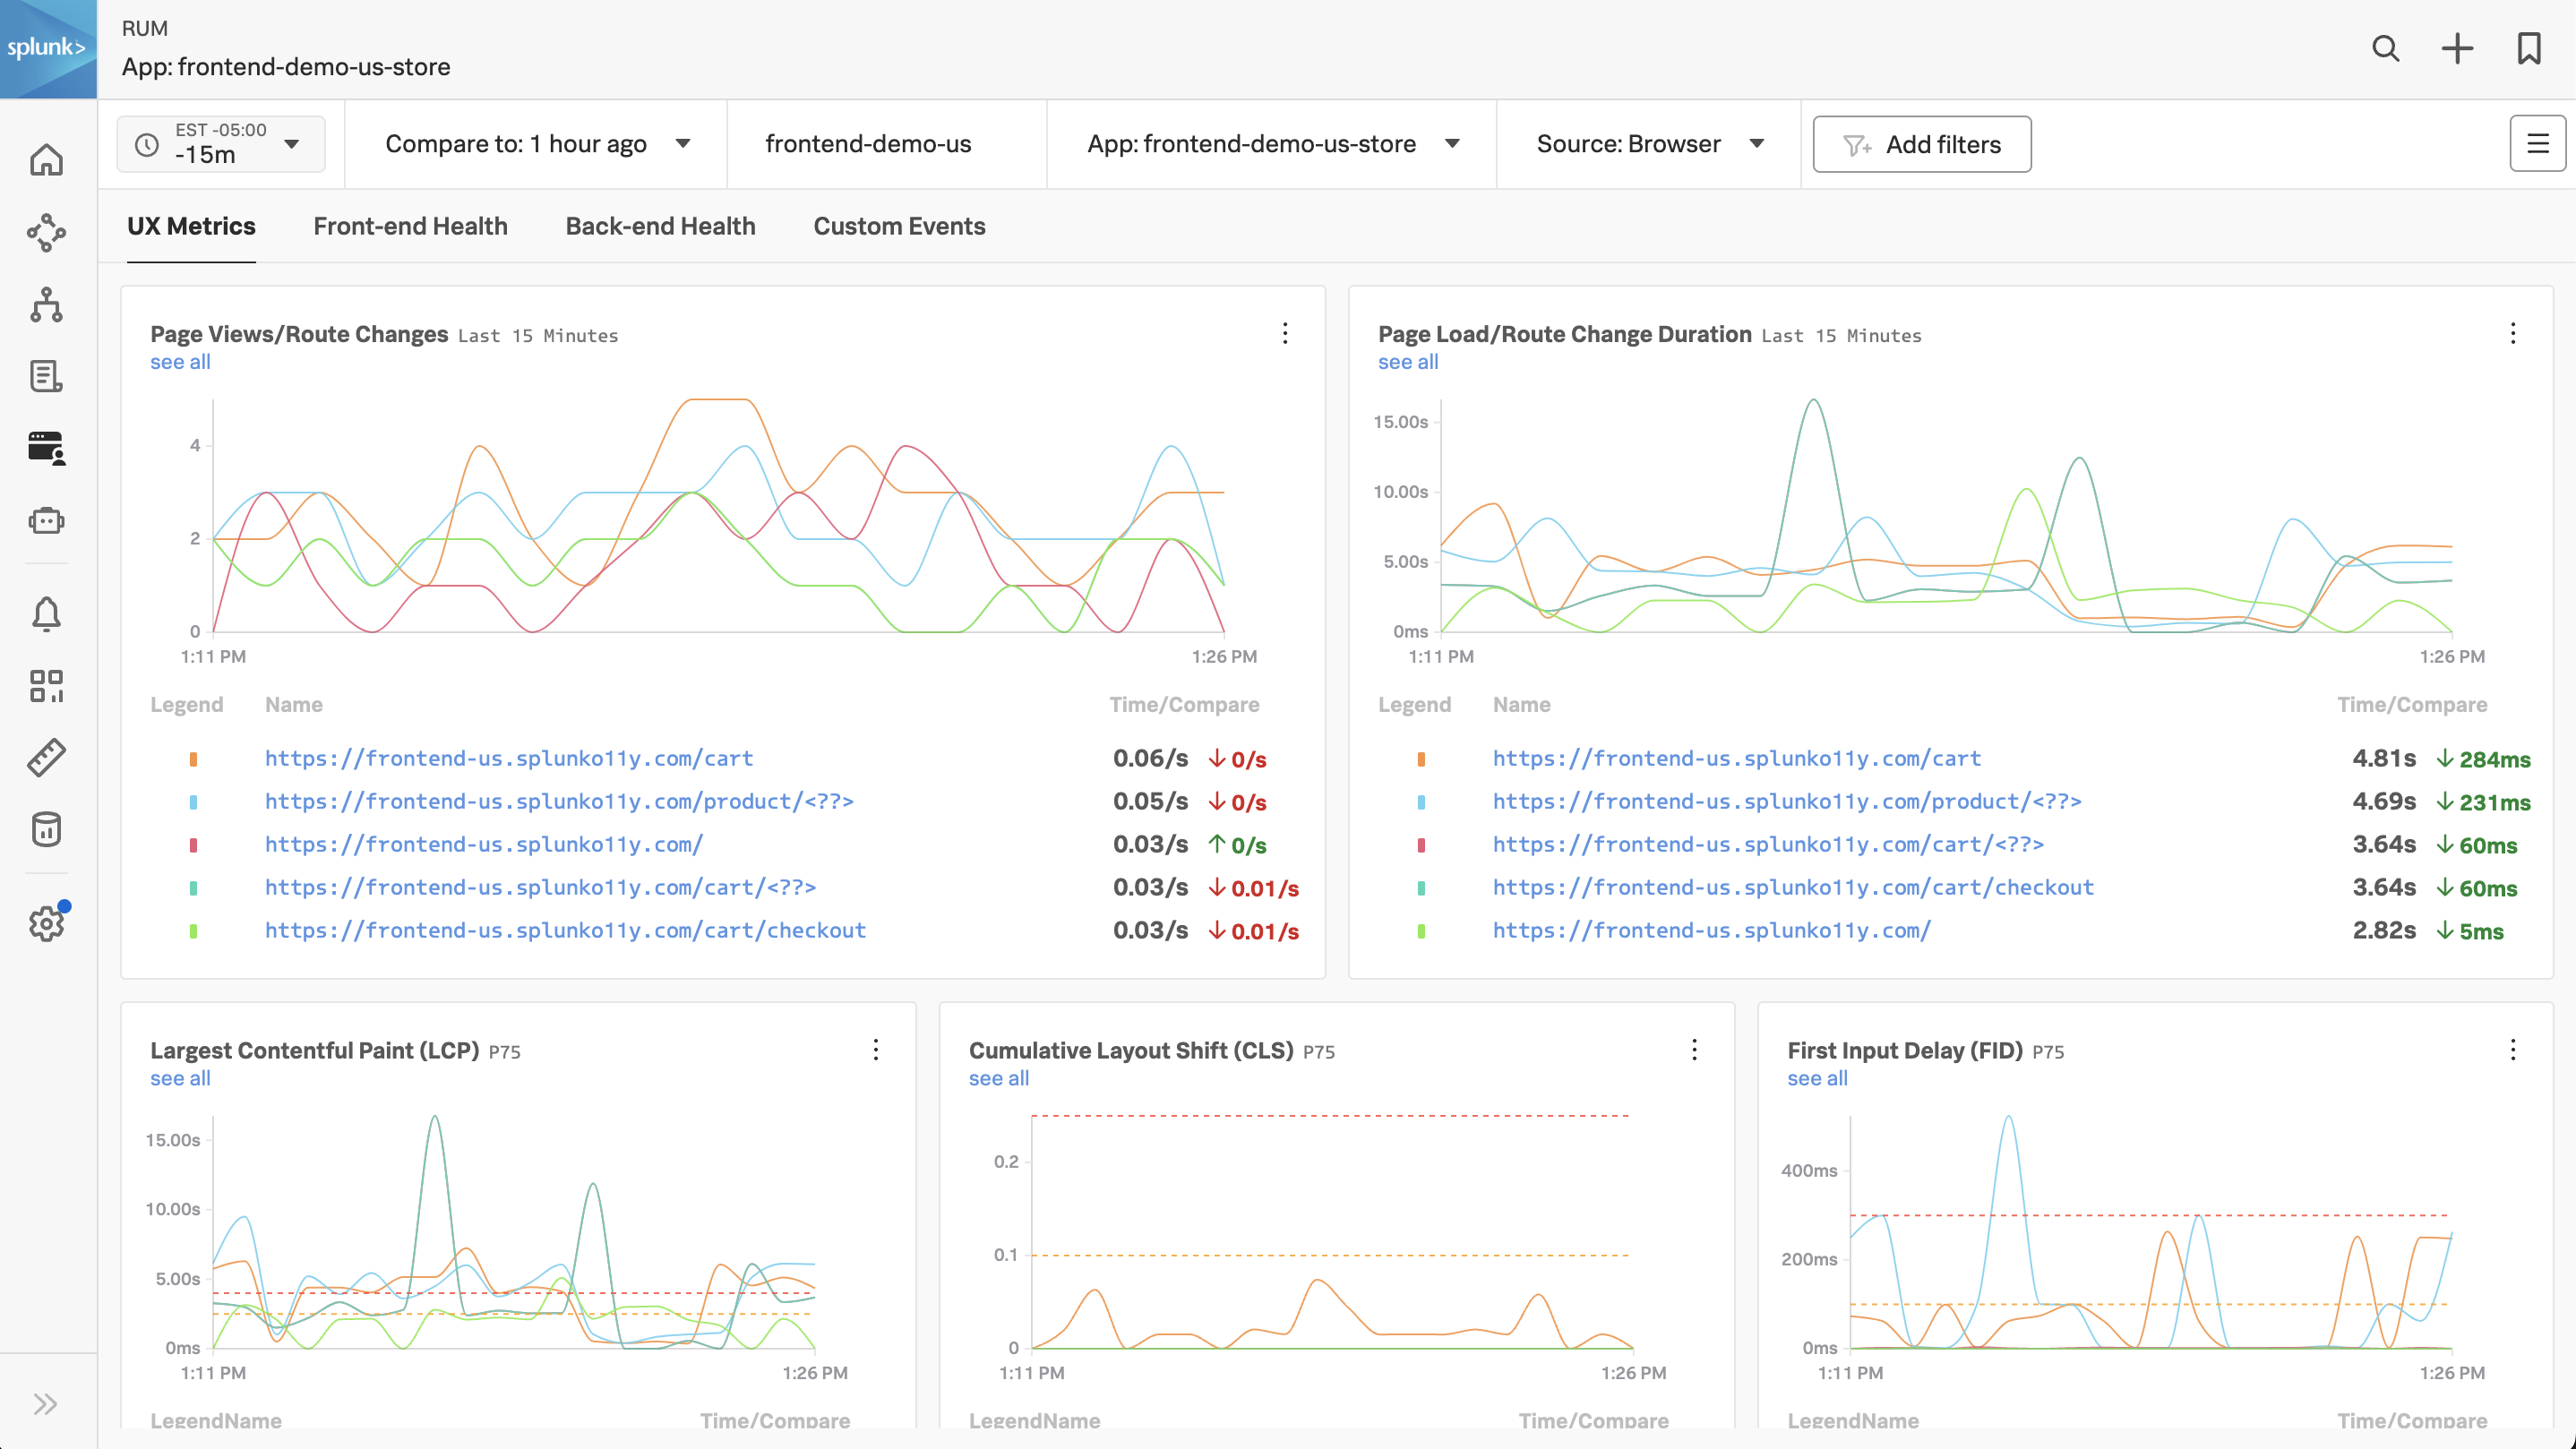
2.2. UX Metrics
By default, RUM prioritizes the metrics that most directly reflect the experience of the end user.
Additional Tags
All of the dashboard charts allow us to compare trends over time, create detectors, and click through to further diagnose issues.
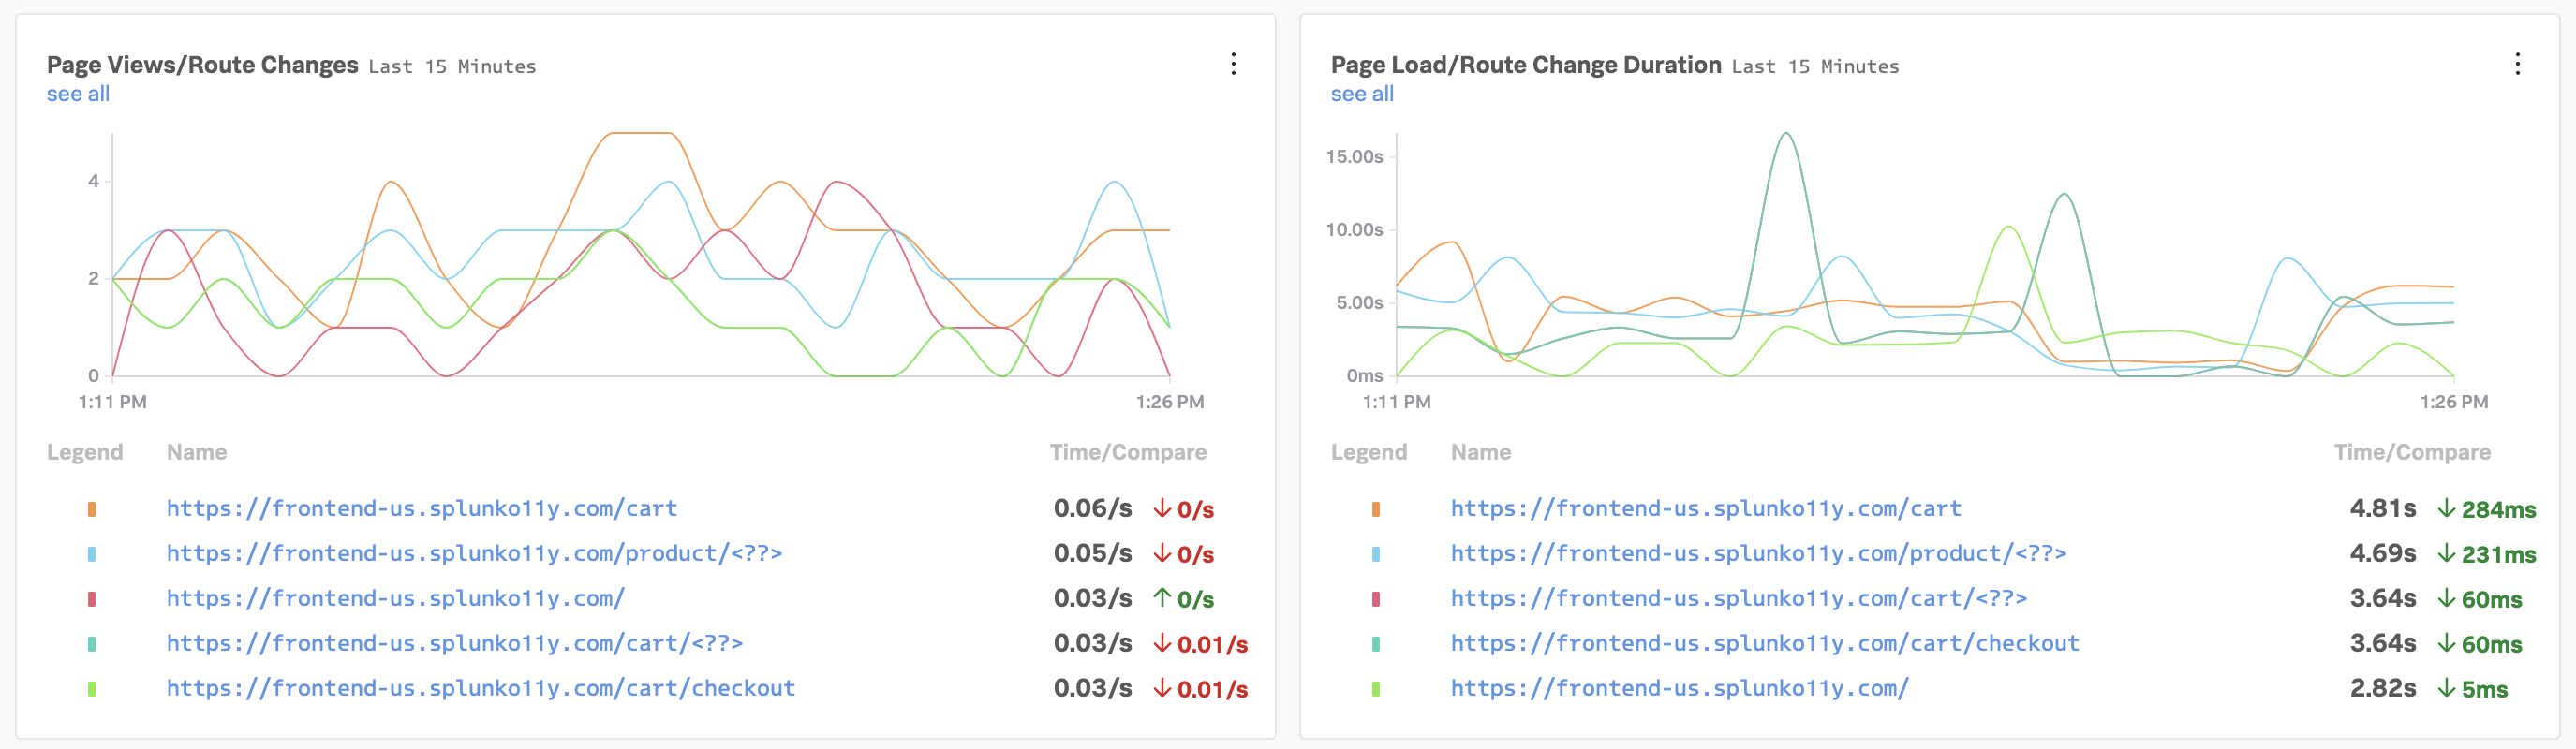
First, we see page load and route change information, which can help us understand if something unexpected is impacting user traffic trends.
Next, Google has defined Core Web Vitals to quantify the user experience as measured by loading, interactivity, and visual stability. Splunk RUM builds in Google’s thresholds into the UI, so you can easily see if your metrics are in an acceptable range.

- Largest Contentful Paint (LCP), measures loading performance. How long does it take for the largest block of content in the viewport to load? To provide a good user experience, LCP should occur within 2.5 seconds of when the page first starts loading.
- First Input Delay (FID), measures interactivity. How long does it take to be able to interact with the app? To provide a good user experience, pages should have a FID of 100 milliseconds or less.
- Cumulative Layout Shift (CLS), measures visual stability. How much does the content move around after the initial load? To provide a good user experience, pages should maintain a CLS of 0.1. or less.
Improving Web Vitals is a key component to optimizing your end user experience, so being able to quickly understand them and create detectors if they exceed a threshold is critical.
Google has some great resources if you want to learn more, for example the business impact of Core Web Vitals.
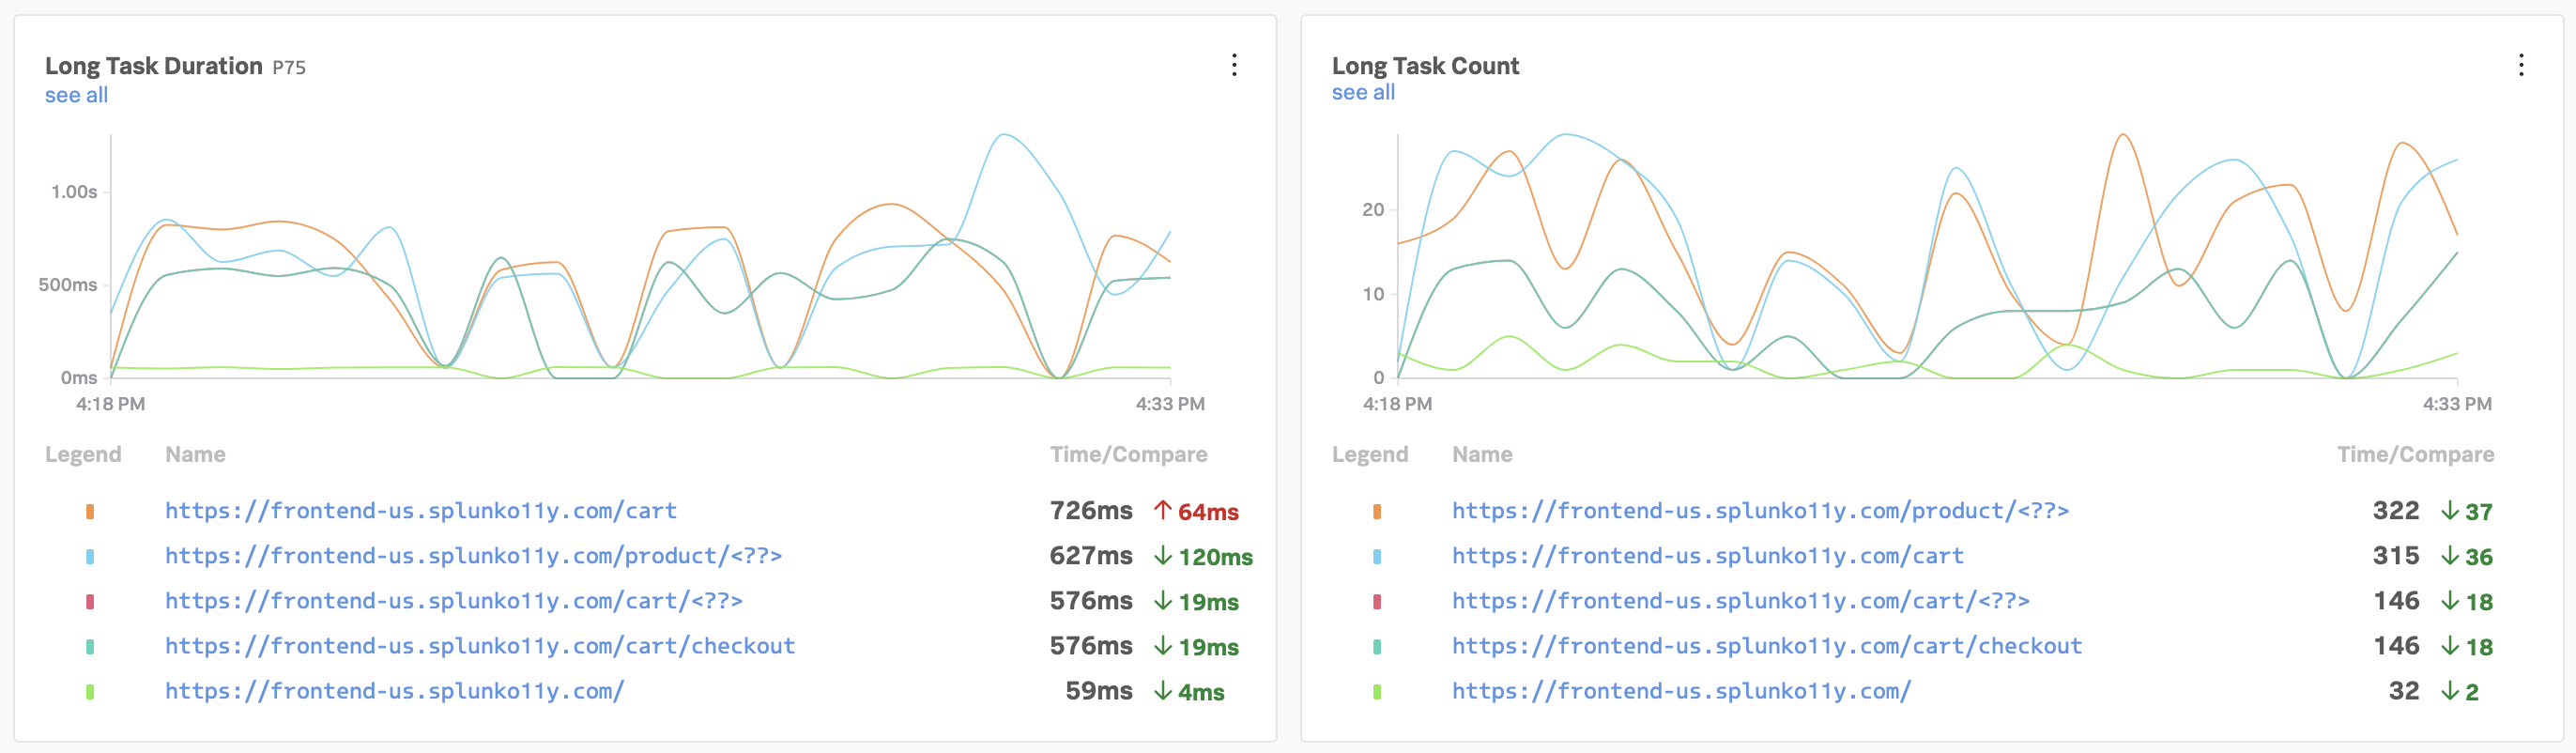
2.3. Front-end health
Common causes of frontend issues are javascript errors and long tasks, which can especially affect interactivity. Creating detectors on these indicators helps us investigate interactivity issues sooner than our users report it, allowing us to build workarounds or roll back related releases faster if needed. Learn more about optimizing long tasks for better end user experience!

2.4. Back-end health
Common back-end issues affecting user experience are network issues and resource requests. In this example, we clearly see a spike in Time To First Byte that lines up with a resource request spike, so we already have a good starting place to investigate.
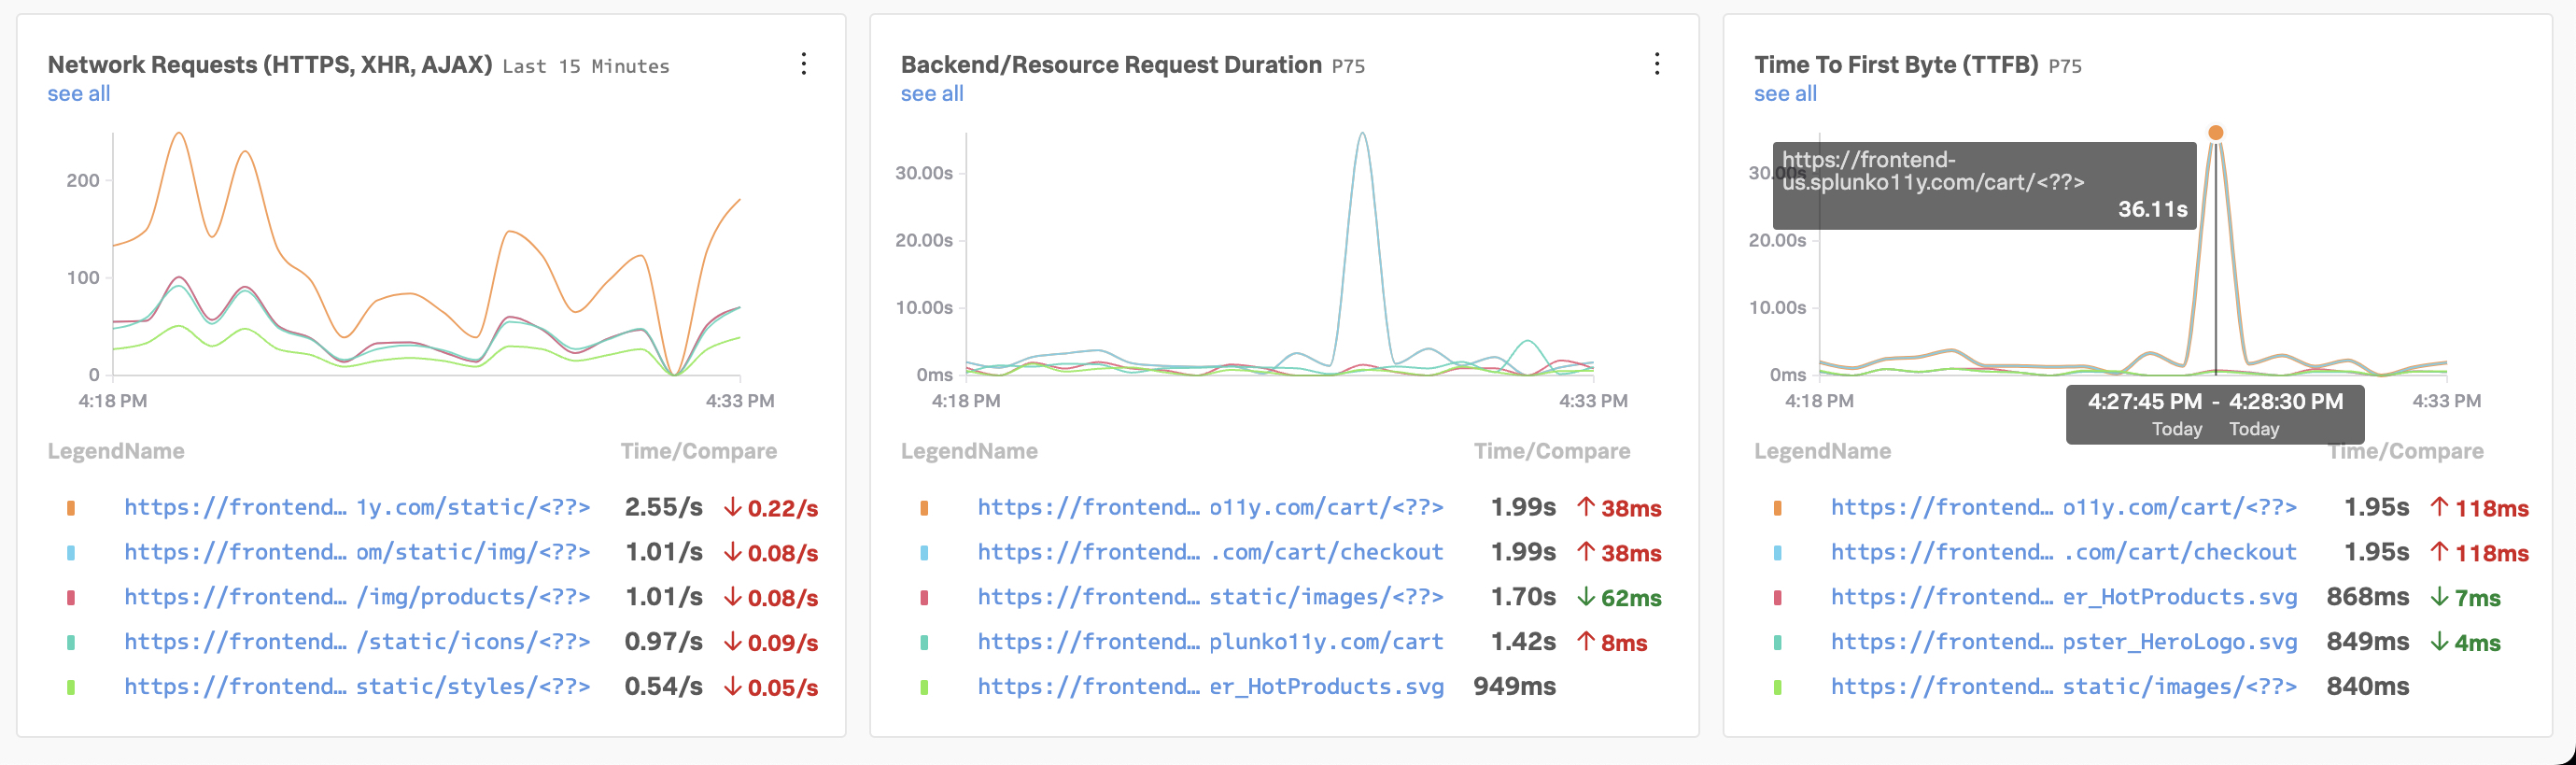
- Time To First Byte (TTFB), measures how long it takes for a client’s browser to receive the first byte of the response from the server. The longer it takes for the server to process the request and send a response, the slower your visitors’ browser is at displaying your page.
- Look into the Metrics views for the various endpoints and use the Tags sent via the Tag spotlight for deeper analysis
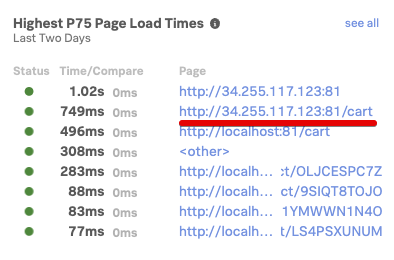
1. Find an url for the Cart endpoint
From the RUM Overview page, please select the url for the Cart endpoint to dive deeper into the information available for this endpoint.
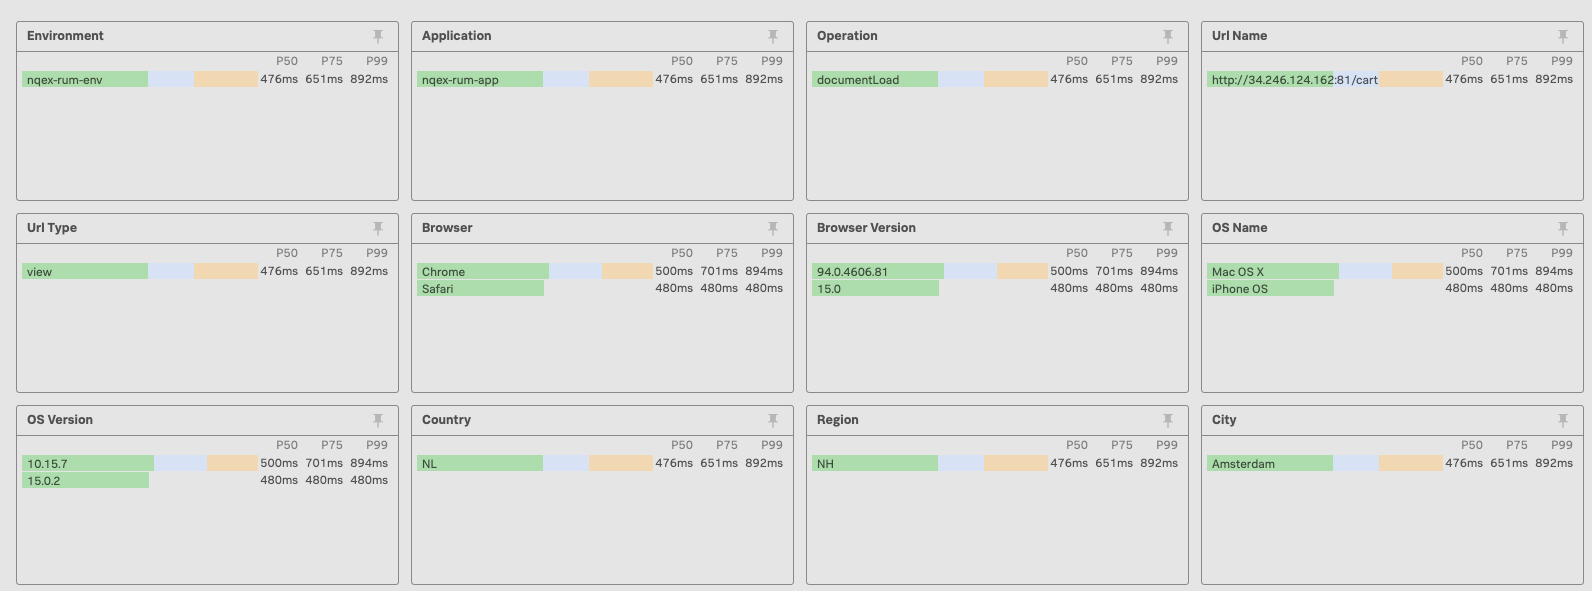
Once you have selected and clicked on the blue url, you will find yourself in the Tag Spotlight overview

Here you will see all of the tags that have been sent to Splunk RUM as part of the RUM traces. The tags displayed will be relevant to the overview that you have selected. These are generic Tags created automatically when the Trace was sent, and additional Tags you have added to the trace as part of the configuration of your website.
Additional Tags
We are already sending two additional tags, you have seen them defined in the Beacon url that was added to your website: app: "[nodename]-store", environment: "[nodename]-workshop" in the first section of this workshop! You can add additional tags in a similar way.
In our example we have selected the Document Load Latency view as shown here:

You can select any of the following Tag views, each focused on a specific metric.

The Tag spotlight is designed to help you identify problems, either through the chart view,, where you may quickly identify outliers or via the TAGs.
In the Document Load Latency view, if you look at the Browser, Browser Version & OS Name Tag views,you can see the various browser types and versions, as well as for the underlying OS.
This makes it easy to identify problems related to specific browser or OS versions, as they would be highlighted.

In the above example you can see that Firefox had the slowest response, various Browser versions ( Chrome) that have different response times and the slow response of the Android devices.
A further example are the regional Tags that you can use to identify problems related to ISP or locations etc. Here you should be able to find the location you have been using to access the Online Boutique. Drill down by selecting the town or country you are accessing the Online Boutique from by clicking on the name as shown below (City of Amsterdam):
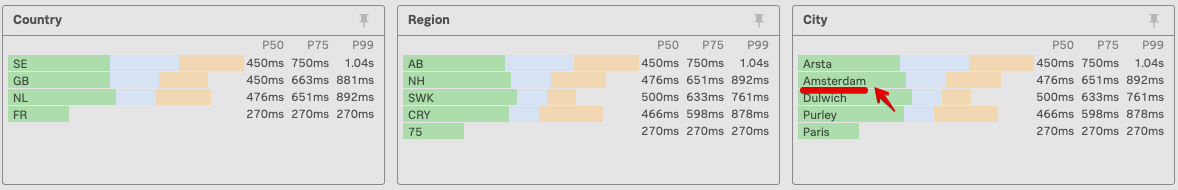
This will select only the traces relevant to the city selected as shown below:
By selecting the various Tag you build up a filter, you can see the current selection below

To clear the filter and see every trace click on Clear All at the top right of the page.
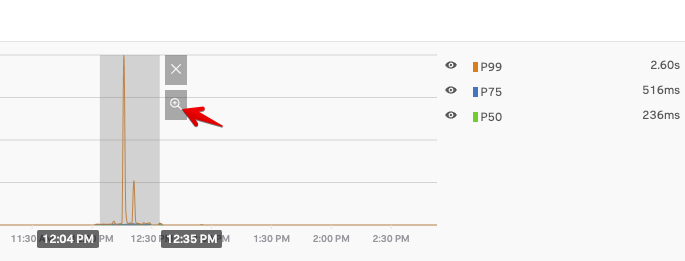
If the overview page is empty or shows  , no traces have been received in the selected timeslot.
You need to increase the time window at the top left. You can start with the Last 12 hours for example.
, no traces have been received in the selected timeslot.
You need to increase the time window at the top left. You can start with the Last 12 hours for example.
You can then use your mouse to select the time slot you want like show in the view below and activate that time filter by clicking on the little spyglass icon.
Analyzing RUM Sessions
- Dive into RUM Session information in the RUM UI
- Identify Javascript errors in the Span of an user interaction
1. Again select the cart URL
After you have focussed the time slot with the time selector, you need to reselect the cart url from Url Name view, as shown below:
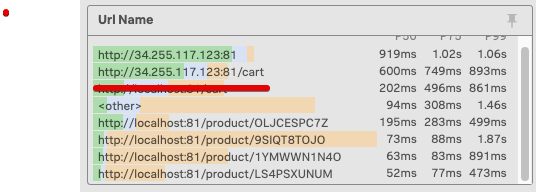
In the example above we selected http://34.246.124.162:81/cart
2. Drill down in the Sessions
After you have analyzed the information and drilled down via the Tag Spotlight to a subset of the traces, you can view the actual session as it was run by the end-user’s browser.
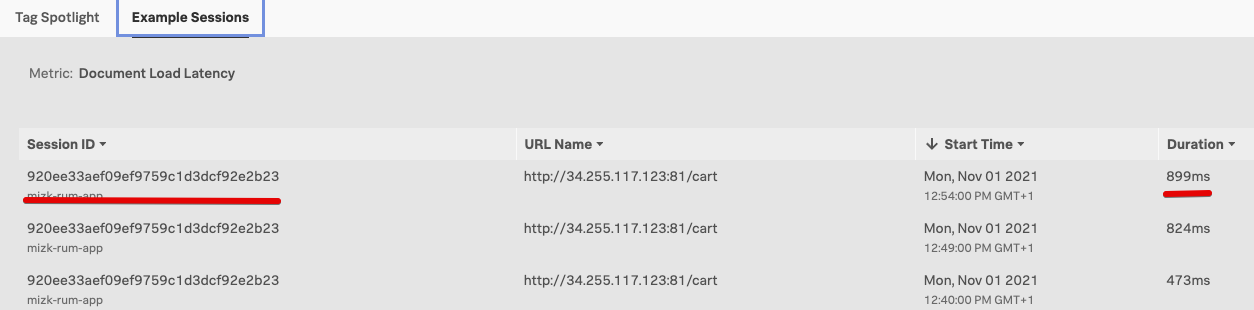
You do this by clicking on the link Example Sessions as shown below:
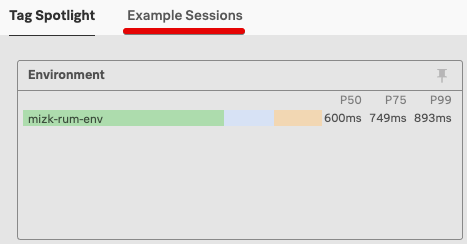
This will give you a list of sessions that matched both the time filter and the subset selected in the Tag Profile.
Select one by clicking on the session ID, It is a good idea to select one that has the longest duration (preferably over 700 ms).
Once you have selected the session, you will be taken to the session details page. As you are selecting a specific action that is part of the session, you will likely arrive somewhere in the middle of the session, at the moment of the interaction.
You can see the URL http://34.246.124.162:81/cart, the one you selected earlier, is where we are focusing on in the session stream.

Scroll down a little bit on the page, so you see the end of the operation as shown below.

You can see that we have received a few Javascript Console errors that may not have been detected or visible to the end users. To examine these in more detail click on the middle one that says: *Cannot read properties of undefined (reading ‘Prcie’)

This will cause the page to expand and show the Span detail for this interaction, It will contain a detailed error.stack you can pass on the developer to solve the issue. You may have noticed when buying in the Online Boutique that the final total always was $0.00.
