Advanced Synthetics

30 minutes  

Introduction

This workshop walks you through using the Chrome DevTools Recorder to create a synthetic test on a Splunk demonstration environment or on your own public website.

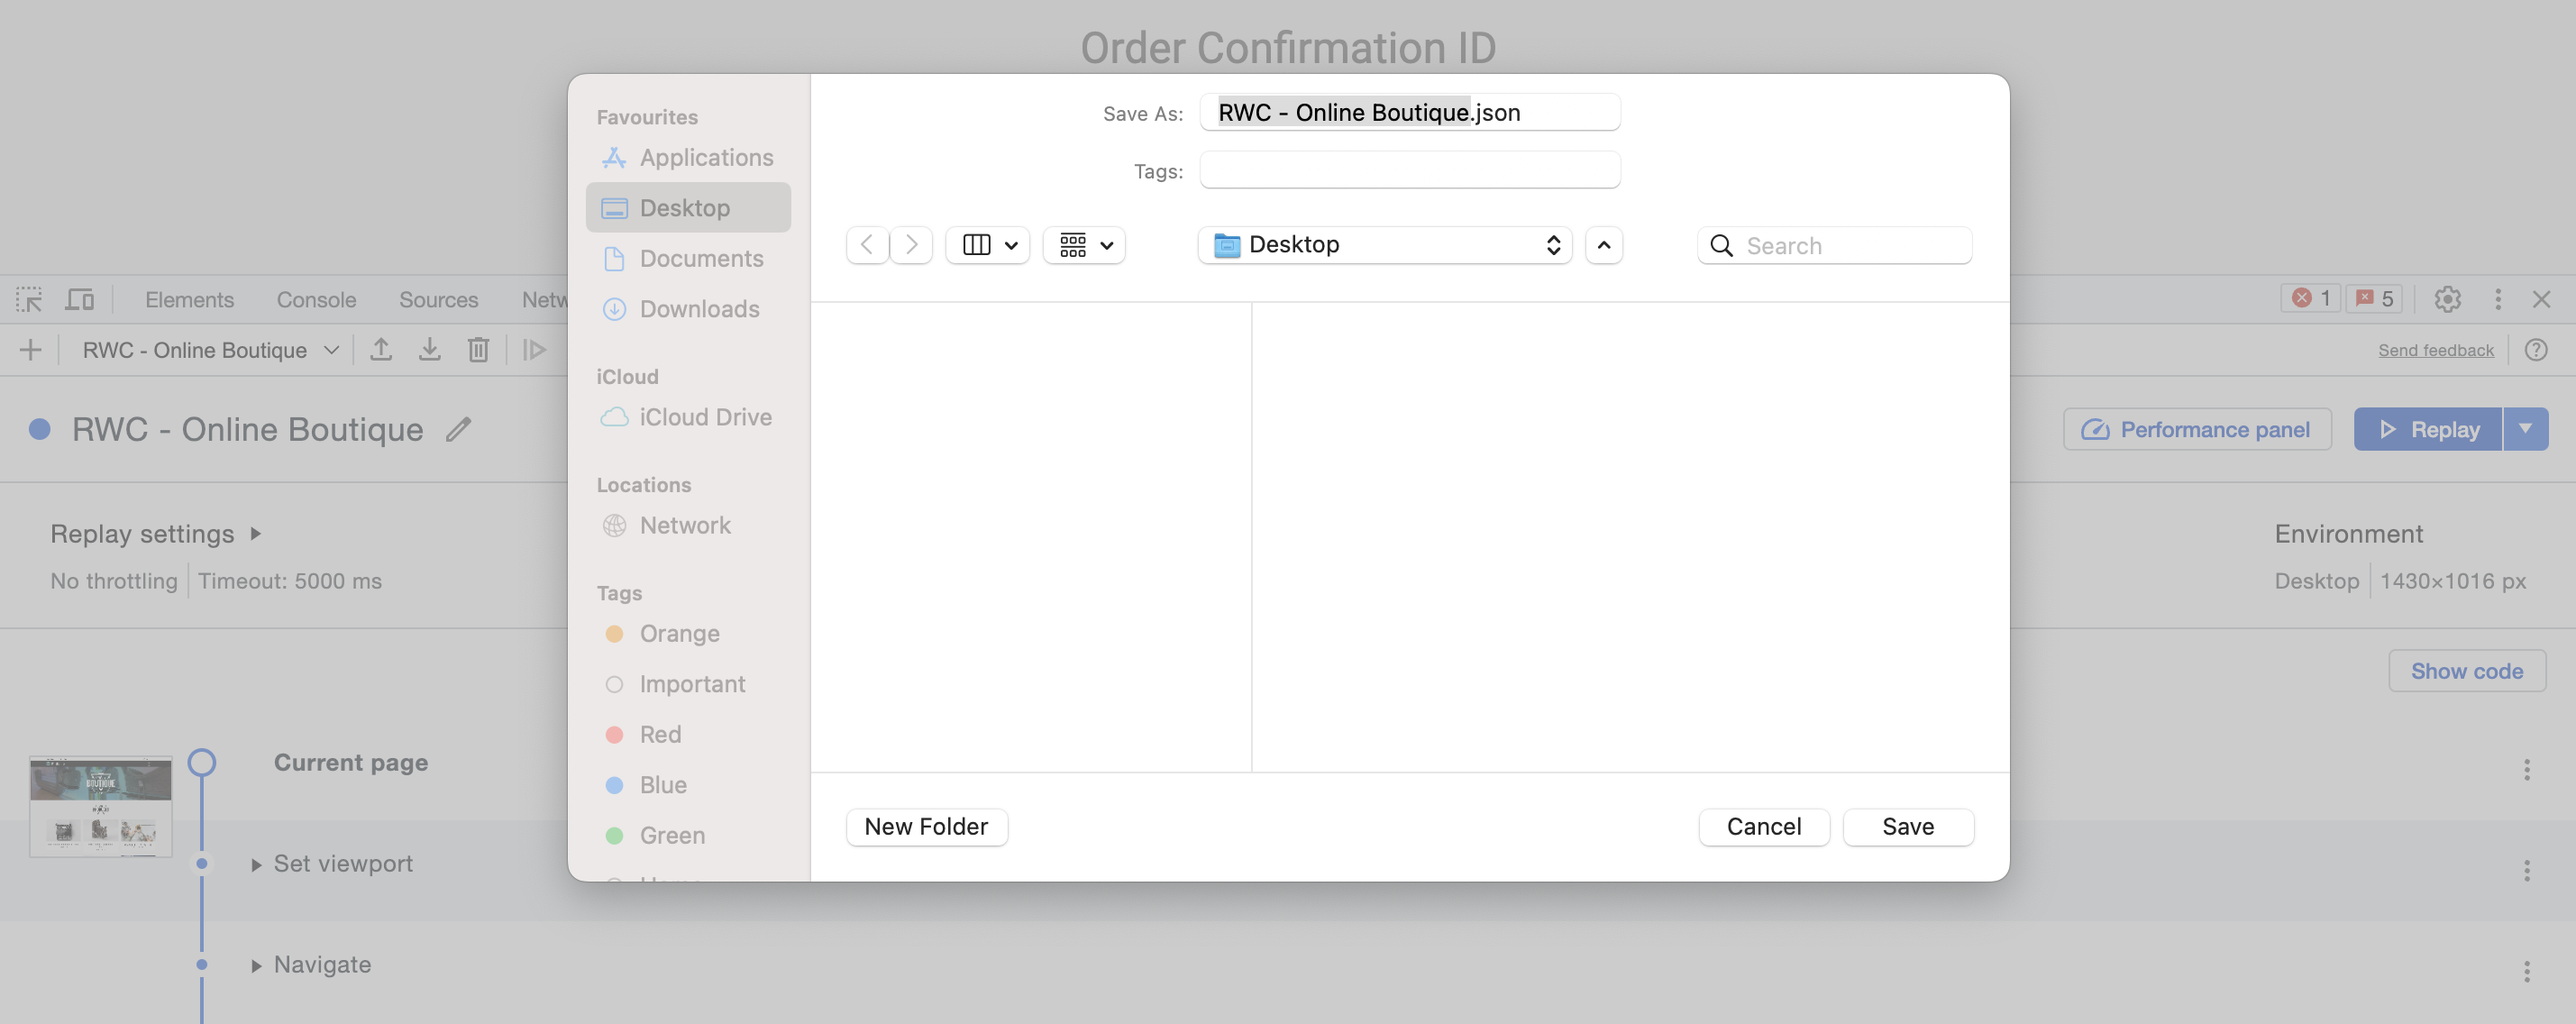
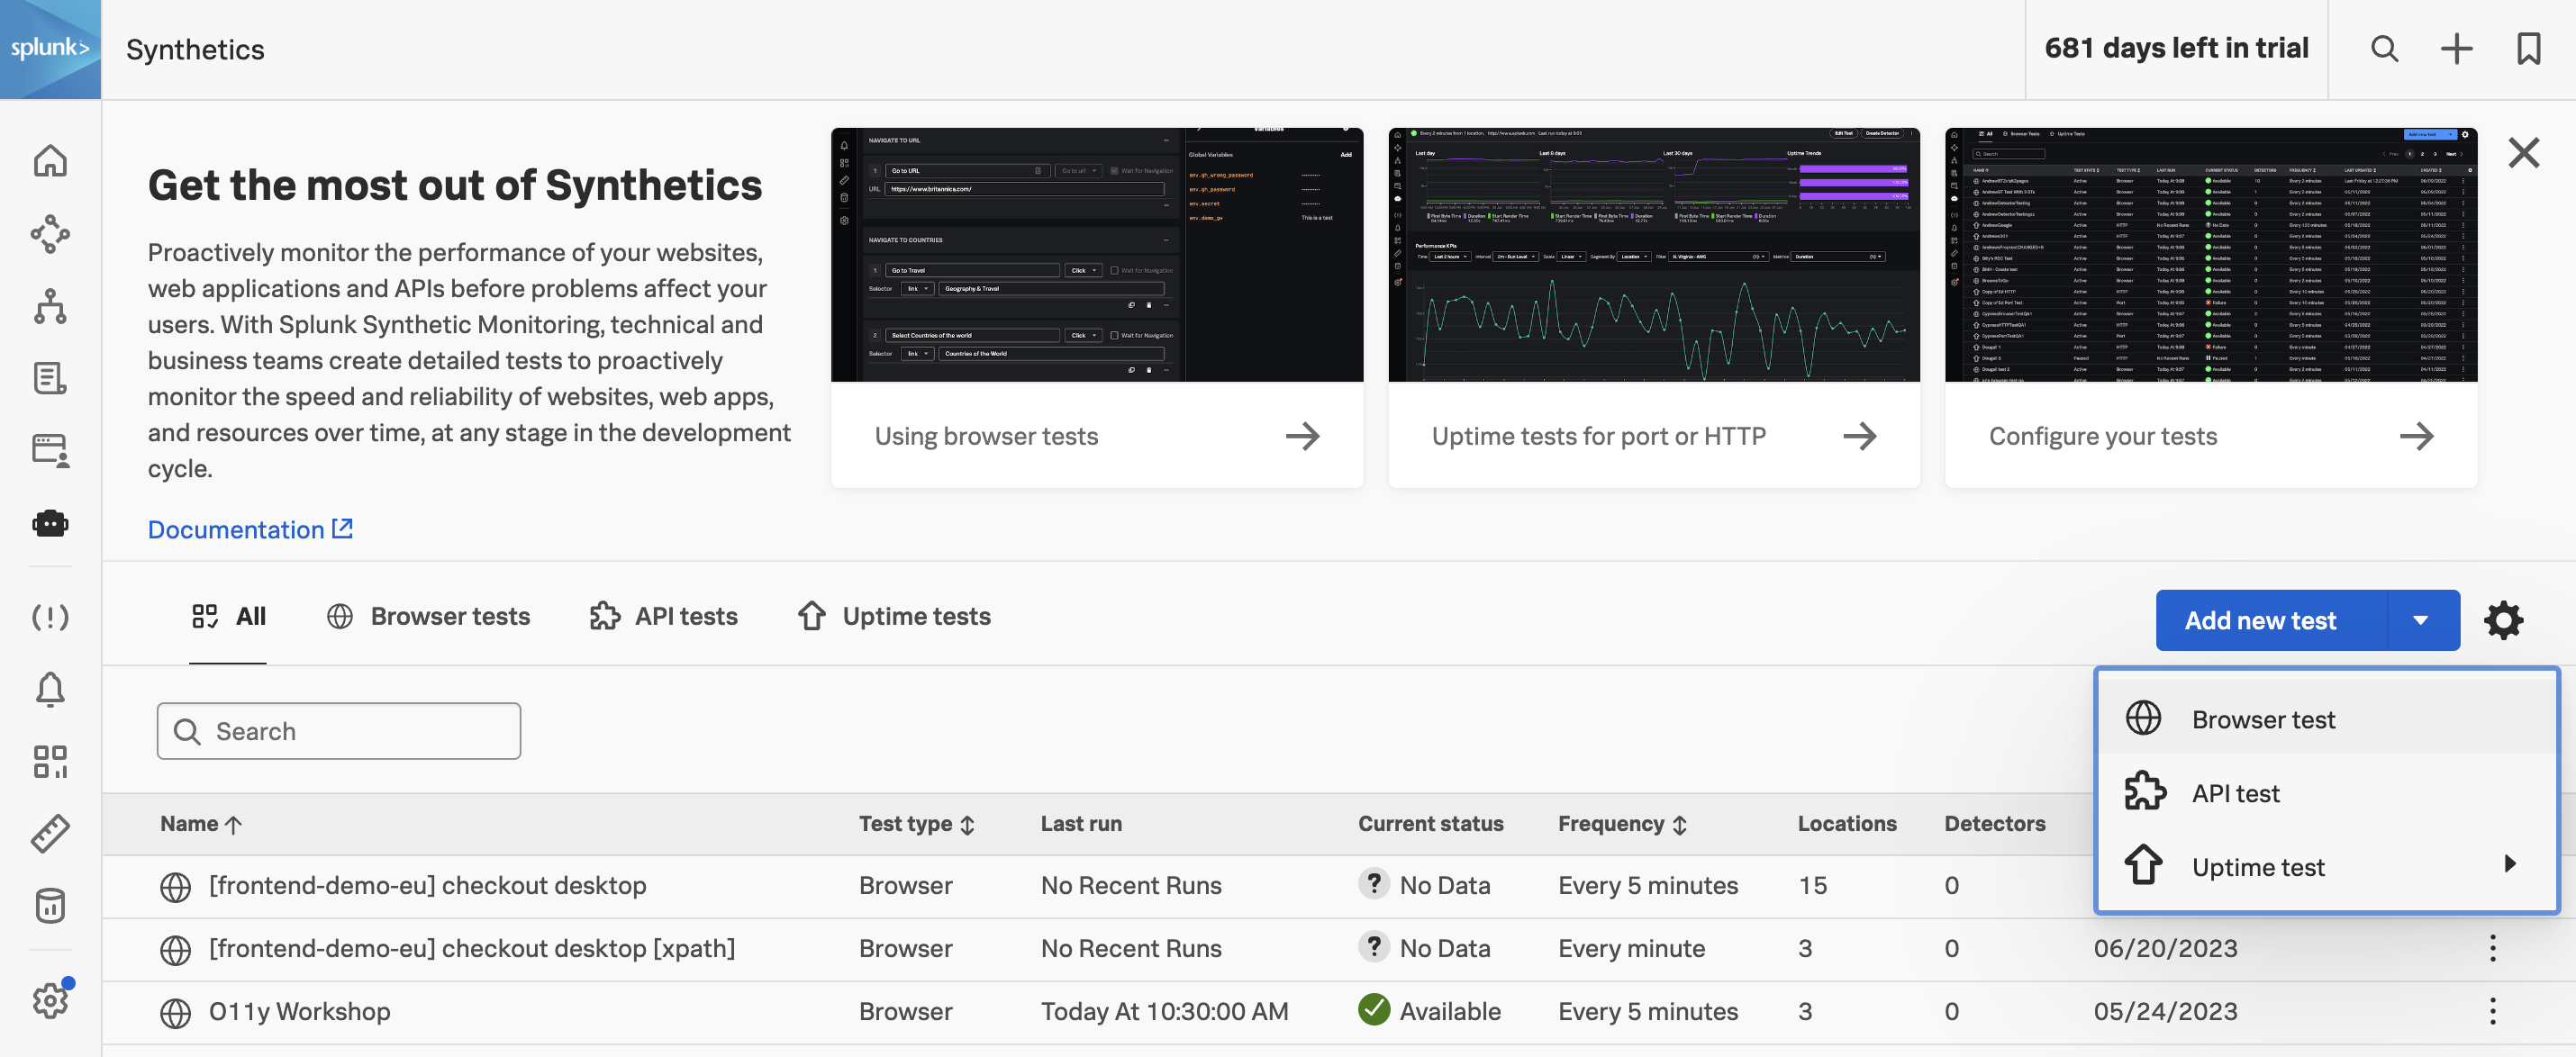
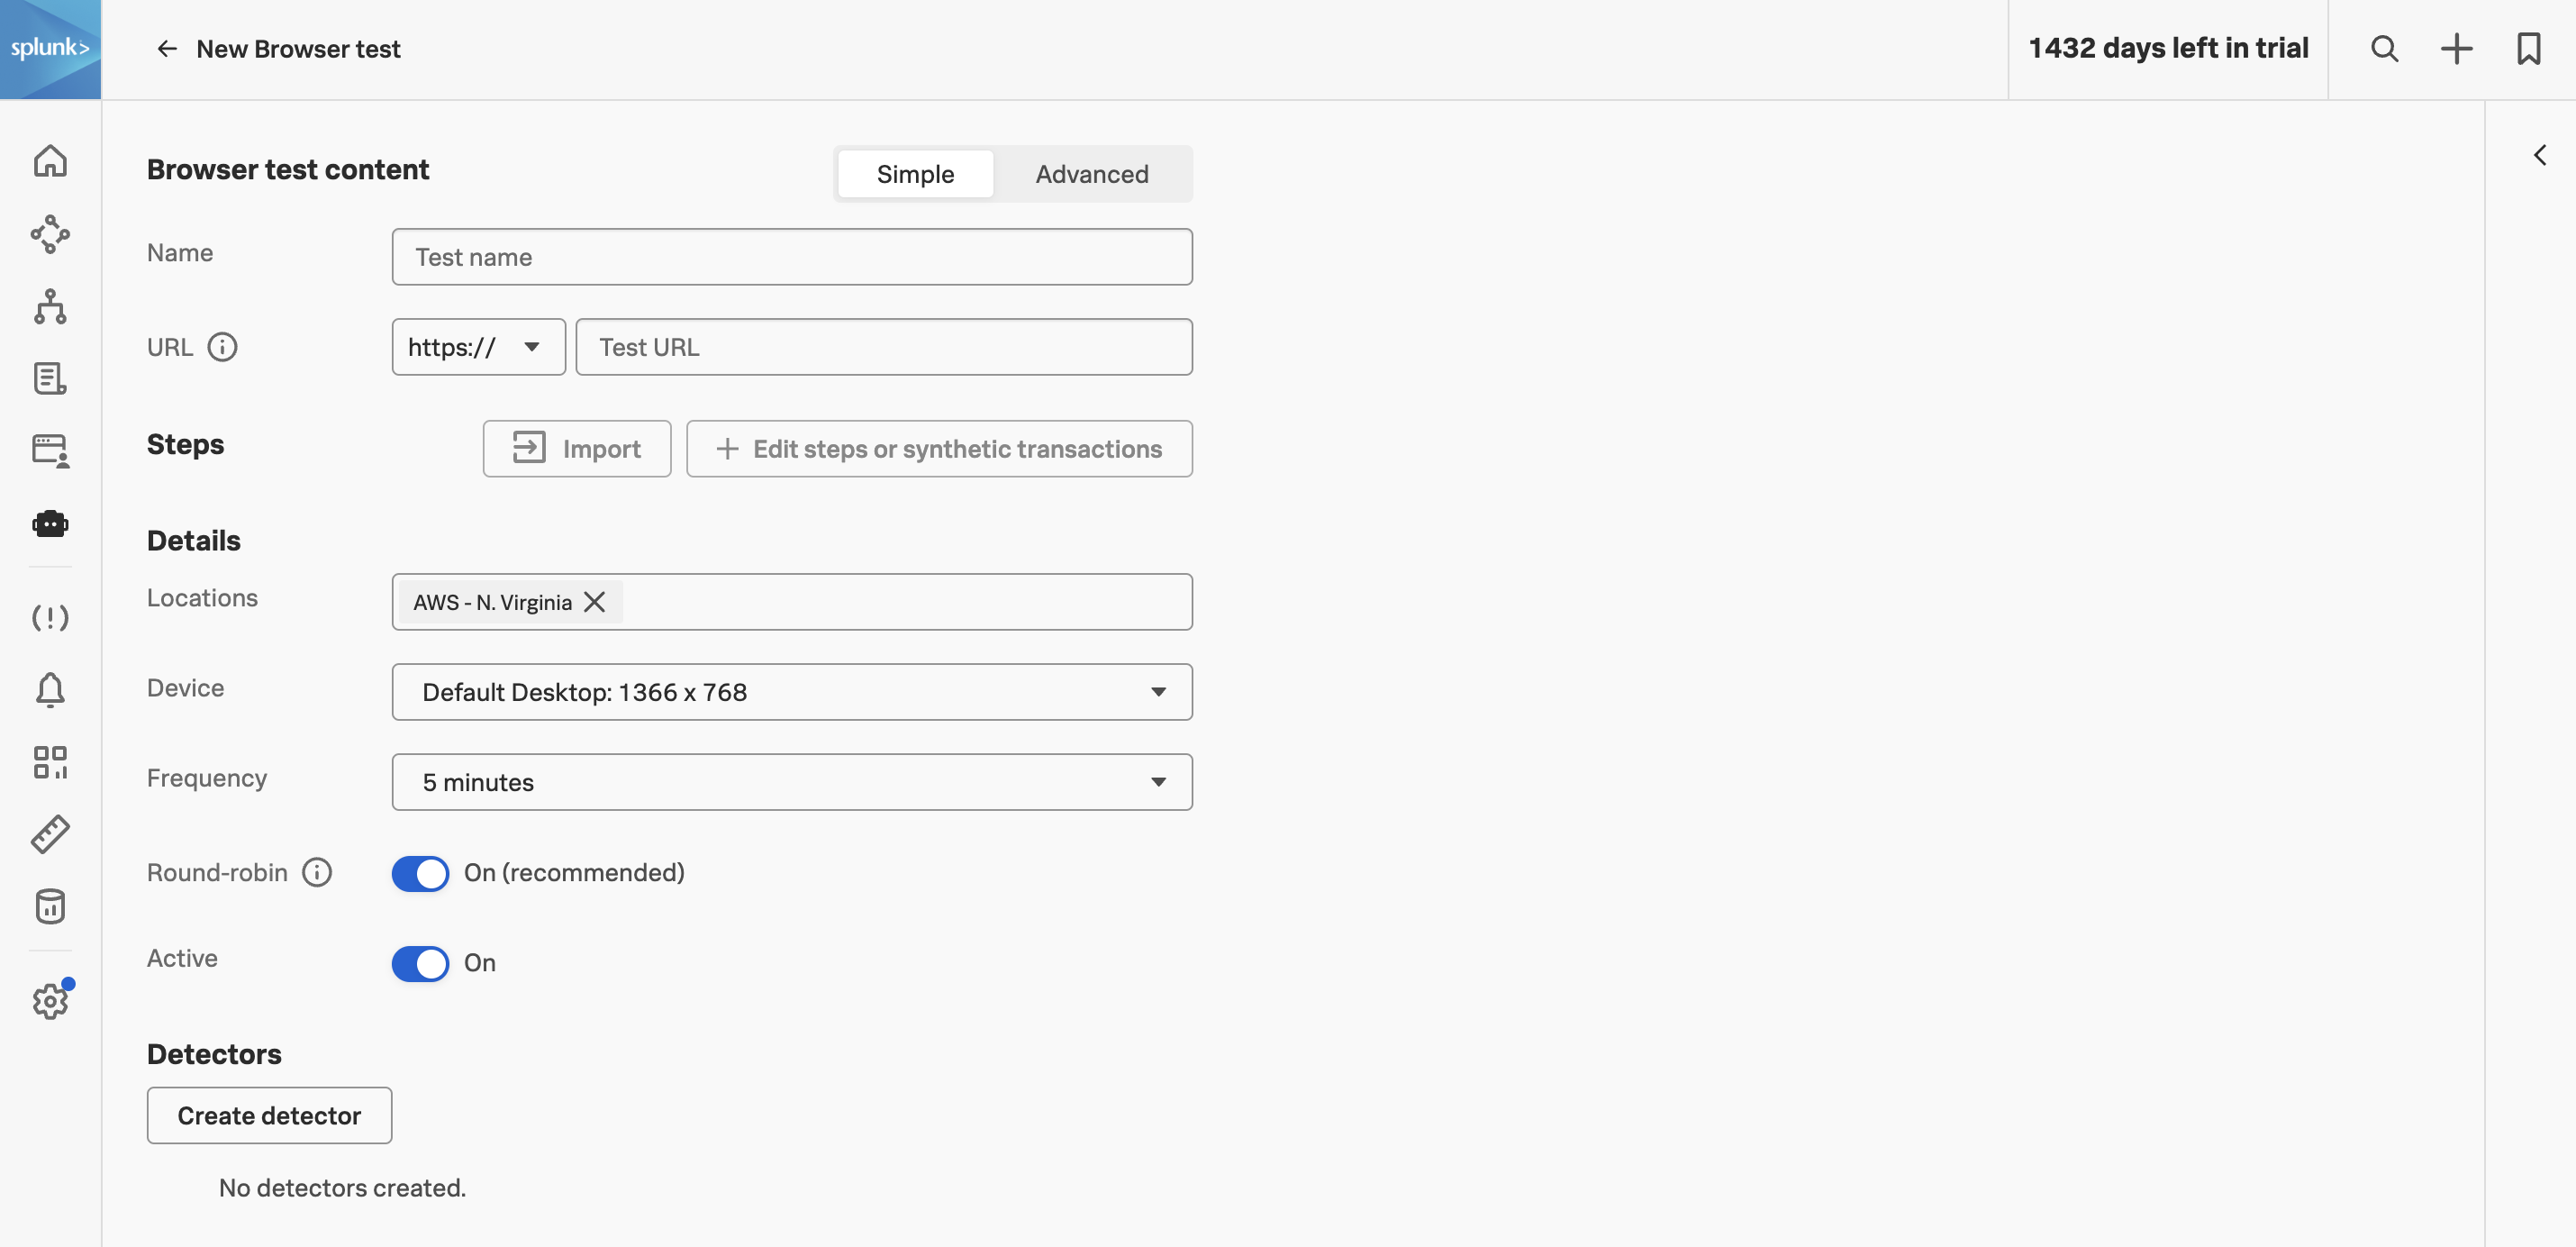
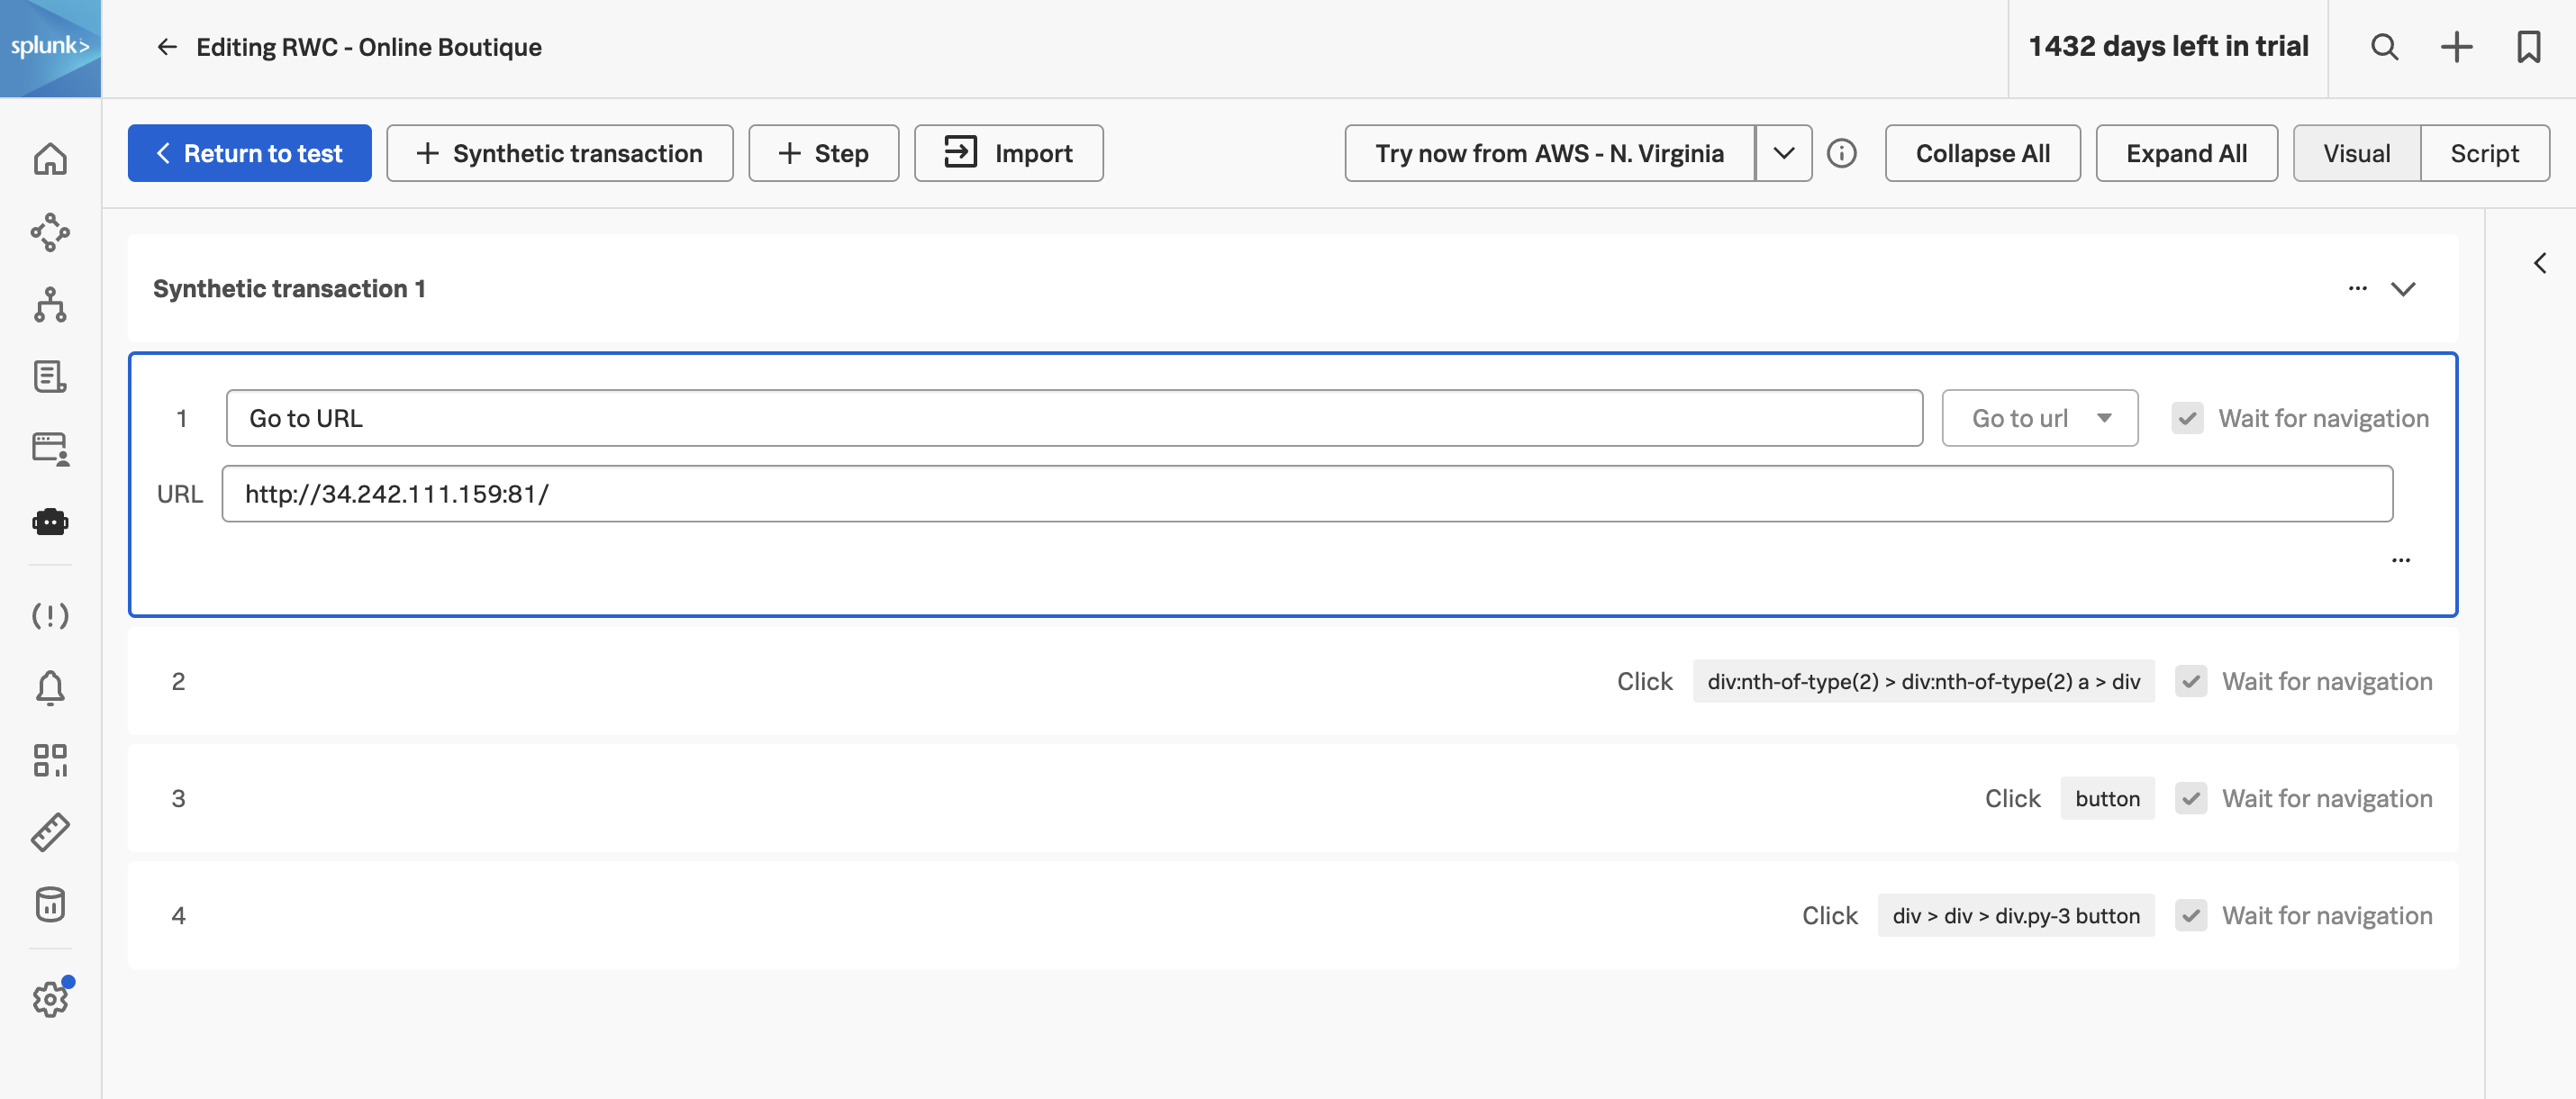
The exported JSON from the Chrome DevTools Recorder will then be used to create a Splunk Synthetic Monitoring Real Browser Test.

Pre-requisites

  • Google Chrome Browser installed
  • Publicly browser-accessible URL
  • Access to Splunk Observability Cloud

Supporting resources

  1. Lantern: advanced Selectors for multi-step browser tests
  2. Chrome for Developers DevTools Tips
  3. web.dev Core Web Vitals reference
Last Modified Apr 2, 2024

Subsections of Advanced Synthetics

Record a test

Write down a short user journey you want to test. Remember: smaller bites are easier to chew! In other words, get started with just a few steps. This is easier not only to create and maintain the test, but also to understand and act on the results. Test the essential features to your users, like a support contact form, login widget, or date picker.

Note

Record the test in the same type of viewport that you want to run it. For example, if you want to run a test on a mobile viewport, narrow your browser width to mobile and refresh before starting the recording. This way you are capturing the correct elements that could change depending on responsive style rules.

Open your starting URL in Chrome Incognito. This is important so you’re not carrying cookies into the recording, which we won’t set up in the Synthetic test by default. If you workshop instructor does not have a custom URL, feel free to use https://online-boutique-eu.splunko11y.com or https://online-boutique-us.splunko11y.com, which are in the examples below.

Open the Chrome DevTools Recorder

Next, open the Developer Tools (in the new tab that was opened above) by pressing Ctrl + Shift + I on Windows or Cmd + Option + I on a Mac, then select Recorder from the top-level menu or the More tools flyout menu.

Open Recorder Open Recorder

Note

Site elements might change depending on viewport width. Before recording, set your browser window to the correct width for the test you want to create (Desktop, Tablet, or Mobile). Change the DevTools “dock side” to pop out as a separate window if it helps.

Create a new recording

With the Recorder panel open in the DevTools window. Click on the Create a new recording button to start.

Recorder Recorder

For the Recording Name use your initials to prefix the name of the recording e.g. <your initials> - <website name>. Click on Start Recording to start recording your actions.

Recording Name Recording Name

Now that we are recording, complete a few actions on the site. An example for our demo site is:

  • Click on Vintage Camera Lens
  • Click on Add to Cart
  • Click on Place Order
  • Click on End recording in the Recorder panel.

End Recording End Recording

Export the recording

Click on the Export button:

Export button Export button

Select JSON as the format, then click on Save

Export JSON Export JSON

Save JSON Save JSON

Congratulations! You have successfully created a recording using the Chrome DevTools Recorder. Next, we will use this recording to create a Real Browser Test in Splunk Synthetic Monitoring.


{
    "title": "RWC - Online Boutique",
    "steps": [
        {
            "type": "setViewport",
            "width": 1430,
            "height": 1016,
            "deviceScaleFactor": 1,
            "isMobile": false,
            "hasTouch": false,
            "isLandscape": false
        },
        {
            "type": "navigate",
            "url": "https://online-boutique-eu.splunko11y.com/",
            "assertedEvents": [
                {
                    "type": "navigation",
                    "url": "https://online-boutique-eu.splunko11y.com/",
                    "title": "Online Boutique"
                }
            ]
        },
        {
            "type": "click",
            "target": "main",
            "selectors": [
                [
                    "div:nth-of-type(2) > div:nth-of-type(2) a > div"
                ],
                [
                    "xpath//html/body/main/div/div/div[2]/div[2]/div/a/div"
                ],
                [
                    "pierce/div:nth-of-type(2) > div:nth-of-type(2) a > div"
                ]
            ],
            "offsetY": 170,
            "offsetX": 180,
            "assertedEvents": [
                {
                    "type": "navigation",
                    "url": "https://online-boutique-eu.splunko11y.com/product/66VCHSJNUP",
                    "title": ""
                }
            ]
        },
        {
            "type": "click",
            "target": "main",
            "selectors": [
                [
                    "aria/ADD TO CART"
                ],
                [
                    "button"
                ],
                [
                    "xpath//html/body/main/div[1]/div/div[2]/div/form/div/button"
                ],
                [
                    "pierce/button"
                ],
                [
                    "text/Add to Cart"
                ]
            ],
            "offsetY": 35.0078125,
            "offsetX": 46.4140625,
            "assertedEvents": [
                {
                    "type": "navigation",
                    "url": "https://online-boutique-eu.splunko11y.com/cart",
                    "title": ""
                }
            ]
        },
        {
            "type": "click",
            "target": "main",
            "selectors": [
                [
                    "aria/PLACE ORDER"
                ],
                [
                    "div > div > div.py-3 button"
                ],
                [
                    "xpath//html/body/main/div/div/div[4]/div/form/div[4]/button"
                ],
                [
                    "pierce/div > div > div.py-3 button"
                ],
                [
                    "text/Place order"
                ]
            ],
            "offsetY": 29.8125,
            "offsetX": 66.8203125,
            "assertedEvents": [
                {
                    "type": "navigation",
                    "url": "https://online-boutique-eu.splunko11y.com/cart/checkout",
                    "title": ""
                }
            ]
        }
    ]
}
Last Modified May 20, 2024

Create a Browser Test

In Splunk Observability Cloud, navigate to Synthetics and click on Add new test.

From the dropdown select Browser test.

Add new test Add new test

You will then be presented with the Browser test content configuration page.

New Test New Test

Last Modified Apr 2, 2024

Import JSON

To begin configuring our test, we need to import the JSON that we exported from the Chrome DevTools Recorder. To enable the Import button, we must first give our test a name e.g. [<your team name>] <your initials> - Online Boutique.

Import Import

Once the Import button is enabled, click on it and either drop the JSON file that you exported from the Chrome DevTools Recorder or upload the file.

Import JSON Import JSON

Once the JSON file has been uploaded, click on Continue to edit steps

Import Complete Import Complete

Edit Steps Edit Steps

Before we make any edits to the test, let’s first configure the settings, click on < Return to test

Last Modified Apr 2, 2024

Test settings

The simple settings allow you to configure the basics of the test:

  • Name: The name of the test (e.g. RWC - Online Boutique).
  • Details:
    • Locations: The locations where the test will run from.
    • Device: Emulate different devices and connection speeds. Also, the viewport will be adjusted to match the chosen device.
    • Frequency: How often the test will run.
    • Round-robin: If multiple locations are selected, the test will run from one location at a time, rather than all locations at once.
    • Active: Set the test to active or inactive.

![Return to Test]For this workshop, we will configure the locations that we wish to monitor from. Click in the Locations field and you will be presented with a list of global locations (over 50 in total).

Global Locations Global Locations

Select the following locations:

  • AWS - N. Virginia
  • AWS - London
  • AWS - Melbourne

Once complete, scroll down and click on Click on Submit to save the test.

The test will now be scheduled to run every 5 minutes from the 3 locations that we have selected. This does take a few minutes for the schedule to be created.

So while we wait for the test to be scheduled, click on Edit test so we can go through the Advanced settings.

Last Modified Apr 2, 2024

Advanced Test Settings

Click on Advanced, these settings are optional and can be used to further configure the test.

Note

In the case of this workshop, we will not be using any of these settings; this is for informational purposes only.

Advanced Settings Advanced Settings

  • Security:
    • TLS/SSL validation: When activated, this feature is used to enforce the validation of expired, invalid hostname, or untrusted issuer on SSL/TLS certificates.
    • Authentication: Add credentials to authenticate with sites that require additional security protocols, for example from within a corporate network. By using concealed global variables in the Authentication field, you create an additional layer of security for your credentials and simplify the ability to share credentials across checks.
  • Custom Content:
    • Custom headers: Specify custom headers to send with each request. For example, you can add a header in your request to filter out requests from analytics on the back end by sending a specific header in the requests. You can also use custom headers to set cookies.
    • Cookies: Set cookies in the browser before the test starts. For example, to prevent a popup modal from randomly appearing and interfering with your test, you can set cookies. Any cookies that are set will apply to the domain of the starting URL of the check. Splunk Synthetics Monitoring uses the public suffix list to determine the domain.
    • Host overrides: Add host override rules to reroute requests from one host to another. For example, you can create a host override to test an existing production site against page resources loaded from a development site or a specific CDN edge node.

Next, we will edit the test steps to provide more meaningful names for each step.

Last Modified Apr 2, 2024

Edit test steps

To edit the steps click on the + Edit steps or synthetic transactions button. From here, we are going to give meaningful names to each step.

For each step, we are going to give them a meaningful, readable name. That could look like:

  • Step 1 replace the text Go to URL with Go to Homepage
  • Step 2 enter the text Select Typewriter.
  • Step 3 enter Add to Cart.
  • Step 4 enter Place Order.

Step names Step names

Note

If you’d like, group the test steps into Transactions and edit the transaction names. This is especially useful for Single Page Apps (SPAs), where the resource waterfall is not split by URL. We can also create charts and alerts based on transactions.

Click < Return to test to return to the test configuration page and click Save to save the test.

You will be returned to the test dashboard where you will see test results start to appear.

Scatterplot Scatterplot

Congratulations! You have successfully created a Real Browser Test in Splunk Synthetic Monitoring. Next, we will look into a test result in more detail.

Last Modified Apr 2, 2024

View test results

1. Click into a spike or failure in your test run results.

image image

2. What can you learn about this test run? If it failed, use the error message, filmstrip, video replay, and waterfall to understand what happened.

Single test run result Single test run result

3. What do you see in the resources? Make sure to click through all of the page (or transaction) tabs.

image image

Workshop Question

Do you see anything interesting? Common issues to find and fix include: unexpected response codes, duplicate requests, forgotten third parties, large or slow files, and long gaps between requests.

Want to learn more about specific performance improvements? Google and Mozilla have great resources to help understand what goes into frontend performance as well as in-depth details of how to optimize it.