Frontend Dashboards

15 minutes  

Go to Dashboards and find the End User Experiences dashboard group.

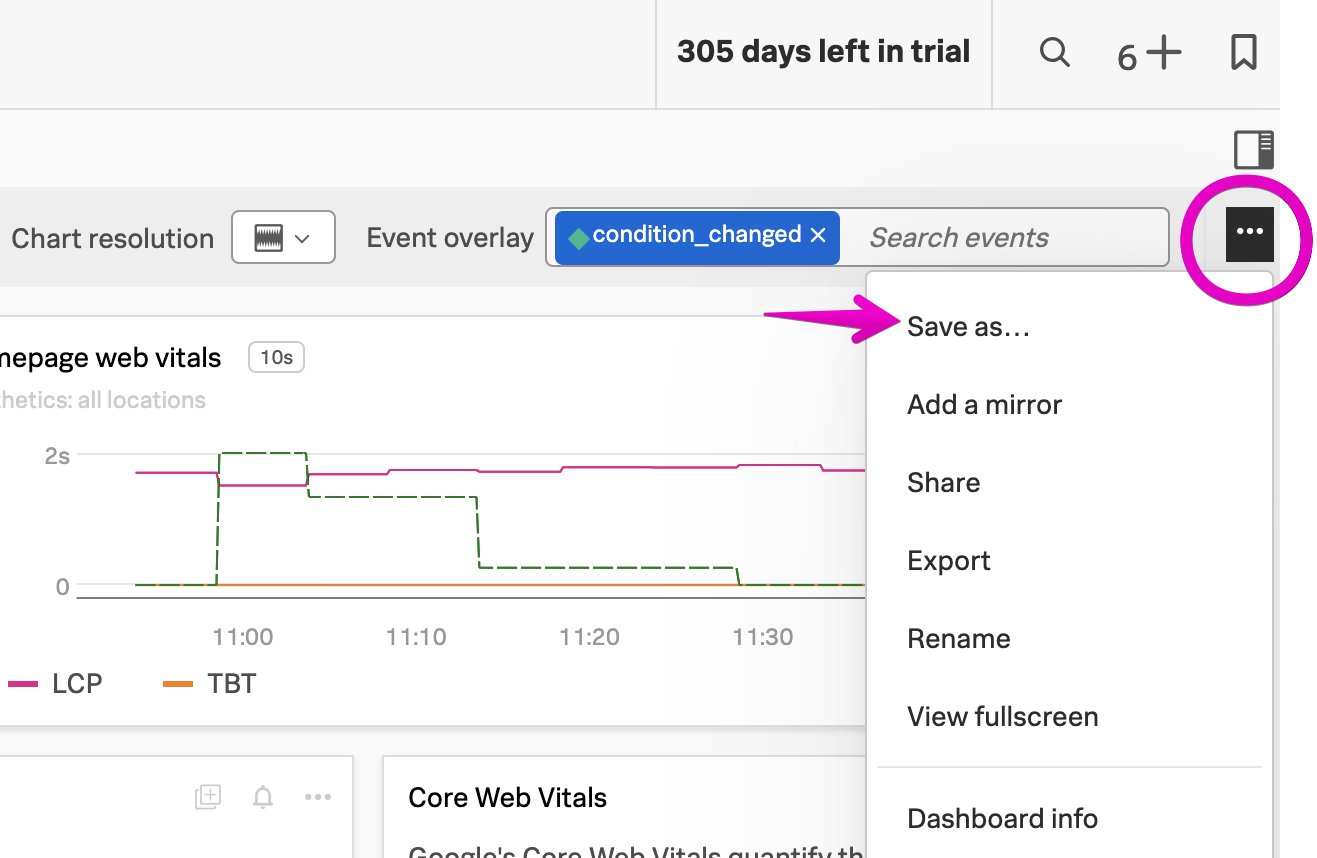
Click the three dots on the top right to open the dashboard menu, and select Save As, and include your team name and initials in the dashboard name.

Save to the dashboard group that matches your email address. Now you have your own copy of this dashboard to customize!

Dashboard save as Dashboard save as

Last Modified Apr 8, 2024

Subsections of Frontend Dashboards

Copying and editing charts

We have some good charts in our dashboard, but let’s add a few more.

  1. Go to Dashboards by clicking the dasboard icon on the left side of the screen. Find the Browser app health dashboard and scroll to the Largest Contentful Paint (LCP) chart. Click the chart actions icon to open the flyout menu, and click “Copy” to add this chart to your clipboard. copy chart copy chart

  2. Now you can continue to add any other charts to your clipboard by clicking the “add to clipboard” icon. copy chart inline icon copy chart inline icon

  3. When you have collected the charts you want on your dashboard, click the “create” icon on the top right. You might need to reload the page if you were looking at charts in another browser tab. create icon create icon

  4. Click the “Paste charts” menu option. paste charts paste charts

Now you are able to resize and edit the charts as you’d like!

Bonus: edit chart data

  1. Click the chart actions icon and select Open to edit the chart. chart actions menu chart actions menu

  2. Remove the existing Test signal. edit the test signal edit the test signal

  3. Click Add filter and type test: *yourInitials*. This will use a wildcard match so that all of the tests you have created that contain your initials (or any string you decide) will be pulled into the chart. add filter button add filter button

  4. Click into the functions to see how adding and removing dimensions changes how the data is displayed. For example, if you want all of your test location data rolled up, remove that dimension from the function. test signal functions test signal functions

  5. Change the chart name and description as appropriate, and click “Save and close” to commit your changes or just “Close” to cancel your changes. chart close buttons chart close buttons

Last Modified Apr 2, 2024

Events in context with chart data

Seeing the visualization of our KPIs is great. What’s better? KPIs in context with events! Overlaying events on a dashboard can help us more quickly understand if an event like a deployment caused a change in metrics, for better or worse.

  1. Your instructor will push a condition change to the workshop application. Click the event marker on any of your dashboard charts to see more details. condition change event condition change event

  2. In the dimensions, we can see more details about this specific event. If we click the event record, we can mark for deletion if needed. event record event record event details event details

  3. We can also see a history of events in the event feed by clicking the icon on the top right of the screen, and selecting Event feed. event feed event feed

  4. Again, we can see details about recent events in this feed. event details event details

  5. We can also add new events in the GUI or via API. To add a new event in the GUI, click the New event button. GUI add event button GUI add event button

  6. Name your event with your team name, initials, and what kind of event it is (deployment, campaign start, etc). Choose a timestamp, or leave as-is to use the current time, and click “Create”. create event form create event form

  7. Now, we need to make sure our new event is overlaid in this dashboard. Wait a minute or so (refresh the page if needed) and then search for the event in the Event overlay field. overlay event overlay event

  8. If your event is within the dashboard time window, you should now see it overlaid in your charts. Click “Save” to make sure your event overlay is saved to your dashboard! save dashboard save dashboard

Keep in mind

Want to add context to that bug ticket, or show your manager how your change improved app performance? Seeing observability data in context with events not only helps with troubleshooting, but also helps us communicate with other teams.