Detectors
20 minutesAfter we have a good understanding of our performance baseline, we can start to create Detectors so that we receive alerts when our KPIs are unexpected. If we create detectors before understanding our baseline, we run the risk of generating unnecessary alert noise.
For RUM and Synthetics, we will explore how to create detectors:
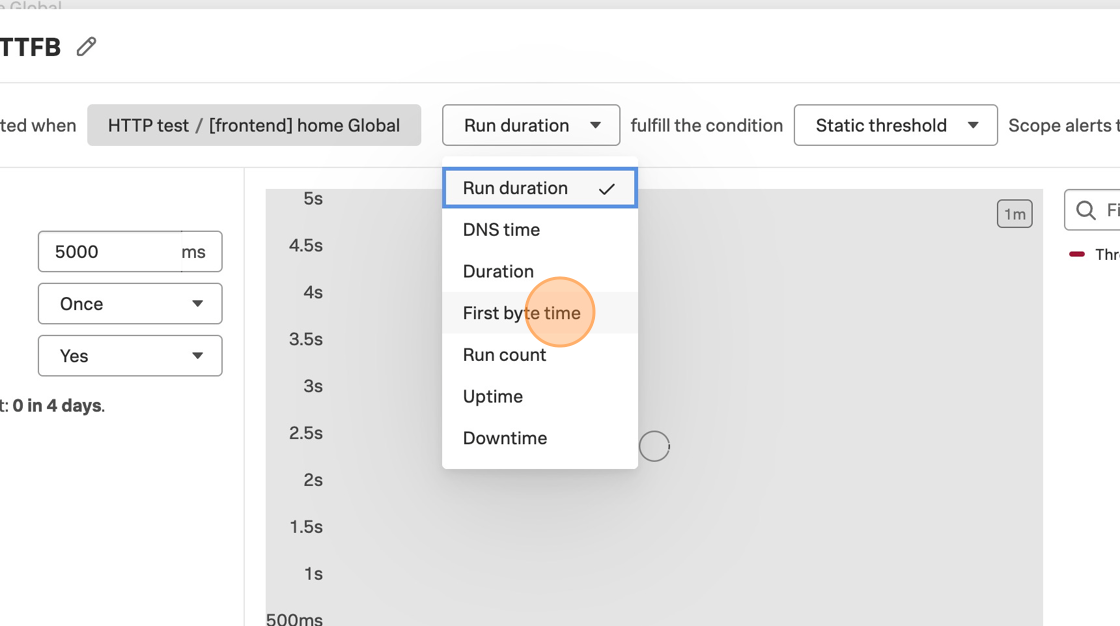
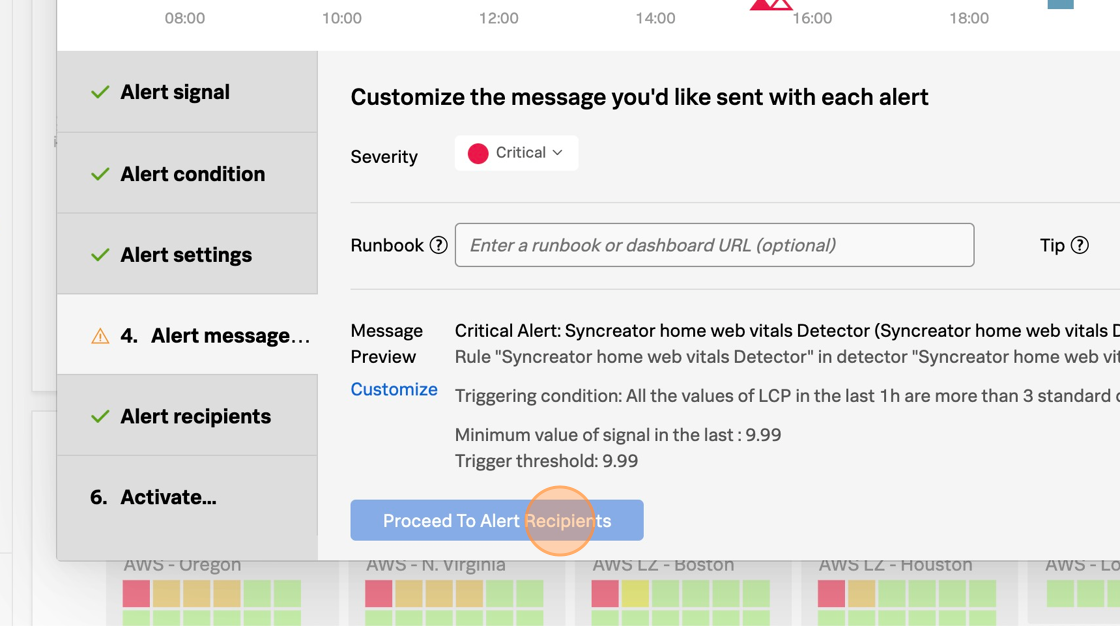
- on a single Synthetic test
- on a single KPI in RUM
- on a dashboard chart
For more Detector resources, please see our Observability docs, Lantern, and consider an Education course if you’d like to go more in depth with instructor guidance.