Keep in mind throughout the workshop: how can I prioritize activities strategically to get the fastest time to value for my end users and for myself/ my developers?
Context
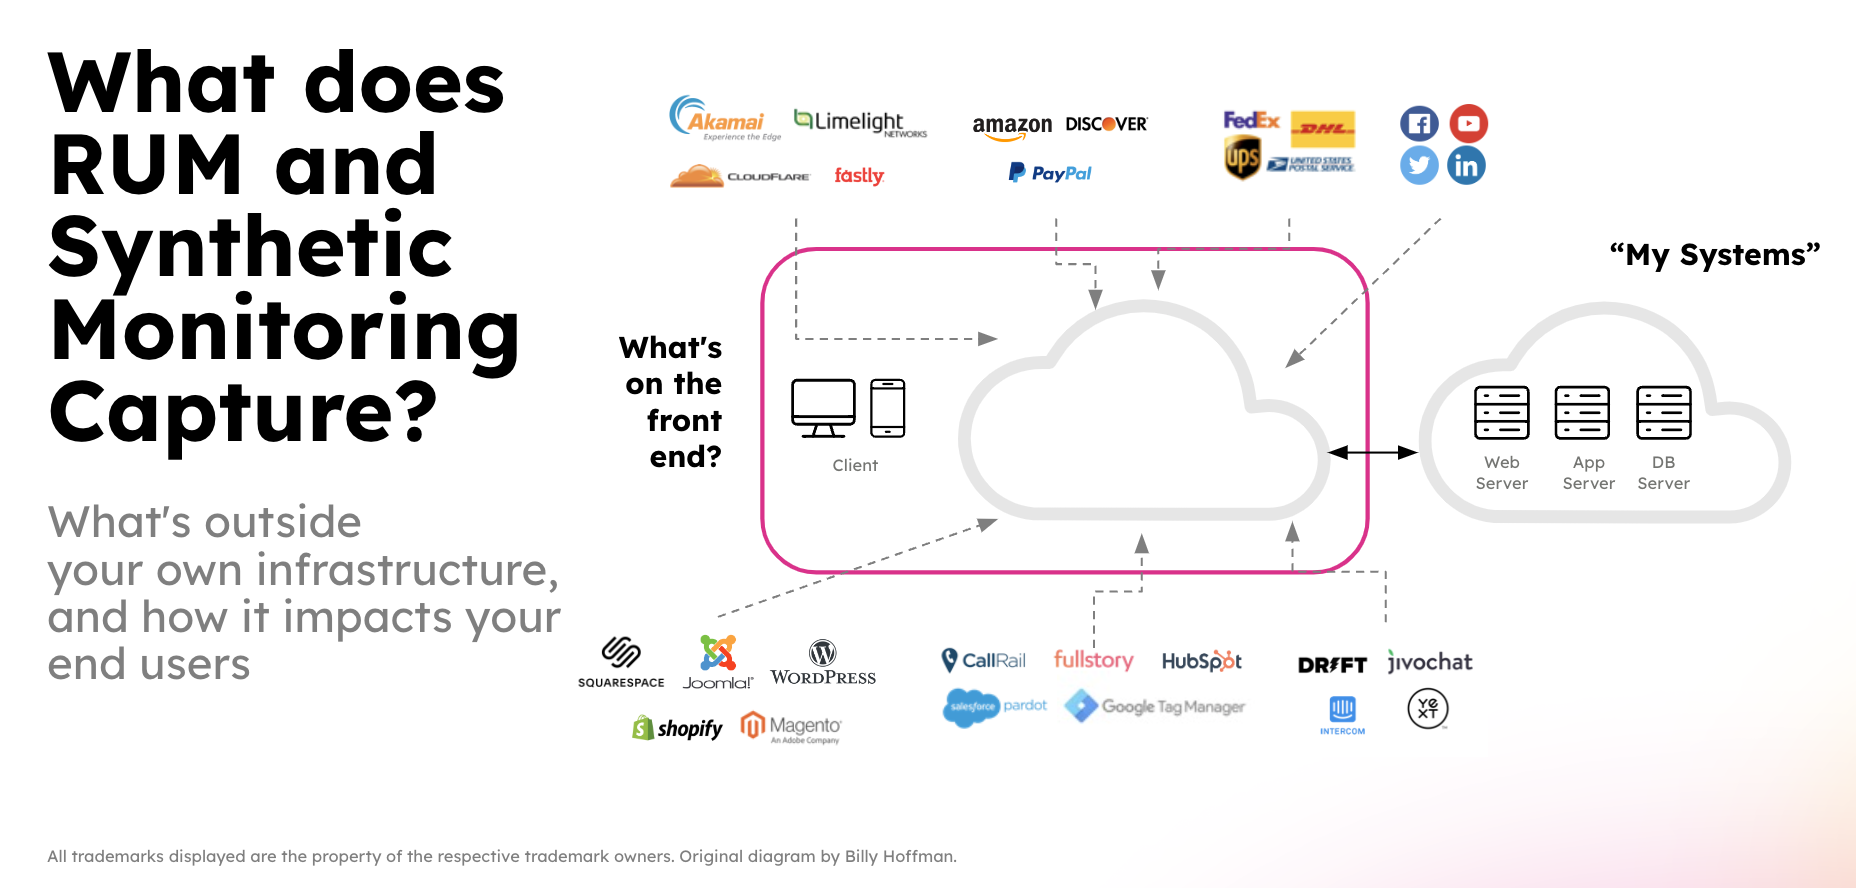
As a reminder, we need frontend performance monitoring to capture everything that goes into our end user experience. If we’re just monitoring the backend, we’re missing all of the other resources that are critical to our users’ success. Read What the Fastly Outage Can Teach Us About Observability for a real world example. Click the image below to zoom in.
References
Throughout this workshop, we will see references to resources to help further understand end user experience and how to optimize it. In addition to Splunk Docs for supported features and Lantern for tips and tricks, Google’s web.dev and Mozilla are great resources.
Remember that the specific libraries, platforms, and CDNs you use often also have their own specific resources. For example React, Wordpress, and Cloudflare all have their own tips to improve performance.
Subsections of Optimize End User Experiences
Synthetics
Let’s quickly set up some tests in Synthetics to immediately start understanding our end user experience, without waiting for real users to interact with our app.
We can capture not only the performance and availability of our own apps and endpoints, but also those third parties we rely on any time of the day or night.
The simplest way to keep an eye on endpoint availability is with an Uptime test. This lightweight test can run internally or externally around the world, as frequently as every minute. Because this is the easiest (and cheapest!) test to set up, and because this is ideal for monitoring availability of your most critical enpoints and ports, let’s start here.
Pre-requisites
Publicly accessible HTTP(S) endpoint(s) to test
Access to Splunk Observability Cloud
Subsections of Uptime Test
Creating a test
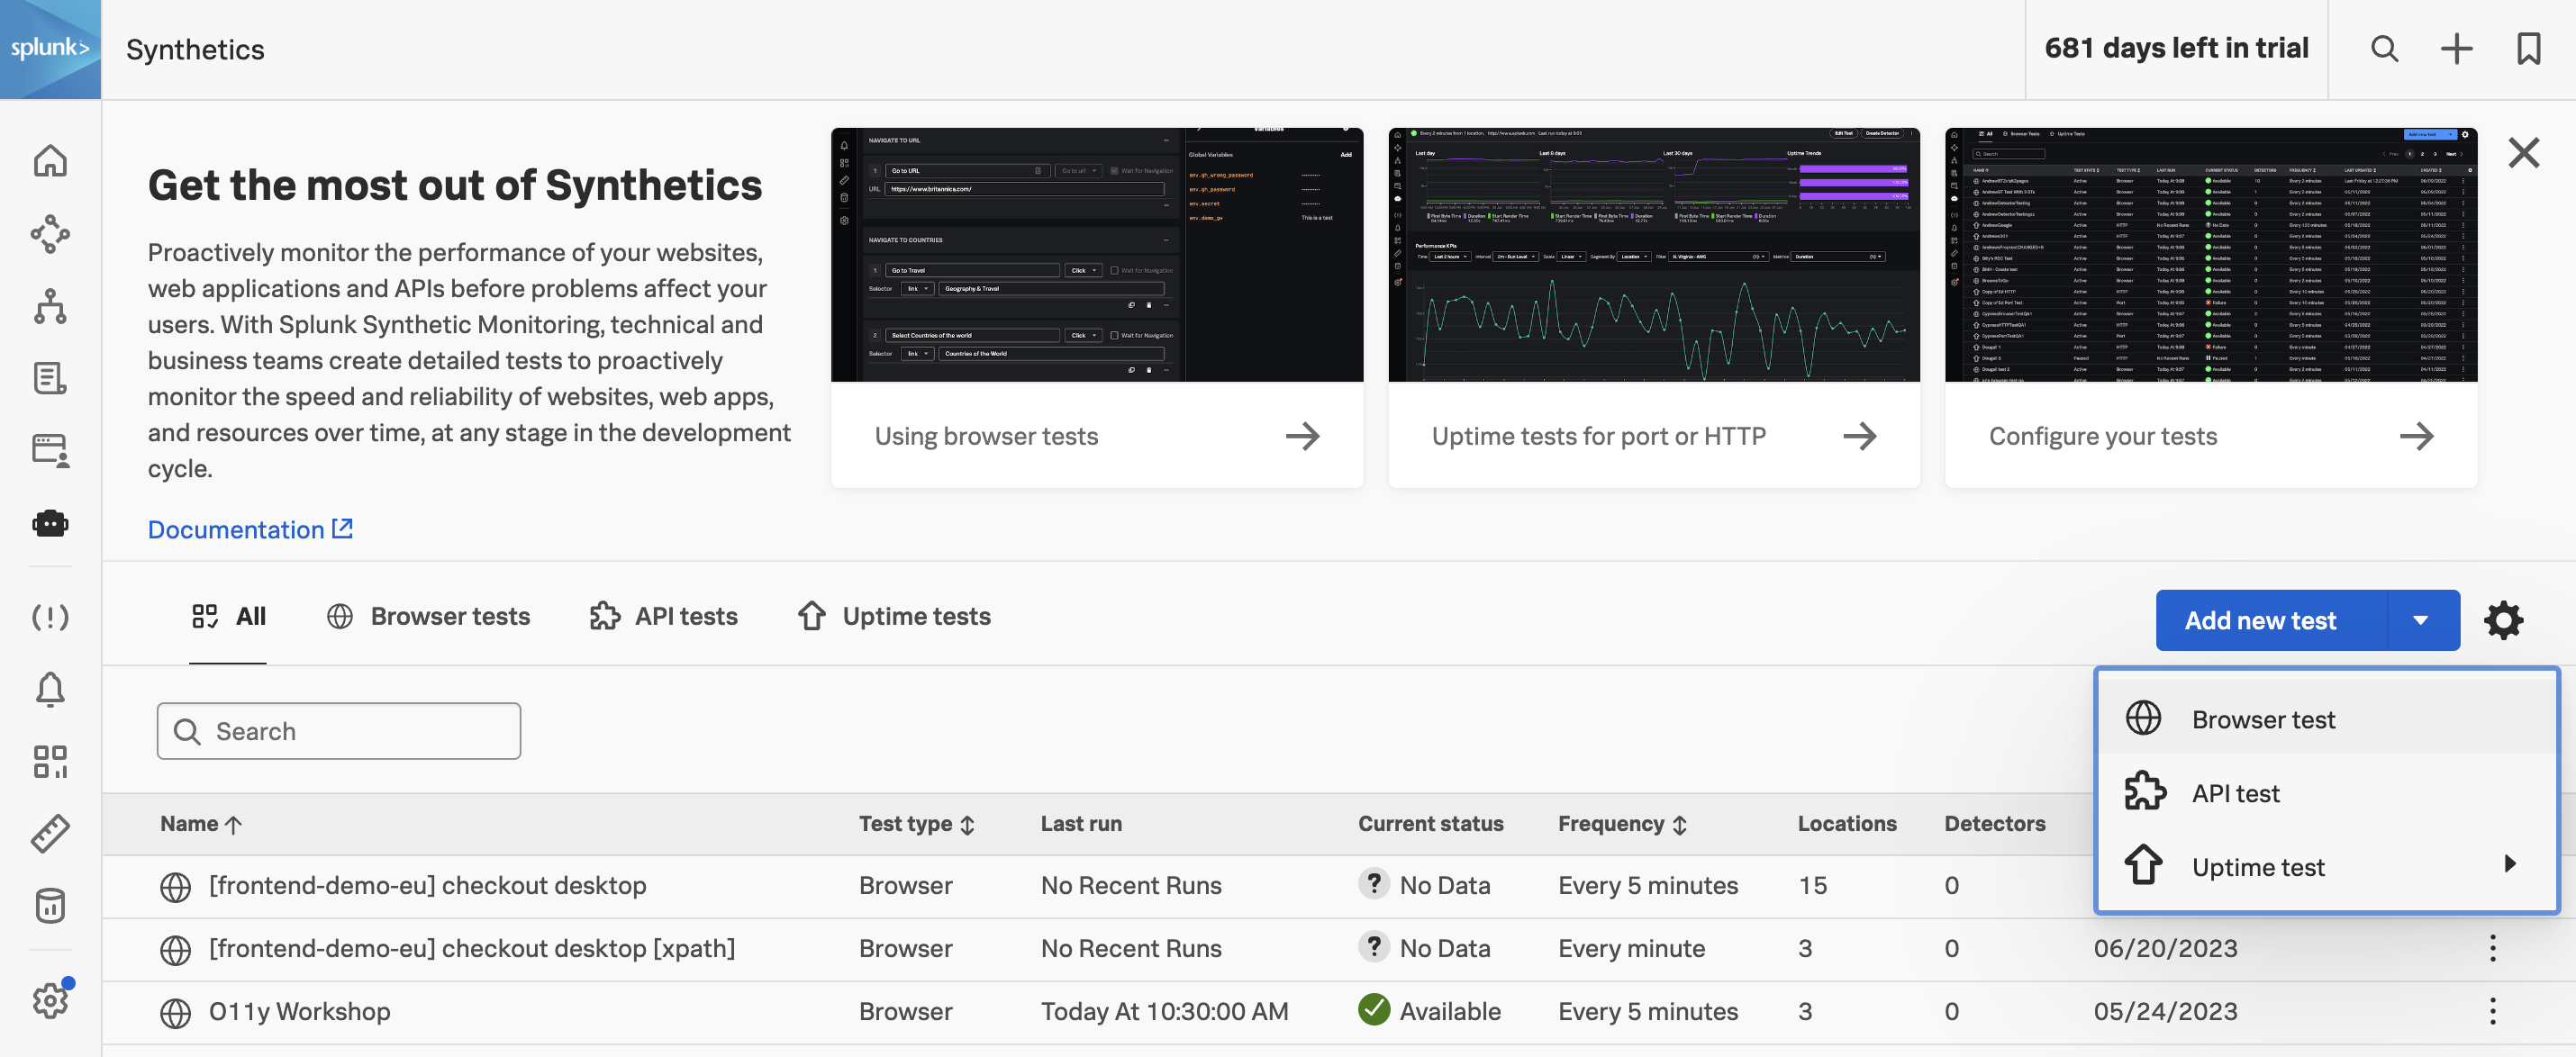
Open Synthetics
Click the Add new test button on the right side of the screen, then select Uptime and HTTP test.
Name your test with your team name (provided by your workshop instructor), your initials, and any other details you’d like to include, like geographic region.
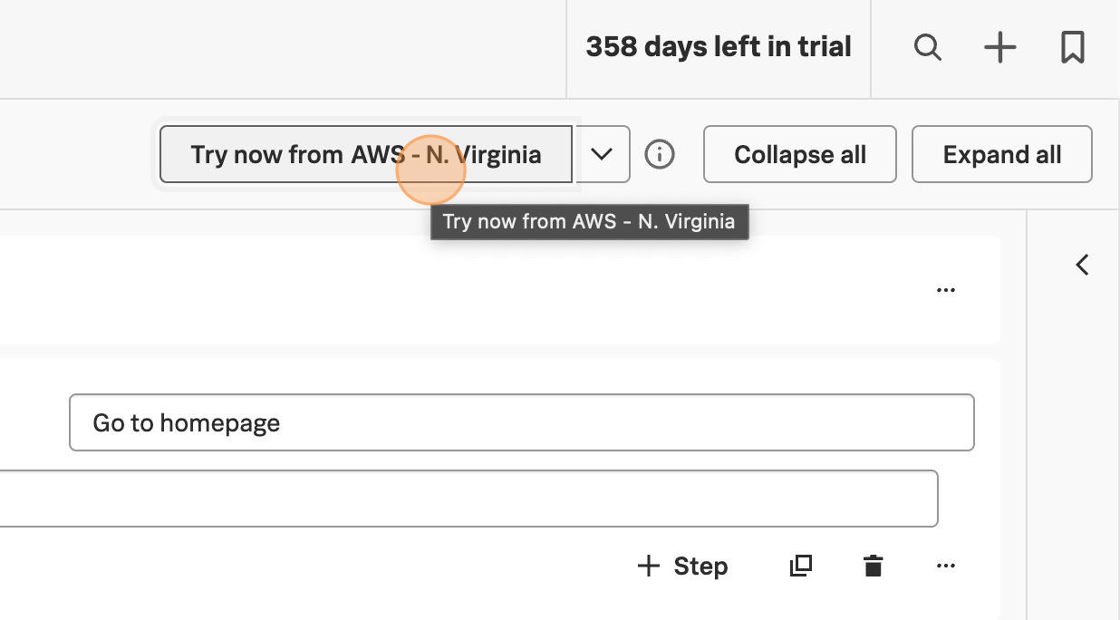
Click Try now to validate that the endpoint is accessible before the selected location before saving the test. Try now does not count against your subscription usage, so this is a good practice to make sure you’re not wasting real test runs on a misconfigured test.
Tip
A common reason for Try now to fail is that there is a non-2xx response code. If that is expected, add a Validation for the correct response code.
Add any additional validations needed, for example: response code, response header, and response size.
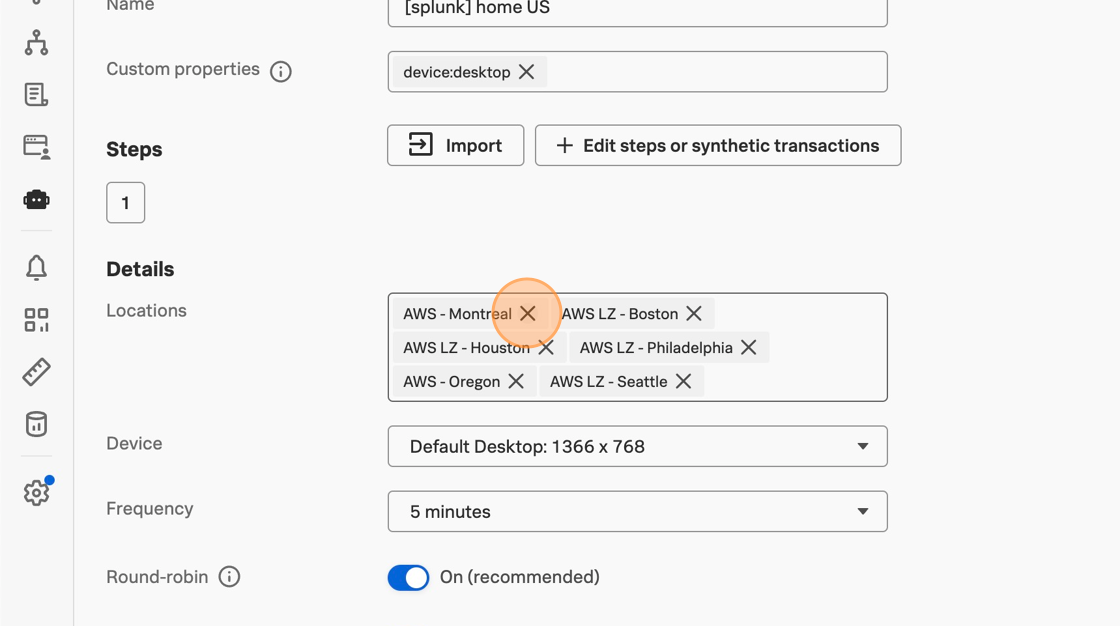
Add and remove any locations you’d like. Keep in mind where you expect your endpoint to be available.
Change the frequency to test your more critical endpoints more often, up to one minute.
Make sure “Round-robin” is on so the test will run from one location at a time, rather than from all locations at once.
If an endpoint is highly critical, think about if it is worth it to have all locations tested at the same time every single minute. If you have automations built in with a webhook from a detector, or if you have strict SLAs you need to track, this could be worth it to have as much coverage as possible. But if you are doing more manual investigation, or if this is a less critical endpoint, you could be wasting test runs that are executing while an issue is being investigated.
Remember that your license is based on the number of test runs per month. Turning Round-robin off will multiply the number of test runs by the number of locations you have selected.
When you are ready for the test to start running, make sure “Active” is on, then scroll down and click Submit to save the test configuration.
Now the test will start running with your saved configuration. Take a water break, then we’ll look at the results!
Understanding results
Click into a test summary view and play with the Performance KPIs chart filters to see how you can slice and dice your data. This is a good place to get started understanding trends. Later, we will see what custom charts look like, so you can tailor dashboards to the KPIs you care about most.
Workshop Question: Using the Performance KPIs chart
What metrics are available? Is your data consistent across time and locations? Do certain locations run slower than others? Are there any spikes or failures?
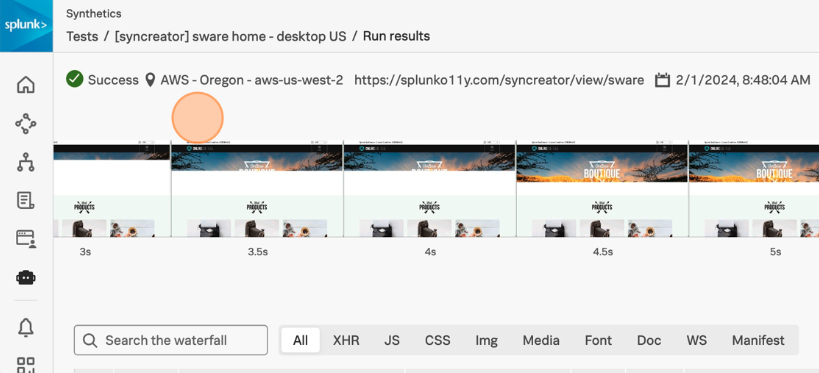
Click into a recent run either in the chart or in the table below.
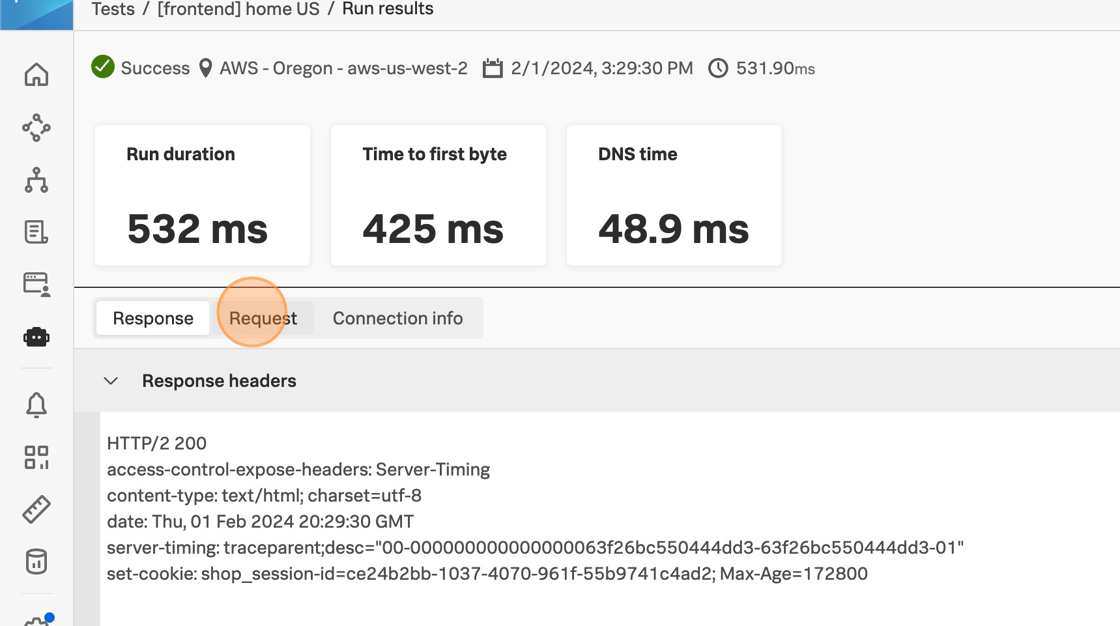
If there are failures, look at the response to see if you need to add a response code assertion (302 is a common one), if there is some authorization needed, or different request headers added. Here we have information about this particular test run including if it succeeded or failed, the location, timestamp, and duration in addition to the other Uptime test metrics. Click through to see the response, request, and connection info as well.
If you need to edit the test for it to run successfully, click the test name in the top left breadcrumb on this run result page, then click Edit test on the top right of the test overview page. Remember to scroll down and click Submit to save your changes after editing the test configuration.
In addition to the test running successfully, there are other metrics to measure the health of your endpoints. For example, Time to First Byte(TTFB) is a great indicator of performance, and you can optimize TTFB to improve end user experience.
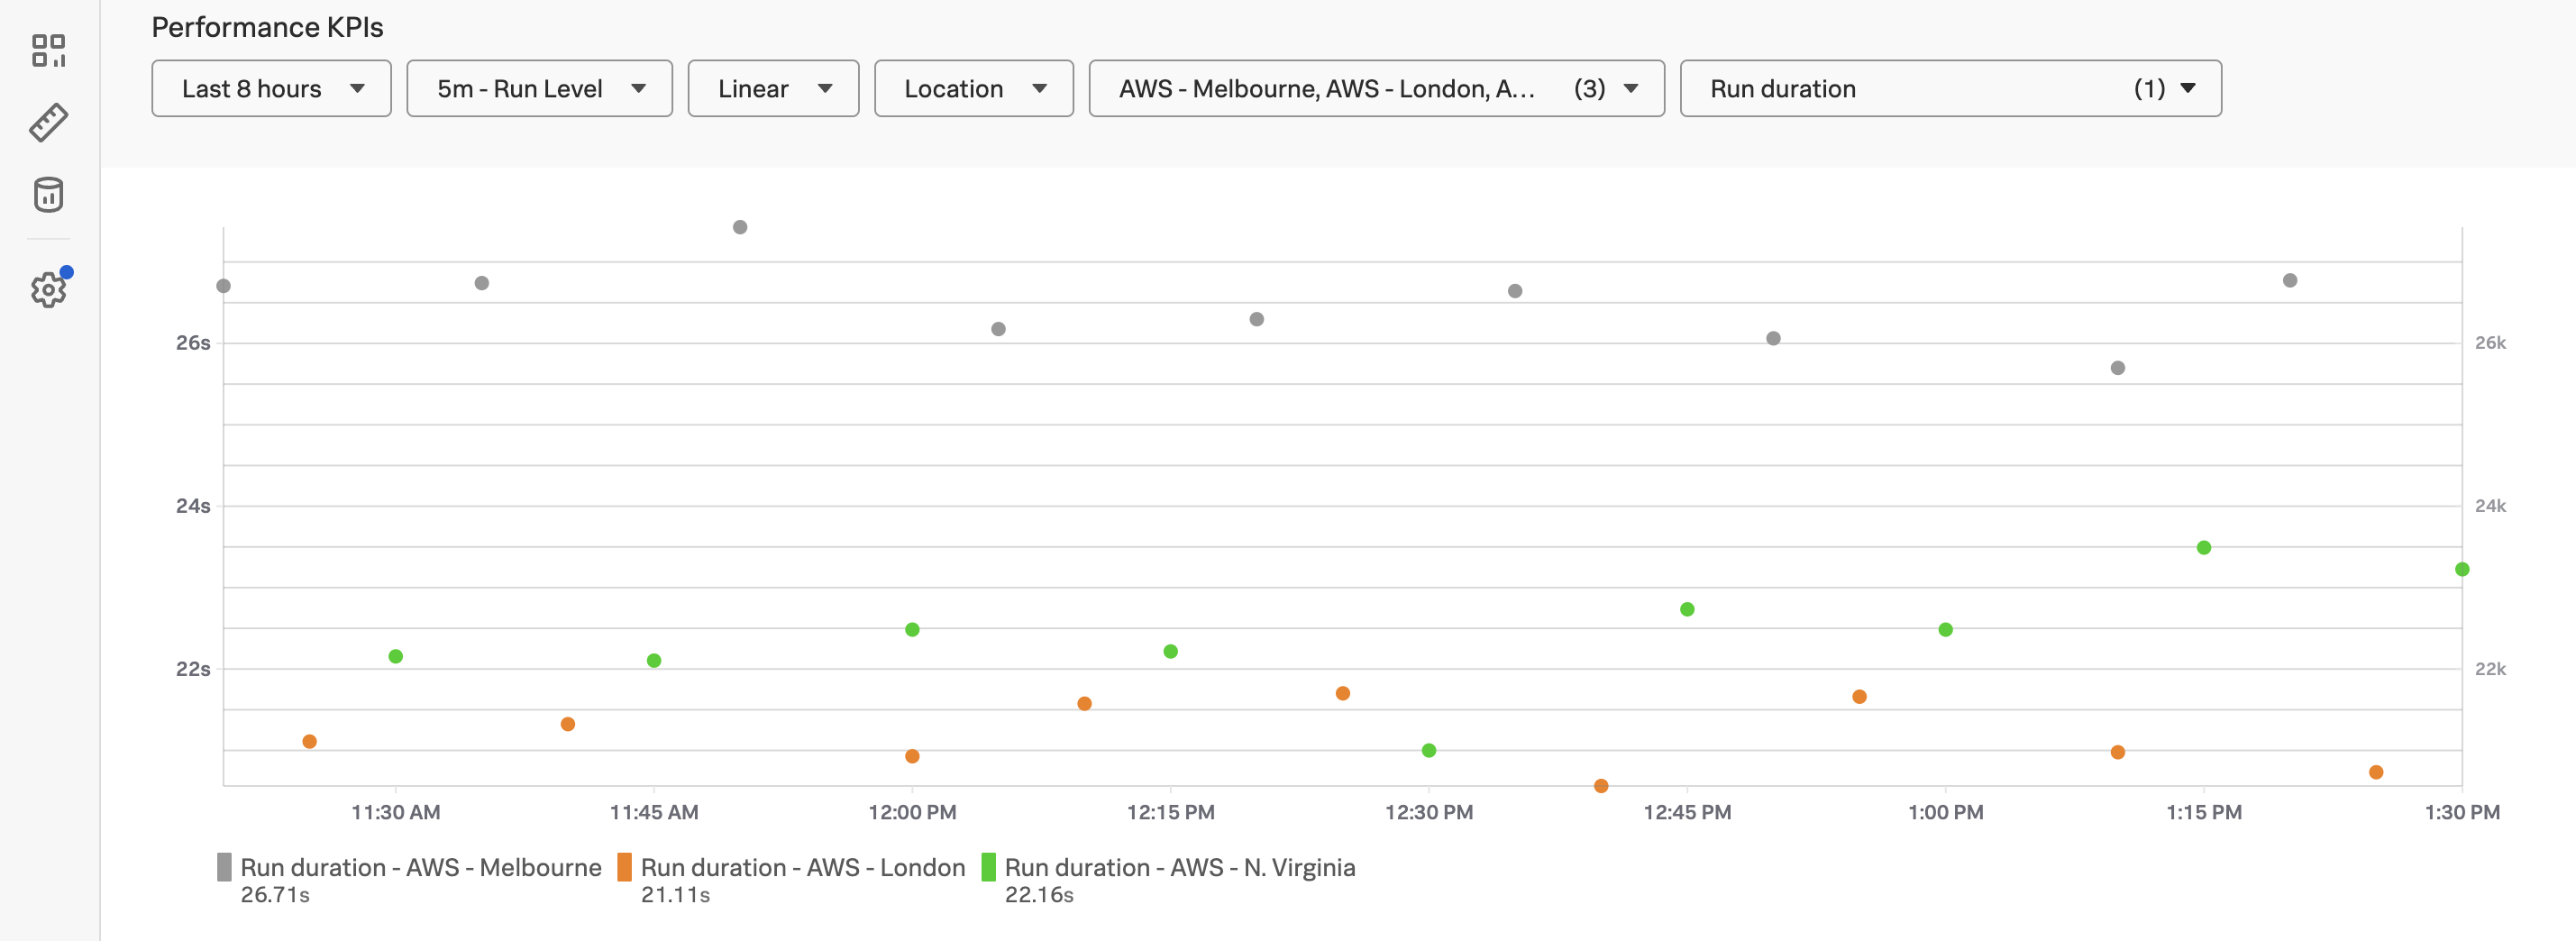
Go back to the test overview page and change the Performance KPIs chart to display First Byte time, and change the interval if needed to better see trends in the data.
In the example above, we can see that TTFB varies consistently between locations. Knowing this, we can keep location in mind when reporting on metrics. We could also improve the experience, for example by serving users in those locations an endpoint hosted closer to them, which should reduce network latency. We can also see some slight variations in the results over time, but overall we already have a good idea of our baseline for this endpoint’s KPIs. When we have a baseline, we can alert on worsening metrics as well as visualize improvements.
Tip
We are not setting a detector on this test yet, to make sure it is running consistently and successfully. If you are testing a highly critical endpoint and want to be alerted on it ASAP (and have tolerance for potential alert noise), jump to Single Test Detectors.
Once you have your Uptime test running successfully, let’s move on to the next test type.
API Test
5 minutes
The API test provides a flexible way to check the functionality and performance of API endpoints. The shift toward API-first development has magnified the necessity to monitor the back-end services that provide your core front-end functionality.
Whether you’re interested in testing multi-step API interactions or you want to gain visibility into the performance of your endpoints, the API Test can help you accomplish your goals.
This excercise will walk through a multi-step test on the Spotify API. You can also use it as a reference to build tests on your own APIs or on those of your critical third parties.
Subsections of API Test
Global Variables
Global variables allow us to use stored strings in multiple tests, so we only need to update them in one place.
View the global variable that we’ll use to perform our API test. Click on Global Variables under the cog icon. The global variable named env.encoded_auth will be the one that we’ll use to build the spotify API transaction.
Create new API test
Create a new API test by clicking on the Add new test button and select API test from the dropdown. Name the test using your team name, your initials, and Spotify API e.g. [Daisy] RWC - Spotify API
Authentication Request
Click on + Add requests and enter the request step name e.g. Authenticate with Spotify API.
Expand the Request section, from the drop-down change the request method to POST and enter the following URL:
https://accounts.spotify.com/api/token
In the Payload body section enter the following:
grant_type=client_credentials
Next, add two + Request headers with the following key/value pairings:
CONTENT-TYPE: application/x-www-form-urlencoded
AUTHORIZATION: Basic {{env.encoded_auth}}
Expand the Validation section and add the following extraction:
Extract from Response bodyJSON$.access_token as access_token
This will parse the JSON payload that is received from the Spotify API, extract the access token and store it as a custom variable.
Search Request
Click on + Add Request to add the next step. Name the step Search for Tracks named “Up around the bend”.
Expand the Request section and change the request method to GET and enter the following URL:
Next, add two request headers with the following key/value pairings:
CONTENT-TYPE: application/json
AUTHORIZATION: Bearer {{custom.access_token}}
This uses the custom variable we created in the previous step!
Expand the Validation section and add the following extraction:
Extract from Response bodyJSON$.tracks.items[0].id as track.id
To validate the test before saving, change the location as needed and click Try now. See the docs for more information on the try now feature.
When the validation is successful, click on < Return to test to return to the test configuration page. And then click Save to save the API test.
Extra credit
Have more time to work on this test? Take a look at the Response Body in one of your run results. What additional steps would make this test more thorough? Edit the test, and use the Try now feature to validate any changes you make before you save the test.
View results
Wait for a few minutes for the test to provision and run. Once you see the test has run successfully, click on the run to view the results:
We have started testing our endpoints, now let’s test the front end browser experience.
Starting with a single page browser test will let us capture how first- and third-party resources impact how our end users experience our browser-based site. It also allows us to start to understand our user experience metrics before introducing the complexity of multiple steps in one test.
A page where your users commonly “land” is a good choice to start with a single page test. This could be your site homepage, a section main page, or any other high-traffic URL that is important to you and your end users.
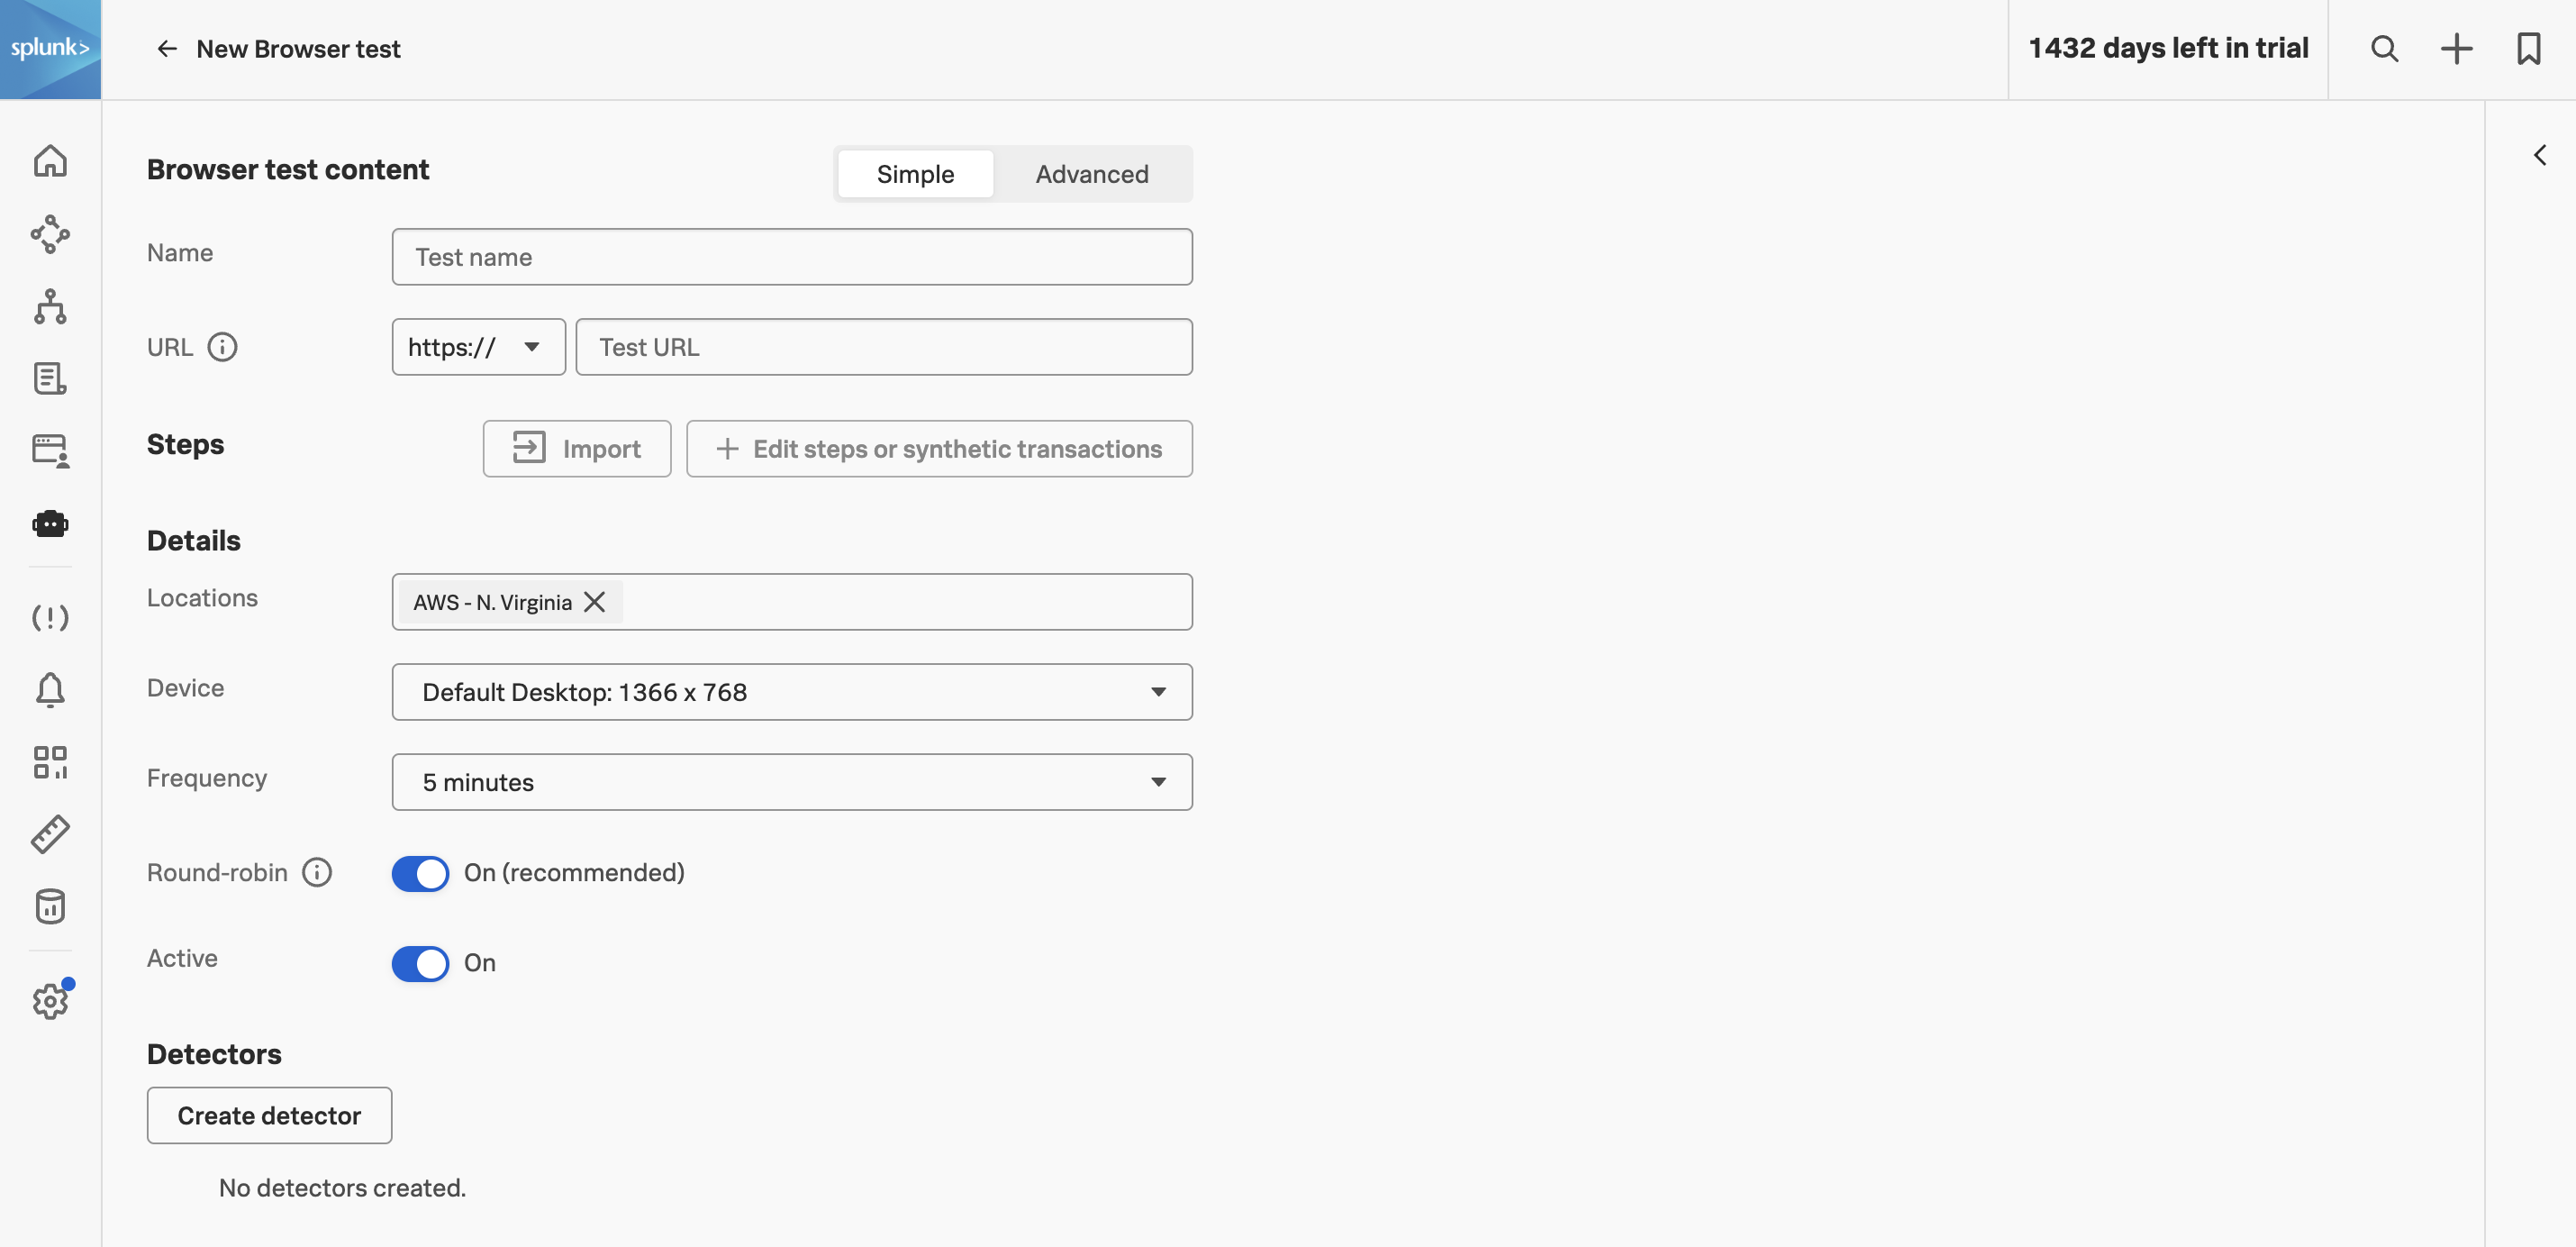
Click Add new test and select Browser test
Include your team name and initials in the test name. Add to the Name and Custom properties to describe the scope of the test (like Desktop for device type). Then click + Edit steps
Change the transaction label (top left) and step name (on the right) to something readable that describes the step. Add the URL you’d like to test. Your workshop instructor can provide you with a URL as well. In the below example, the transaction is “Home” and the step name is “Go to homepage”.
To validate the test, change the location as needed and click Try now. See the docs for more information on the try now feature.
Wait for the test validation to complete. If the test validation failed, double check your URL and test location and try again. With Try now you can see what the result of the test will be if it were saved and run as-is.
Click < Return to test to continue the configuration.
Edit the locations you want to use, keeping in mind any regional rules you have for your site.
You can edit the Device and Frequency or leave them at their default values for now. Click Submit to save the test and start running it.
Bonus Exercise
Have a few spare seconds? Copy this test and change just the title and device type, and save. Now you have visibility into the end user experience on another device and connection speed!
While our Synthetic tests are running, let’s see how RUM is instrumented to start getting data from our real users.
RUM
15 minutes
With RUM instrumented, we will be able to better understand our end users, what they are doing, and what issues they are encountering.
This workshop walks through how our demo site is instrumented and how to interpret the data. If you already have a RUM license, this will help you understand how RUM works and how you can use it to optimize your end user experience.
The aim of this Splunk Real User Monitoring (RUM) workshop is to let you:
Shop for items on the Online Boutique to create traffic, and create RUM User Sessions1 that you can view in the Splunk Observability Suite.
See an overview of the performance of all your application(s) in the Application Summary Dashboard
Examine the performance of a specific website with RUM metrics.
In order to reach this goal, we will use an online boutique to order various products. While shopping on the online boutique you will create what is called a User Session.
You may encounter some issues with this web site, and you will use Splunk RUM to identify the issues, so they can be resolved by the developers.
The workshop host will provide you with a URL for an online boutique store that has RUM enabled.
Each of these Online Boutiques are also being visited by a few synthetic users; this will allow us to generate more live data to be analyzed later.
A RUM User session is a “recording” of a collection of user interactions on an application, basically collecting a website or app’s performance measured straight from the browser or Mobile App of the end user. To do this a small amount of JavaScript is embedded in each page. This script then collects data from each user as he or she explores the page, and transfers that data back for analysis. ↩︎
RUM instrumentation in a browser app
Check the HEAD section of the Online-boutique webpage in your browser
Find the code that instruments RUM
1. Browse to the Online Boutique
Your workshop instructor will provide you with the Online Boutique URL that has RUM installed so that you can complete the next steps.
2. Inspecting the HTML source
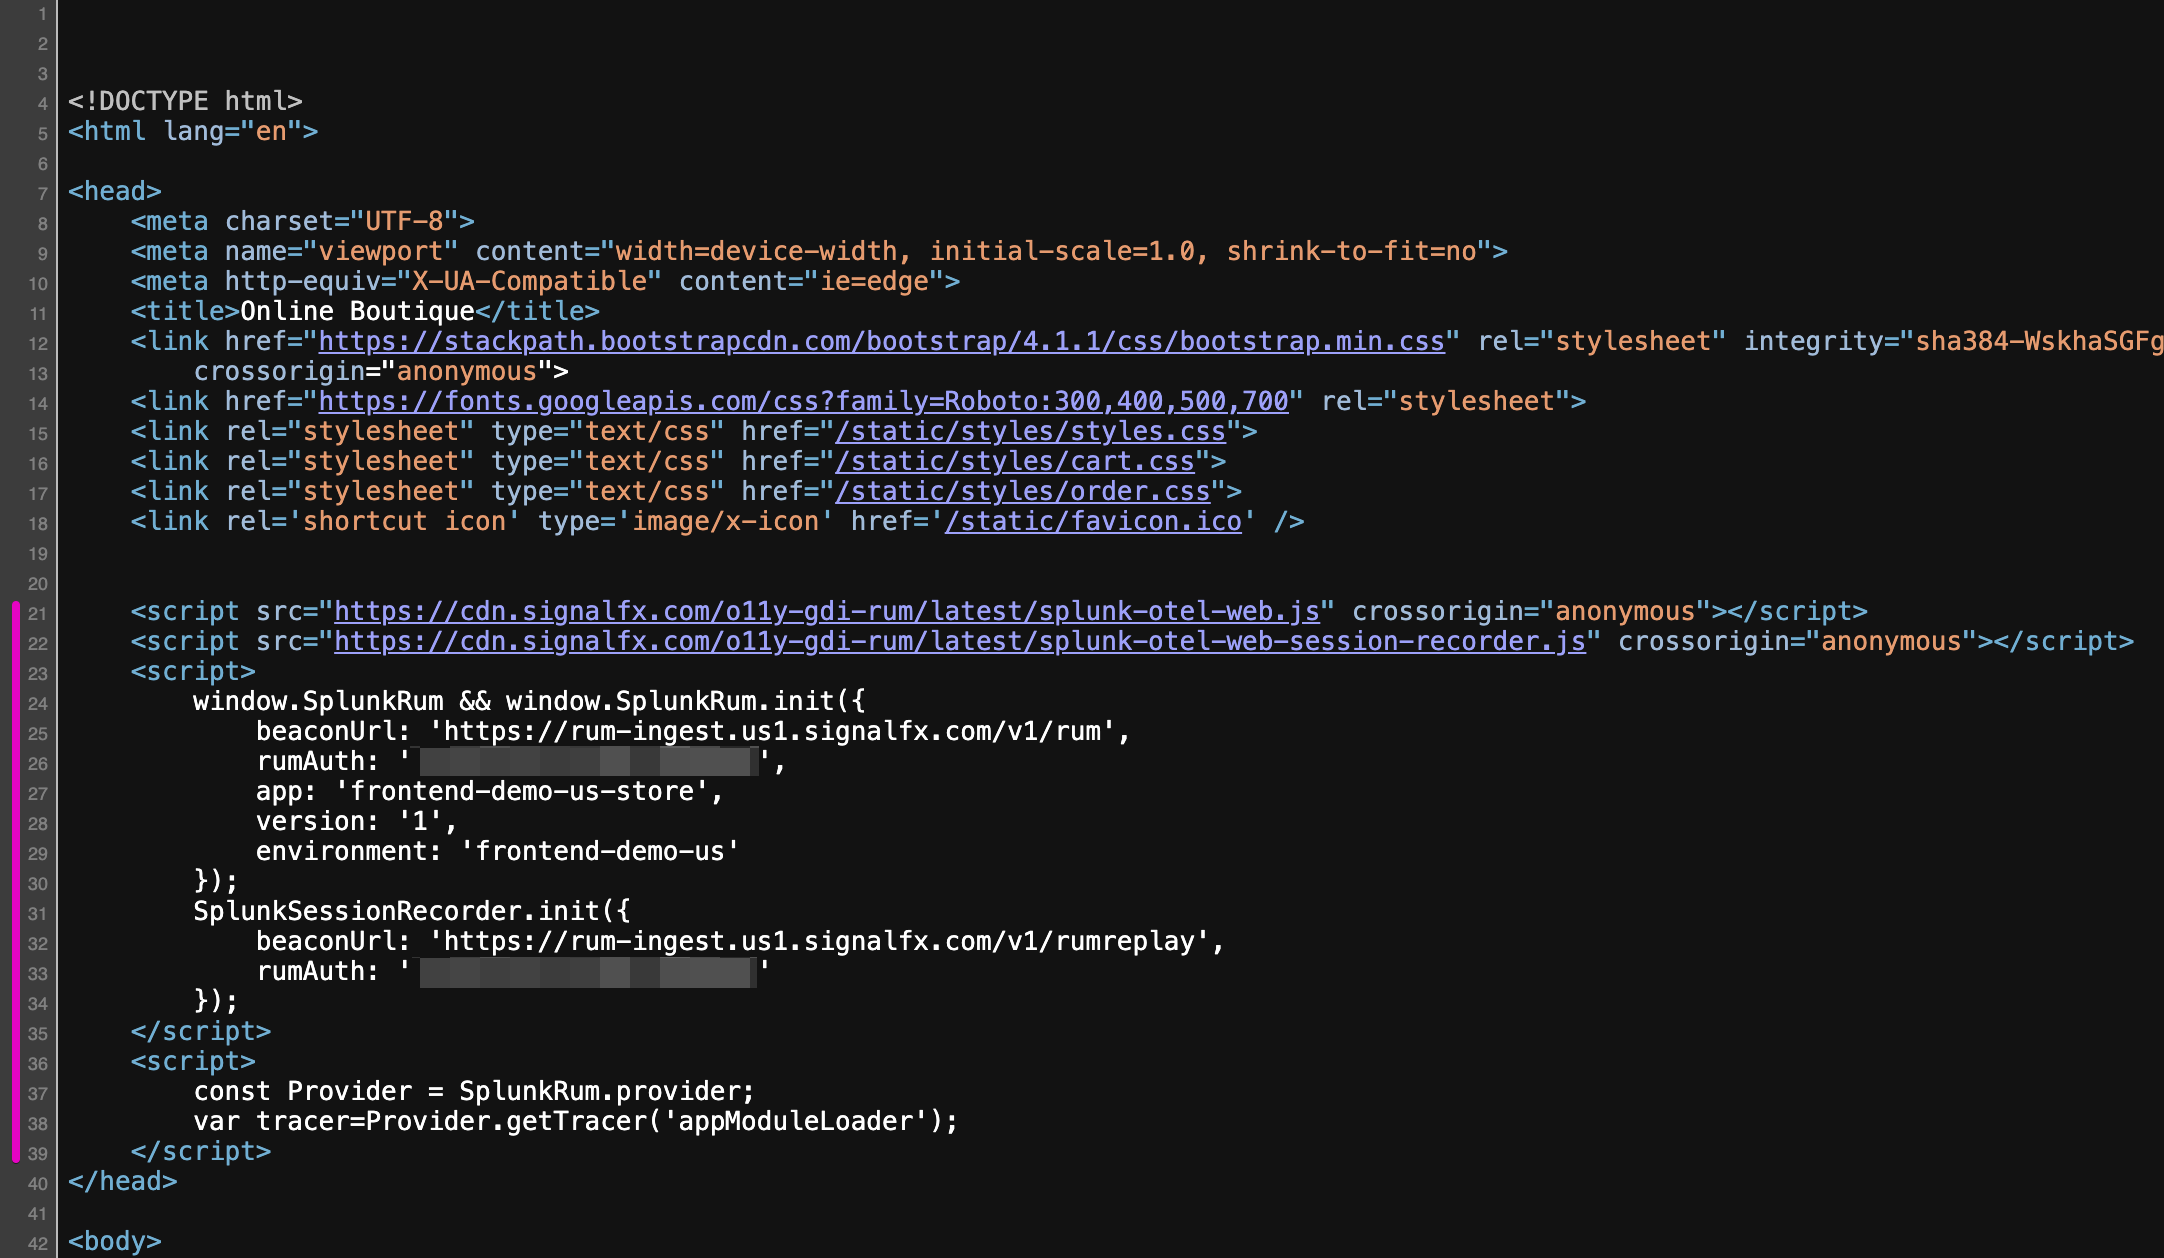
The changes needed for RUM are placed in the <head> section of the hosts Web page. Right click to view the page source or to inspect the code. Below is an example of the <head> section with RUM:
This code enables RUM Tracing, Session Replay, and Custom Events to better understand performance in the context of user workflows:
The first part is to indicate where to download the Splunk Open Telemetry Javascript file from: https://cdn.signalfx.com/o11y-gdi-rum/latest/splunk-otel-web.js (this can also be hosted locally if so required).
The next section defines the location where to send the traces to in the beacon url: {beaconUrl: "https://rum-ingest.eu0.signalfx.com/v1/rum"
The RUM Access Token: rumAuth: "<redacted>".
Identification tags app and environment to indentify in the SPLUNK RUM UI e.g. app: "online-boutique-us-store", environment: "online-boutique-us"} (these values will be different in your workshop)
The above lines 21 and 23-30 are all that is required to enable RUM on your website!
Lines 22 and 31-34 are optional if you want Session Replay instrumented.
Line 36-39 var tracer=Provider.getTracer('appModuleLoader'); will add a Custom Event for every page change, allowing you to better track your website conversions and usage. This may or may not be instrumented for this workshop.
Exercise
Time to shop! Take a minute to open the workshop store URL in as many browsers and devices as you’d like, shop around, add items to cart, checkout, and feel free to close the shopping browsers when you’re finished. Keep in mind this is a lightweight demo shop site, so don’t be alarmed if the cart doesn’t match the item you picked!
RUM Landing Page
Visit the RUM landing page and and check the overview of the performance of all your RUM enabled applications with the Application Summary Dashboard (Both Mobile and Web based)
1. Visit the RUM Landing Page
Login into Splunk Observability. From the left side menu bar select RUM. This will bring you to your the RUM Landing Page.
The goal of this page is to give you in a single page, a clear indication of the health, performance and potential errors found in your application(s) and allow you to dive deeper into the information about your User Sessions collected from your web page/App. You will have a pane for each of your active RUM applications. (The view below is the default expanded view)
If you have multiple applications, (which will be the case when every attendee is using their own ec2 instance for the RUM workshop), the pane view may be automatically reduced by collapsing the panes as shown below:
You can expanded a condensed RUM Application Summary View to the full dashboard by clicking on the small browser or Mobile icon. (Depending on the type of application: Mobile or Browser based) on the left in front of the applications name, highlighted by the red arrow.
First find the right application to use for the workshop:
If you are participating in a stand alone RUM workshop, the workshop leader will tell you the name of the application to use, in the case of a combined workshop, it will follow the naming convention we used for IM and APM and use the ec2 node name as a unique id like jmcj-store as shown as the last app in the screenshot above.
2. Configure the RUM Application Summary Dashboard Header Section
RUM Application Summary Dashboard consists of 6 major sections. The first is the selection header, where you can set/filter a number of options:
A drop down for the Time Window you’re reviewing (You are looking at the past 15 minutes by default)
A drop down to select the Environment1 you want to look at. This allows you to focus on just the subset of applications belonging to that environment, or Select all to view all available.
A drop down list with the various Apps being monitored. You can use the one provided by the workshop host or select your own. This will focus you on just one application.
A drop down to select the Source, Browser or Mobile applications to view. For the Workshop leave All selected.
A hamburger menu located at the right of the header allowing you to configure some settings of your Splunk RUM application. (We will visit this in a later section).
For the workshop lets do a deeper dive into the Application Summary screen in the next section: Check Health Browser Application
A common application deployment pattern is to have multiple, distinct application environments that don’t interact directly with each other but that are all being monitored by Splunk APM or RUM: for instance, quality assurance (QA) and production environments, or multiple distinct deployments in different datacenters, regions or cloud providers.
A deployment environment is a distinct deployment of your system or application that allows you to set up configurations that don’t overlap with configurations in other deployments of the same application. Separate deployment environments are often used for different stages of the development process, such as development, staging, and production. ↩︎
Check Browser Applications health at a glance
Get familiar with the UI and options available from this landing page
Identify Page Views/JavaScript Errors and Request/Errors in a single viewCheck the Web Vitals metrics and any Detector that has fired for in relation to your Browser Application
Application Summary Dashboard
1.Header Bar
As seen in the previous section the RUM Application Summary Dashboard consists of 5 major sections.The first section is the selection header, where you can collapse the Pane via the Browser icon or the > in front of the application name, which is jmcj-store in the example below. It also provides access to the Application Overview page if you click the link with your application name which is jmcj-store in the example below.
Further, you can also open the Application Overview or App Health Dashboard via the triple dot menu on the right.
For now, let’s look at the high level information we get on the application summary dashboard.
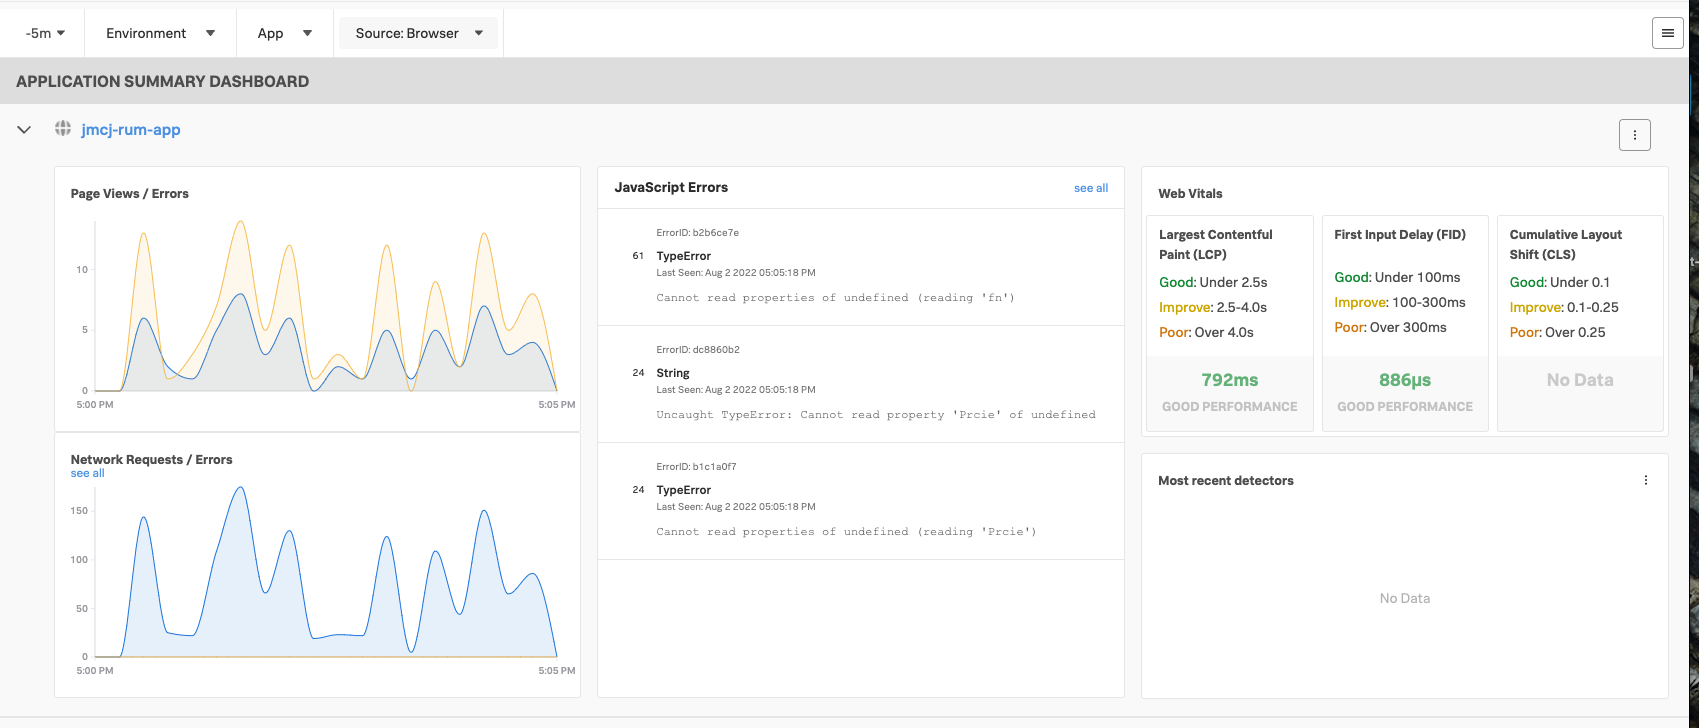
The RUM Application Summary Dashboard is focused on providing you with at a glance highlights of the status of your application.
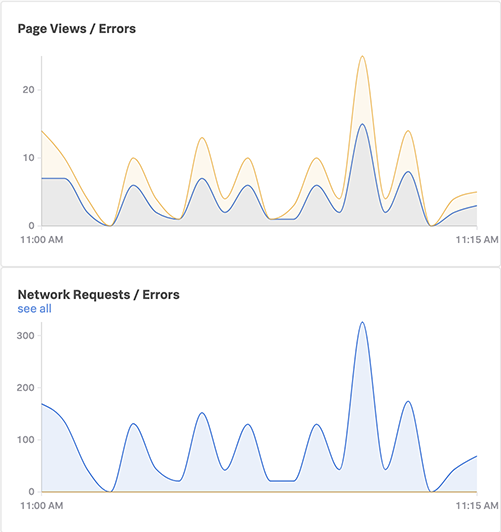
The first section shows Page Views / JavaScript Errors, & Network Requests and Errors charts show the quantity and trend of these issues in your application. This could be Javascript errors, or failed network calls to back end services.
In the example above you can see that there are no failed network calls in the Network chart, but in the Page View chart you can see that a number of pages do experience some errors. These are often not visible for regular users, but can seriously impact the performance of your web site.
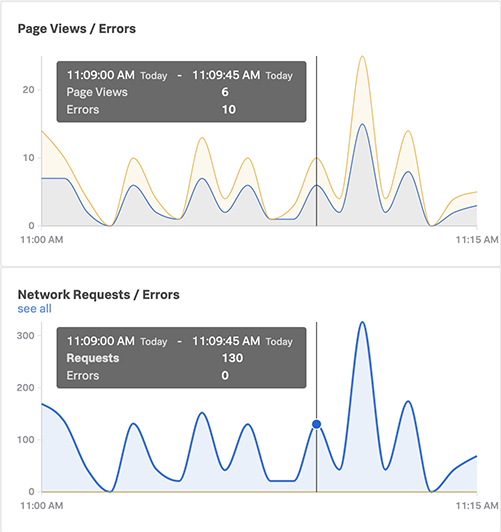
You can see the count of the Page Views / Network Requests / Errors by hovering over the charts.
3. JavaScript Errors
With the second section of the RUM Application Summary Dashboard we are showing you an overview of the JavaScript errors occurring in your application, along with a count of each error.
In the example above you can see there are three JavaScript errors, one that appears 29 times in the selected time slot, and the other two each appear 12 times.
If you click on one of the errors a pop-out opens that will show a summary (below) of the errors over time, along with a Stack Trace of the JavaScript error, giving you an indication of where the problems occurred. (We will see this in more detail in one of the following sections)
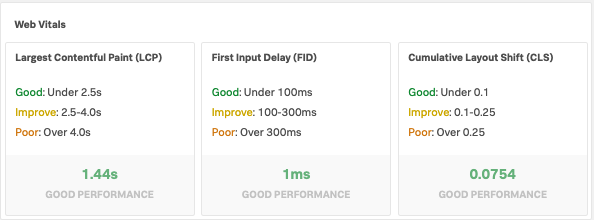
4. Web Vitals
The next section of the RUM Application Summary Dashboard is showing you Google’s Core Web Vitals, three metrics that are not only used by Google in its search ranking system, but also quantify end user experience in terms of loading, interactivity, and visual stability.
As you can see our site is well behaved and scores Good for all three Metrics. These metrics can be used to identify the effect changes to your application have, and help you improve the performance of your site.
If you click on any of the Metrics shown in the Web Vitals pane you will be taken to the corresponding Tag Spotlight Dashboard. e.g. clicking on the Largest Contentful Paint (LCP) chartlet, you will be taken to a dashboard similar to the screen shot below, that gives you timeline and table views for how this metric has performed. This should allow you to spot trends and identify where the problem may be more common, such as an operating system, geolocation, or browser version.
5. Most Recent Detectors
The final section of the RUM Application Summary Dashboard is focused on providing you an overview of recent detectors that have triggered for your application. We have created a detector for this screen shot but your pane will be empty for now. We will add some detectors to your site and make sure they are triggered in one of the next sections.
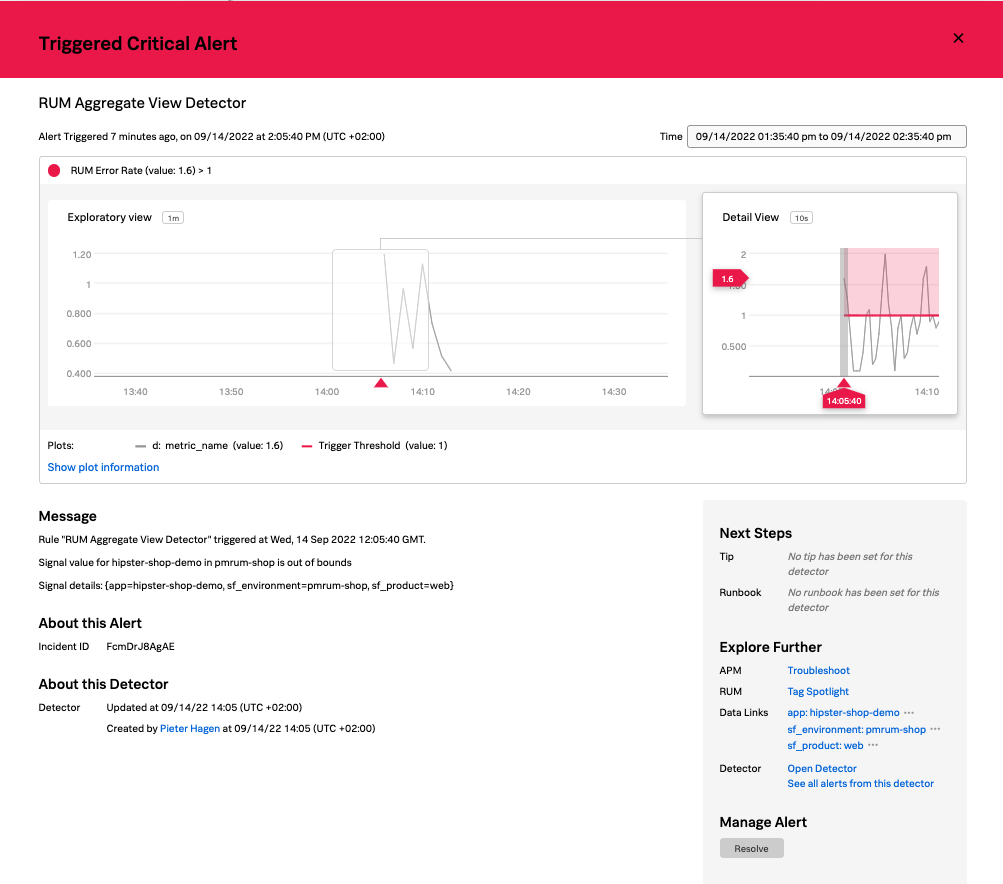
In the screen shot you can see we have a critical alert for the RUM Aggregated View Detector, and a Count, how often this alert has triggered in the selected time window. If you happen to have an alert listed, you can click on the name of the Alert (that is shown as a blue link) and you will be taken to the Alert Overview page showing the details of the alert (Note: this will move you away from the current page, Please use the Back option of your browser to return to the overview page).
Exercise
Please take a few minutes to experiment with the RUM Application Summary Dashboard and the underlying chart and dashboards before going on to the next section.
Analyzing RUM Metrics
See RUM Metrics and Session information in the RUM UI
See correlated APM traces in the RUM & APM UI
1. RUM Overview Pages
From your RUM Application Summary Dashboard you can see detailed information by opening the Application Overview Page via the tripple dot menu on the right by selecting Open Application Overview or by clicking the link with your application name which is jmcj-rum-app in the example below.
This will take you to the RUM Application Overview Page screen as shown below.
2. RUM Browser Overview
2.1. Header
The RUM UI consists of five major sections. The first is the selection header, where you can set/filter a number of options:
A drop down for the time window you’re reviewing (You are looking at the past 15 minutes in this case)
A drop down to select the Comparison window (You are comparing current performance on a rolling window - in this case compared to 1 hour ago)
A drop down with the available Environments to view
A drop down list with the Various Web apps
Optionally a drop down to select Browser or Mobile metrics (Might not be available in your workshop)
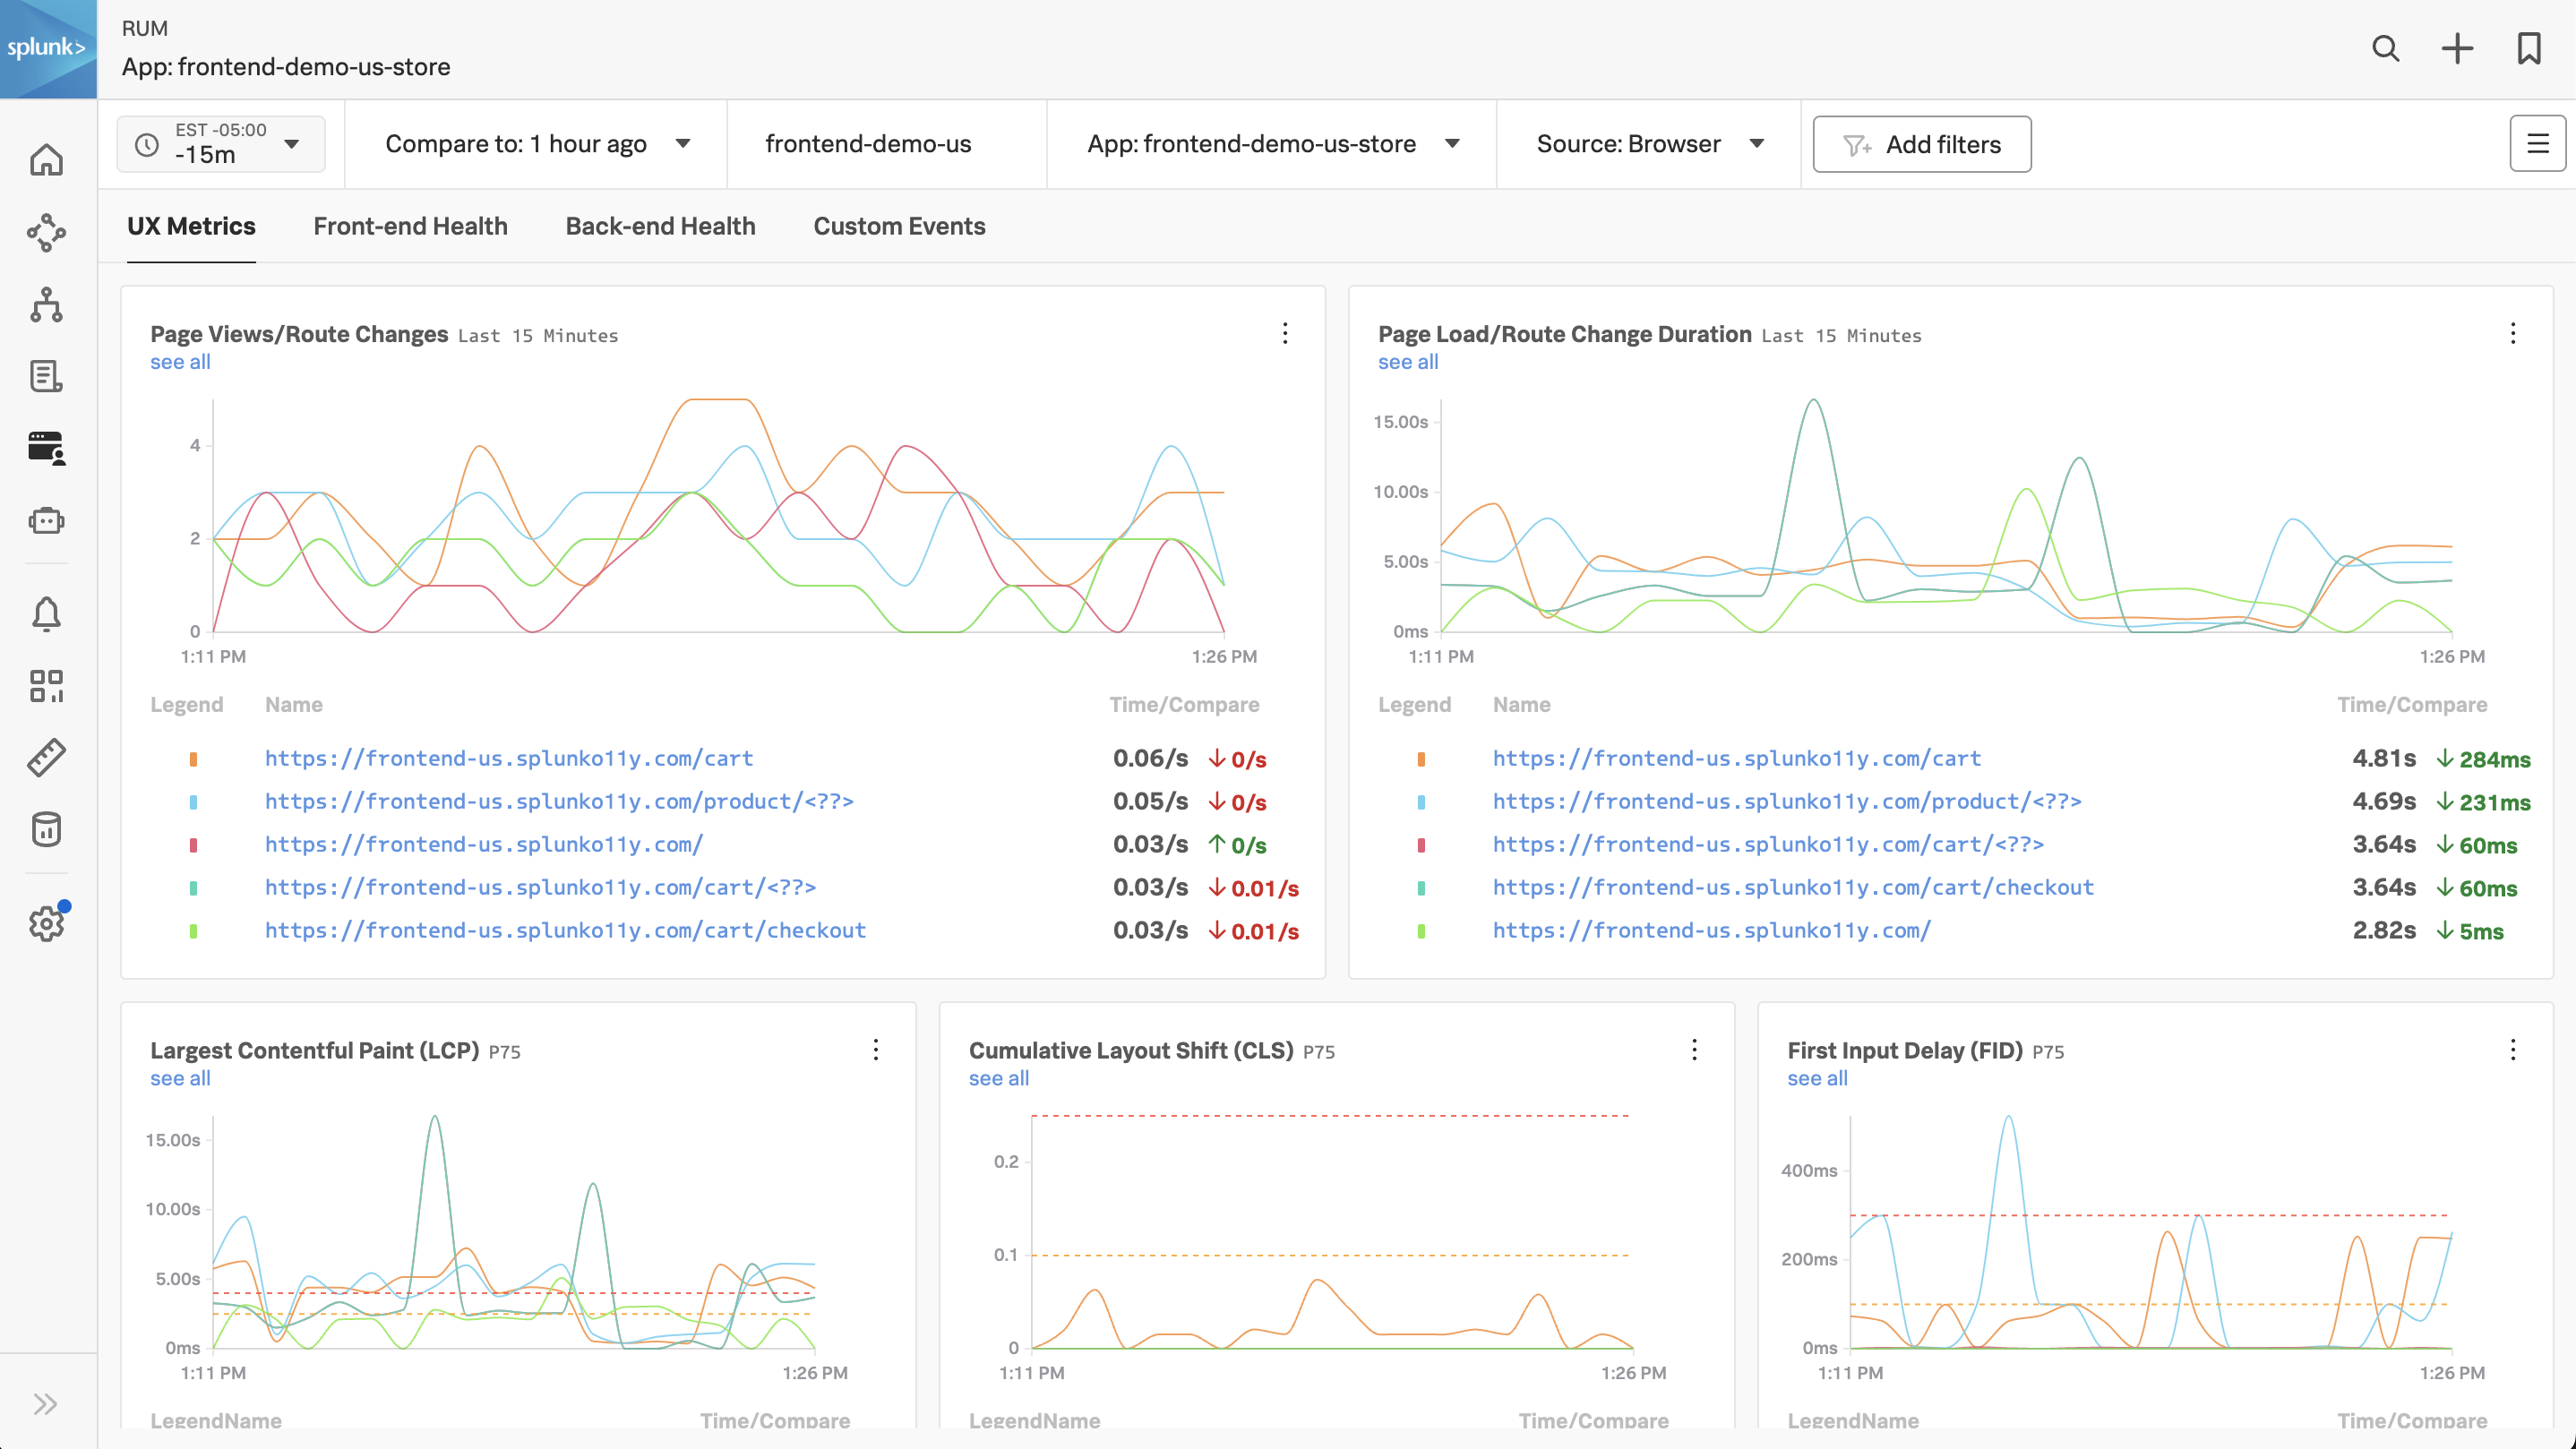
2.2. UX Metrics
By default, RUM prioritizes the metrics that most directly reflect the experience of the end user.
Additional Tags
All of the dashboard charts allow us to compare trends over time, create detectors, and click through to further diagnose issues.
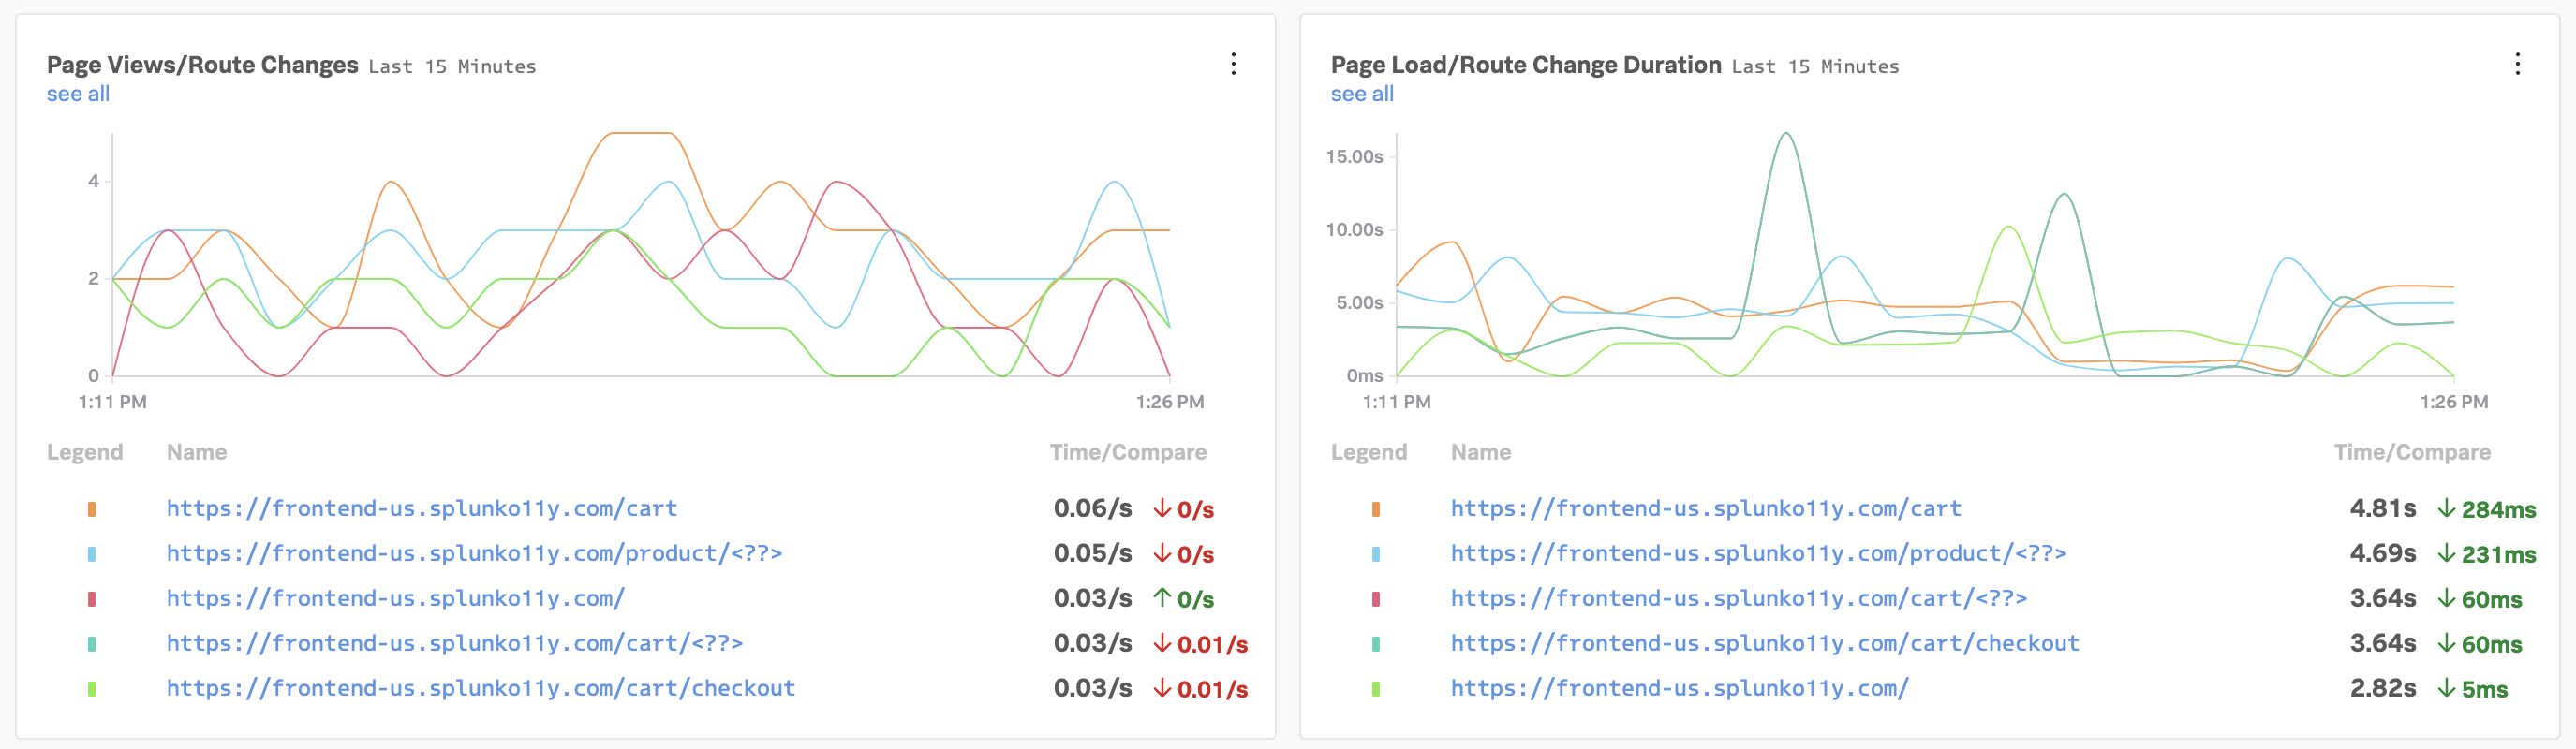
First, we see page load and route change information, which can help us understand if something unexpected is impacting user traffic trends.
Next, Google has defined Core Web Vitals to quantify the user experience as measured by loading, interactivity, and visual stability. Splunk RUM builds in Google’s thresholds into the UI, so you can easily see if your metrics are in an acceptable range.
Largest Contentful Paint (LCP), measures loading performance. How long does it take for the largest block of content in the viewport to load? To provide a good user experience, LCP should occur within 2.5 seconds of when the page first starts loading.
First Input Delay (FID), measures interactivity. How long does it take to be able to interact with the app? To provide a good user experience, pages should have a FID of 100 milliseconds or less.
Cumulative Layout Shift (CLS), measures visual stability. How much does the content move around after the initial load? To provide a good user experience, pages should maintain a CLS of 0.1. or less.
Improving Web Vitals is a key component to optimizing your end user experience, so being able to quickly understand them and create detectors if they exceed a threshold is critical.
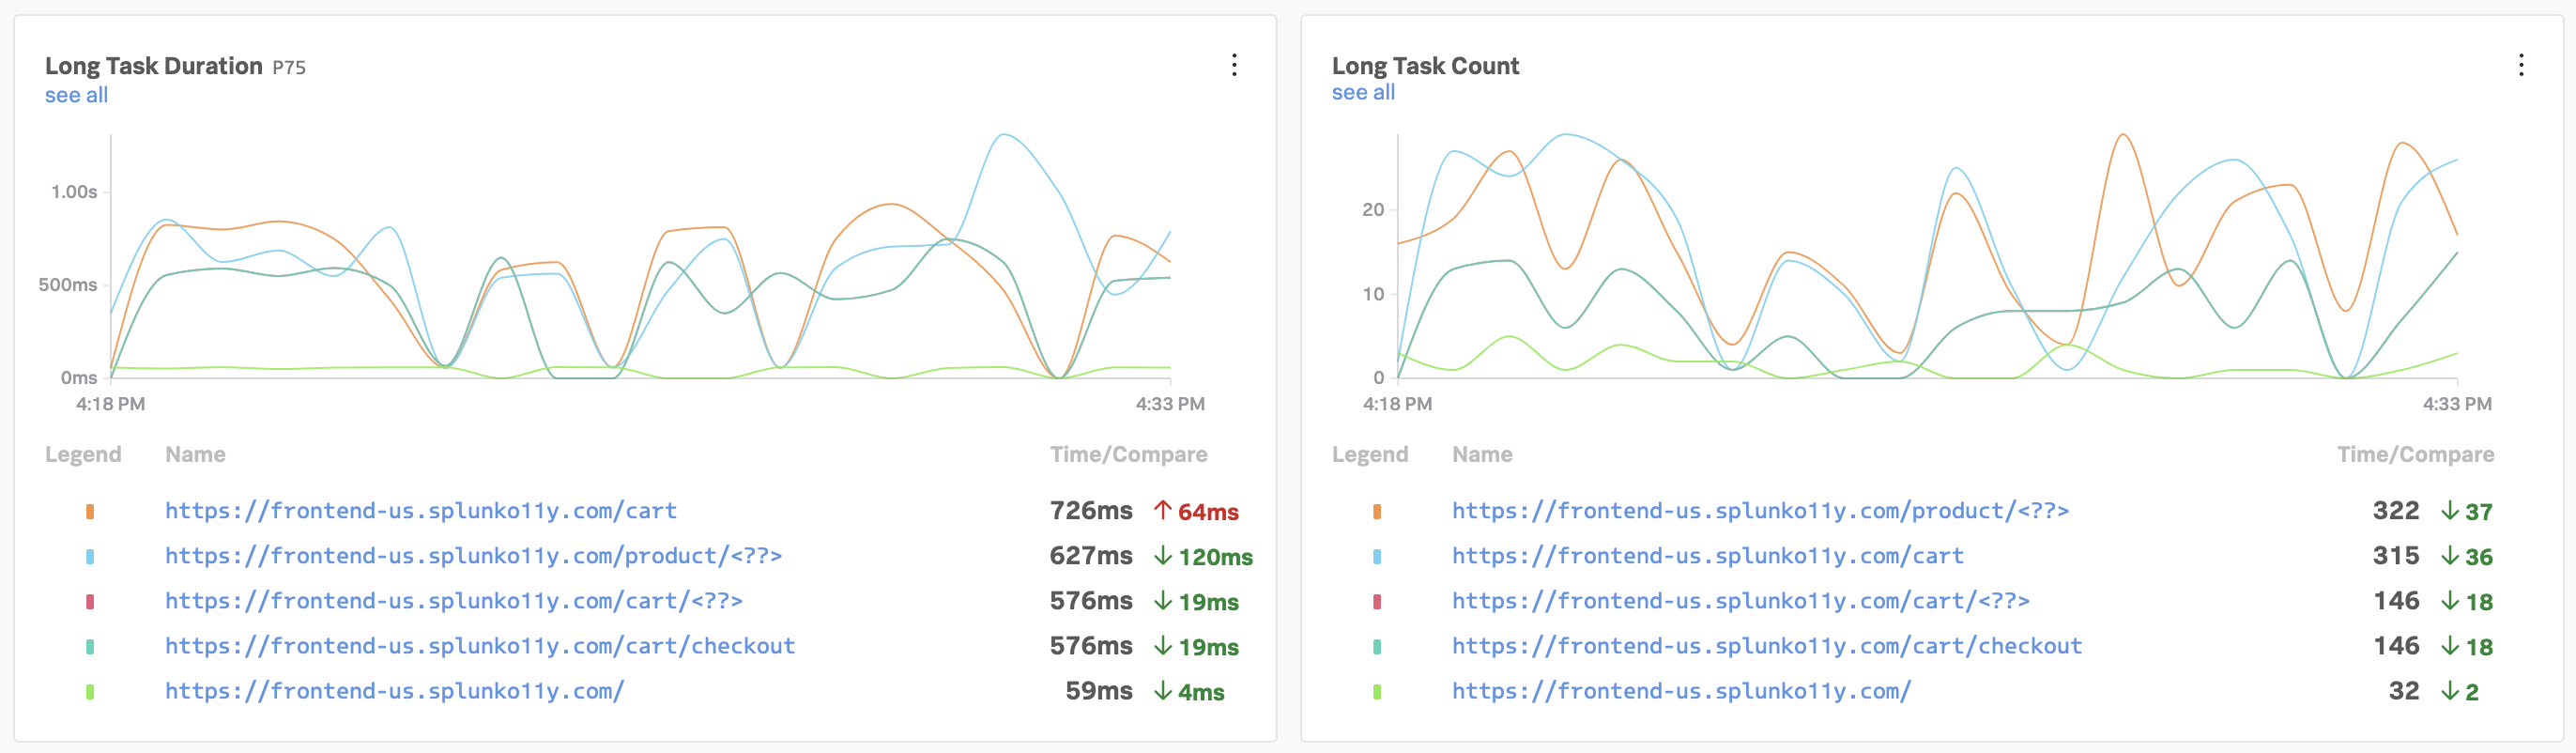
Common causes of frontend issues are javascript errors and long tasks, which can especially affect interactivity. Creating detectors on these indicators helps us investigate interactivity issues sooner than our users report it, allowing us to build workarounds or roll back related releases faster if needed. Learn more about optimizing long tasks for better end user experience!
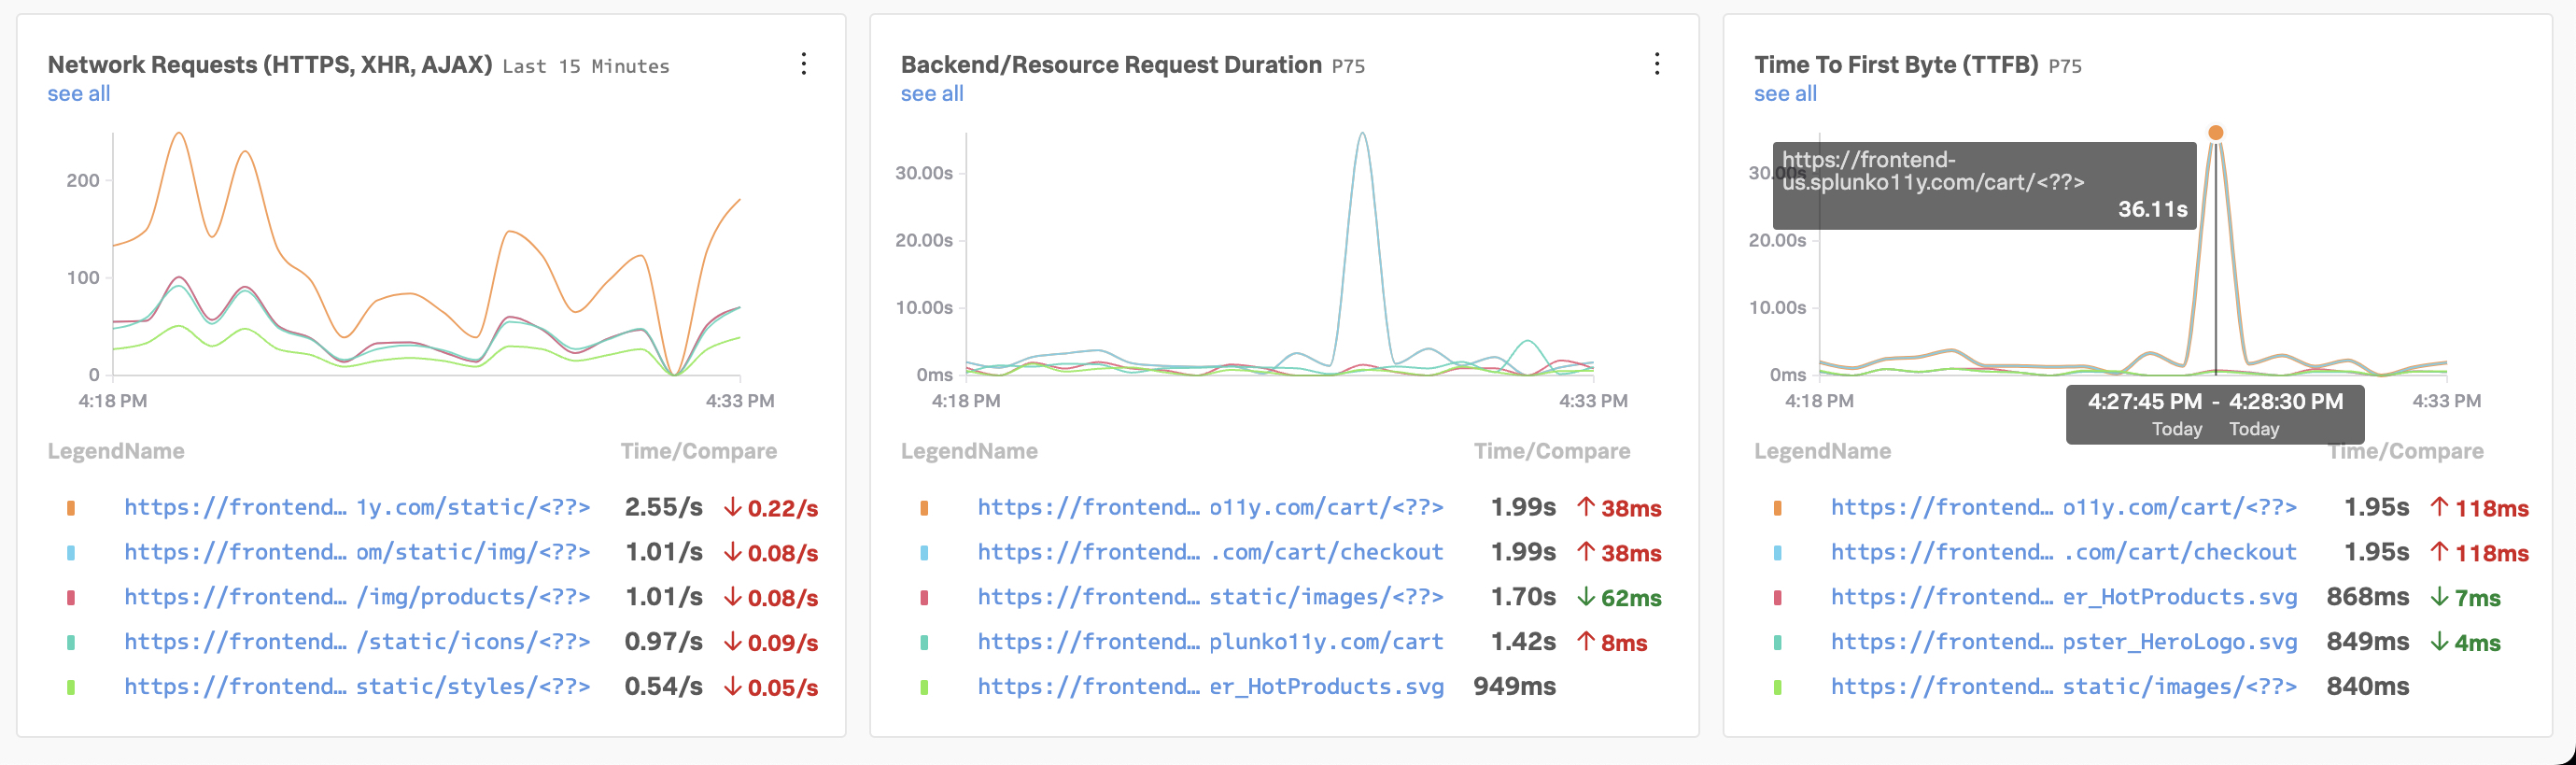
2.4. Back-end health
Common back-end issues affecting user experience are network issues and resource requests. In this example, we clearly see a spike in Time To First Byte that lines up with a resource request spike, so we already have a good starting place to investigate.
Time To First Byte (TTFB), measures how long it takes for a client’s browser to receive the first byte of the response from the server. The longer it takes for the server to process the request and send a response, the slower your visitors’ browser is at displaying your page.
Analyzing RUM Tags in the Tag Spotlight view
Look into the Metrics views for the various endpoints and use the Tags sent via the Tag spotlight for deeper analysis
1. Find an url for the Cart endpoint
From the RUM Overview page, please select the url for the Cart endpoint to dive deeper into the information available for this endpoint.
Once you have selected and clicked on the blue url, you will find yourself in the Tag Spotlight overview
Here you will see all of the tags that have been sent to Splunk RUM as part of the RUM traces. The tags displayed will be relevant to the overview that you have selected. These are generic Tags created automatically when the Trace was sent, and additional Tags you have added to the trace as part of the configuration of your website.
Additional Tags
We are already sending two additional tags, you have seen them defined in the Beacon url that was added to your website: app: "[nodename]-store", environment: "[nodename]-workshop" in the first section of this workshop! You can add additional tags in a similar way.
In our example we have selected the Document Load Latency view as shown here:
You can select any of the following Tag views, each focused on a specific metric.
2. Explore the information in the Tag Spotlight view
The Tag spotlight is designed to help you identify problems, either through the chart view,, where you may quickly identify outliers or via the TAGs.
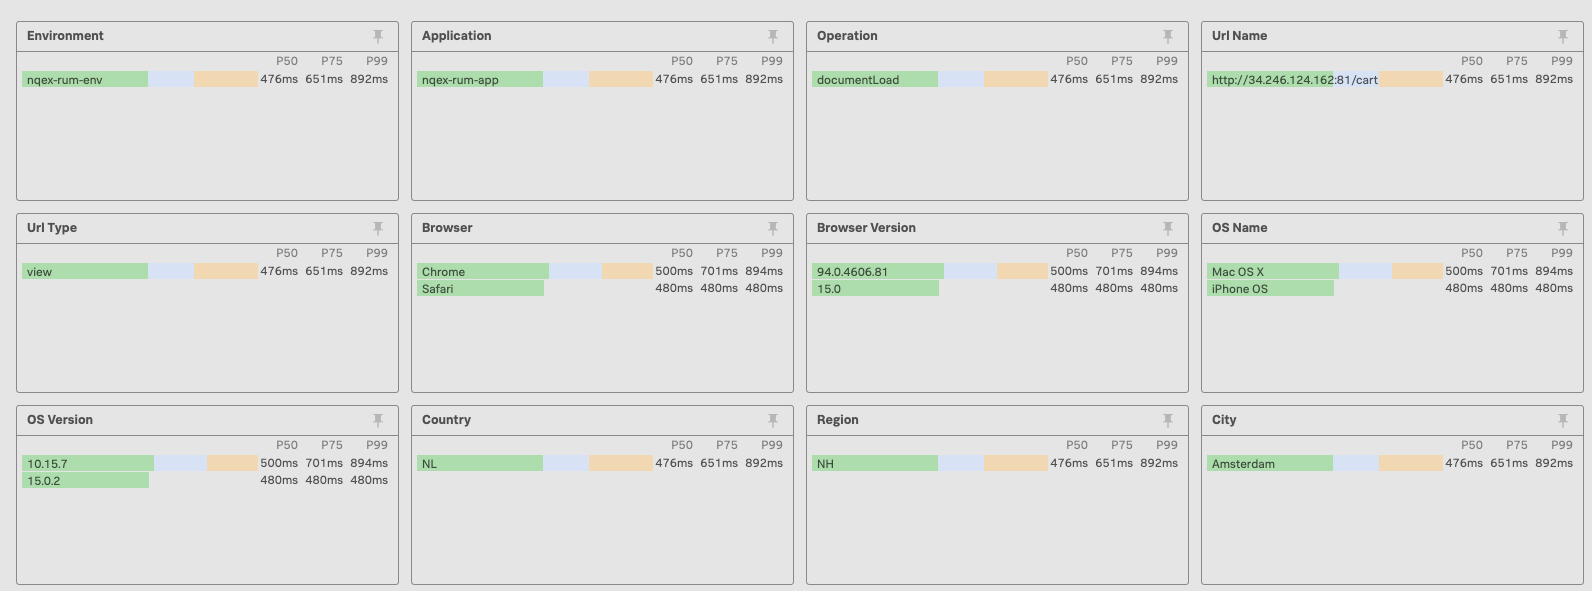
In the Document Load Latency view, if you look at the Browser, Browser Version & OS Name Tag views,you can see the various browser types and versions, as well as for the underlying OS.
This makes it easy to identify problems related to specific browser or OS versions, as they would be highlighted.
In the above example you can see that Firefox had the slowest response, various Browser versions ( Chrome) that have different response times and the slow response of the Android devices.
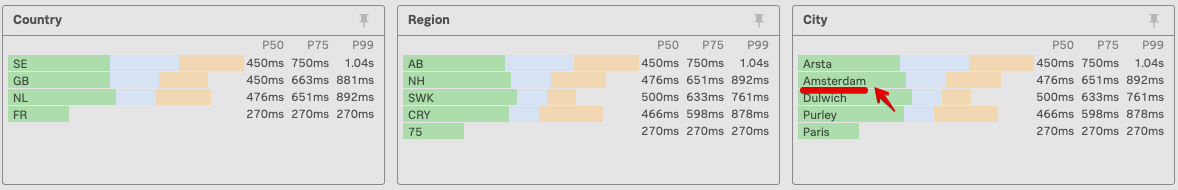
A further example are the regional Tags that you can use to identify problems related to ISP or locations etc. Here you should be able to find the location you have been using to access the Online Boutique. Drill down by selecting the town or country you are accessing the Online Boutique from by clicking on the name as shown below (City of Amsterdam):
This will select only the traces relevant to the city selected as shown below:
By selecting the various Tag you build up a filter, you can see the current selection below
To clear the filter and see every trace click on Clear All at the top right of the page.
If the overview page is empty or shows , no traces have been received in the selected timeslot.
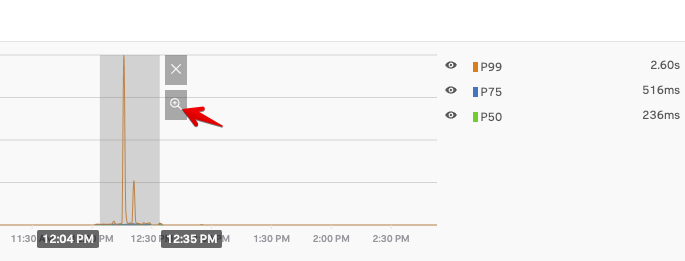
You need to increase the time window at the top left. You can start with the Last 12 hours for example.
You can then use your mouse to select the time slot you want like show in the view below and activate that time filter by clicking on the little spyglass icon.
Analyzing RUM Sessions
Dive into RUM Session information in the RUM UI
Identify Javascript errors in the Span of an user interaction
1. Again select the cart URL
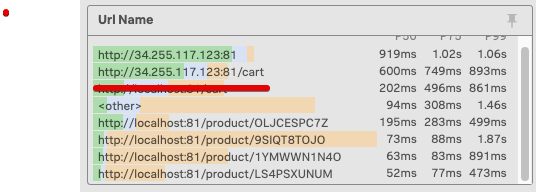
After you have focussed the time slot with the time selector, you need to reselect the cart url from Url Name view, as shown below:
In the example above we selected http://34.246.124.162:81/cart
2. Drill down in the Sessions
After you have analyzed the information and drilled down via the Tag Spotlight to a subset of the traces, you can view the actual session as it was run by the end-user’s browser.
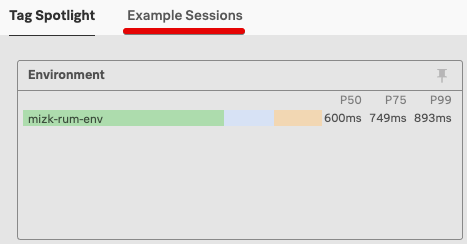
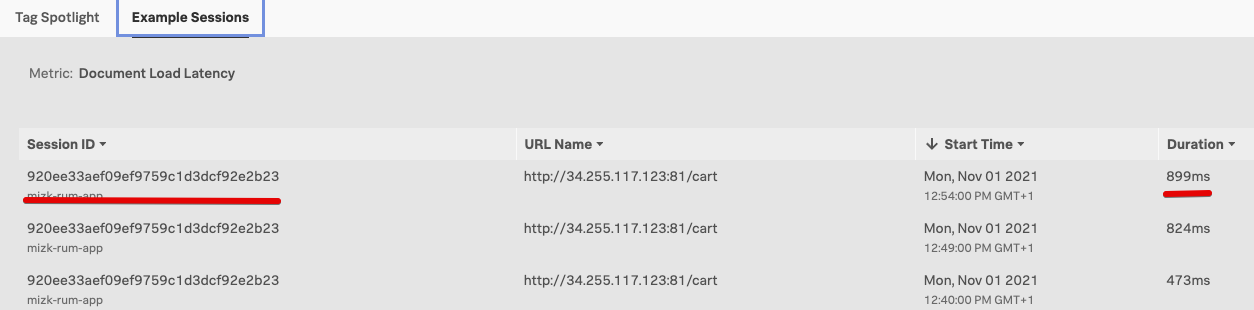
You do this by clicking on the link Example Sessions as shown below:
This will give you a list of sessions that matched both the time filter and the subset selected in the Tag Profile.
Select one by clicking on the session ID, It is a good idea to select one that has the longest duration (preferably over 700 ms).
Once you have selected the session, you will be taken to the session details page. As you are selecting a specific action that is part of the session, you will likely arrive somewhere in the middle of the session, at the moment of the interaction.
You can see the URL http://34.246.124.162:81/cart, the one you selected earlier, is where we are focusing on in the session stream.
Scroll down a little bit on the page, so you see the end of the operation as shown below.
You can see that we have received a few Javascript Console errors that may not have been detected or visible to the end users. To examine these in more detail click on the middle one that says: *Cannot read properties of undefined (reading ‘Prcie’)
This will cause the page to expand and show the Span detail for this interaction, It will contain a detailed error.stack you can pass on the developer to solve the issue. You may have noticed when buying in the Online Boutique that the final total always was $0.00.
Advanced Synthetics
30 minutes
Introduction
This workshop walks you through using the Chrome DevTools Recorder to create a synthetic test on a Splunk demonstration environment or on your own public website.
The exported JSON from the Chrome DevTools Recorder will then be used to create a Splunk Synthetic Monitoring Real Browser Test.
Write down a short user journey you want to test. Remember: smaller bites are easier to chew! In other words, get started with just a few steps. This is easier not only to create and maintain the test, but also to understand and act on the results. Test the essential features to your users, like a support contact form, login widget, or date picker.
Note
Record the test in the same type of viewport that you want to run it. For example, if you want to run a test on a mobile viewport, narrow your browser width to mobile and refresh before starting the recording. This way you are capturing the correct elements that could change depending on responsive style rules.
Open your starting URL in Chrome Incognito. This is important so you’re not carrying cookies into the recording, which we won’t set up in the Synthetic test by default. If you workshop instructor does not have a custom URL, feel free to use https://online-boutique-eu.splunko11y.com or https://online-boutique-us.splunko11y.com, which are in the examples below.
Open the Chrome DevTools Recorder
Next, open the Developer Tools (in the new tab that was opened above) by pressing Ctrl + Shift + I on Windows or Cmd + Option + I on a Mac, then select Recorder from the top-level menu or the More tools flyout menu.
Note
Site elements might change depending on viewport width. Before recording, set your browser window to the correct width for the test you want to create (Desktop, Tablet, or Mobile). Change the DevTools “dock side” to pop out as a separate window if it helps.
Create a new recording
With the Recorder panel open in the DevTools window. Click on the Create a new recording button to start.
For the Recording Name use your initials to prefix the name of the recording e.g. <your initials> - <website name>. Click on Start Recording to start recording your actions.
Now that we are recording, complete a few actions on the site. An example for our demo site is:
Click on Vintage Camera Lens
Click on Add to Cart
Click on Place Order
Click on End recording in the Recorder panel.
Export the recording
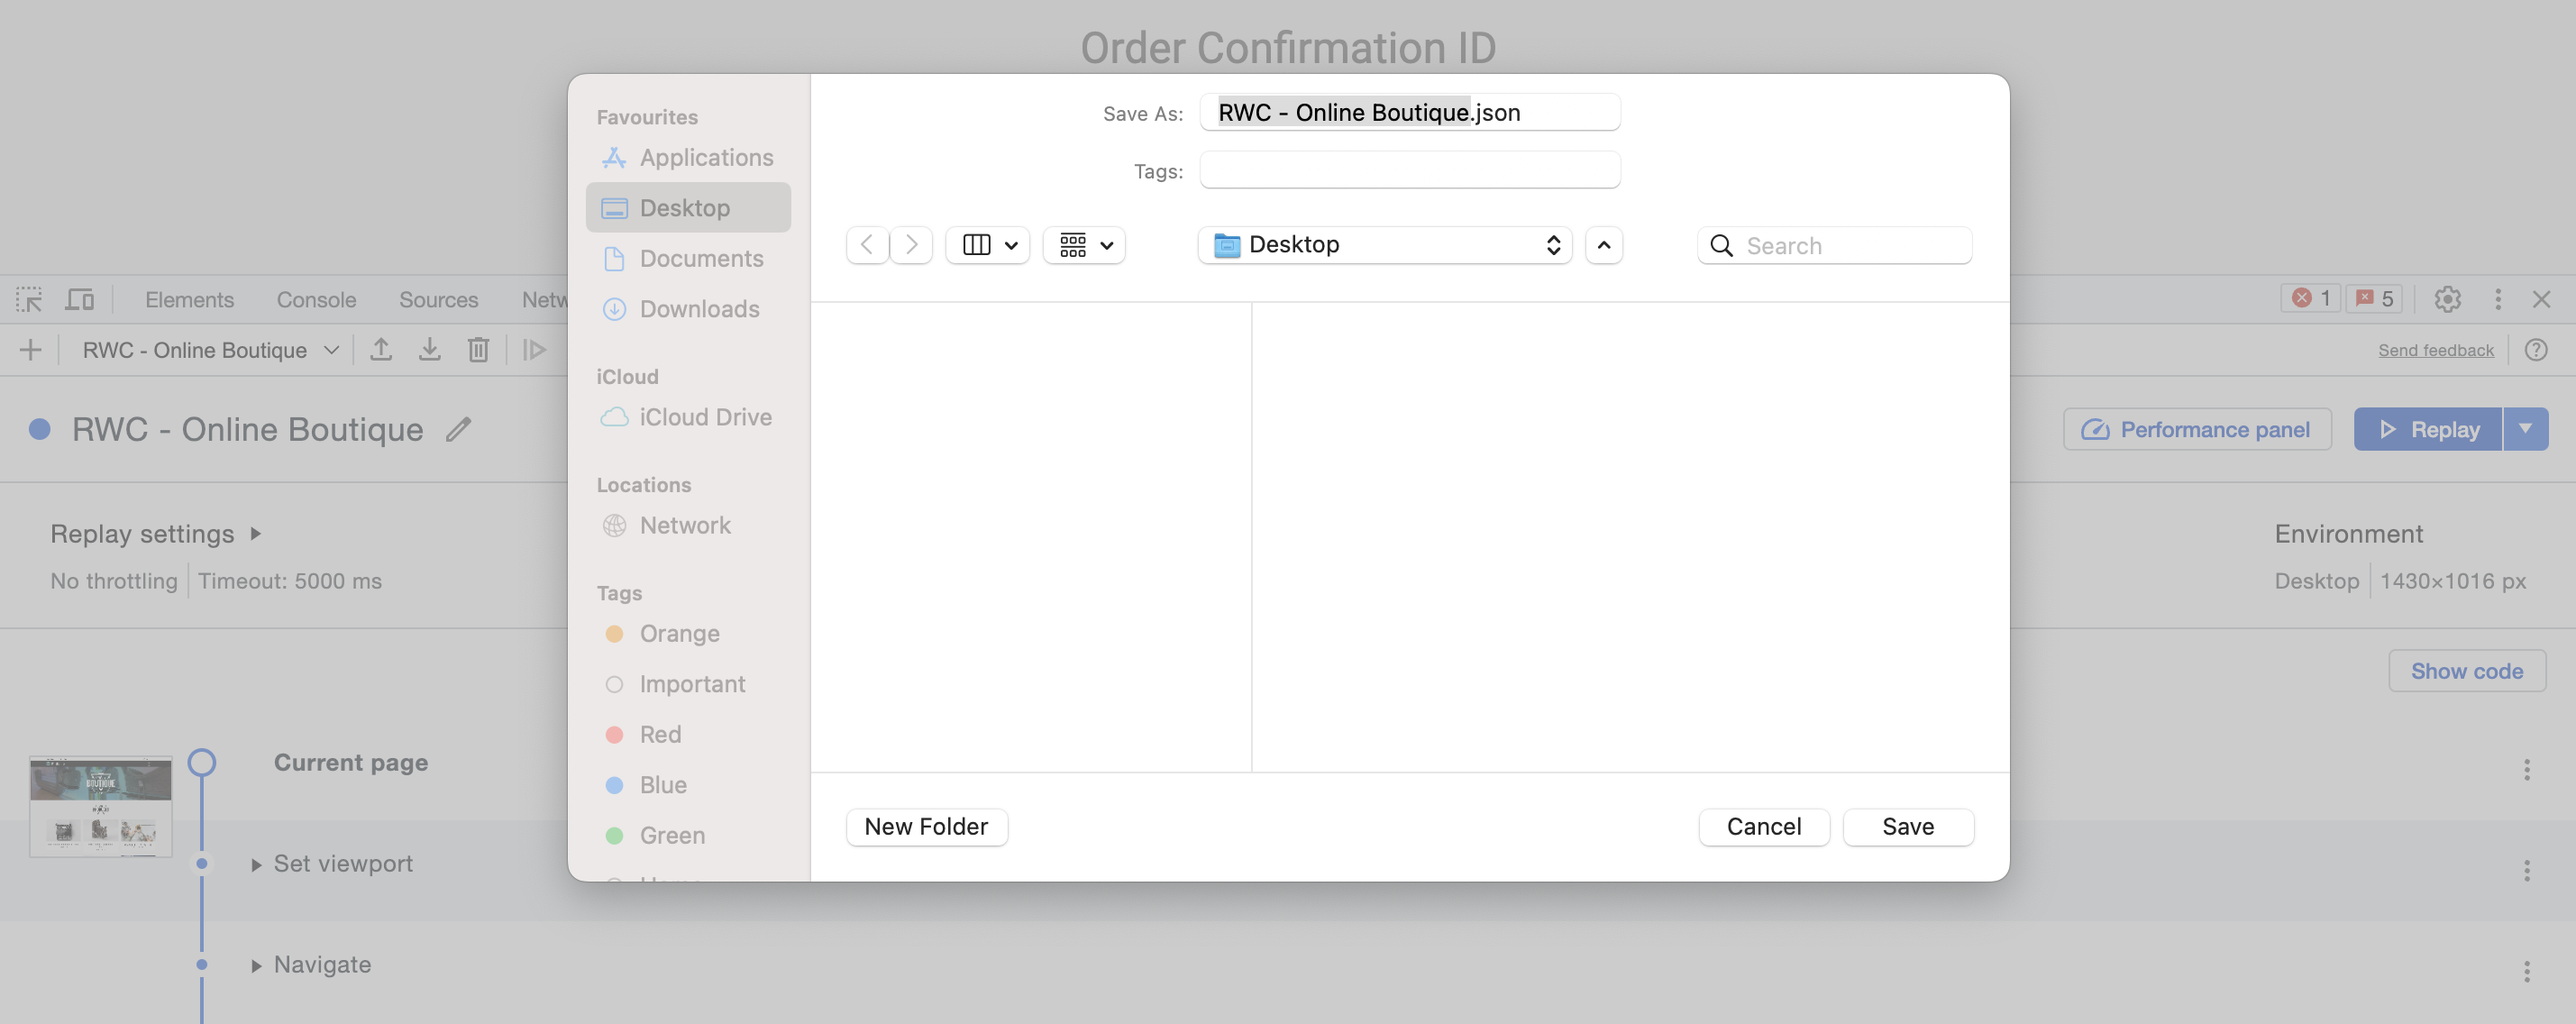
Click on the Export button:
Select JSON as the format, then click on Save
Congratulations! You have successfully created a recording using the Chrome DevTools Recorder. Next, we will use this recording to create a Real Browser Test in Splunk Synthetic Monitoring.
{"title":"RWC - Online Boutique","steps":[{"type":"setViewport","width":1430,"height":1016,"deviceScaleFactor":1,"isMobile":false,"hasTouch":false,"isLandscape":false},{"type":"navigate","url":"https://online-boutique-eu.splunko11y.com/","assertedEvents":[{"type":"navigation","url":"https://online-boutique-eu.splunko11y.com/","title":"Online Boutique"}]},{"type":"click","target":"main","selectors":[["div:nth-of-type(2) > div:nth-of-type(2) a > div"],["xpath//html/body/main/div/div/div[2]/div[2]/div/a/div"],["pierce/div:nth-of-type(2) > div:nth-of-type(2) a > div"]],"offsetY":170,"offsetX":180,"assertedEvents":[{"type":"navigation","url":"https://online-boutique-eu.splunko11y.com/product/66VCHSJNUP","title":""}]},{"type":"click","target":"main","selectors":[["aria/ADD TO CART"],["button"],["xpath//html/body/main/div[1]/div/div[2]/div/form/div/button"],["pierce/button"],["text/Add to Cart"]],"offsetY":35.0078125,"offsetX":46.4140625,"assertedEvents":[{"type":"navigation","url":"https://online-boutique-eu.splunko11y.com/cart","title":""}]},{"type":"click","target":"main","selectors":[["aria/PLACE ORDER"],["div > div > div.py-3 button"],["xpath//html/body/main/div/div/div[4]/div/form/div[4]/button"],["pierce/div > div > div.py-3 button"],["text/Place order"]],"offsetY":29.8125,"offsetX":66.8203125,"assertedEvents":[{"type":"navigation","url":"https://online-boutique-eu.splunko11y.com/cart/checkout","title":""}]}]}
Create a Browser Test
In Splunk Observability Cloud, navigate to Synthetics and click on Add new test.
From the dropdown select Browser test.
You will then be presented with the Browser test content configuration page.
Import JSON
To begin configuring our test, we need to import the JSON that we exported from the Chrome DevTools Recorder. To enable the Import button, we must first give our test a name e.g. [<your team name>] <your initials> - Online Boutique.
Once the Import button is enabled, click on it and either drop the JSON file that you exported from the Chrome DevTools Recorder or upload the file.
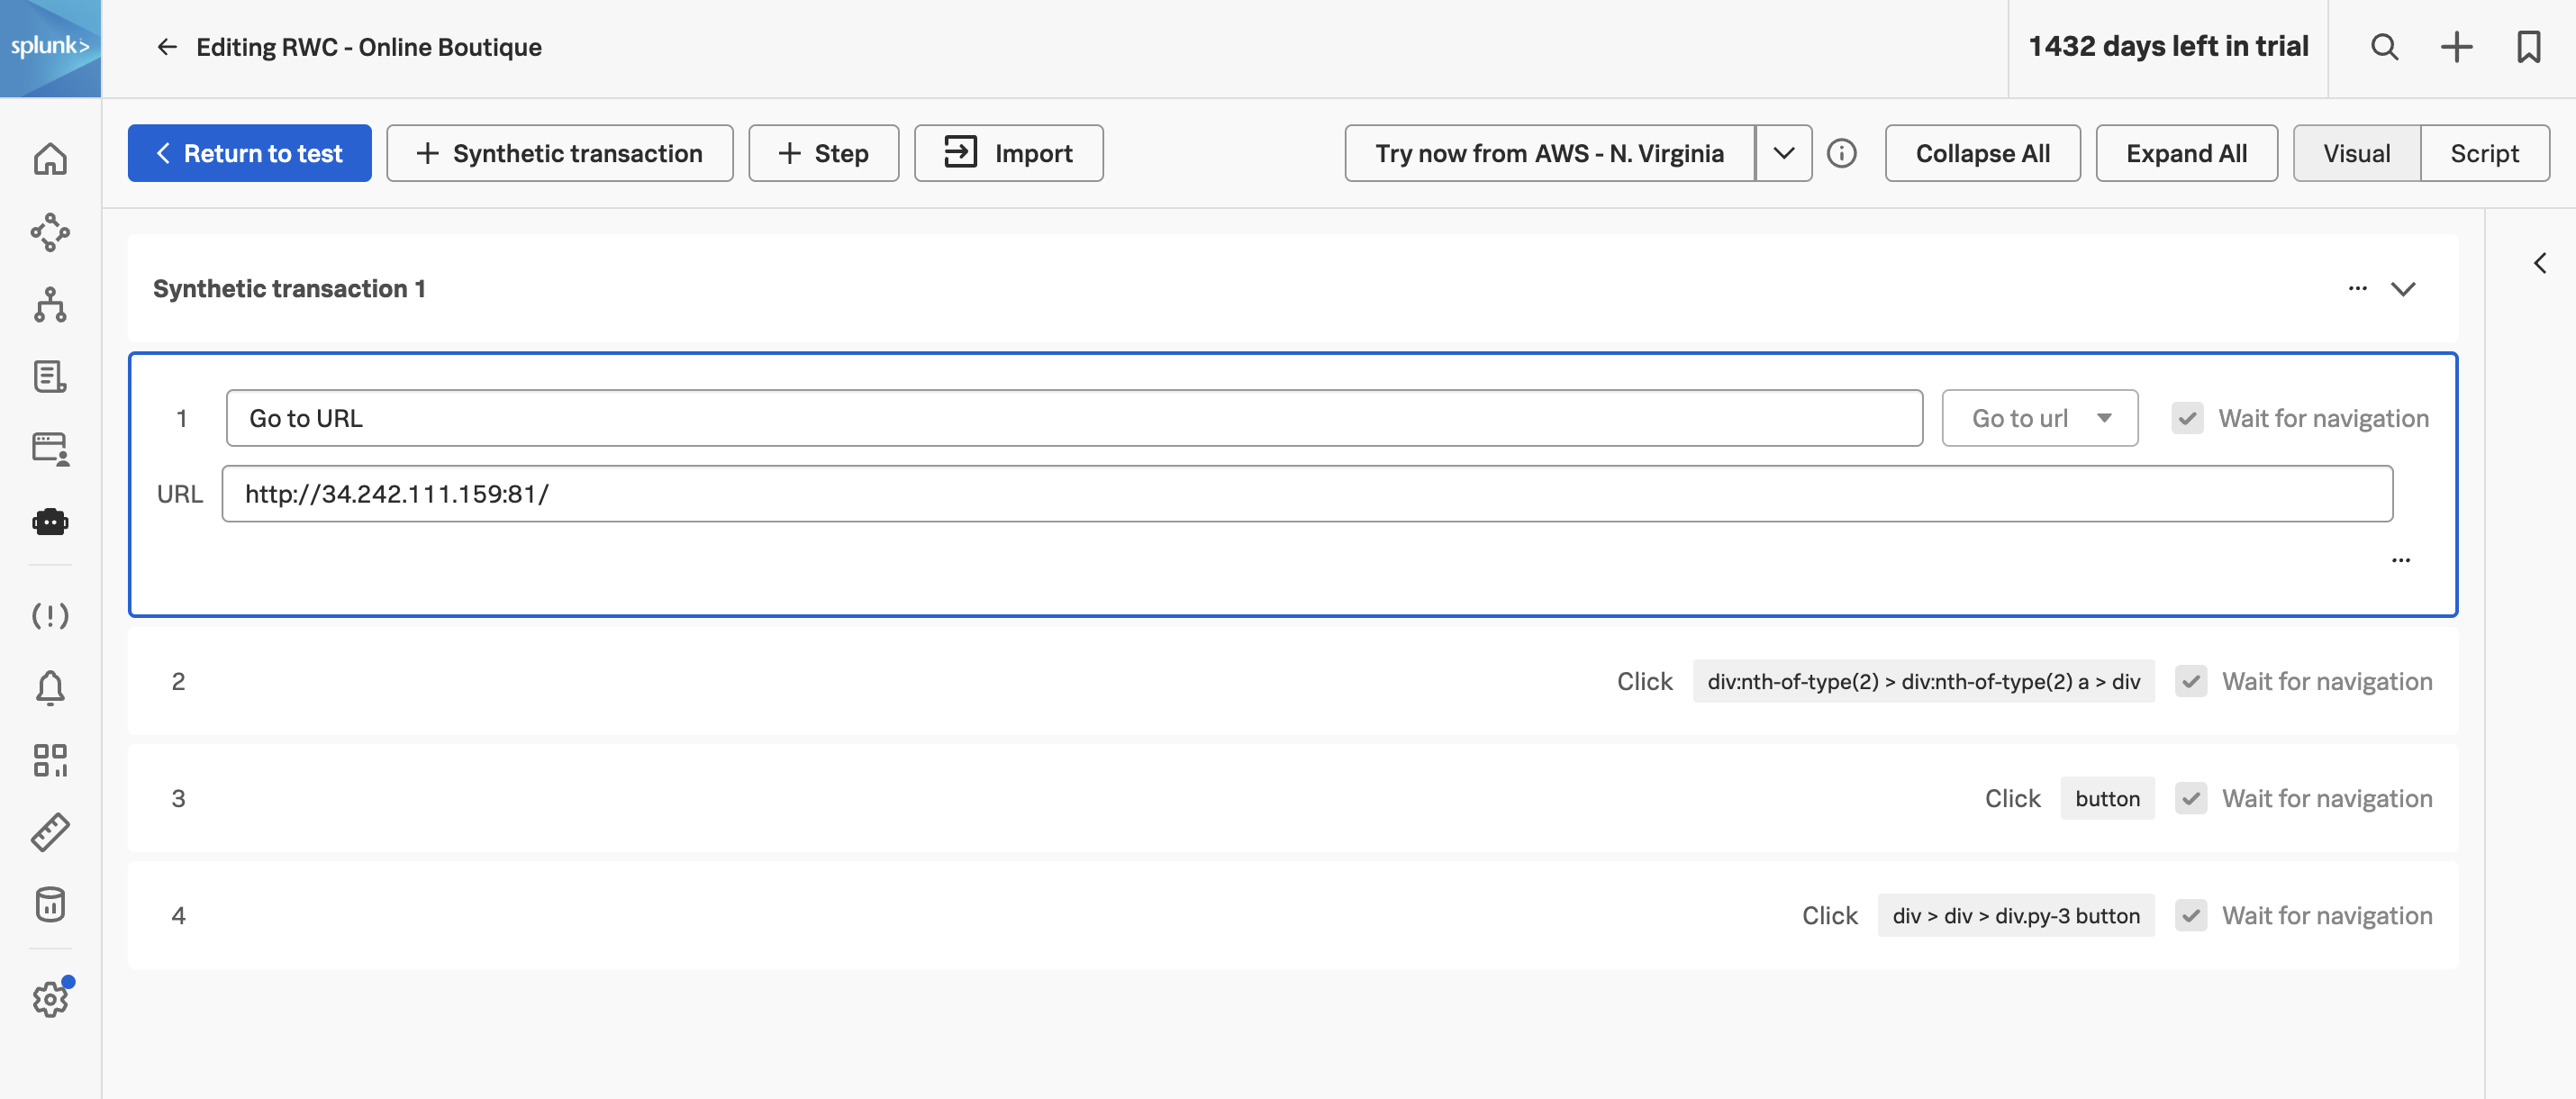
Once the JSON file has been uploaded, click on Continue to edit steps
Before we make any edits to the test, let’s first configure the settings, click on < Return to test
Test settings
The simple settings allow you to configure the basics of the test:
Name: The name of the test (e.g. RWC - Online Boutique).
Details:
Locations: The locations where the test will run from.
Device: Emulate different devices and connection speeds. Also, the viewport will be adjusted to match the chosen device.
Frequency: How often the test will run.
Round-robin: If multiple locations are selected, the test will run from one location at a time, rather than all locations at once.
Active: Set the test to active or inactive.
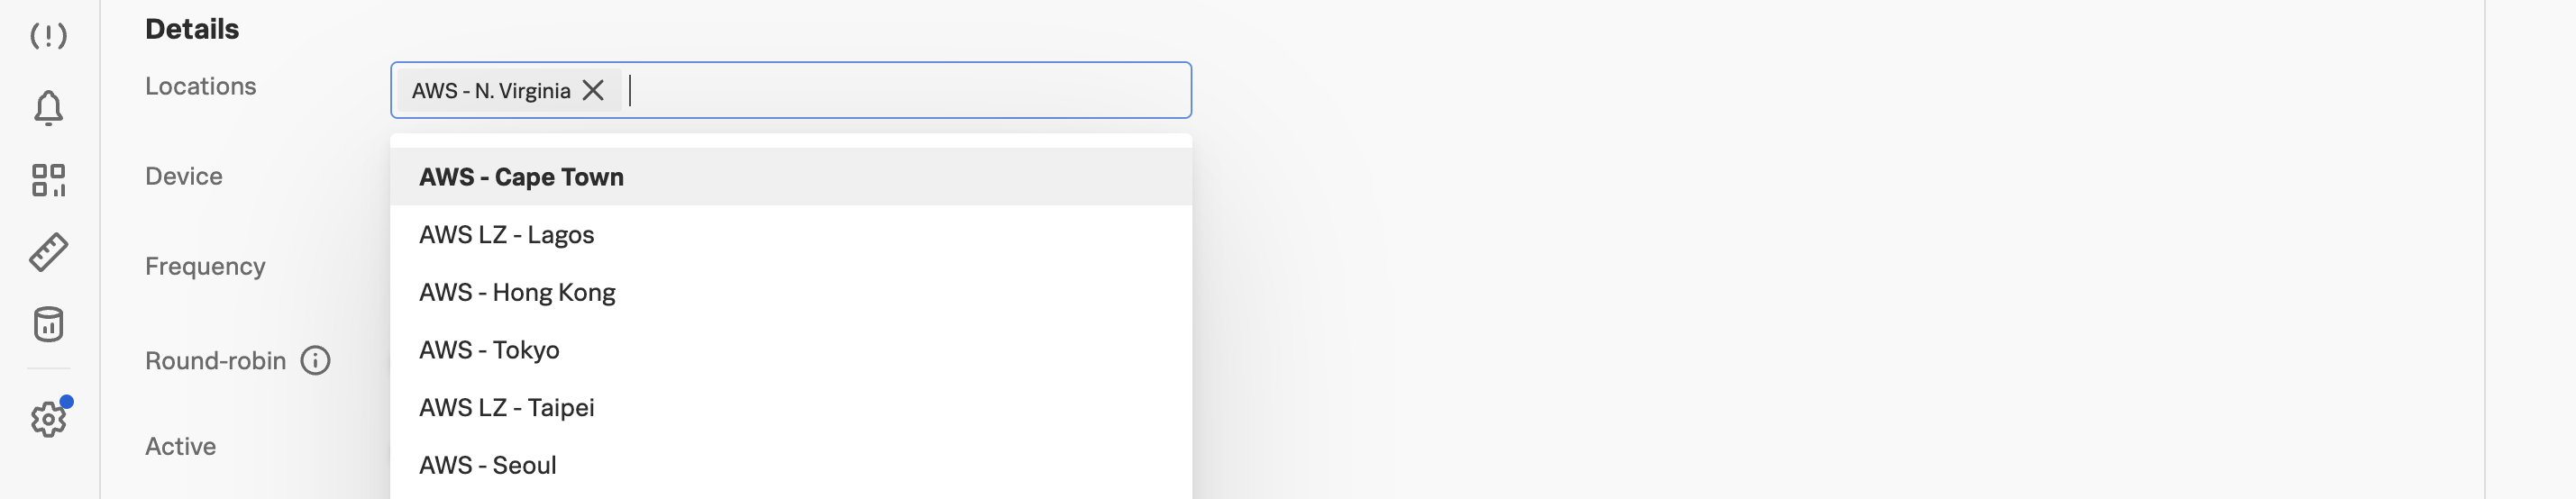
![Return to Test]For this workshop, we will configure the locations that we wish to monitor from. Click in the Locations field and you will be presented with a list of global locations (over 50 in total).
Select the following locations:
AWS - N. Virginia
AWS - London
AWS - Melbourne
Once complete, scroll down and click on Click on Submit to save the test.
The test will now be scheduled to run every 5 minutes from the 3 locations that we have selected. This does take a few minutes for the schedule to be created.
So while we wait for the test to be scheduled, click on Edit test so we can go through the Advanced settings.
Advanced Test Settings
Click on Advanced, these settings are optional and can be used to further configure the test.
Note
In the case of this workshop, we will not be using any of these settings; this is for informational purposes only.
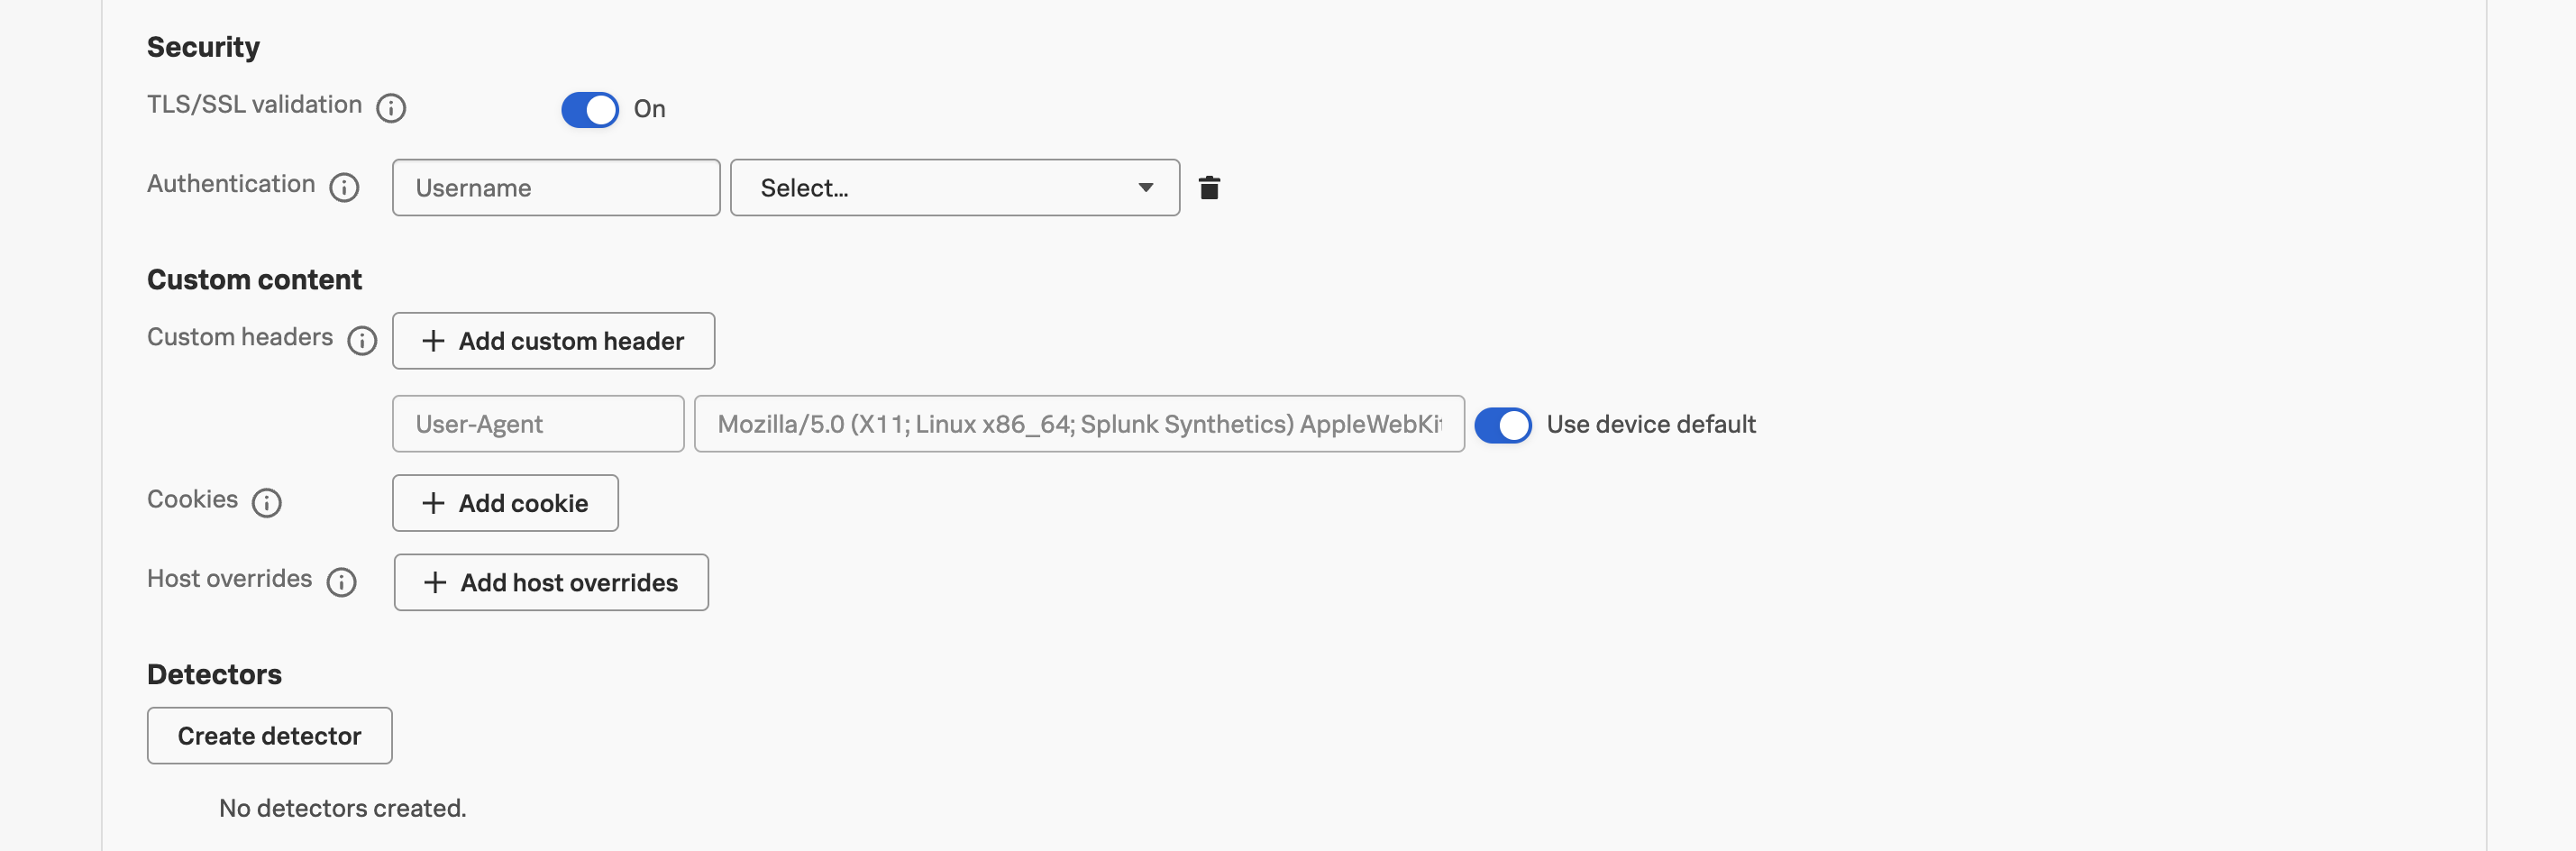
Security:
TLS/SSL validation: When activated, this feature is used to enforce the validation of expired, invalid hostname, or untrusted issuer on SSL/TLS certificates.
Authentication: Add credentials to authenticate with sites that require additional security protocols, for example from within a corporate network. By using concealed global variables in the Authentication field, you create an additional layer of security for your credentials and simplify the ability to share credentials across checks.
Custom Content:
Custom headers: Specify custom headers to send with each request. For example, you can add a header in your request to filter out requests from analytics on the back end by sending a specific header in the requests. You can also use custom headers to set cookies.
Cookies: Set cookies in the browser before the test starts. For example, to prevent a popup modal from randomly appearing and interfering with your test, you can set cookies. Any cookies that are set will apply to the domain of the starting URL of the check. Splunk Synthetics Monitoring uses the public suffix list to determine the domain.
Host overrides: Add host override rules to reroute requests from one host to another. For example, you can create a host override to test an existing production site against page resources loaded from a development site or a specific CDN edge node.
Next, we will edit the test steps to provide more meaningful names for each step.
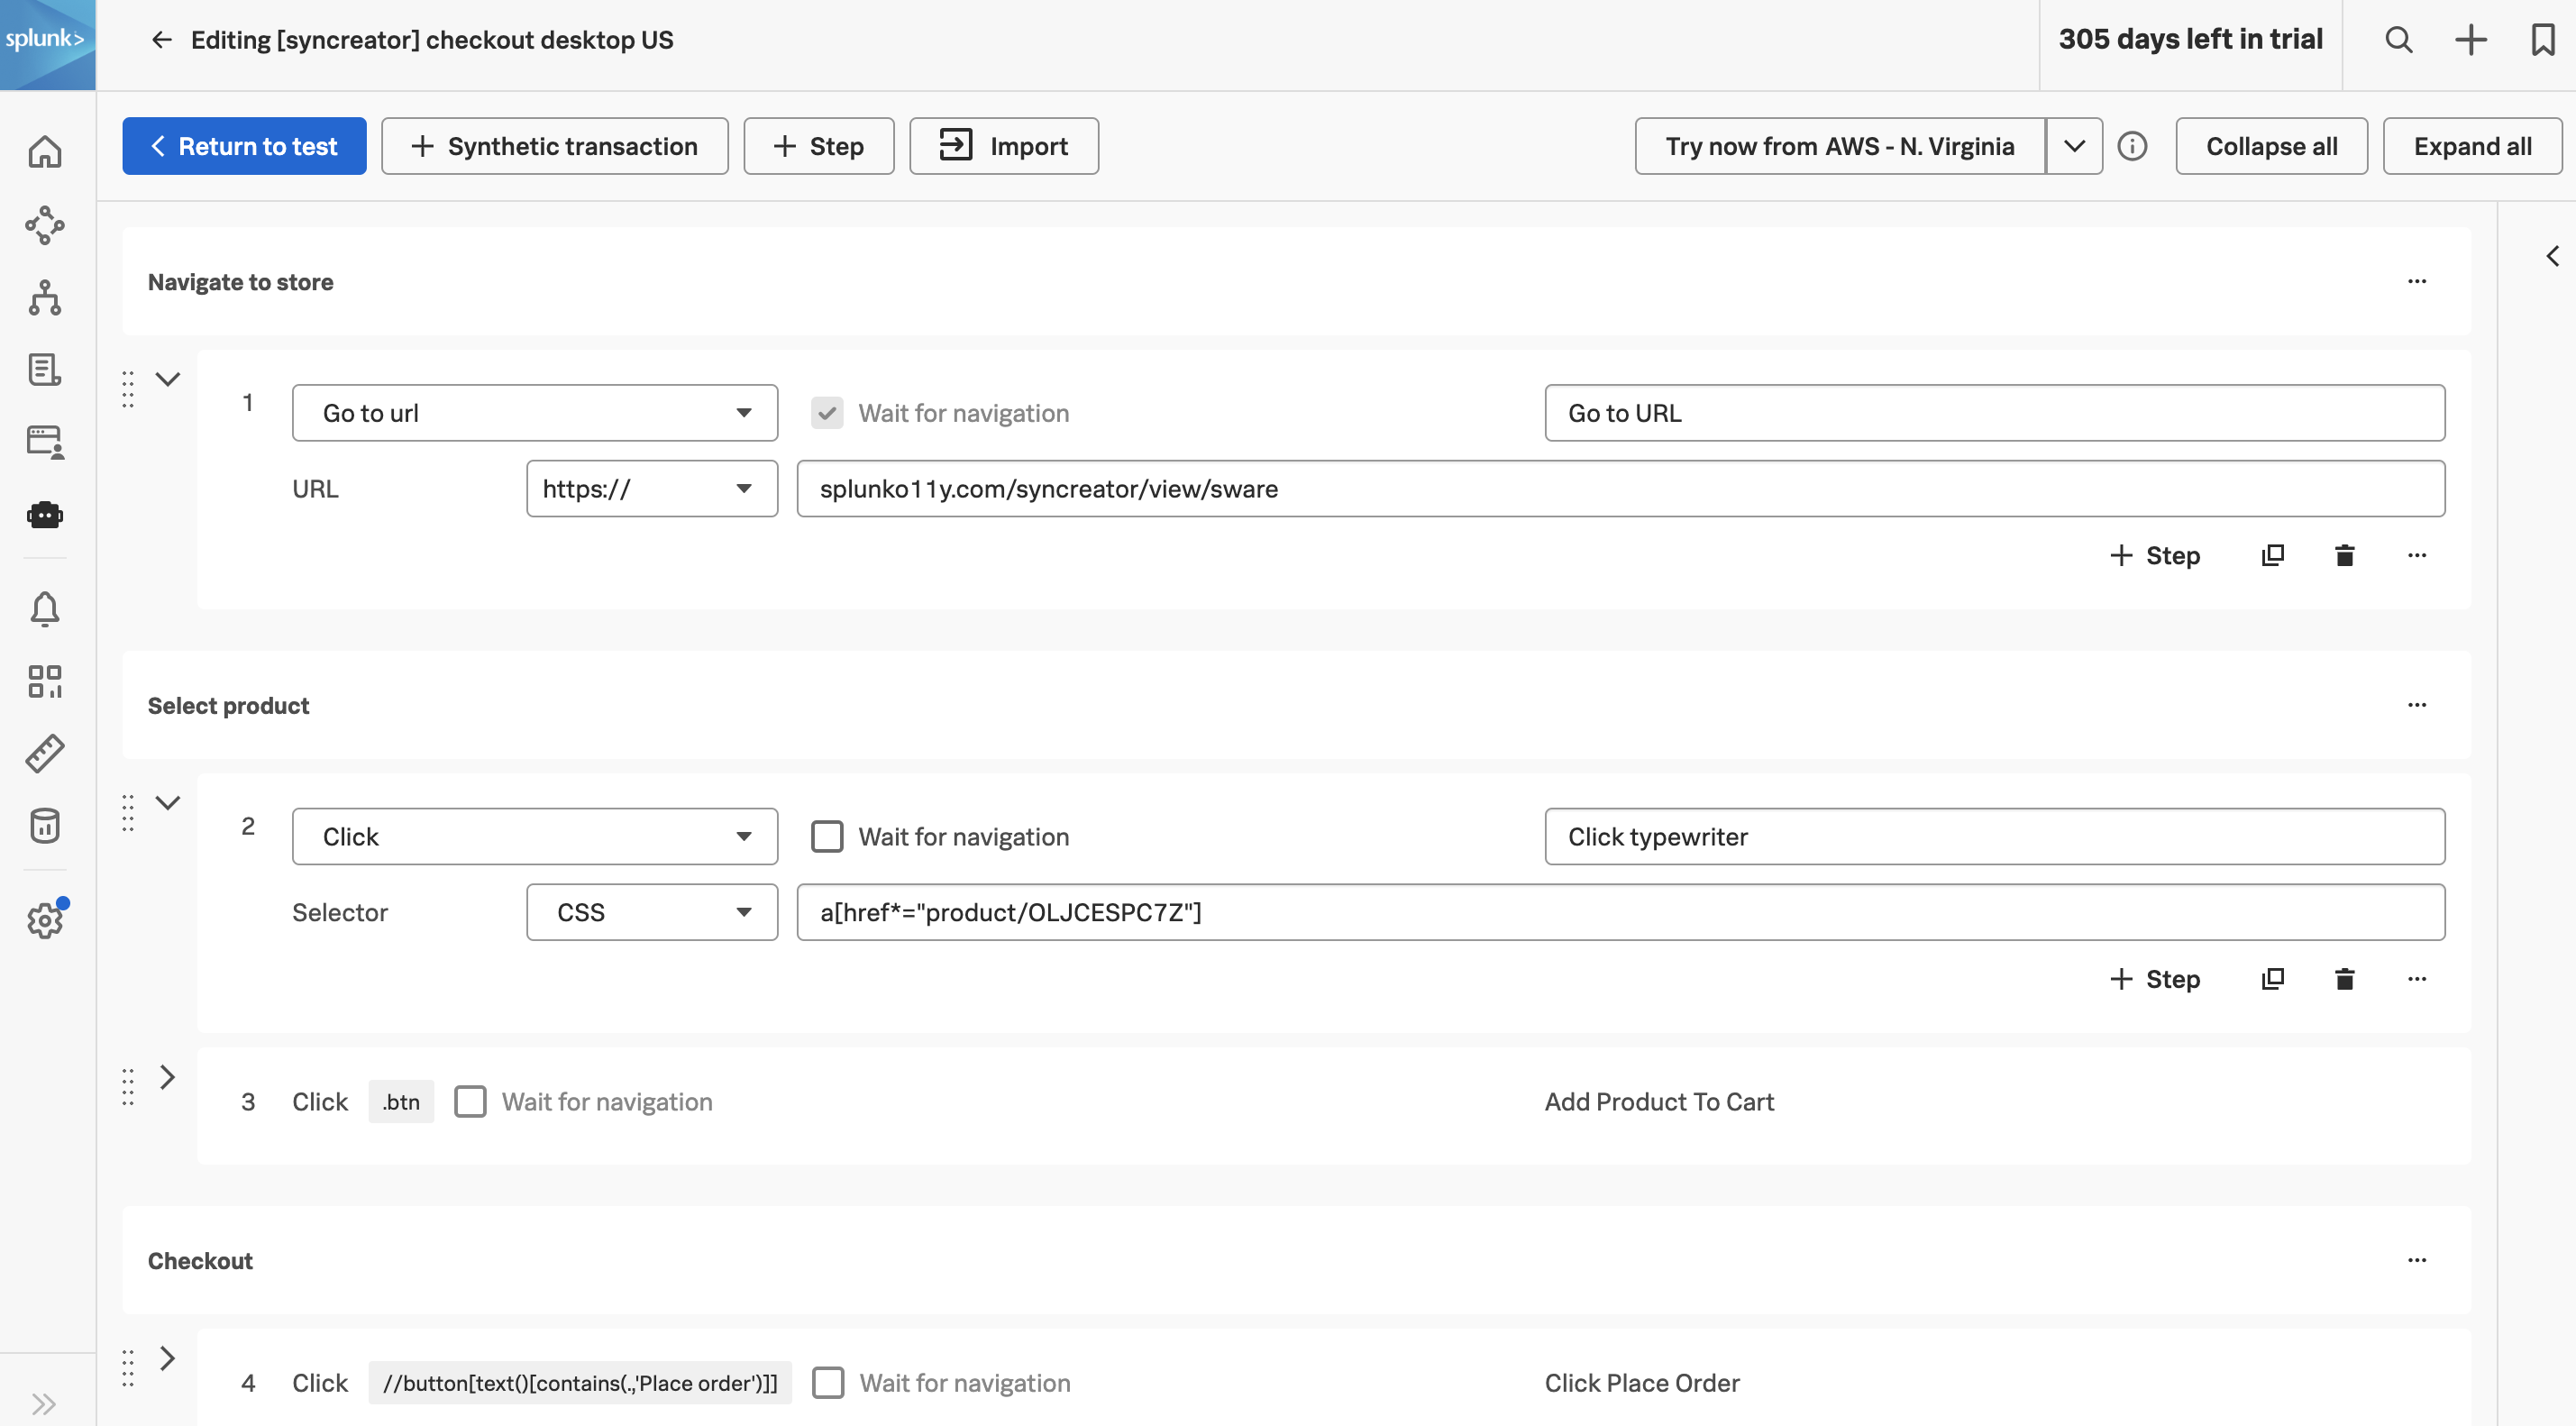
Edit test steps
To edit the steps click on the + Edit steps or synthetic transactions button. From here, we are going to give meaningful names to each step.
For each step, we are going to give them a meaningful, readable name. That could look like:
Step 1 replace the text Go to URL with Go to Homepage
Step 2 enter the text Select Typewriter.
Step 3 enter Add to Cart.
Step 4 enter Place Order.
Note
If you’d like, group the test steps into Transactions and edit the transaction names. This is especially useful for Single Page Apps (SPAs), where the resource waterfall is not split by URL. We can also create charts and alerts based on transactions.
Click < Return to test to return to the test configuration page and click Save to save the test.
You will be returned to the test dashboard where you will see test results start to appear.
Congratulations! You have successfully created a Real Browser Test in Splunk Synthetic Monitoring. Next, we will look into a test result in more detail.
View test results
1. Click into a spike or failure in your test run results.
2. What can you learn about this test run? If it failed, use the error message, filmstrip, video replay, and waterfall to understand what happened.
3. What do you see in the resources? Make sure to click through all of the page (or transaction) tabs.
Workshop Question
Do you see anything interesting? Common issues to find and fix include: unexpected response codes, duplicate requests, forgotten third parties, large or slow files, and long gaps between requests.
Want to learn more about specific performance improvements? Google and Mozilla have great resources to help understand what goes into frontend performance as well as in-depth details of how to optimize it.
Frontend Dashboards
15 minutes
Go to Dashboards and find the End User Experiences dashboard group.
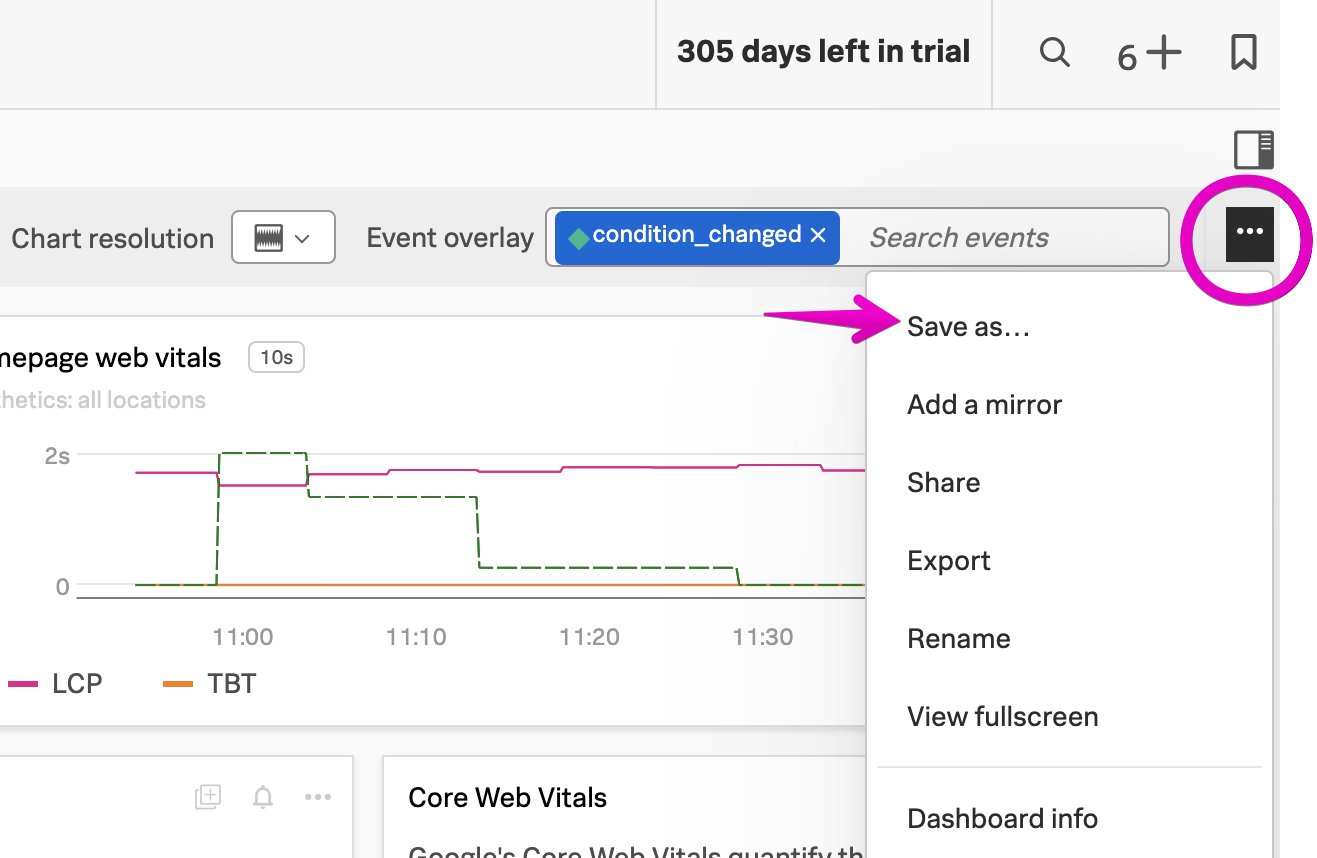
Click the three dots on the top right to open the dashboard menu, and select Save As, and include your team name and initials in the dashboard name.
Save to the dashboard group that matches your email address. Now you have your own copy of this dashboard to customize!
Subsections of Frontend Dashboards
Copying and editing charts
We have some good charts in our dashboard, but let’s add a few more.
Go to Dashboards by clicking the dasboard icon on the left side of the screen. Find the Browser app health dashboard and scroll to the Largest Contentful Paint (LCP) chart. Click the chart actions icon to open the flyout menu, and click “Copy” to add this chart to your clipboard.
Now you can continue to add any other charts to your clipboard by clicking the “add to clipboard” icon.
When you have collected the charts you want on your dashboard, click the “create” icon on the top right. You might need to reload the page if you were looking at charts in another browser tab.
Click the “Paste charts” menu option.
Now you are able to resize and edit the charts as you’d like!
Bonus: edit chart data
Click the chart actions icon and select Open to edit the chart.
Remove the existing Test signal.
Click Add filter and type test: *yourInitials*. This will use a wildcard match so that all of the tests you have created that contain your initials (or any string you decide) will be pulled into the chart.
Click into the functions to see how adding and removing dimensions changes how the data is displayed. For example, if you want all of your test location data rolled up, remove that dimension from the function.
Change the chart name and description as appropriate, and click “Save and close” to commit your changes or just “Close” to cancel your changes.
Events in context with chart data
Seeing the visualization of our KPIs is great. What’s better? KPIs in context with events! Overlaying events on a dashboard can help us more quickly understand if an event like a deployment caused a change in metrics, for better or worse.
Your instructor will push a condition change to the workshop application. Click the event marker on any of your dashboard charts to see more details.
In the dimensions, we can see more details about this specific event. If we click the event record, we can mark for deletion if needed.
We can also see a history of events in the event feed by clicking the icon on the top right of the screen, and selecting Event feed.
Again, we can see details about recent events in this feed.
We can also add new events in the GUI or via API. To add a new event in the GUI, click the New event button.
Name your event with your team name, initials, and what kind of event it is (deployment, campaign start, etc). Choose a timestamp, or leave as-is to use the current time, and click “Create”.
Now, we need to make sure our new event is overlaid in this dashboard. Wait a minute or so (refresh the page if needed) and then search for the event in the Event overlay field.
If your event is within the dashboard time window, you should now see it overlaid in your charts. Click “Save” to make sure your event overlay is saved to your dashboard!
Keep in mind
Want to add context to that bug ticket, or show your manager how your change improved app performance? Seeing observability data in context with events not only helps with troubleshooting, but also helps us communicate with other teams.
Detectors
20 minutes
After we have a good understanding of our performance baseline, we can start to create Detectors so that we receive alerts when our KPIs are unexpected. If we create detectors before understanding our baseline, we run the risk of generating unnecessary alert noise.
For RUM and Synthetics, we will explore how to create detectors:
on a single Synthetic test
on a single KPI in RUM
on a dashboard chart
For more Detector resources, please see our Observability docs, Lantern, and consider an Education course if you’d like to go more in depth with instructor guidance.
The endpoint, API transaction, or browser journey is highly critical
We have deployed code changes and want to know if the resulting KPI is or is not as we expect
We need to temporarily keep a close eye on a specific change we are testing and don’t want to create a lot of noise, and will disable the detector later
We want to know about unexpected issues before a real user encounters them
On the test overview page, click Create Detector on the top right.
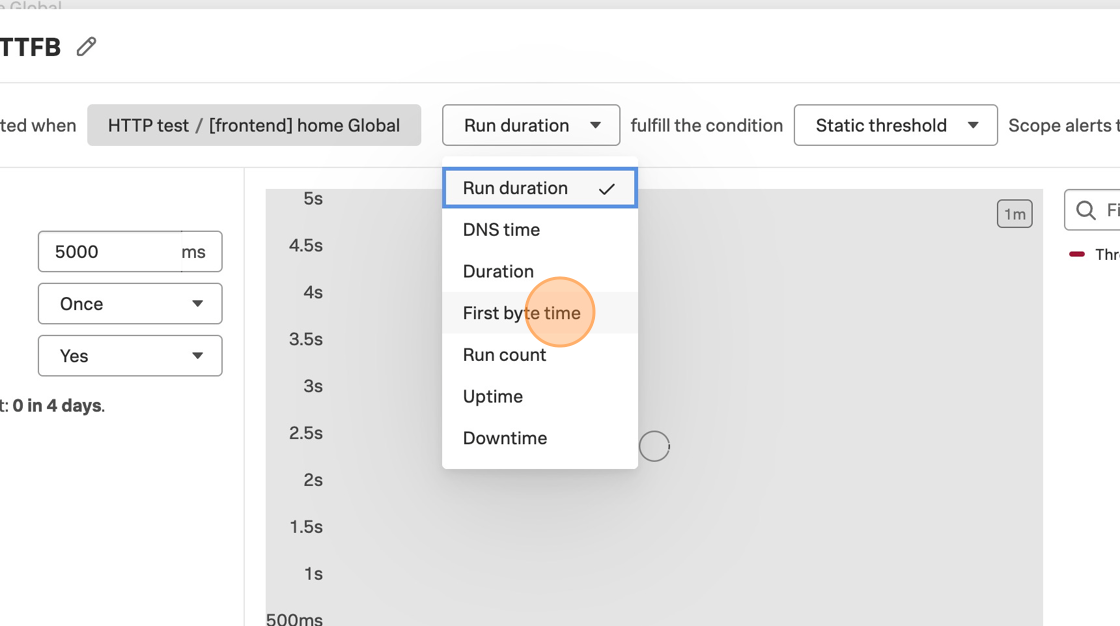
Name the detector with your team name and your initials and LCP (the signal we will eventually use), so that the instructor can better keep track of everyone’s progress.
Change the signal to First byte time.
Change the alert details, and see how the chart to the right shows the amount of alert events under those conditions. This is where you can decide how much alert noise you want to generate, based on how much your team tolerates. Play with the settings to see how they affect estimated alert noise.
Now, change the signal to Largest contentful paint. This is a key web vital related to the user experience as it relates to loading time. Change the threshold to 2500ms. It’s okay if there is no sample alert event in the detector preview.
Scroll down in this window to see the notification options, including severity and recipients.
Click the notifications link to customize the alert subject, message, tip, and runbook link.
When you are happy with the amount of alert noise this detector would generate, click Activate.
RUM Detectors
Let’s say we want to know about an issue in production without waiting for a ticket from our support center. This is where creating detectors in RUM will be helpful for us.
Go to the RUM view of the Syncreator App. Scroll to the LCP chart, click the chart menu icon, and click Create Detector.
Rename the test to include your team name and initials, and change the scope of the detector to App so we are not limited to a single URL or page. Change the threshold and sensitivity until there is at least one alert event in the time frame.
Change the alert severity and add a recipient if you’d like, and click Activate to save the Detector.
Exercise
Now, your workshop instructor will change something on the website. How do you find out about the issue, and how do you investigate it?
Tip
Wait a few minutes, and take a look at the online store homepage in your browser. How is the experience in an incognito browser window? How is it different when you refresh the page?
Chart Detectors
With our custom dashboard charts, we can create detectors focussed directly on the data and conditions we care about. In building our charts, we also built signals that can trigger alerts.
Static detectors
For many KPIs, we have a static value in mind as a threshold.
In your custom End User Experience dashboard, go to the “LCP - all tests” chart.
Click the bell icon on the top right of the chart, and select “New detector from chart”
Change the detector name to include your team name and initials, and adjust the alert details. Change the threshold to 2500 or 4000 and see how the alert noise preview changes.
Change the severity, and add yourself as a recipient before you save this detector. Click Activate.
Advanced: Dynamic detectors
Sometimes we have metrics that vary naturally, so we want to create a more dynamic detector that isn’t limited by the static threshold we decide in the moment.
To create dynamic detectors on your chart, click the link to the “old” detector wizard.
Change the detector name to include your team name and initials, and Click Create alert rule
Confirm the signal looks correct and proceed to Alert condition.
Select the “Sudden Change” condition and proceed to Alert settings
Play with the settings and see how the estimated alert noise is previewed in the chart above. Tune the settings, and change the advanced settings if you’d like, before proceeding to the Alert message.
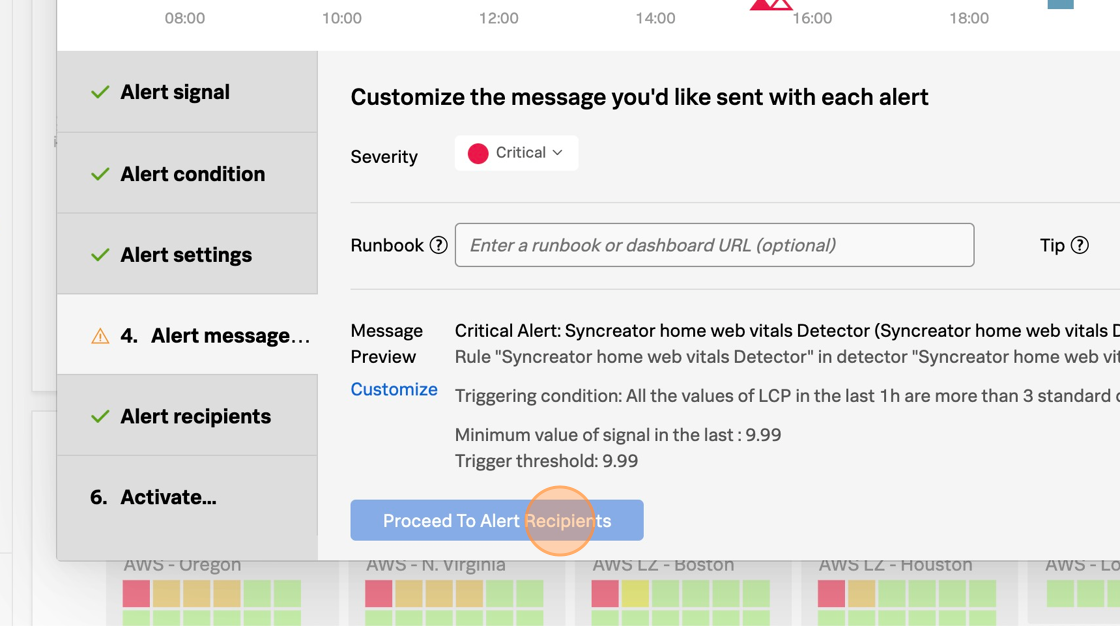
Customize the severity, runbook URL, any tips, and message payload before proceeding to add recipients.
For the sake of this workshop, only add your own email address as recipient. This is where you would add other options like webhooks, ticketing systems, and Slack channels if it’s in your real environment.
Finally, confirm the detector name before clicking Activate Alert Rule
Summary
2 minutes
In this workshop, we learned the following:
How to create simple synthetic tests so that we can quickly begin to understand the availability and performance of our application
How to understand what RUM shows us about the end user experience, including specific user sessions
How to write advanced synthetic browser tests to proactively test our most important user actions
How to visualize our frontend performance data in context with events on dashboards
How to set up detectors so we don’t have to wait to hear about issues from our end users
How all of the above, plus Splunk and Google’s resources, helps us optimize end user experience
There is a lot more we can do with front end performance monitoring. If you have extra time, be sure to play with the charts, detectors, and do some more synthetic testing. Remember our resources such as Lantern, Splunk Docs, and experiment with apps for Mobile RUM.
This is just the beginning! If you need more time to trial Splunk Observability, or have any other questions, reach out to a Splunk Expert.