3 minutes
Author
Tim HardTags are key-value pairs that provide additional metadata about metrics, spans in a trace, or logs allowing you to enrich the context of the data you send to Splunk Observability Cloud. Many tags are collected by default such as hostname or OS type. Custom tags can be used to provide environment or application-specific context. Examples of custom tags include:
Infrastructure specific attributes
- What data center a host is in
- What services are hosted on an instance
- What team is responsible for a set of hosts
Application specific attributes
- What Application Version is running
- Feature flags or experimental identifiers
- Tenant ID in multi-tenant applications
- User ID
- User role (e.g. admin, guest, subscriber)
- User geographical location (e.g. country, city, region)
- Add tags as OpenTelemetry attributes to metrics, traces, and logs when you send data to the Splunk Distribution of OpenTelemetry Collector. This option lets you add spans in bulk.
- Instrument your application to create span tags. This option gives you the most flexibility at the per-application level.
Tags are essential for an application to be truly observable. Tags add context to the traces to help us understand why some users get a great experience and others don’t. Powerful features in Splunk Observability Cloud utilize tags to help you jump quickly to the root cause.
Contextual Information: Tags provide additional context to the metrics, traces, and logs allowing developers and operators to understand the behavior and characteristics of infrastructure and traced operations.
Filtering and Aggregation: Tags enable filtering and aggregation of collected data. By attaching tags, users can filter and aggregate data based on specific criteria. This filtering and aggregation help in identifying patterns, diagnosing issues, and gaining insights into system behavior.
Correlation and Analysis: Tags facilitate correlation between metrics and other telemetry data, such as traces and logs. By including common identifiers or contextual information as tags, users can correlate metrics, traces, and logs enabling comprehensive analysis and troubleshooting of distributed systems.
Customization and Flexibility: OpenTelemetry allows developers to define custom tags based on their application requirements. This flexibility enables developers to capture domain-specific metadata or contextual information that is crucial for understanding the behavior of their applications.
A note about terminology before we proceed. While this workshop is about tags, and this is the terminology we use in Splunk Observability Cloud, OpenTelemetry uses the term attributes instead. So when you see tags mentioned throughout this workshop, you can treat them as synonymous with attributes.
Adding Context With Tags
3 minutes
Author
Tim HardWhen you deployed the OpenTelemetry Demo Application in the Getting Started section of this workshop, you were asked to enter your favorite city. For this workshop, we’ll be using that to show the value of custom tags.
For this workshop, the OpenTelemetry collector is pre-configured to use the city you provided as a custom tag called store.location which will be used to emulate Kubernetes Clusters running in different geographic locations. We’ll use this tag as a filter to show how you can use Out-of-the-Box integration dashboards to quickly create views for specific teams, applications, or other attributes about your environment. Efficiently enabling content to be reused across teams without increasing technical debt.
Here is the OpenTelemetry Collector configuration used to add the store.location tag to all of the data sent to this collector. This means any metrics, traces, or logs will contain the store.location tag which can then be used to search, filter, or correlate this value.
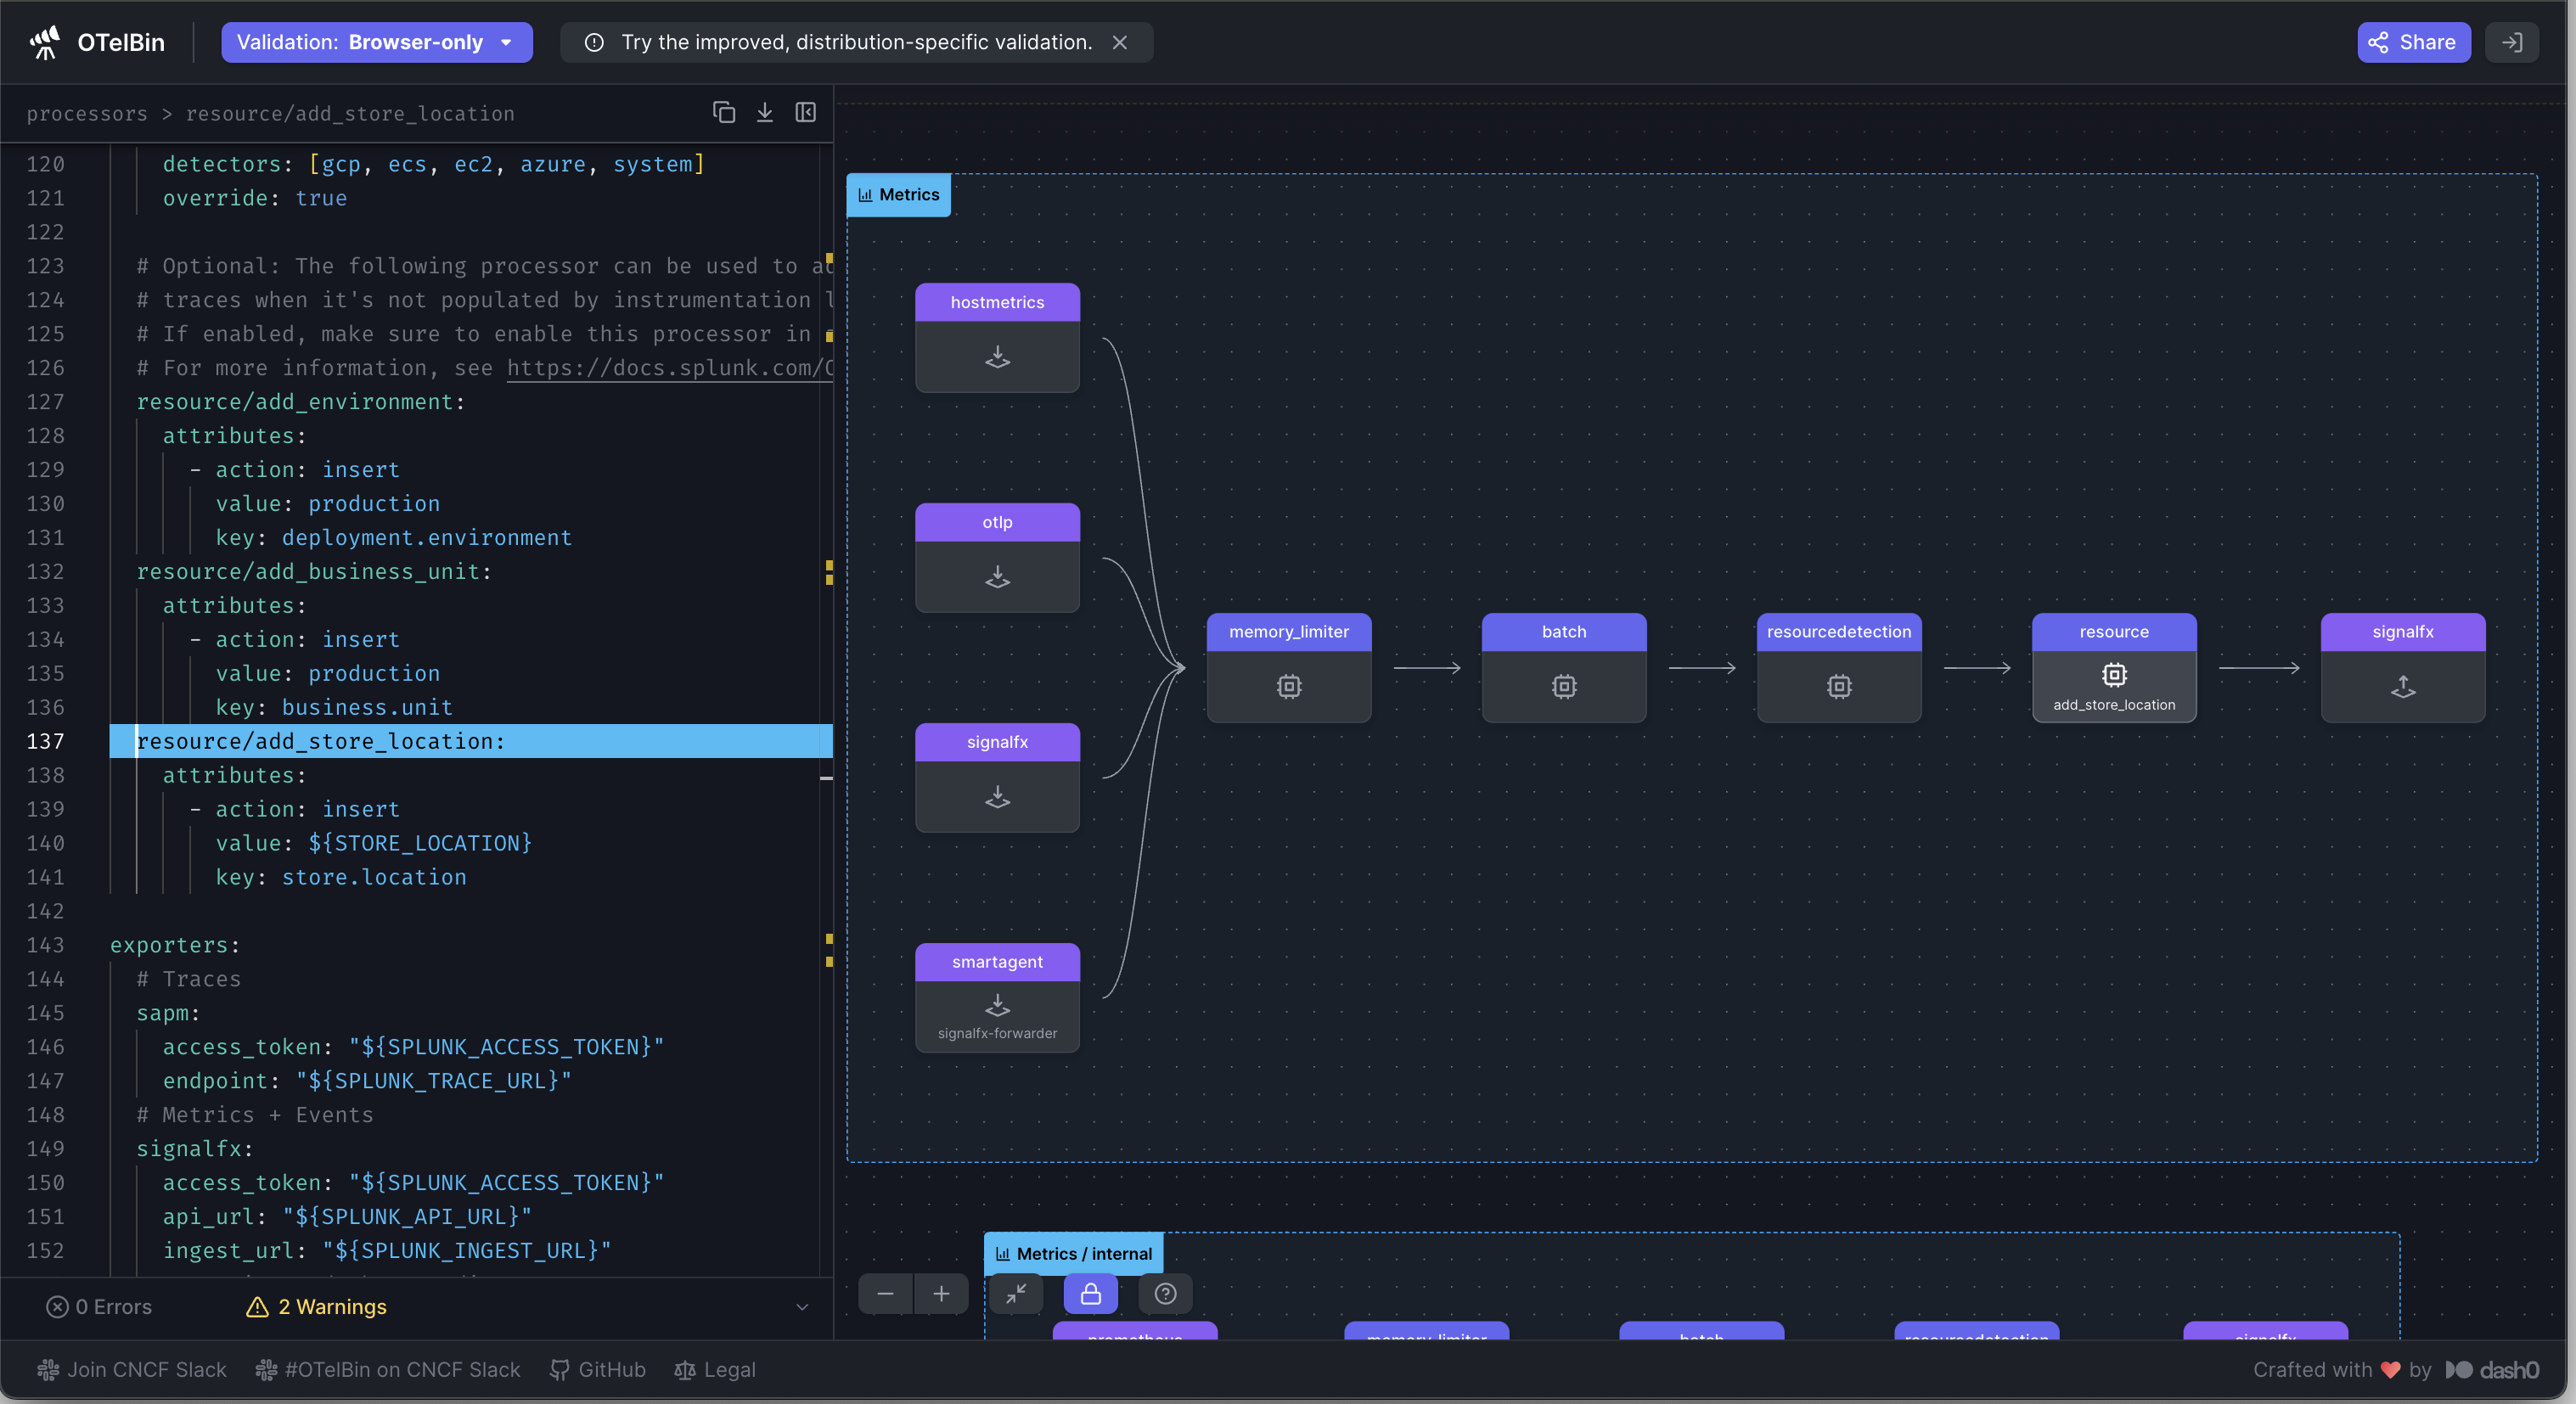
While this example uses a hard-coded value for the tag, parameterized values can also be used, allowing you to customize the tags dynamically based on the context of each host, application, or operation. This flexibility enables you to capture relevant metadata, user-specific details, or system parameters, providing a rich context for metrics, tracing, and log data while enhancing the observability of your distributed systems.
Now that you have the appropriate context, which as we’ve established is critical to Observability, let’s head over to Splunk Observability Cloud and see how we can use the data we’ve just configured.