Reuse Content Across Teams

3 minutes   Author Tim Hard

In today’s rapidly evolving technological landscape, where hybrid and cloud environments are becoming the norm, the need for effective monitoring and troubleshooting solutions has never been more critical. However, managing the elasticity and complexity of these modern infrastructures poses a significant challenge for teams across various industries. One of the primary pain points encountered in this endeavor is the inadequacy of existing monitoring and troubleshooting experiences.

Traditional monitoring approaches often fall short in addressing the intricacies of hybrid and cloud environments. Teams frequently encounter slow data visualization and troubleshooting processes, compounded by the clutter of bespoke yet similar dashboards and the manual correlation of data from disparate sources. This cumbersome workflow is made worse by the absence of monitoring tools tailored to ephemeral technologies such as containers, orchestrators like Kubernetes, and serverless functions.

Infrastructure Overview in Splunk Observability Cloud Infrastructure Overview in Splunk Observability Cloud

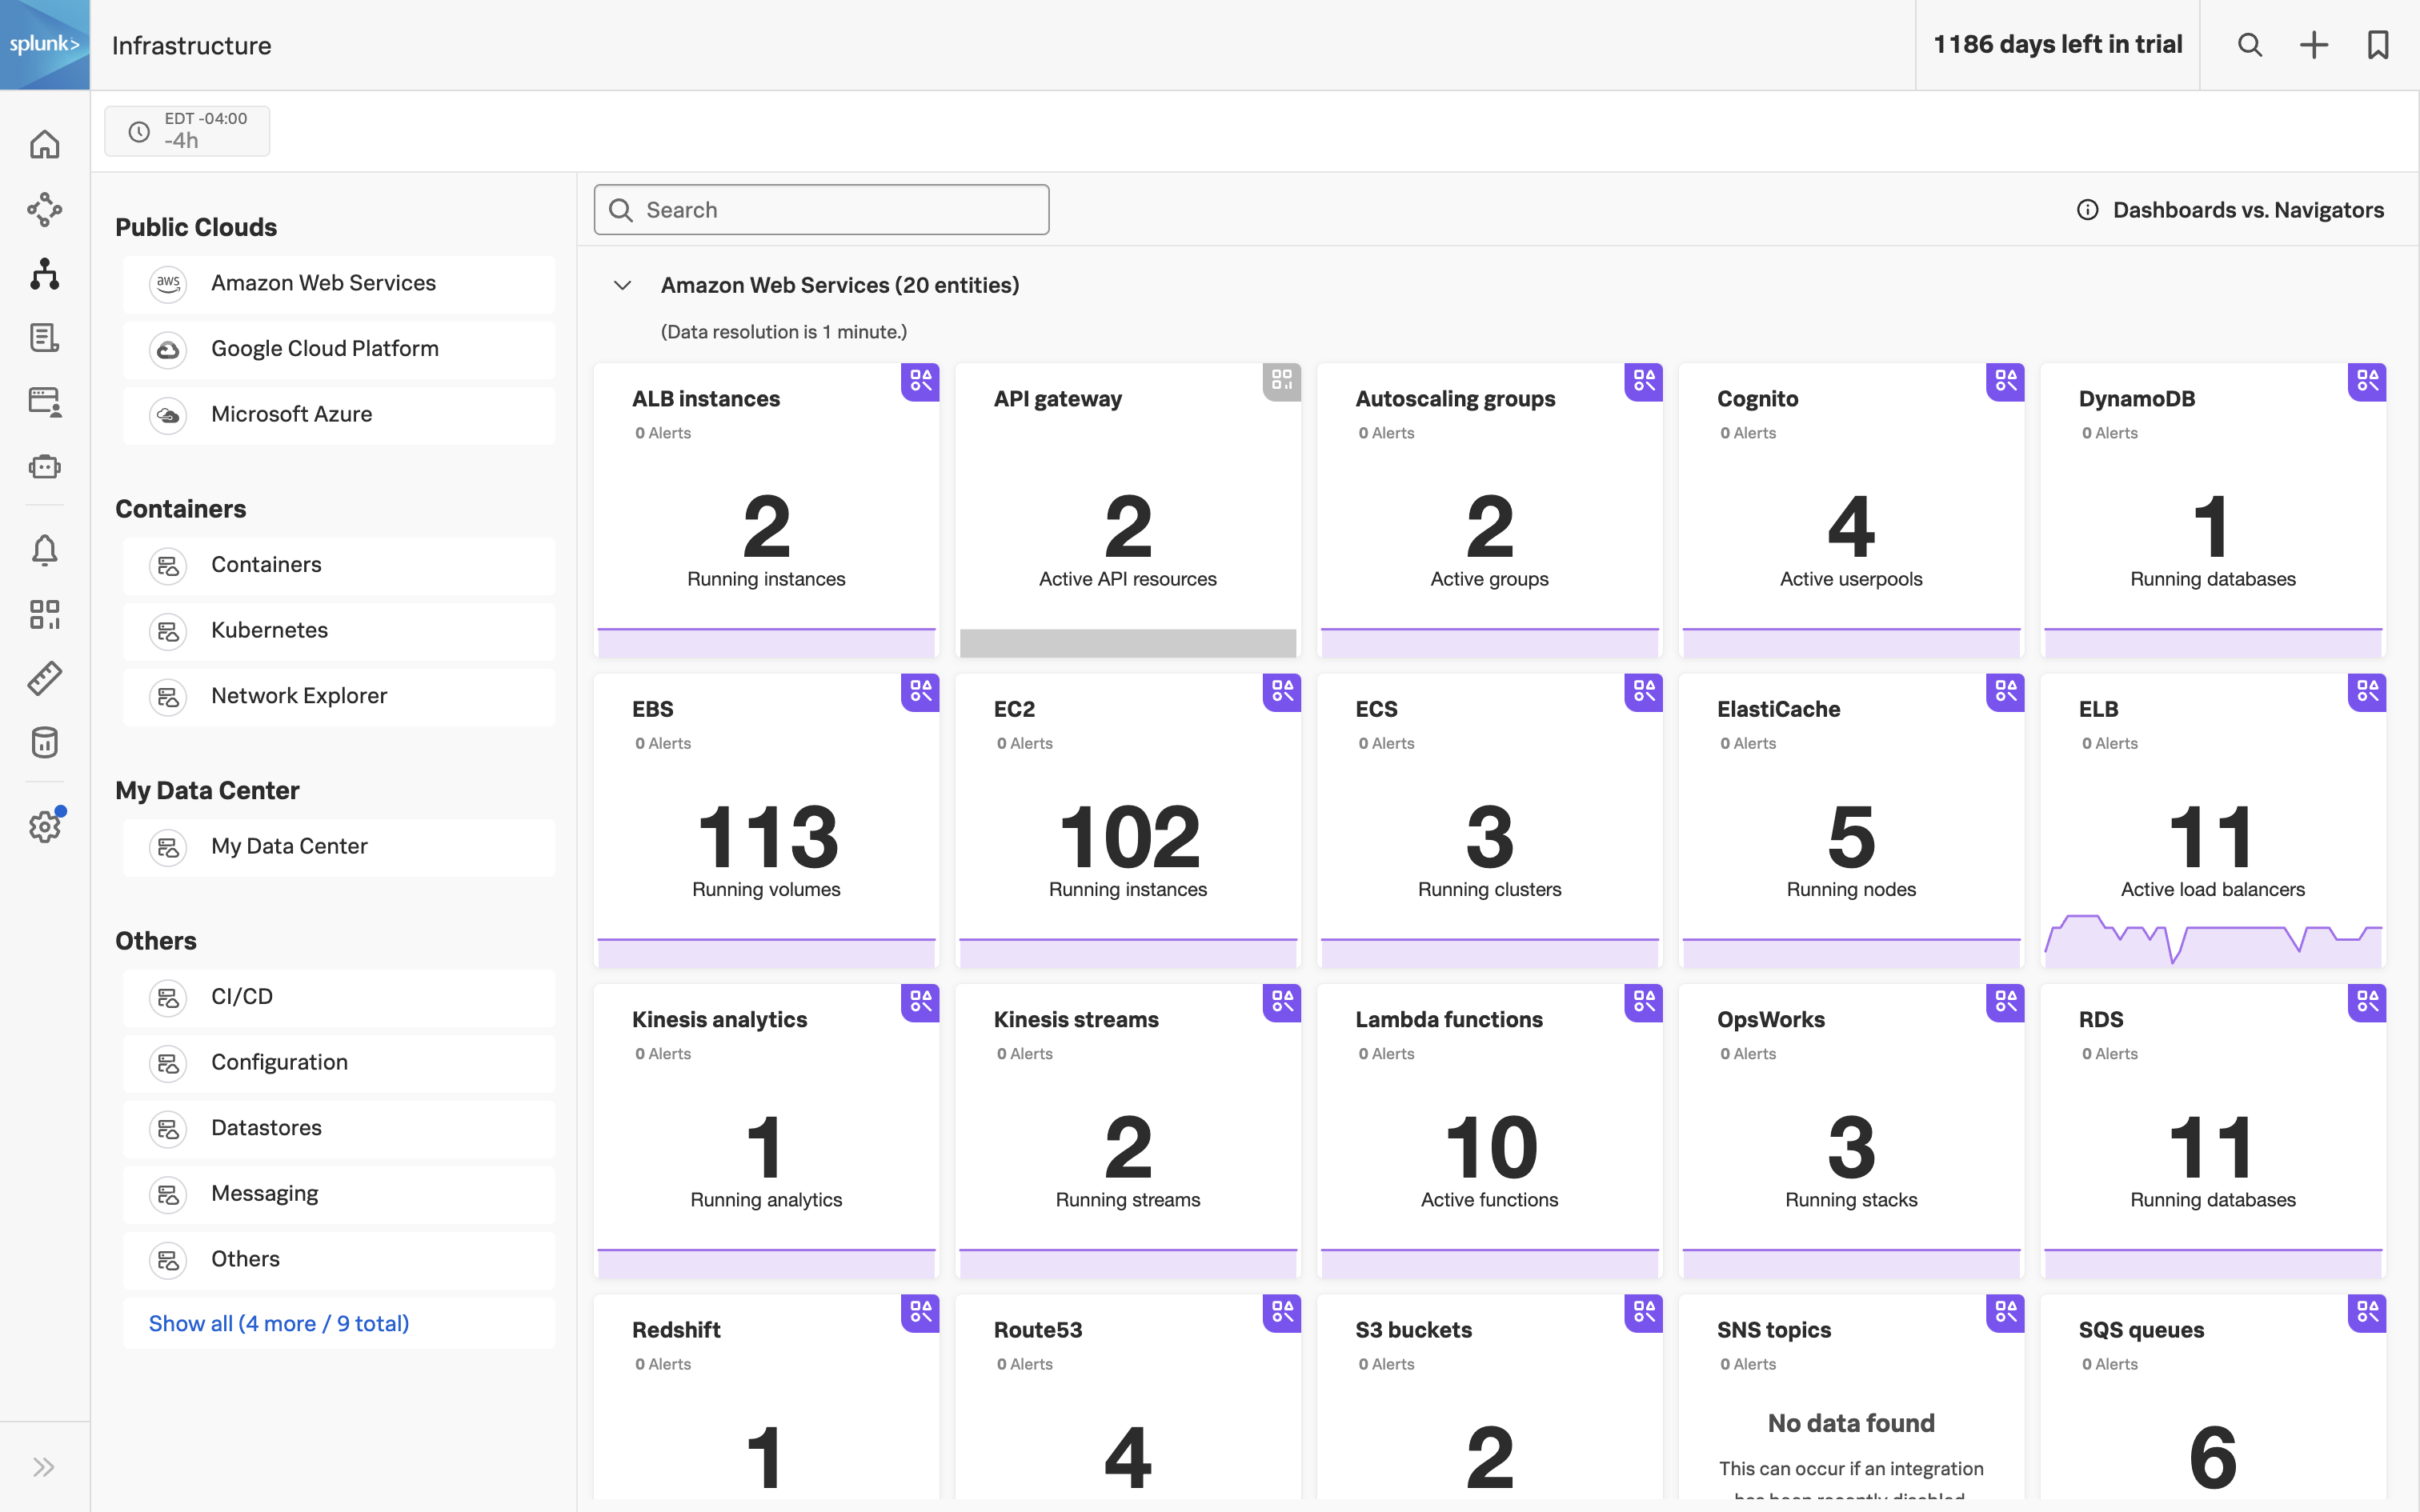
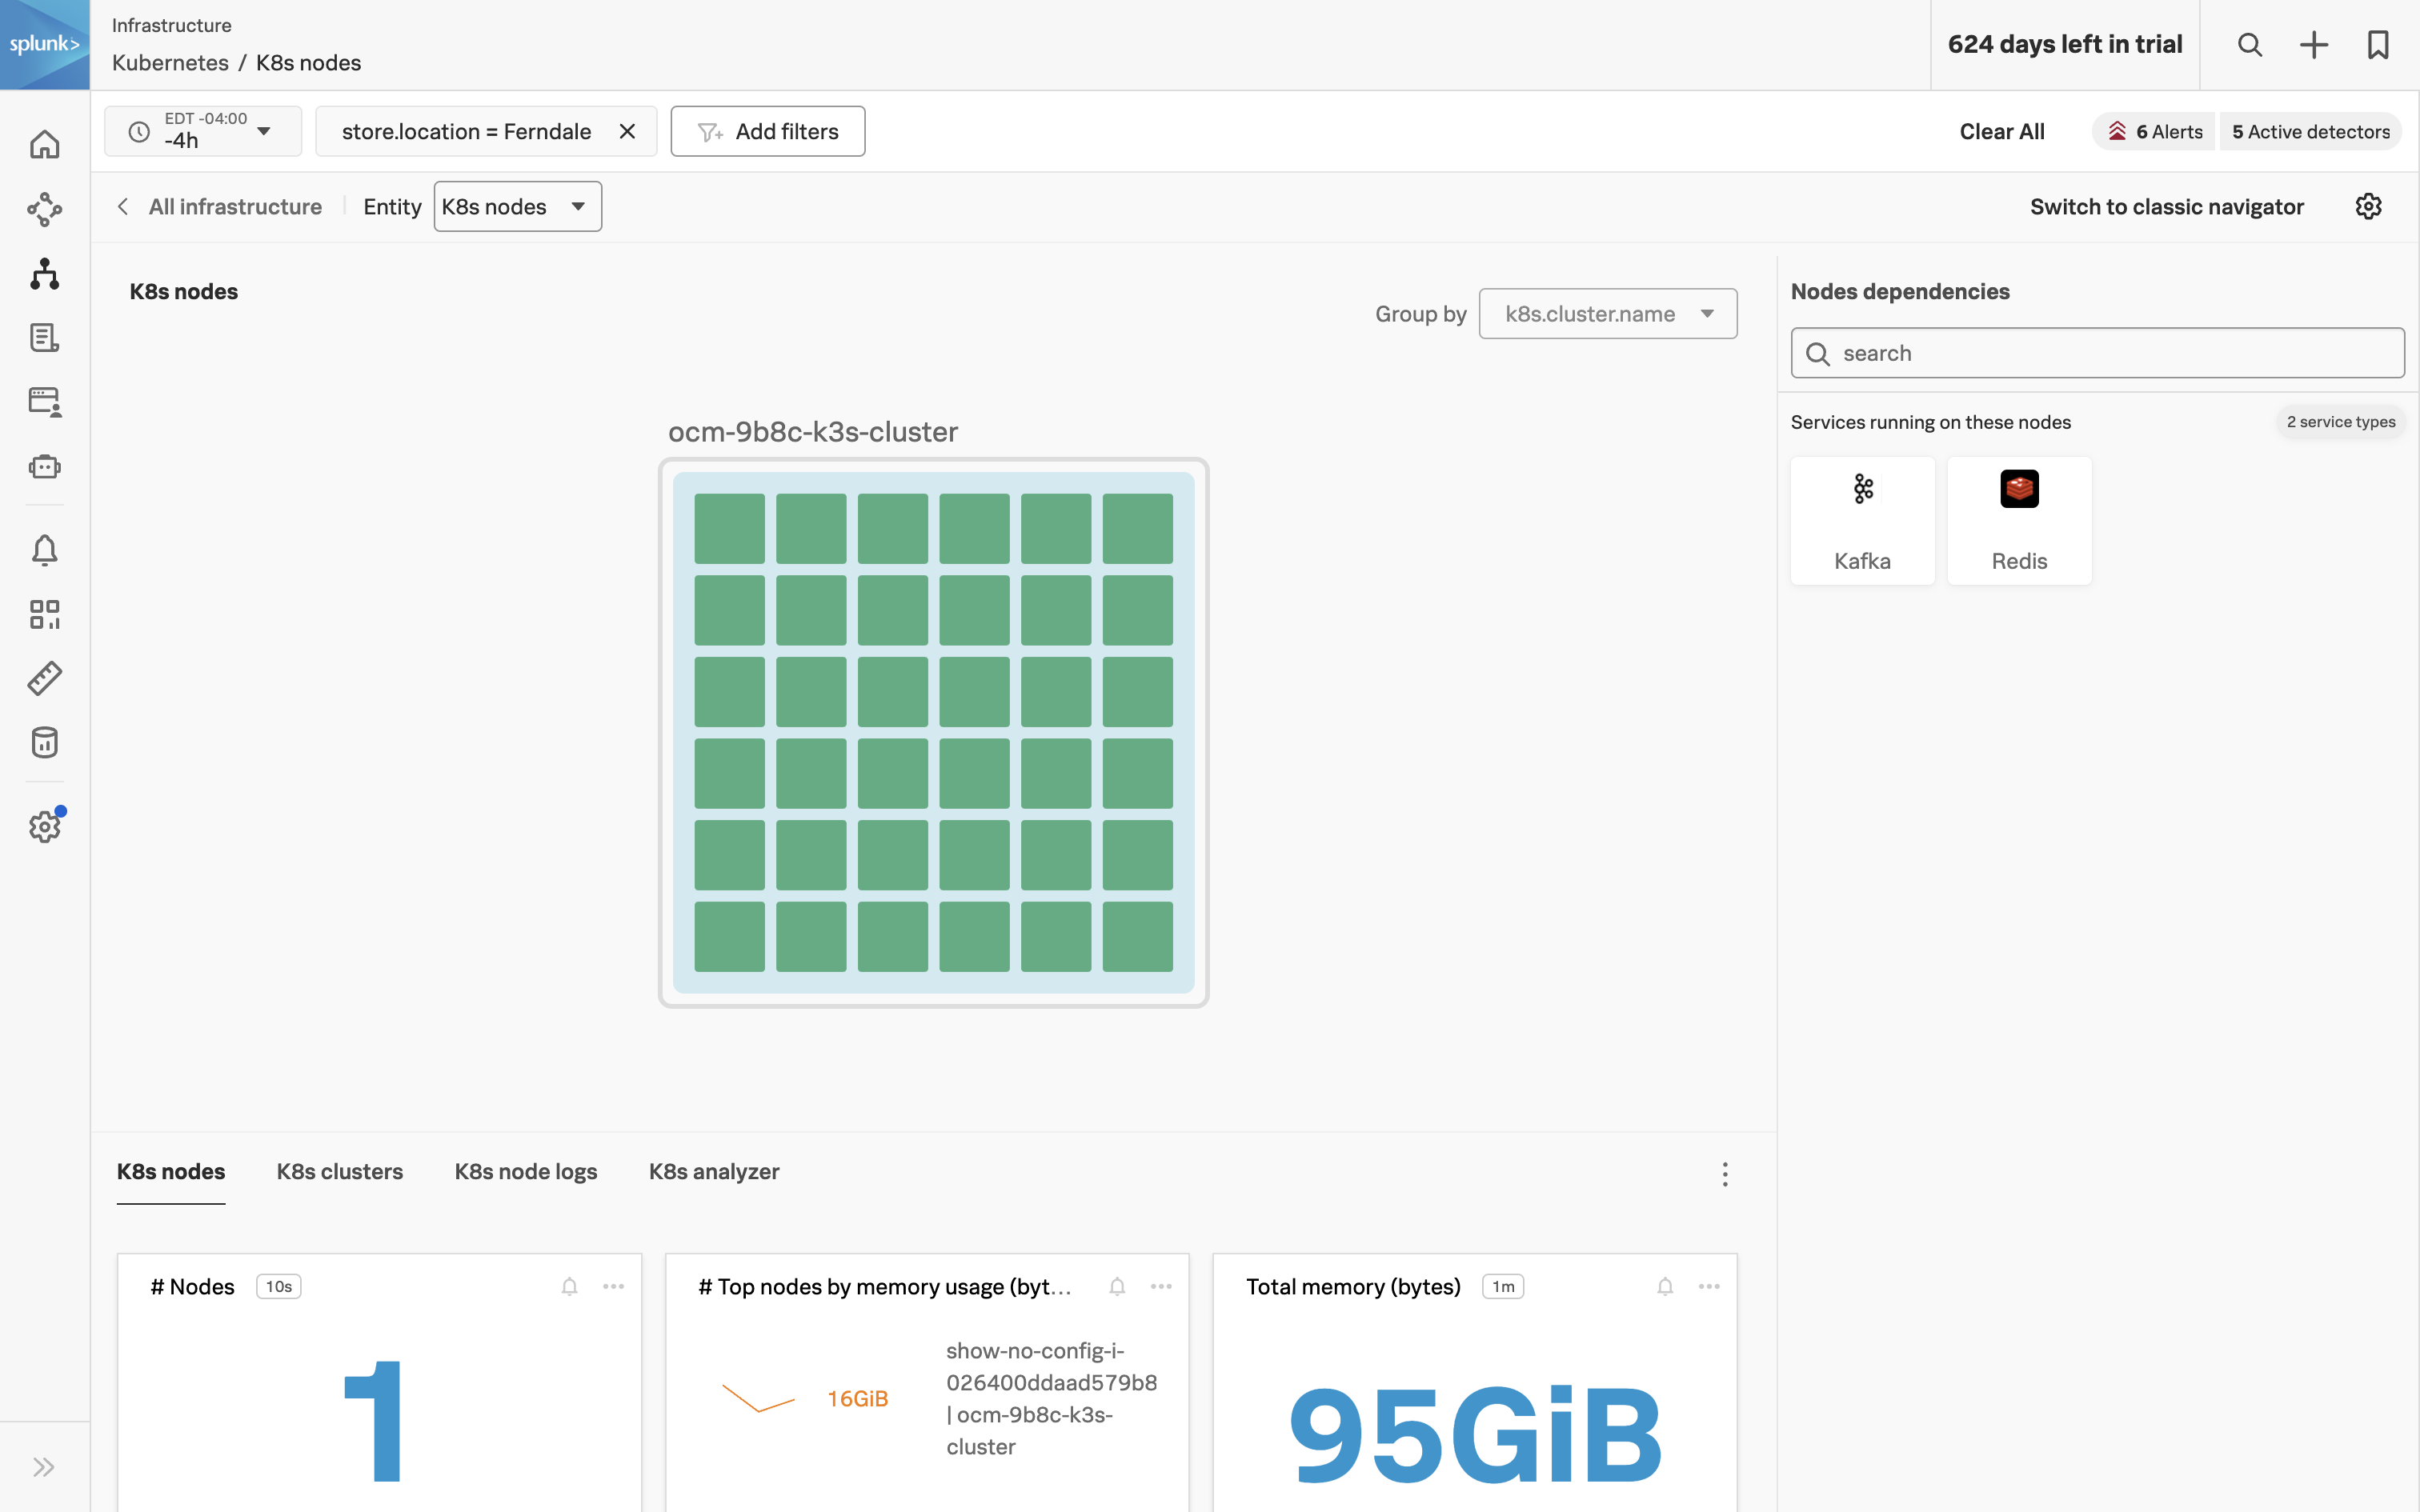
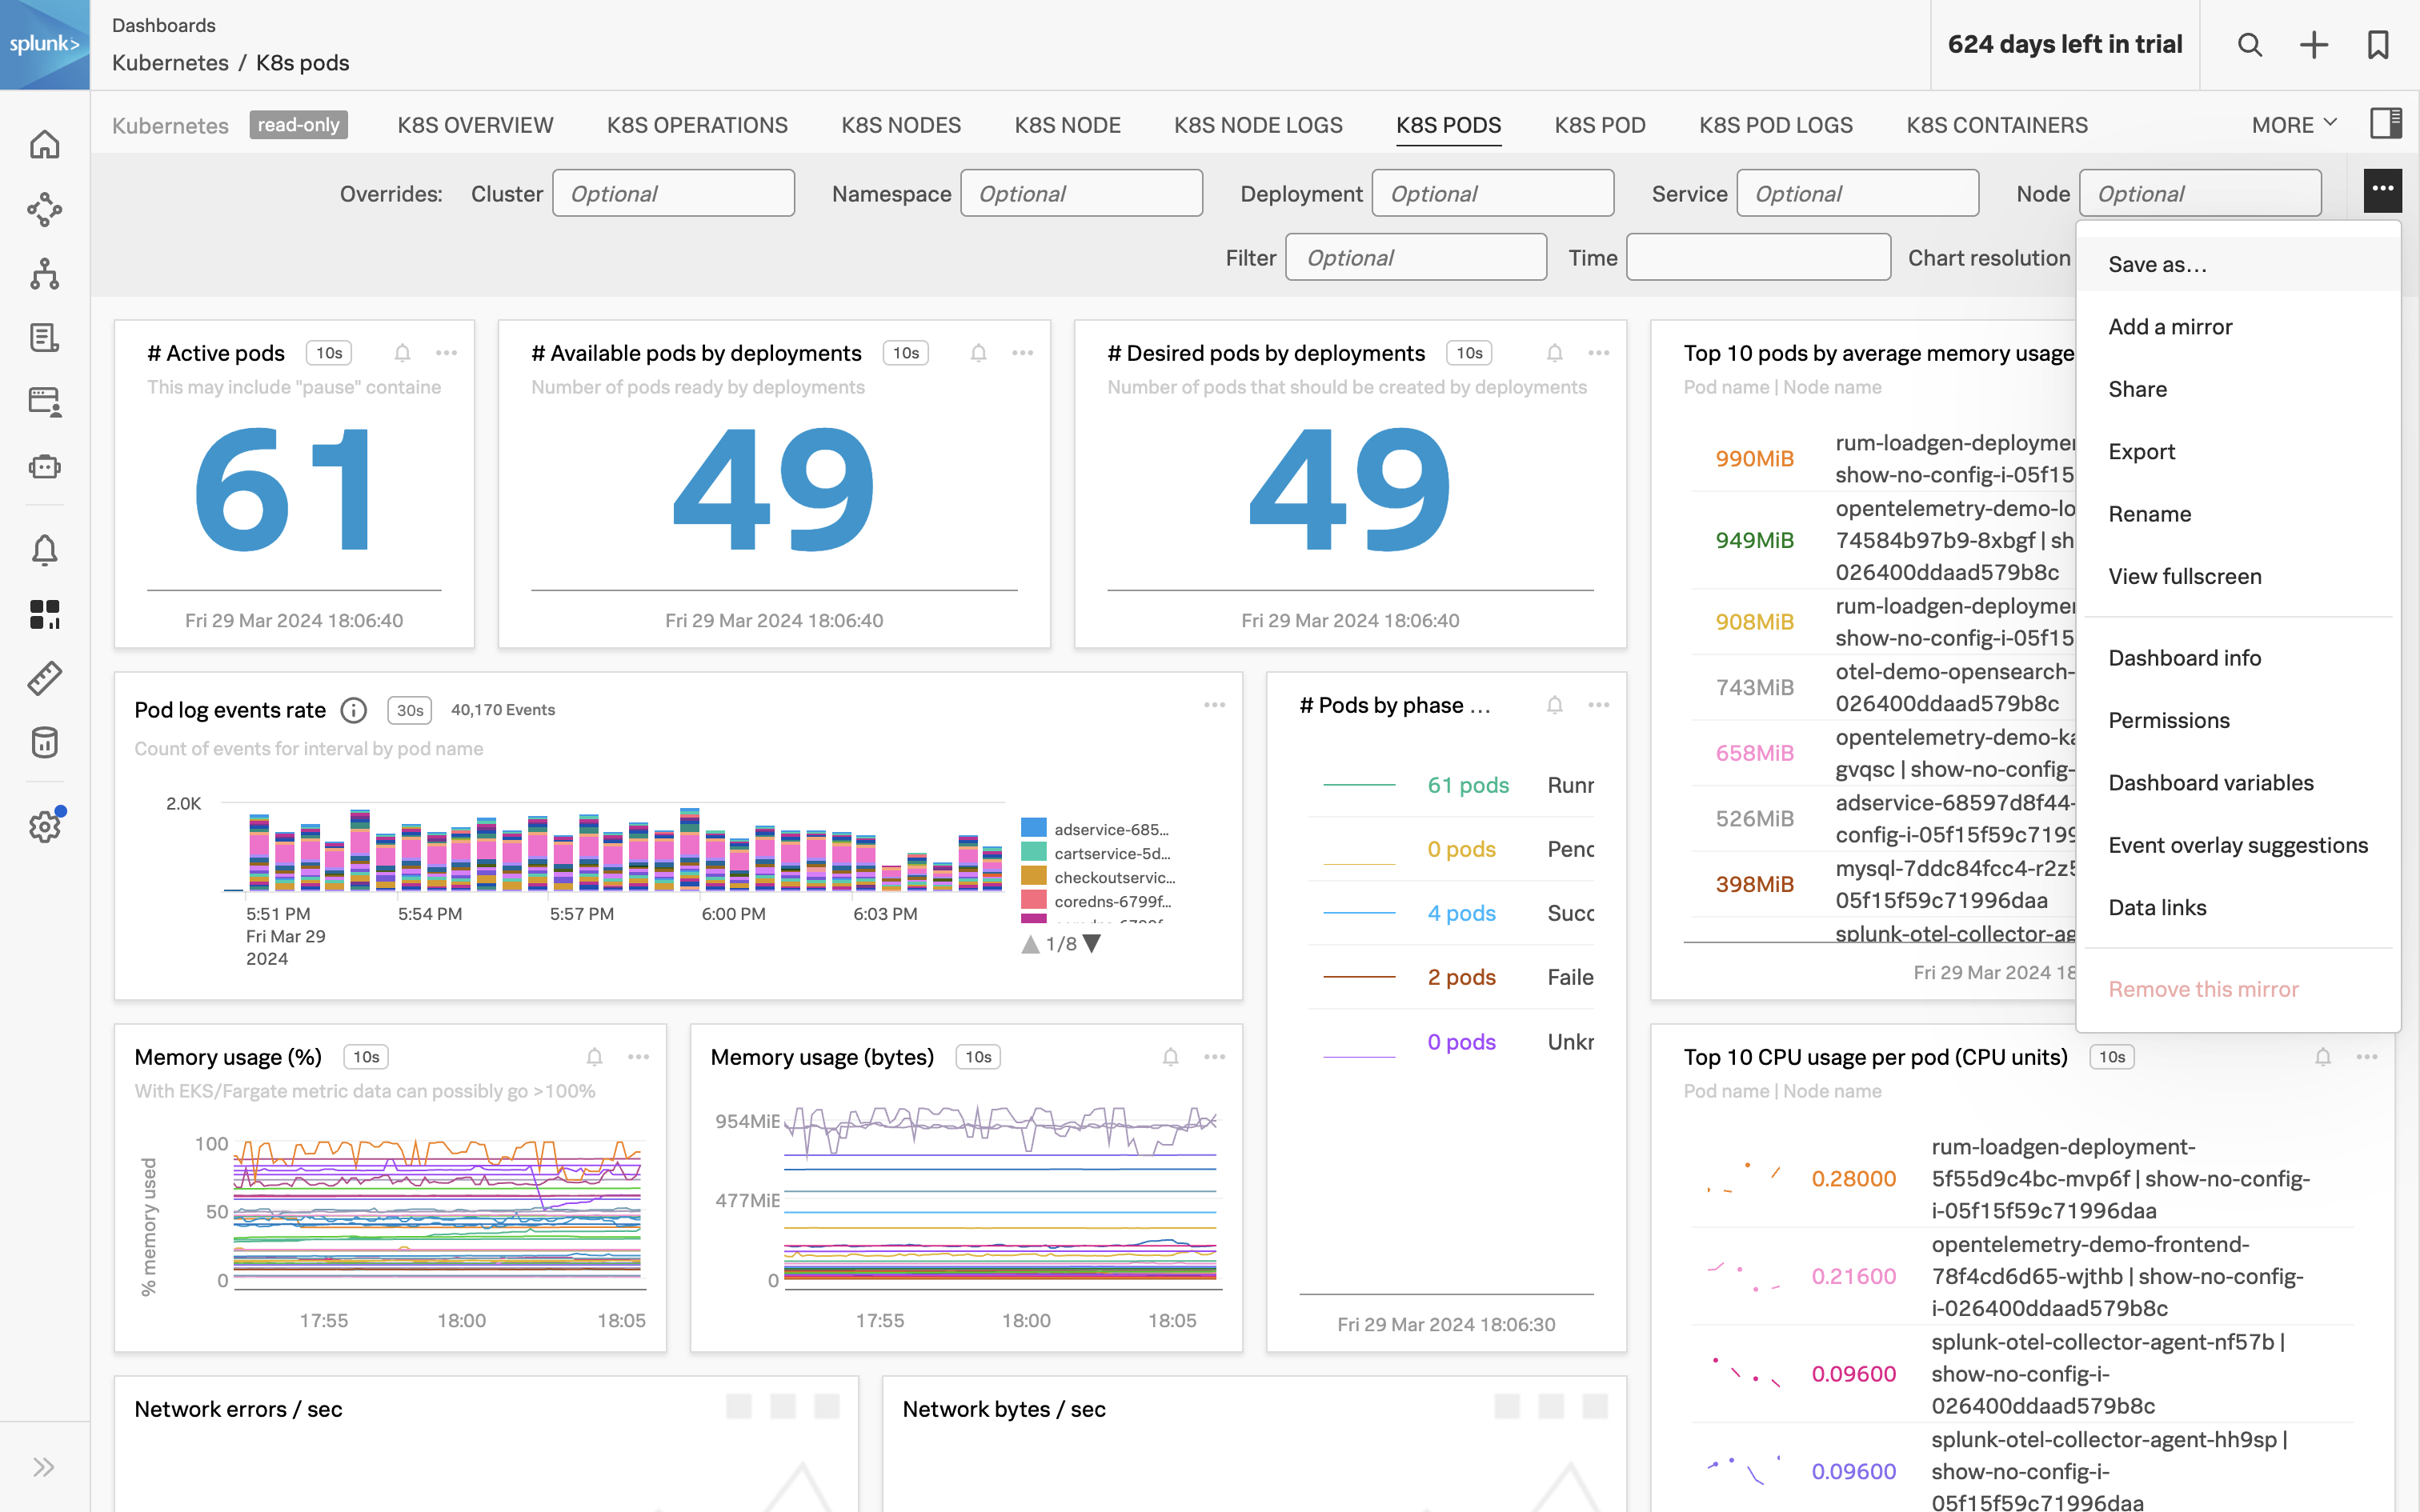
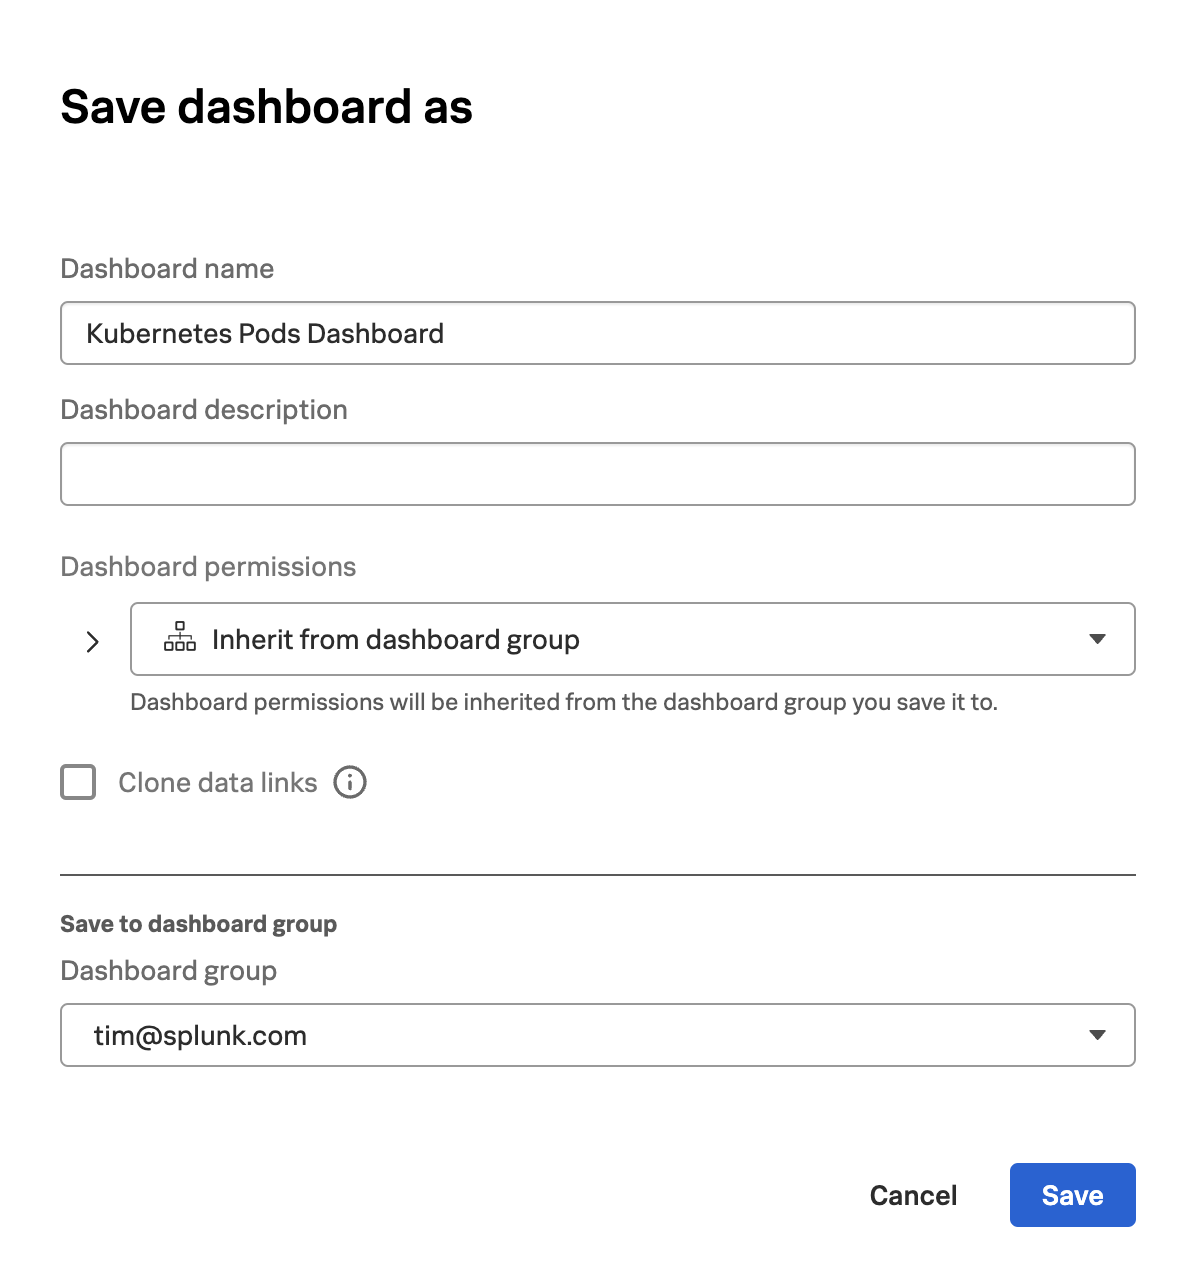
In this section, we’ll cover how Splunk Observability Cloud provides out-of-the-box content for every integration. Not only do the out-of-the-box dashboards provide rich visibility into the infrastructure that is being monitored they can also be mirrored. This is important because it enables you to create standard dashboards for use by teams throughout your organization. This allows all teams to see any changes to the charts in the dashboard, and members of each team can set dashboard variables and filter customizations relevant to their requirements.

Last Modified Apr 4, 2024

Subsections of Reuse Content Across Teams

Infrastrcuture Navigators

5 minutes   Author Tim Hard

Splunk Infrastructure Monitoring (IM) is a market-leading monitoring and observability service for hybrid cloud environments. Built on a patented streaming architecture, it provides a real-time solution for engineering teams to visualize and analyze performance across infrastructure, services, and applications in a fraction of the time and with greater accuracy than traditional solutions.

300+ Easy-to-use OOTB content: Pre-built navigators and dashboards, deliver immediate visualizations of your entire environment so that you can interact with all your data in real time.
Kubernetes navigator: Provides an instant, comprehensive out-of-the-box hierarchical view of nodes, pods, and containers. Ramp up even the most novice Kubernetes user with easy-to-understand interactive cluster maps.
AutoDetect alerts and detectors: Automatically identify the most important metrics, out-of-the-box, to create alert conditions for detectors that accurately alert from the moment telemetry data is ingested and use real-time alerting capabilities for important notifications in seconds.
Log views in dashboards: Combine log messages and real-time metrics on one page with common filters and time controls for faster in-context troubleshooting.
Metrics pipeline management: Control metrics volume at the point of ingest without re-instrumentation with a set of aggregation and data-dropping rules to store and analyze only the needed data. Reduce metrics volume and optimize observability spend.

Infrastructure Overview Infrastructure Overview

Exercise: Find your Kubernetes Cluster
  • From the Splunk Observability Cloud homepage, click the Infrastructure Infrastructure button -> Kubernetes -> K8s nodes
  • First, use the k8s filter k8s filter option to pick your cluster.
  • From the filter drop-down box, use the store.location value you entered when deploying the application.
  • You then can start typing the city you used which should also appear in the drop-down values. Select yours and make sure just the one for your workshop is highlighted with a blue tick blue tick.
  • Click the Apply Filter button to focus on our Cluster.

Kubernetes Navigator Kubernetes Navigator

  • You should now have your Kubernetes Cluster visible
  • Here we can see all of the different components of the cluster (Nodes, Pods, etc), each of which has relevant metrics associated with it. On the right side, you can also see what services are running in the cluster.

Before moving to the next section, take some time to explore the Kubernetes Navigator to see the data that is available Out of the Box.

Last Modified Apr 4, 2024

Dashboard Cloning

5 minutes   Author Tim Hard

ITOps teams responsible for monitoring fleets of infrastructure frequently find themselves manually creating dashboards to visualize and analyze metrics, traces, and log data emanating from rapidly changing cloud-native workloads hosted in Kubernetes and serverless architectures, alongside existing on-premises systems. Moreover, due to the absence of a standardized troubleshooting workflow, teams often resort to creating numerous custom dashboards, each resembling the other in structure and content. As a result, administrative overhead skyrockets and MTTR slows.

To address this, you can use the out-of-the-box dashboards available in Splunk Observability Cloud for each and every integration. These dashboards are filterable and can be used for ad hoc troubleshooting or as a templated approach to getting users the information they need without having to start from scratch. Not only do the out-of-the-box dashboards provide rich visibility into the infrastructure that is being monitored they can also be cloned.

Exercise: Create a Mirrored Dashboard
  1. In Splunk Observability Cloud, click the Global Search Search Search button. (Global Search can be used to quickly find content)
  2. Search for Pods and select K8s pods (Kubernetes) Search Search
  3. This will take you to the out-of-the-box Kubernetes Pods dashboard which we will use as a template for mirroring dashboards.
  4. In the upper right corner of the dashboard click the Dashboard actions button (3 horizontal dots) -> Click Save As… Search Search
  5. Enter a dashboard name (i.e. Kubernetes Pods Dashboard)
  6. Under Dashboard group search for your e-mail address and select it.
  7. Click Save

Note: Every Observability Cloud user who has set a password and logged in at least once, gets a user dashboard group and user dashboard. Your user dashboard group is your individual workspace within Observability Cloud.

Save Dashboard Save Dashboard

After saving, you will be taken to the newly created dashboard in the Dashboard Group for your user. This is an example of cloning an out-of-the-box dashboard which can be further customized and enables users to quickly build role, application, or environment relevant views.

Custom dashboards are meant to be used by multiple people and usually represent a curated set of charts that you want to make accessible to a broad cross-section of your organization. They are typically organized by service, team, or environment.

Last Modified Apr 4, 2024

Dashboard Mirroring

5 minutes   Author Tim Hard

Not only do the out-of-the-box dashboards provide rich visibility into the infrastructure that is being monitored they can also be mirrored. This is important because it enables you to create standard dashboards for use by teams throughout your organization. This allows all teams to see any changes to the charts in the dashboard, and members of each team can set dashboard variables and filter customizations relevant to their requirements.

Exercise: Create a Mirrored Dashboard
  1. While on the Kubernetes Pods dashboard, you created in the previous step, In the upper right corner of the dashboard click the Dashboard actions button (3 horizontal dots) -> Click Add a mirror…. A configuration modal for the Dashboard Mirror will open.

    Mirror Dashboard Menu Mirror Dashboard Menu

  2. Under My dashboard group search for your e-mail address and select it.

  3. (Optional) Modify the dashboard in Dashboard name override name.

  4. (Optional) Add a dashboard description in Dashboard description override.

  5. Under Default filter overrides search for k8s.cluster.name and select the name of your Kubernetes cluster.

  6. Under Default filter overrides search for store.location and select the city you entered during the workshop setup. Mirror Dashboard Config Mirror Dashboard Config

  7. Click Save

You will now be taken to the newly created dashboard which is a mirror of the Kubernetes Pods dashboard you created in the previous section. Any changes to the original dashboard will be reflected in this dashboard as well. This allows teams to have a consistent yet specific view of the systems they care about and any modifications or updates can be applied in a single location, significantly minimizing the effort needed when compared to updating each individual dashboard.

In the next section, you’ll add a new logs-based chart to the original dashboard and see how the dashboard mirror is automatically updated as well.