Optimize Cloud Monitoring

3 minutes   Author Tim Hard

The elasticity of cloud architectures means that monitoring artifacts must scale elastically as well, breaking the paradigm of purpose-built monitoring assets. As a result, administrative overhead, visibility gaps, and tech debt skyrocket while MTTR slows. This typically happens for three reasons:

  • Complex and Inefficient Data Management: Infrastructure data is scattered across multiple tools with inconsistent naming conventions, leading to fragmented views and poor metadata and labelling. Managing multiple agents and data flows adds to the complexity.
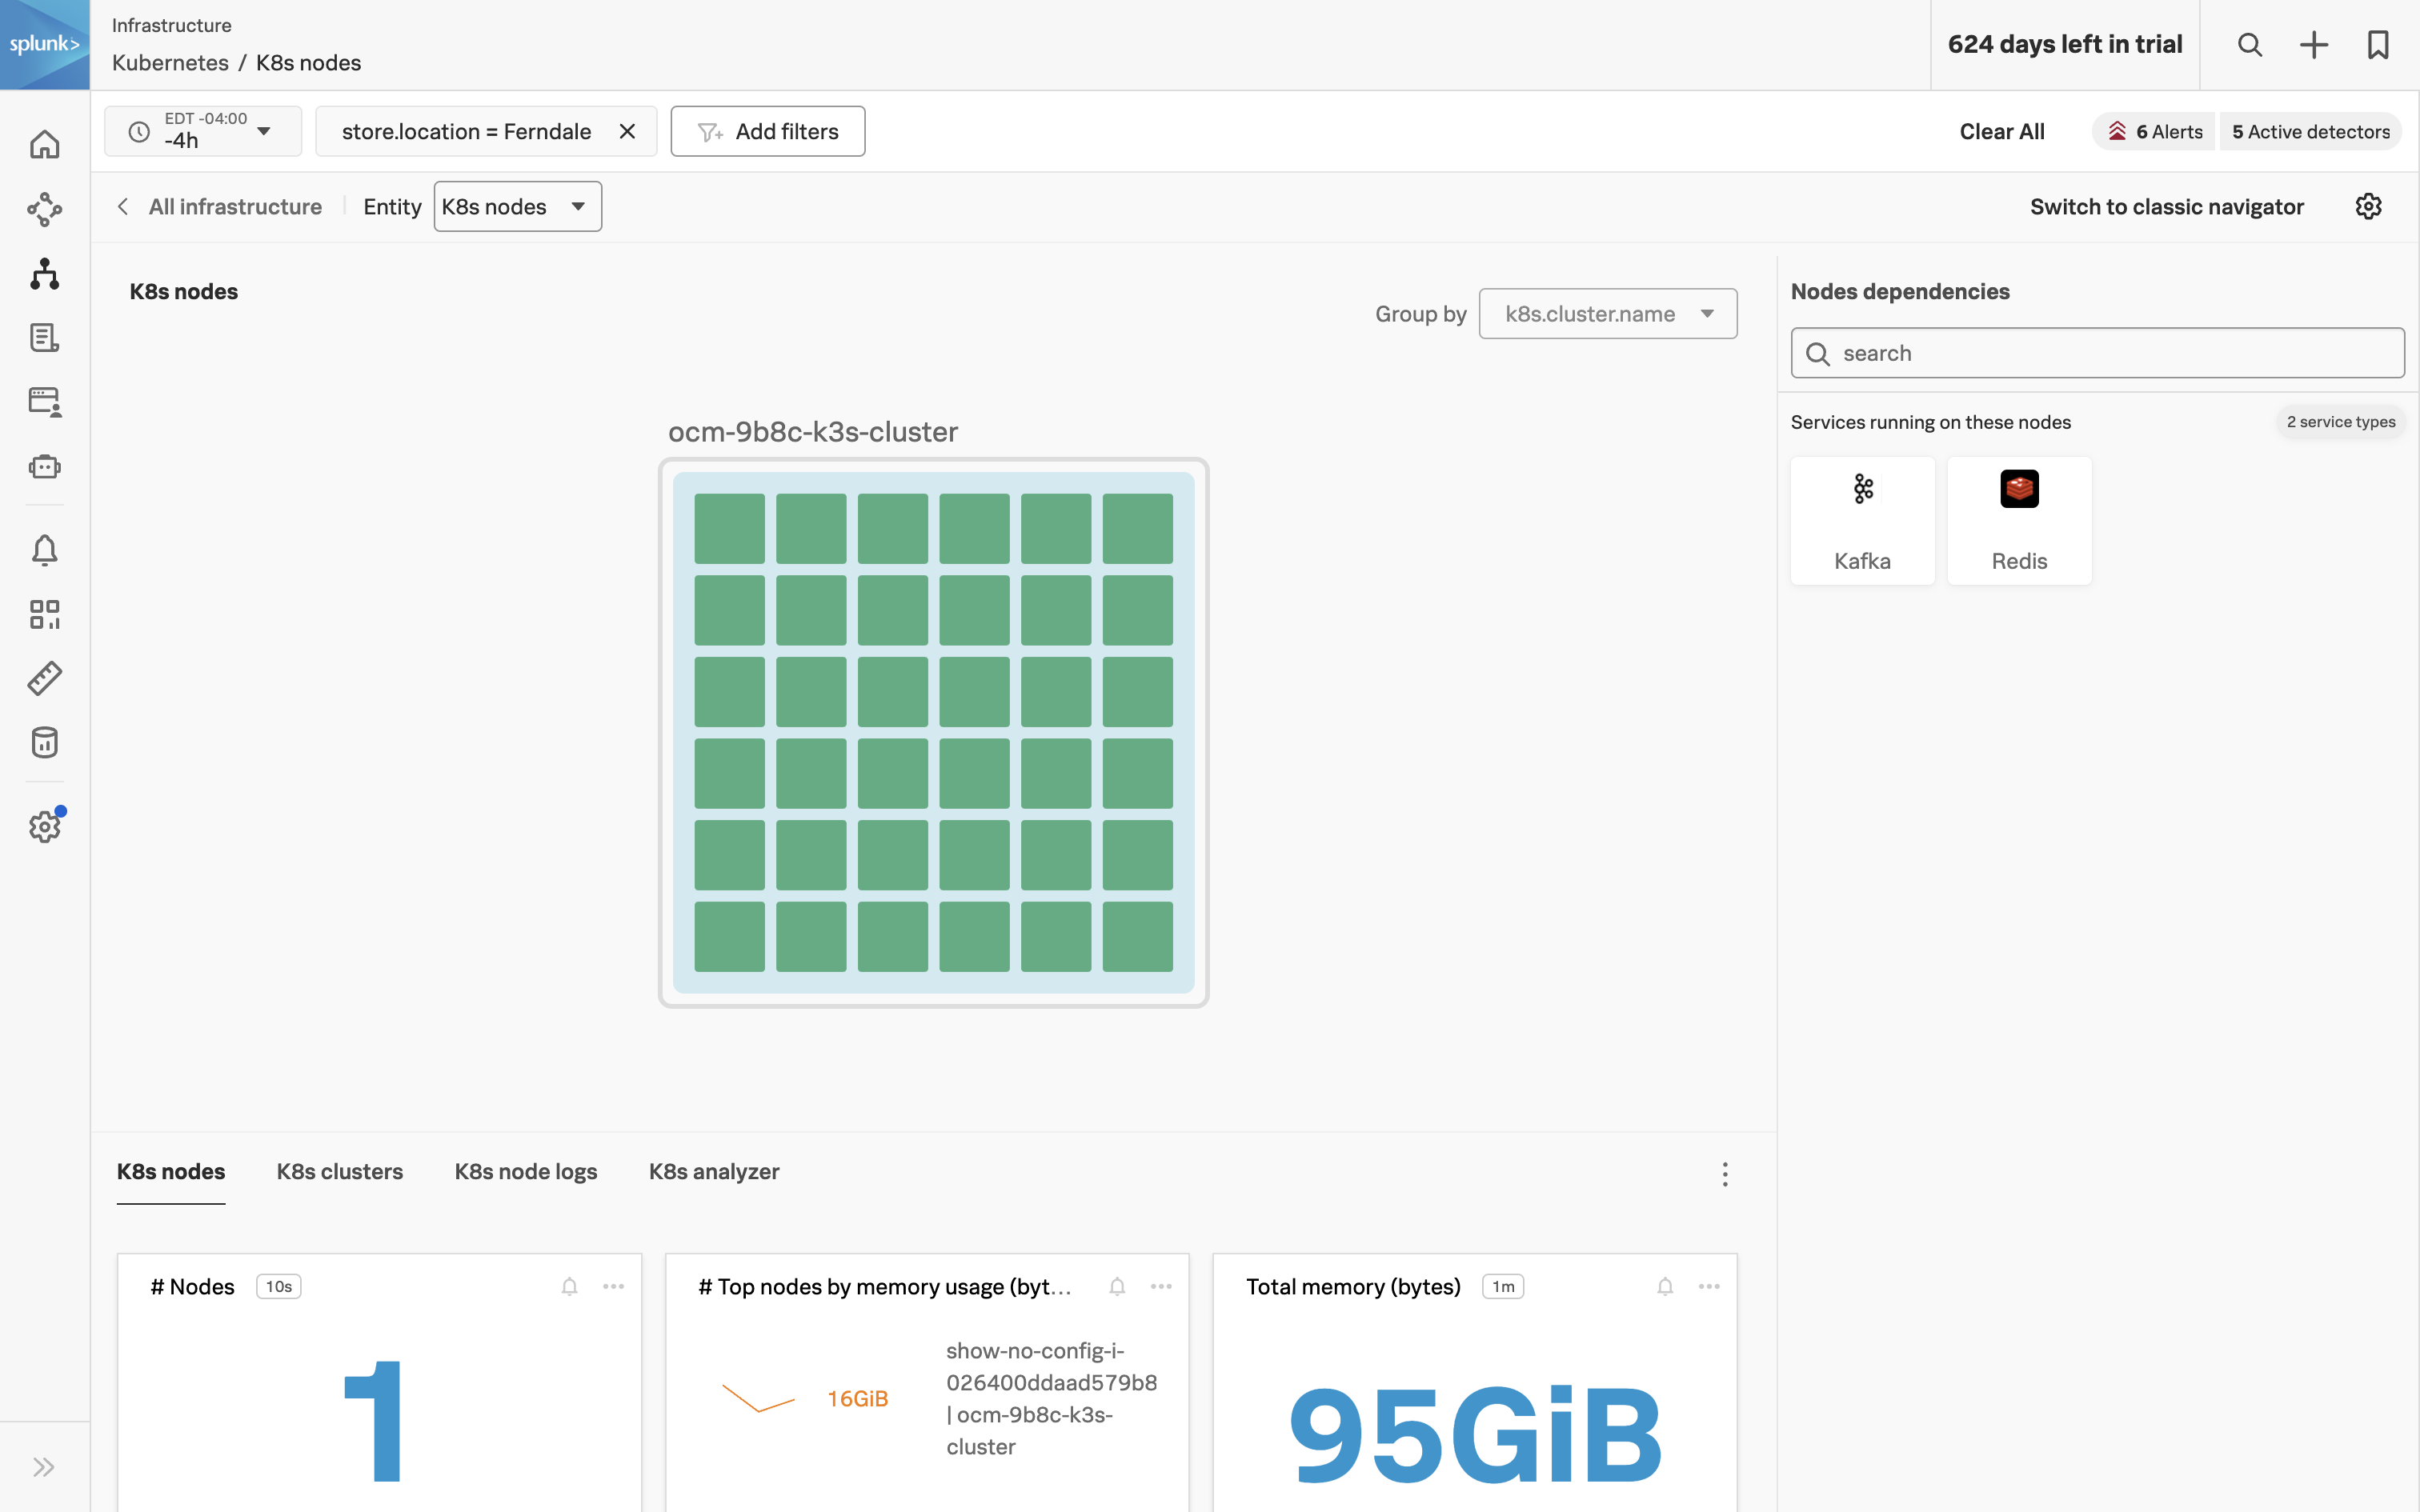
  • Inadequate Monitoring and Troubleshooting Experience: Slow data visualization and troubleshooting, cluttered with bespoke dashboards and manual correlations, are hindered further by the lack of monitoring tools for ephemeral technologies like Kubernetes and serverless functions.
  • Operational and Scaling Challenges: Manual onboarding, user management, and chargeback processes, along with the need for extensive data summarization, slow down operations and inflate administrative tasks, complicating data collection and scalability.

To address these challenges you need a way to:

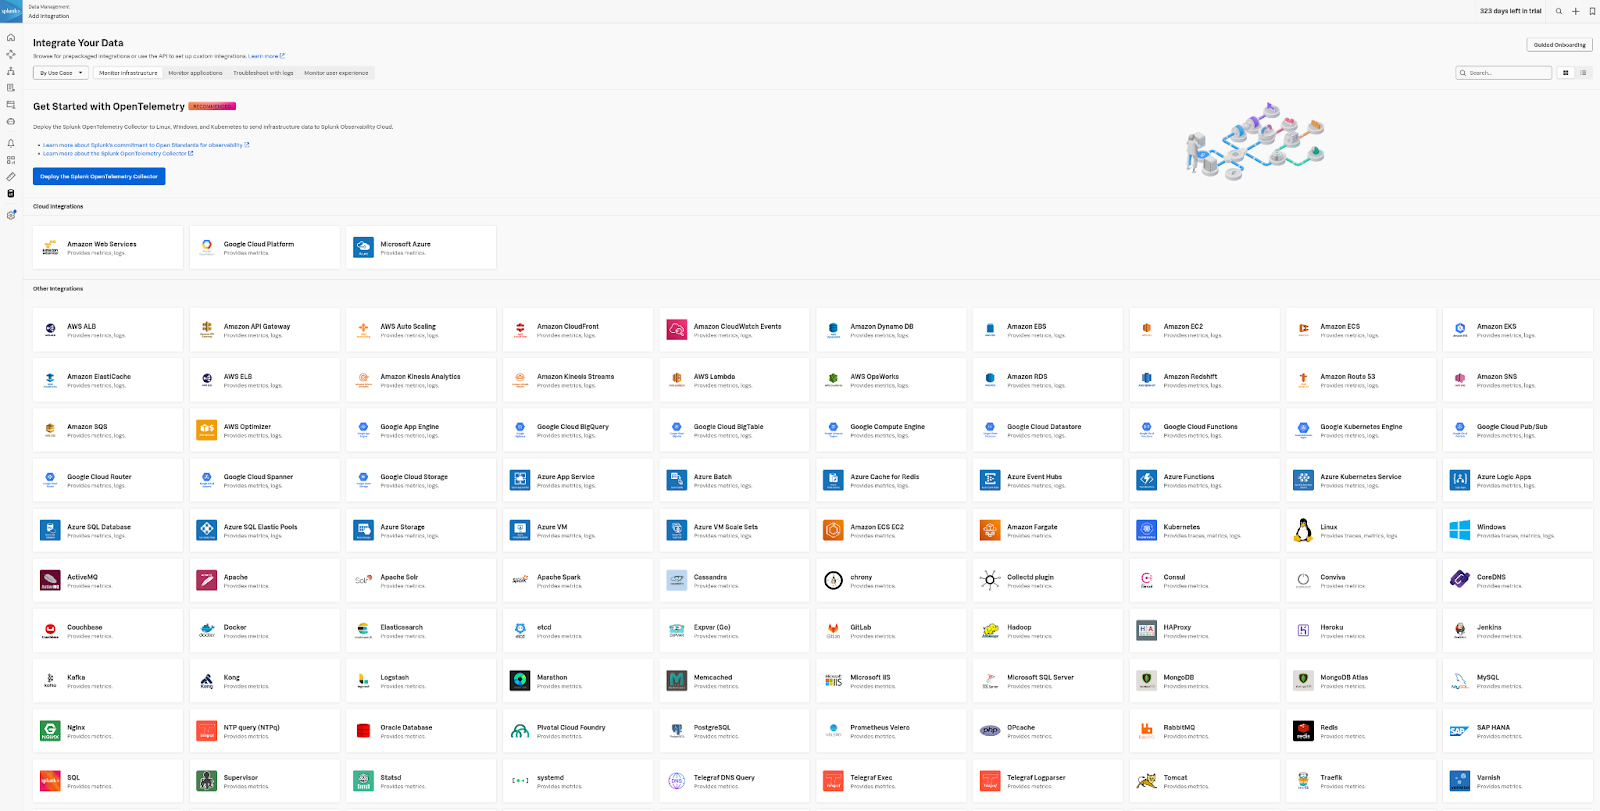
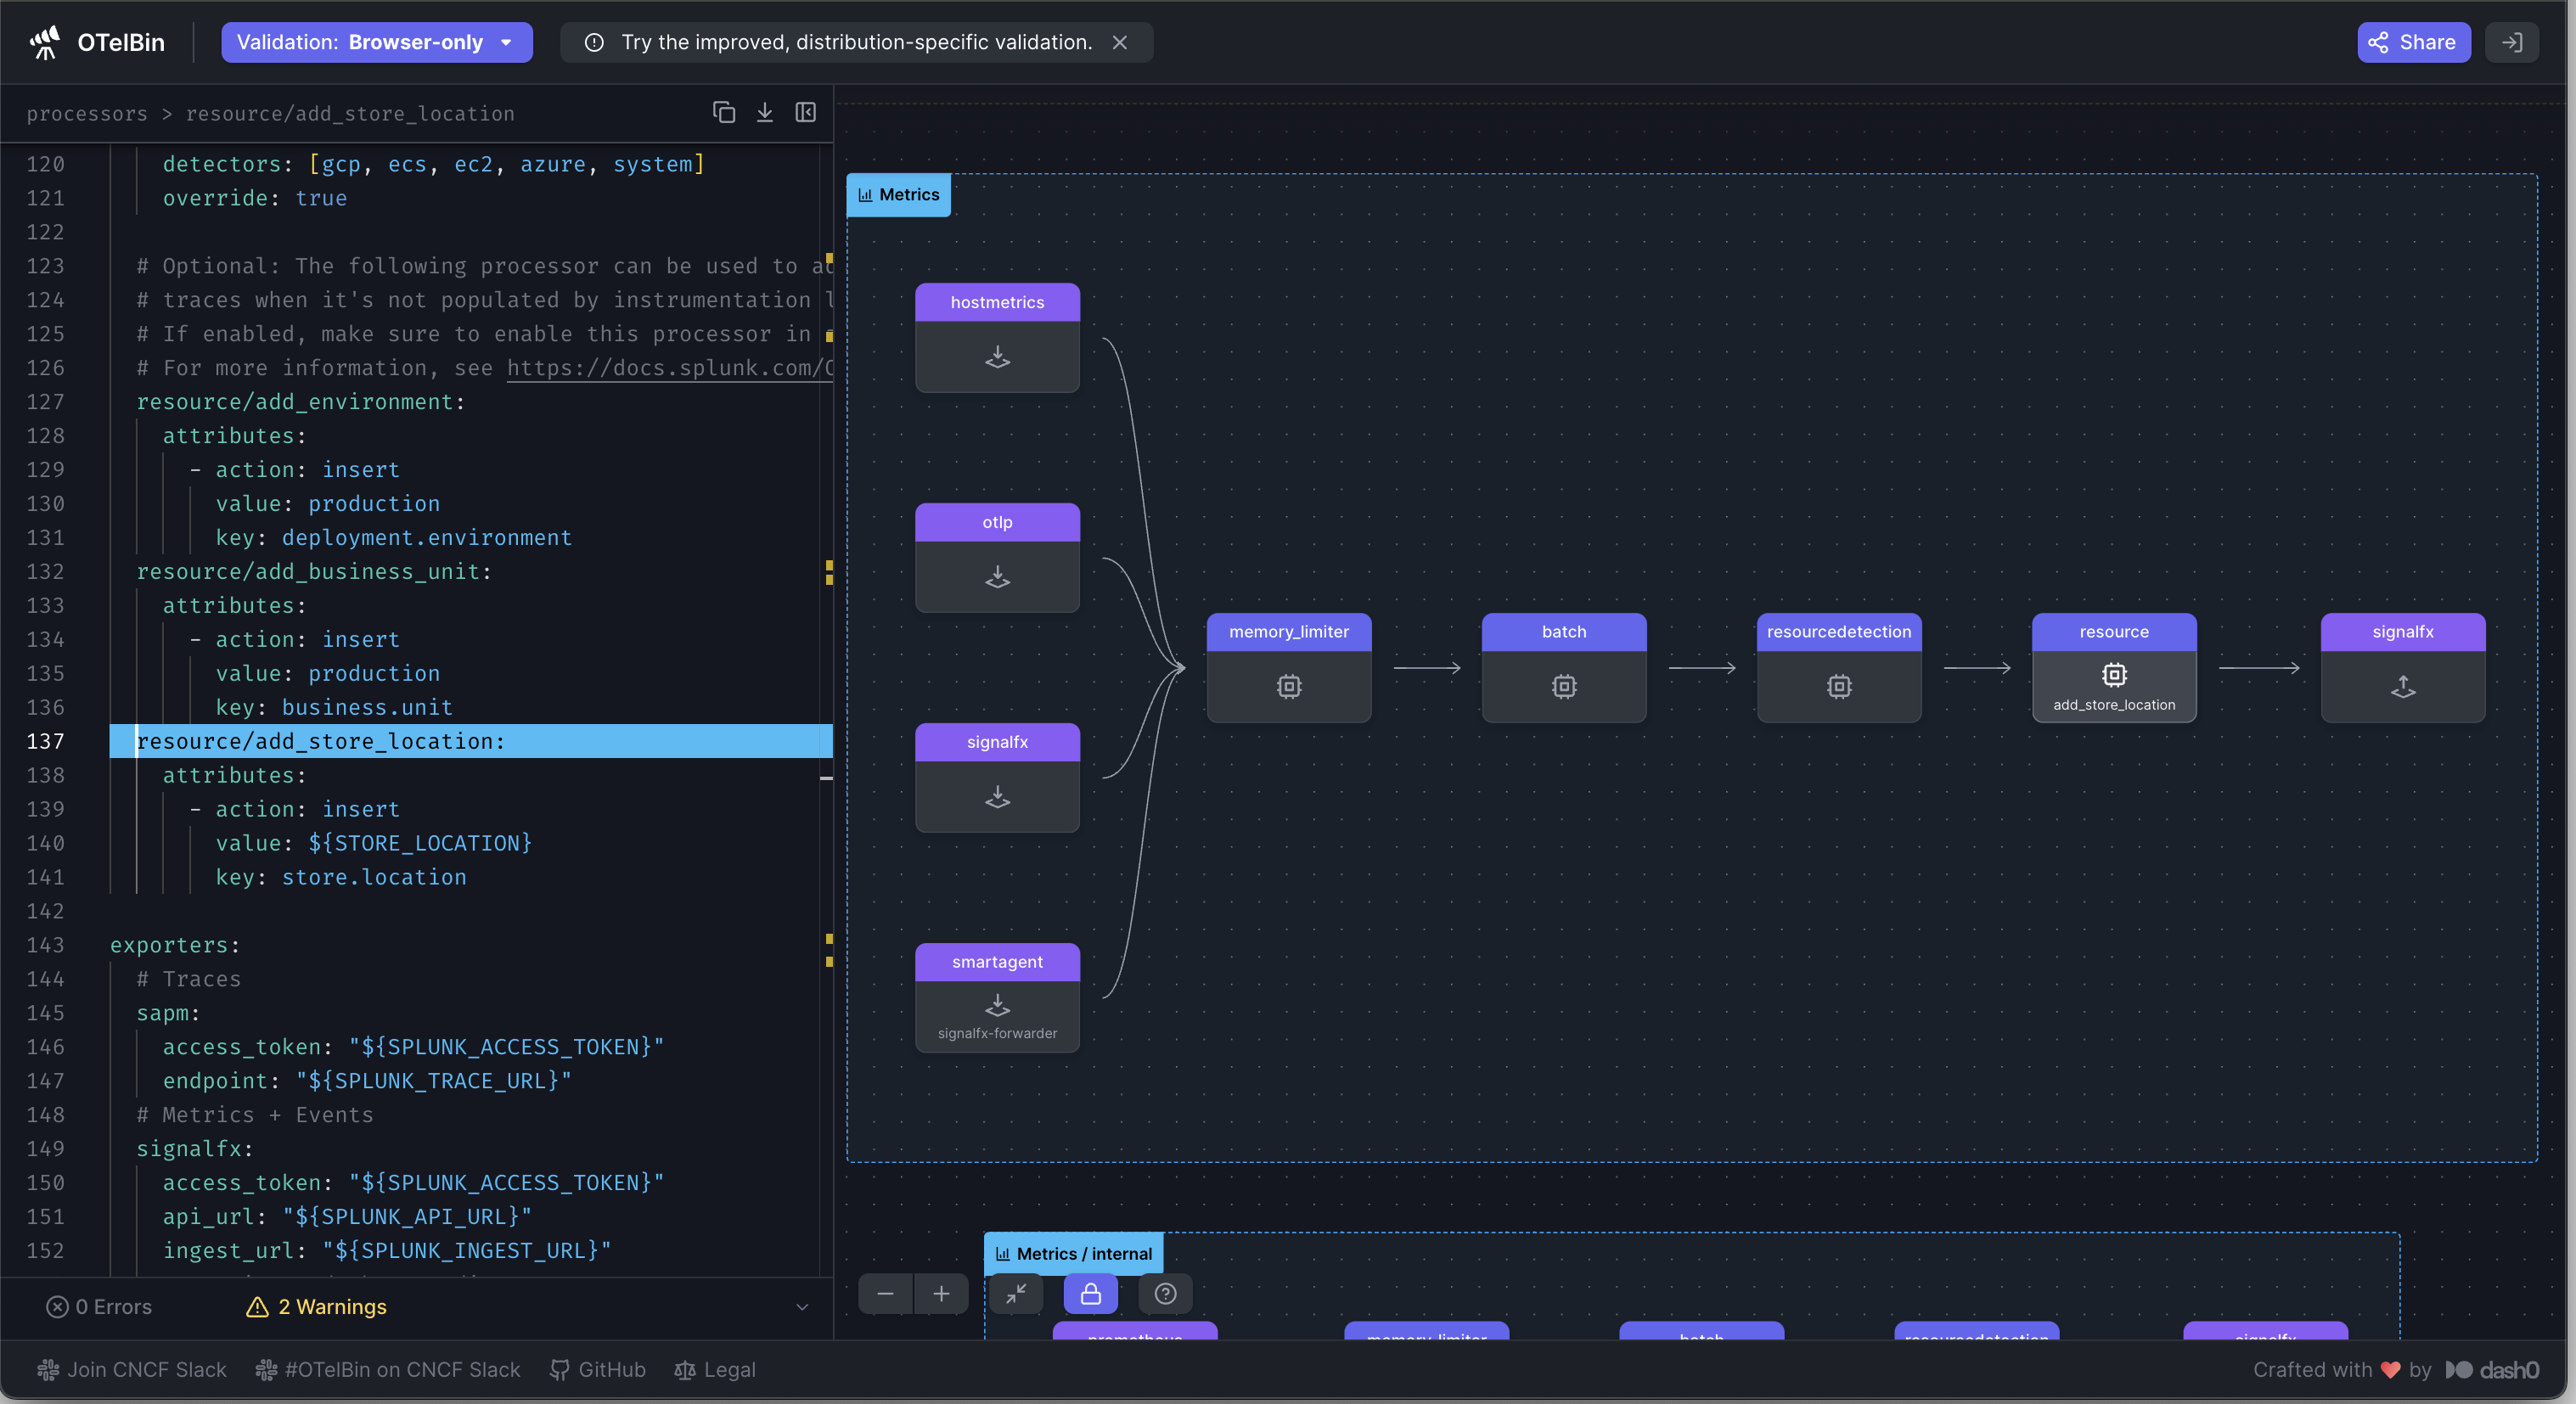
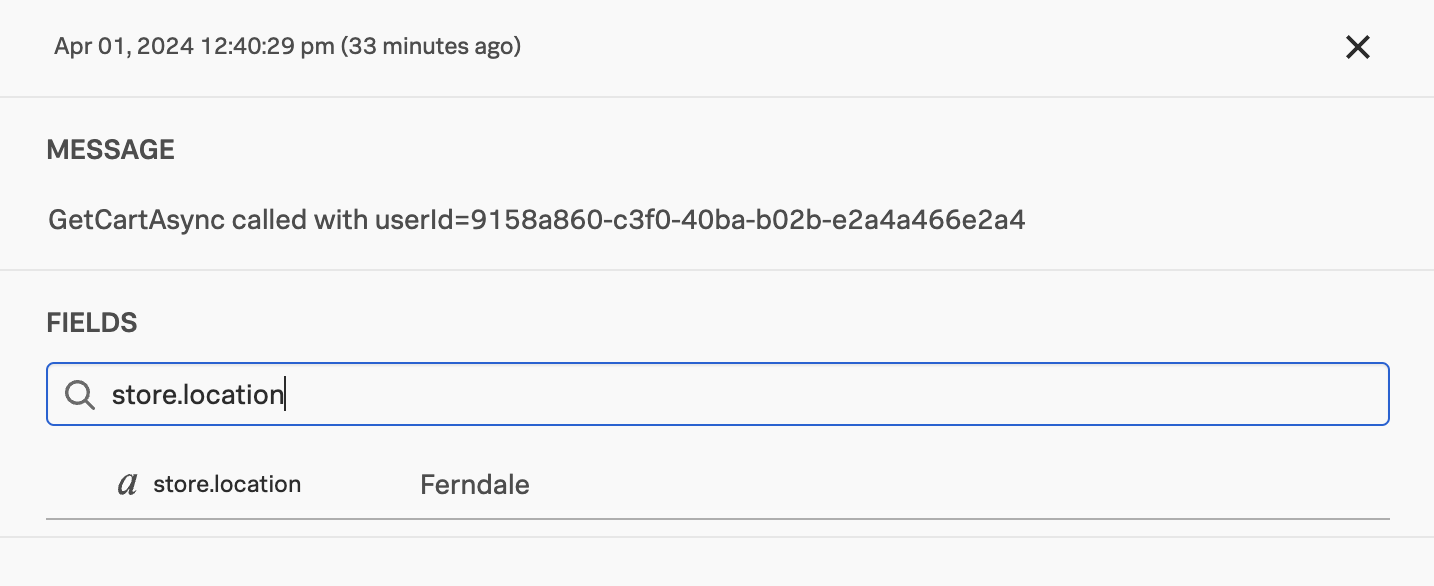
  • Standardize Data Collection and Tags: Centralized monitoring with a single, open-source agent to apply uniform naming standards and ensure metadata for visibility. Optimize data collection and use a monitoring-as-code approach for consistent collection and tagging.
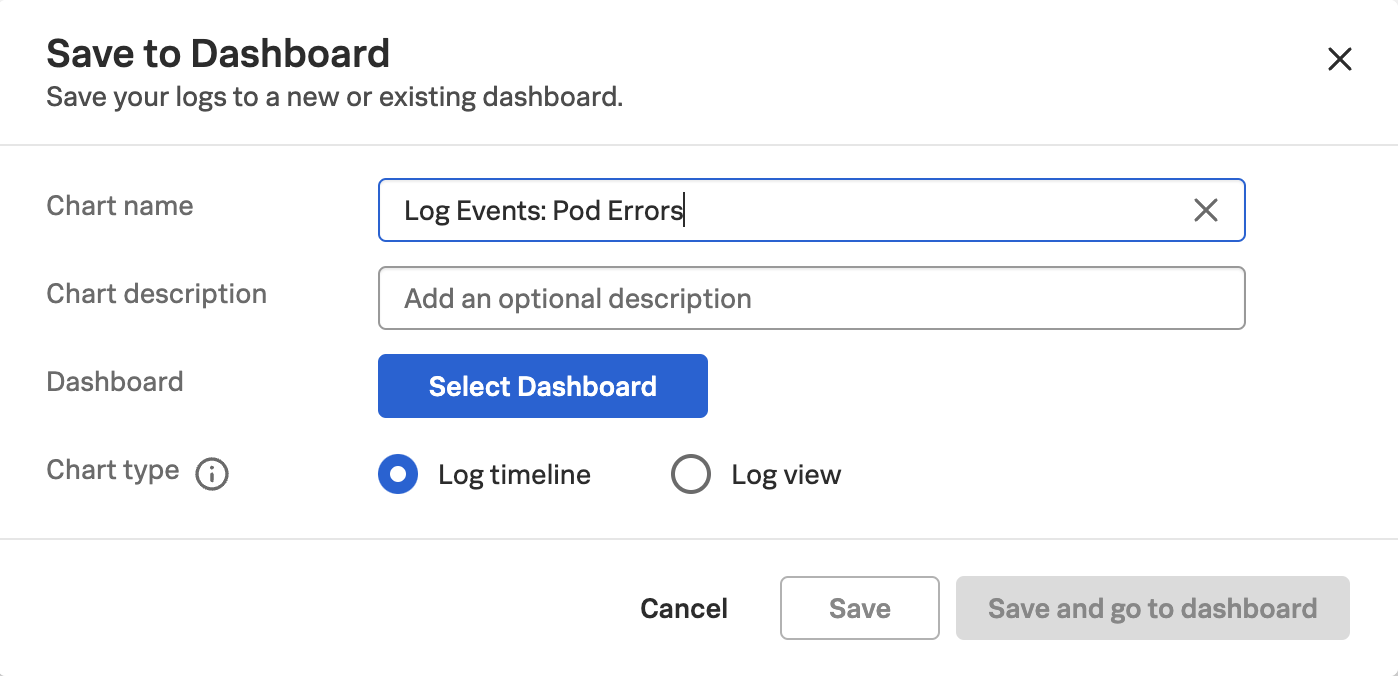
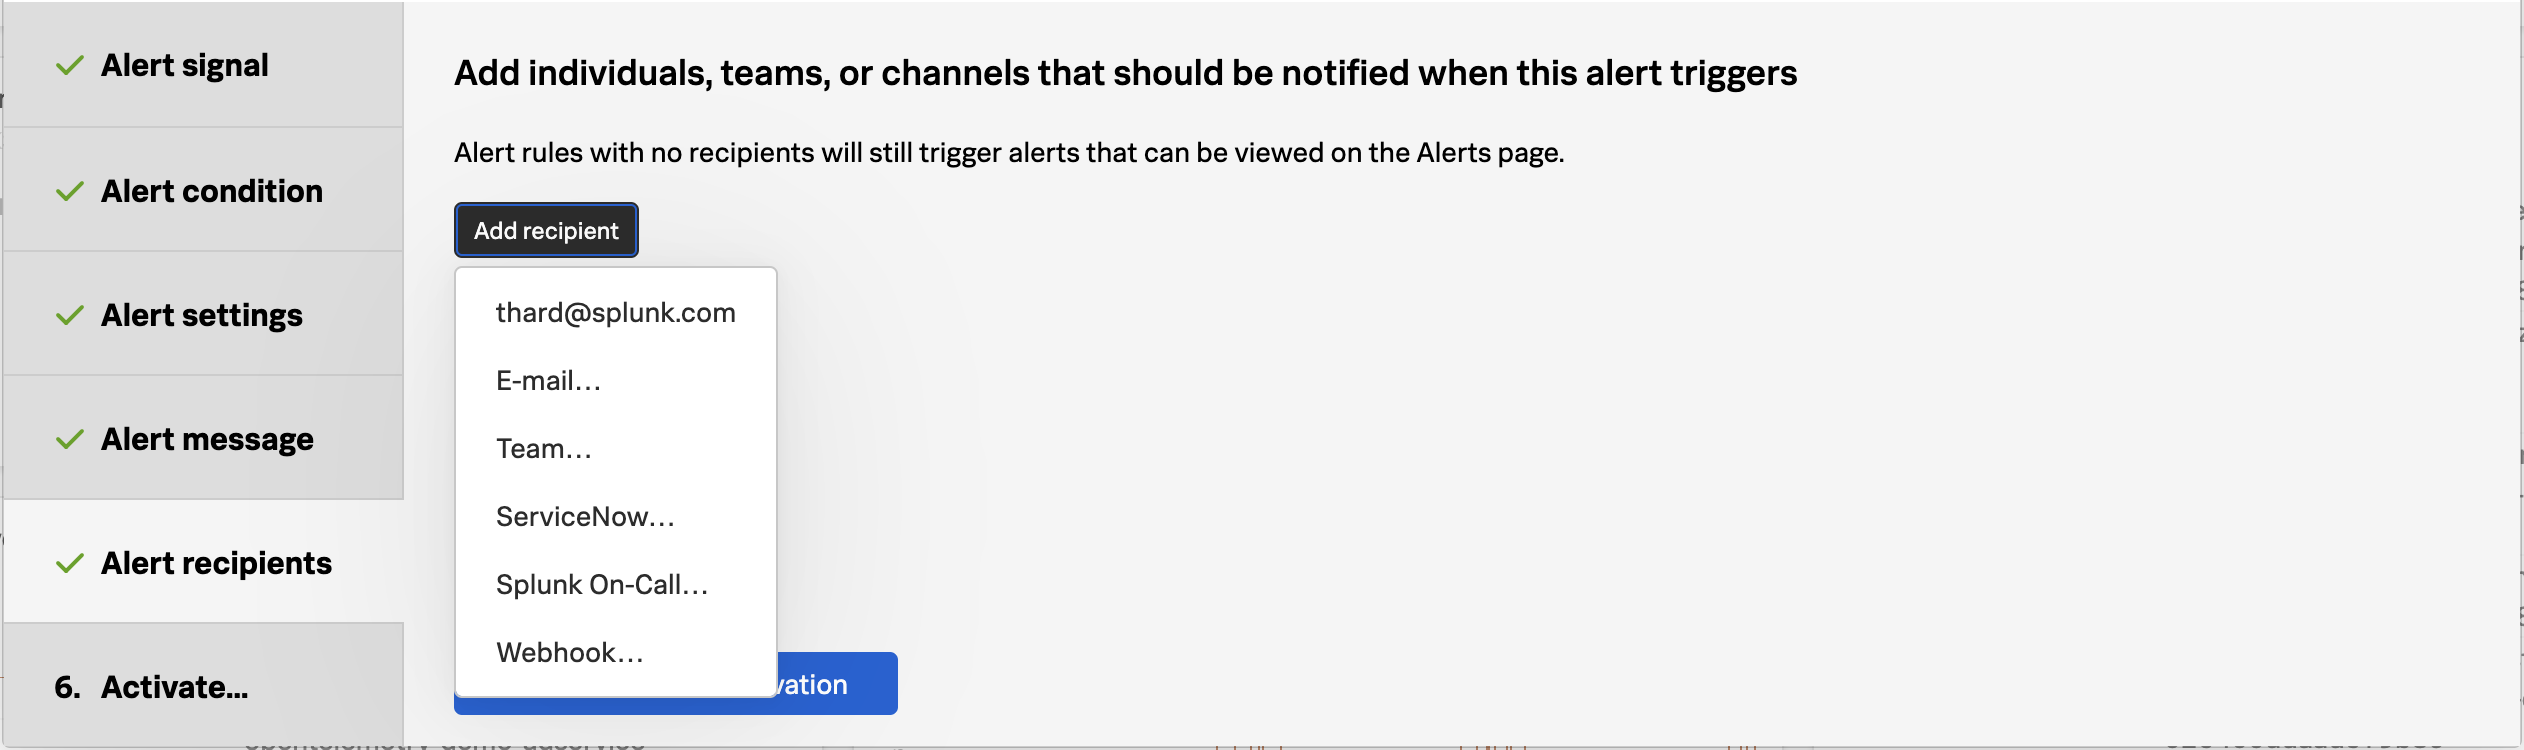
  • Reuse Content Across Teams: Streamline new IT infrastructure onboarding and user management with templates and automation. Utilize out-of-the-box dashboards, alerts, and self-service tools to enable content reuse, ensuring uniform monitoring and reducing manual effort.
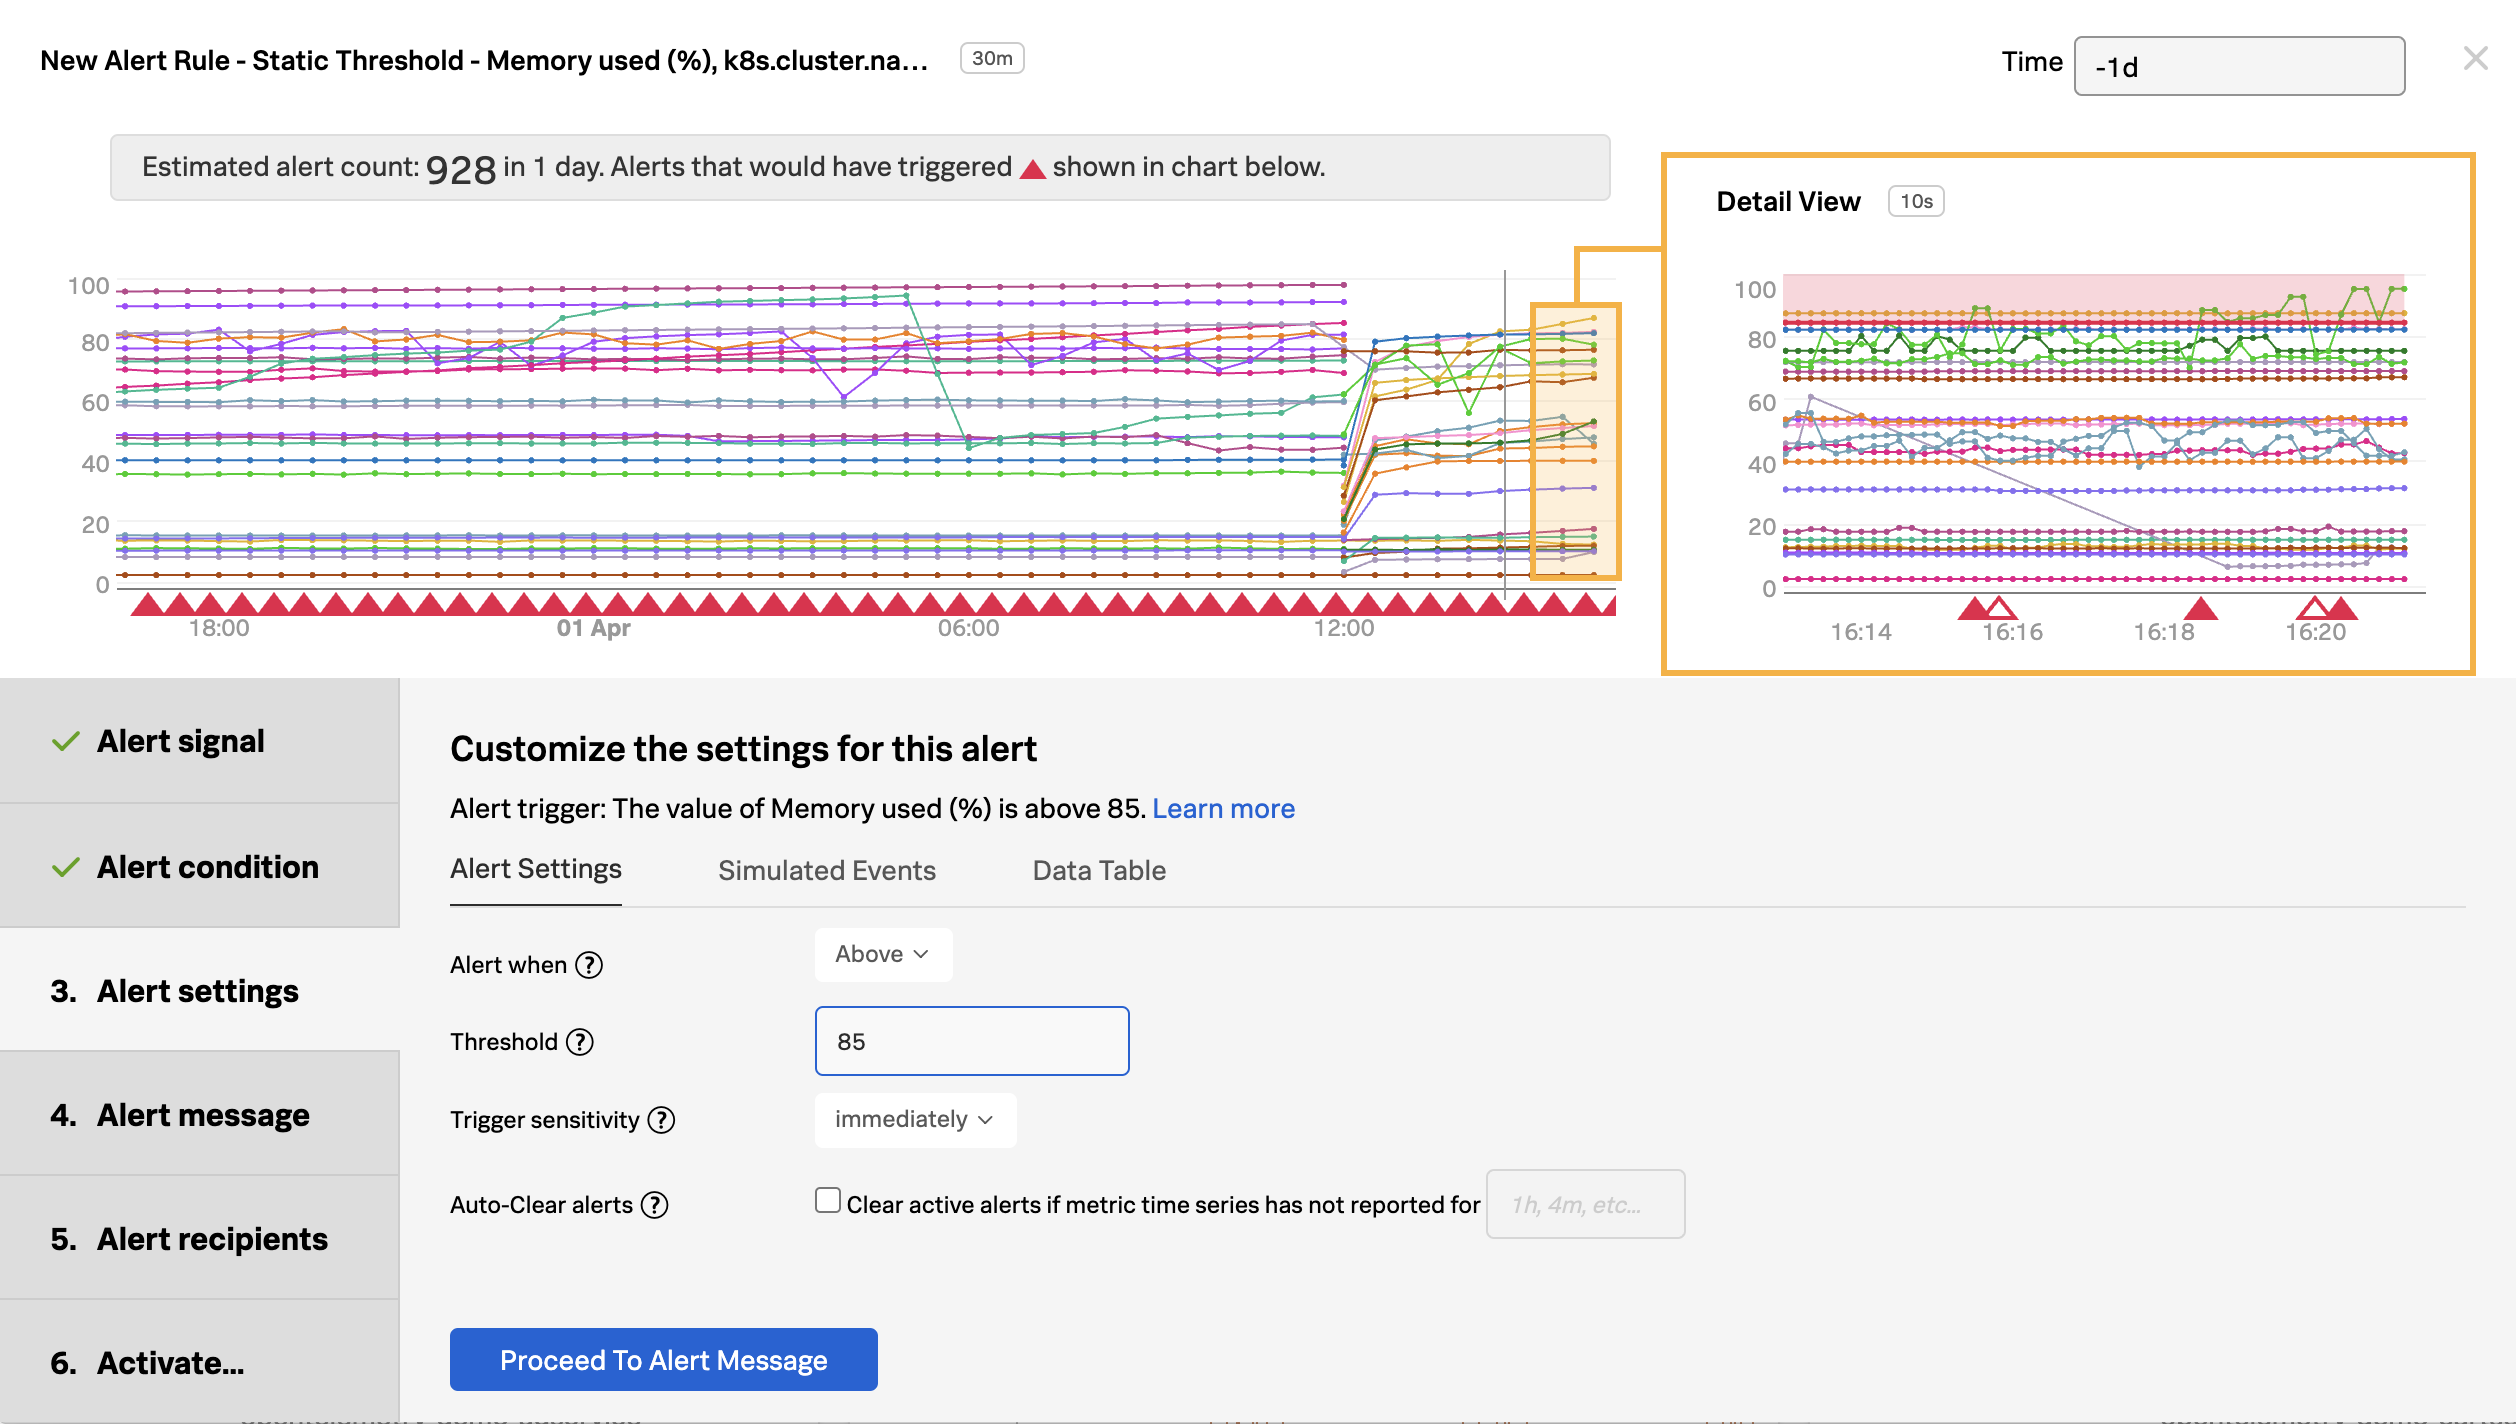
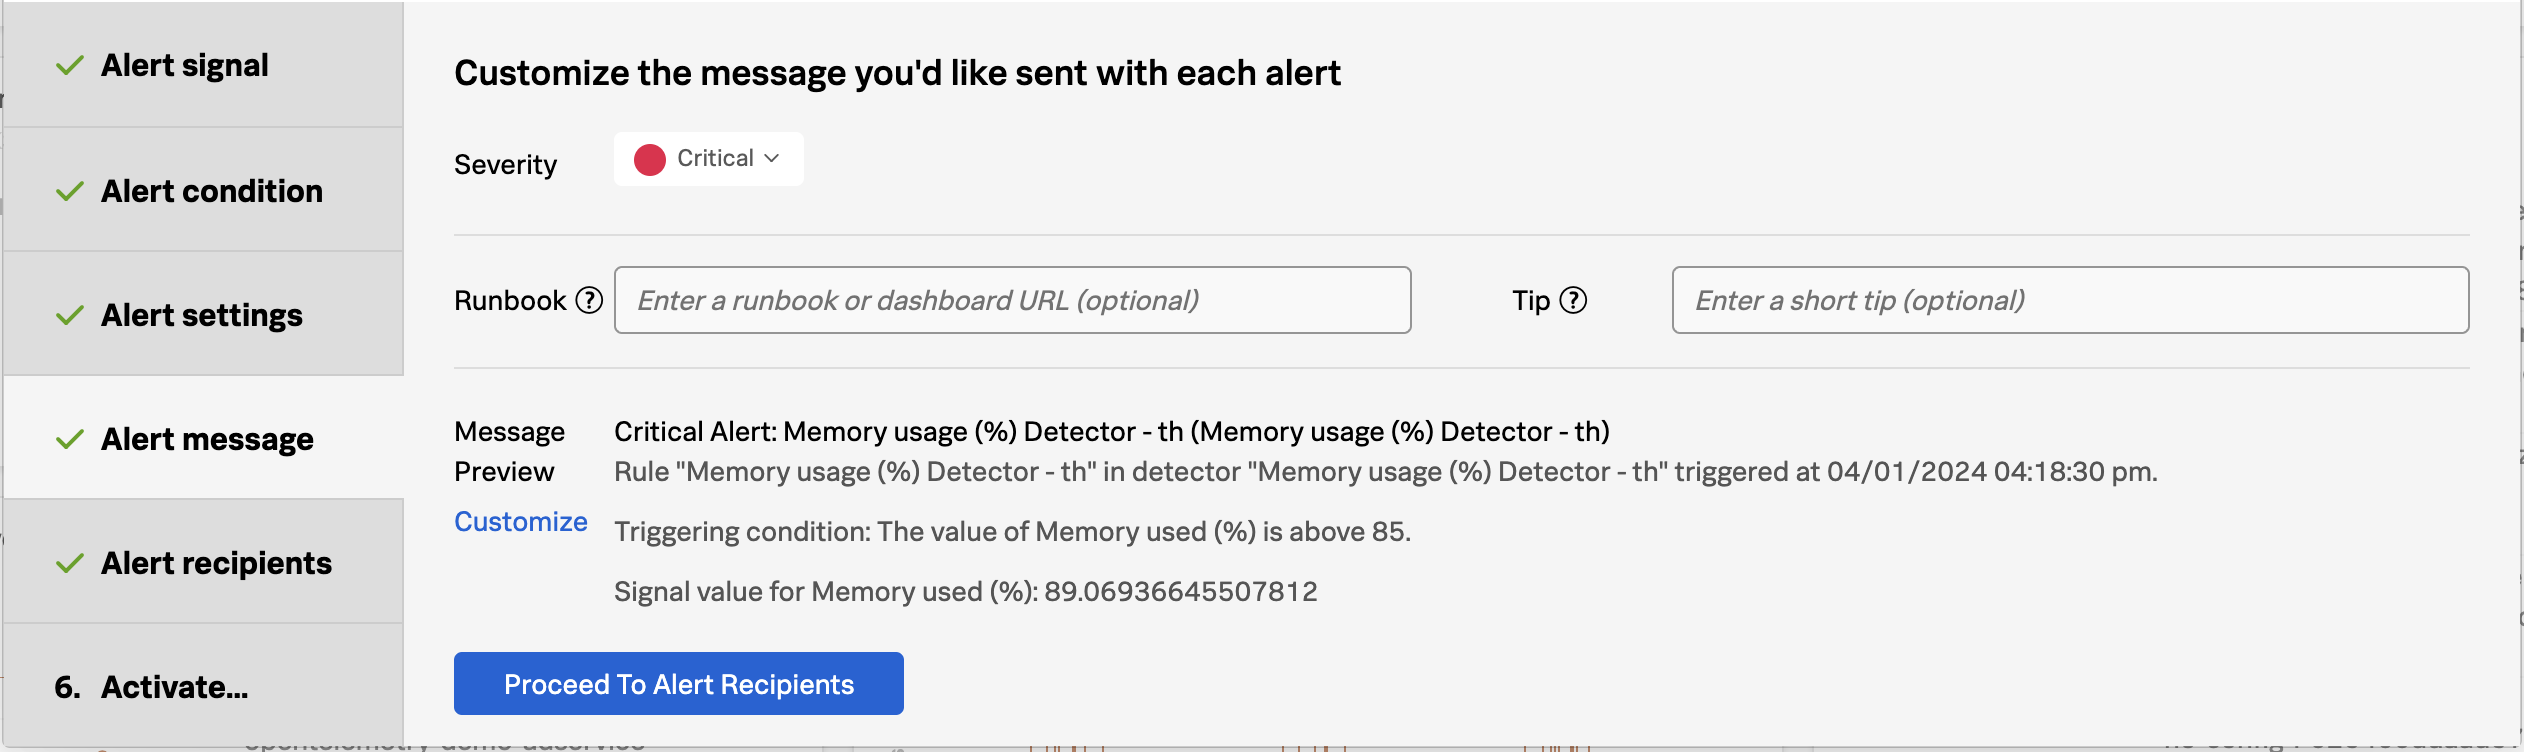
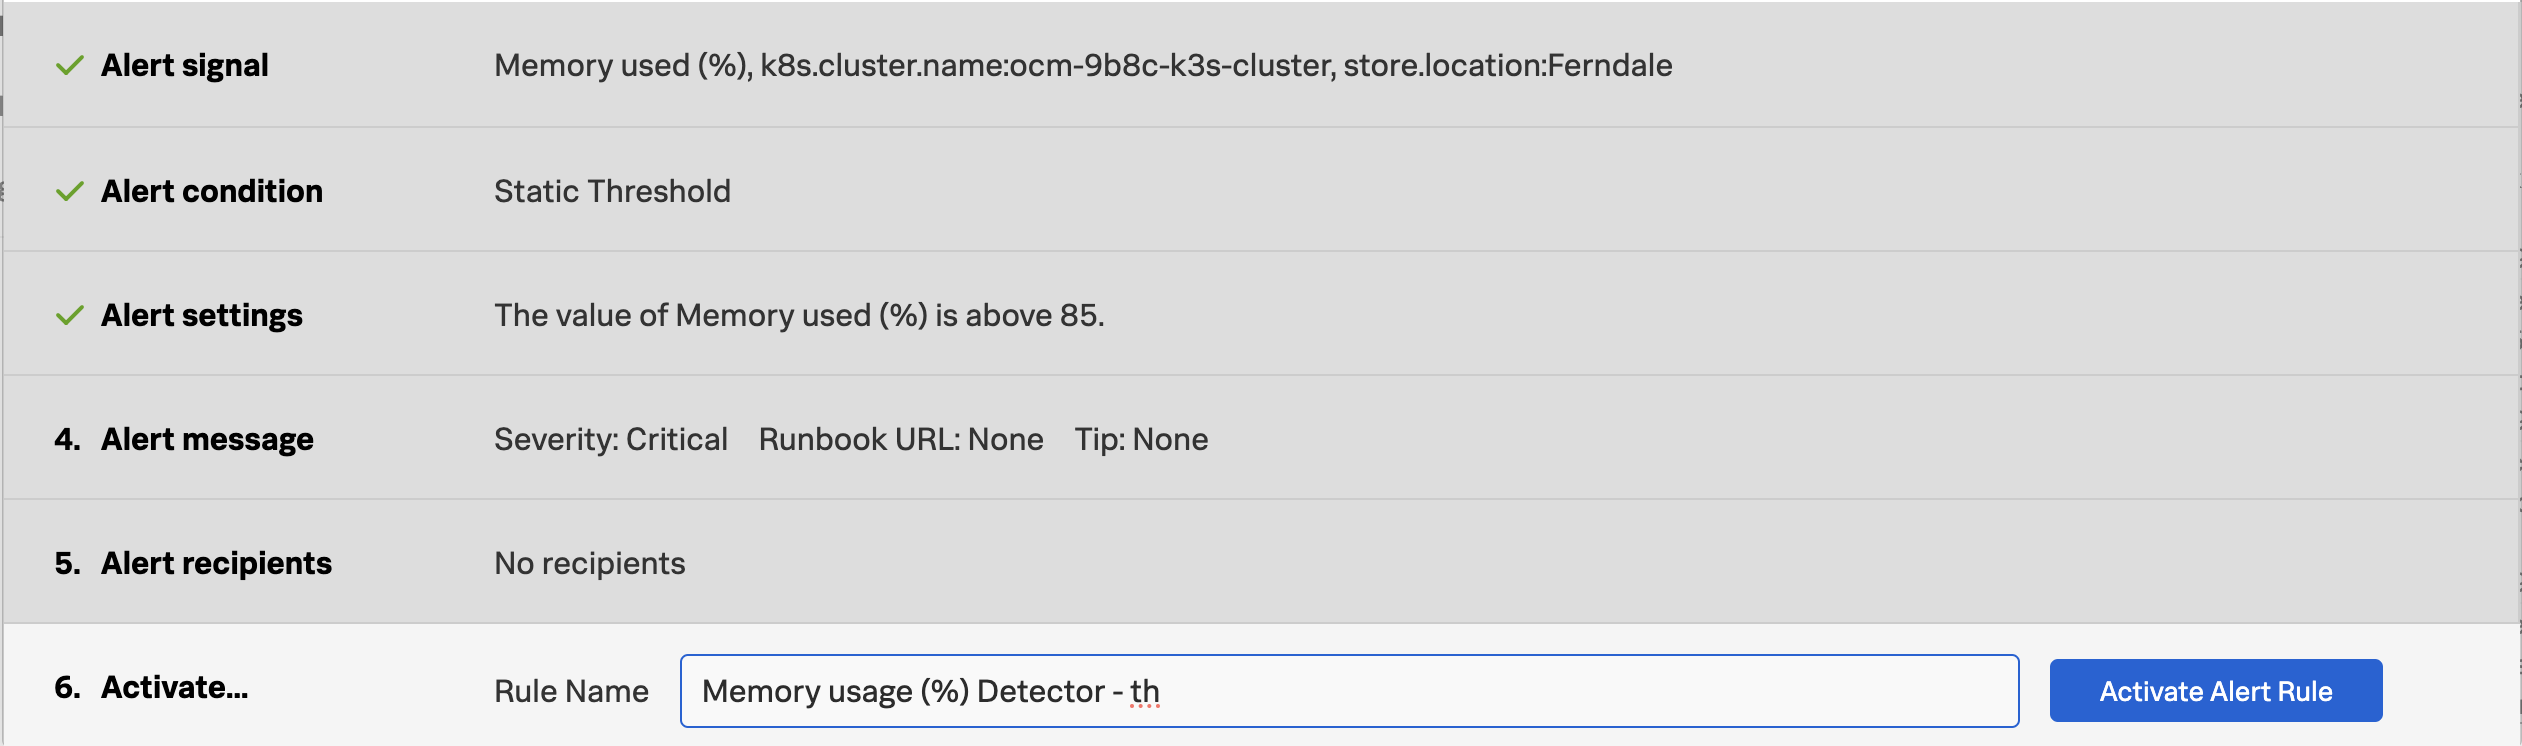
  • Improve Timeliness of Alerts: Utilize highly performant open source data collection, combined with real-time streaming-based data analytics and alerting, to enhance the timeliness of notifications. Automatically configured alerts for common problem patterns (AutoDetect) and minimal yet effective monitoring dashboards and alerts will ensure rapid response to emerging issues, minimizing potential disruptions.
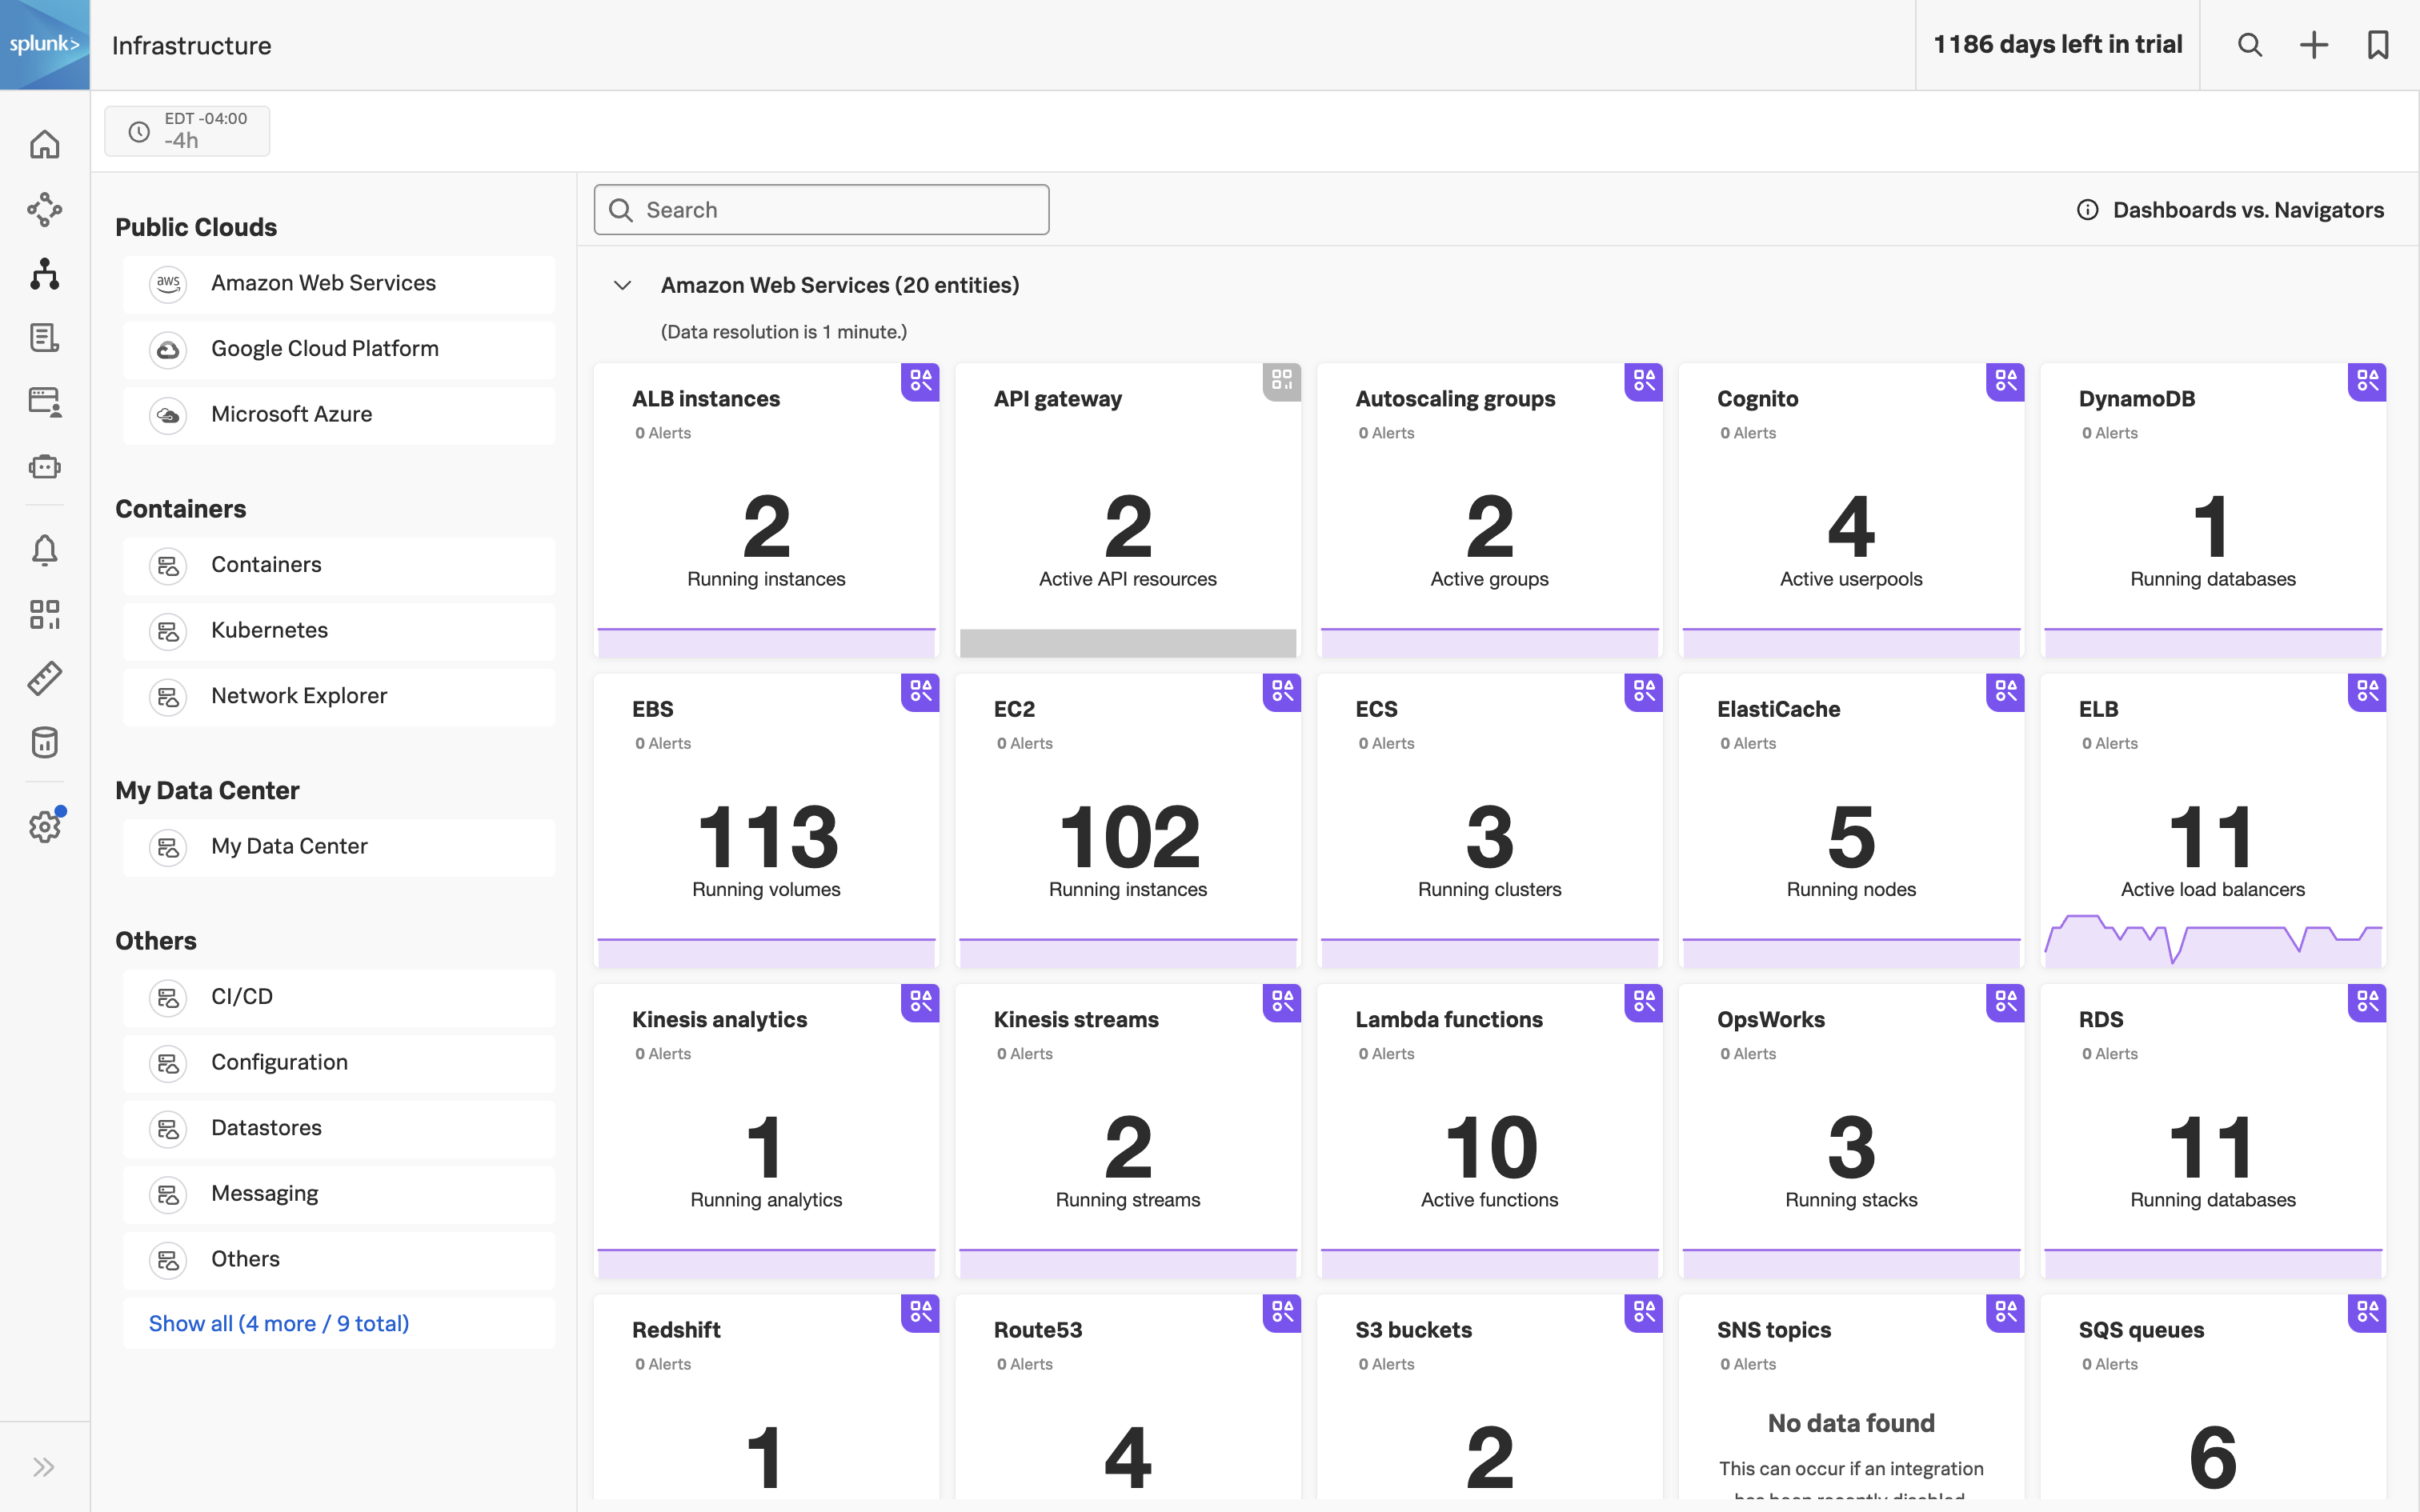
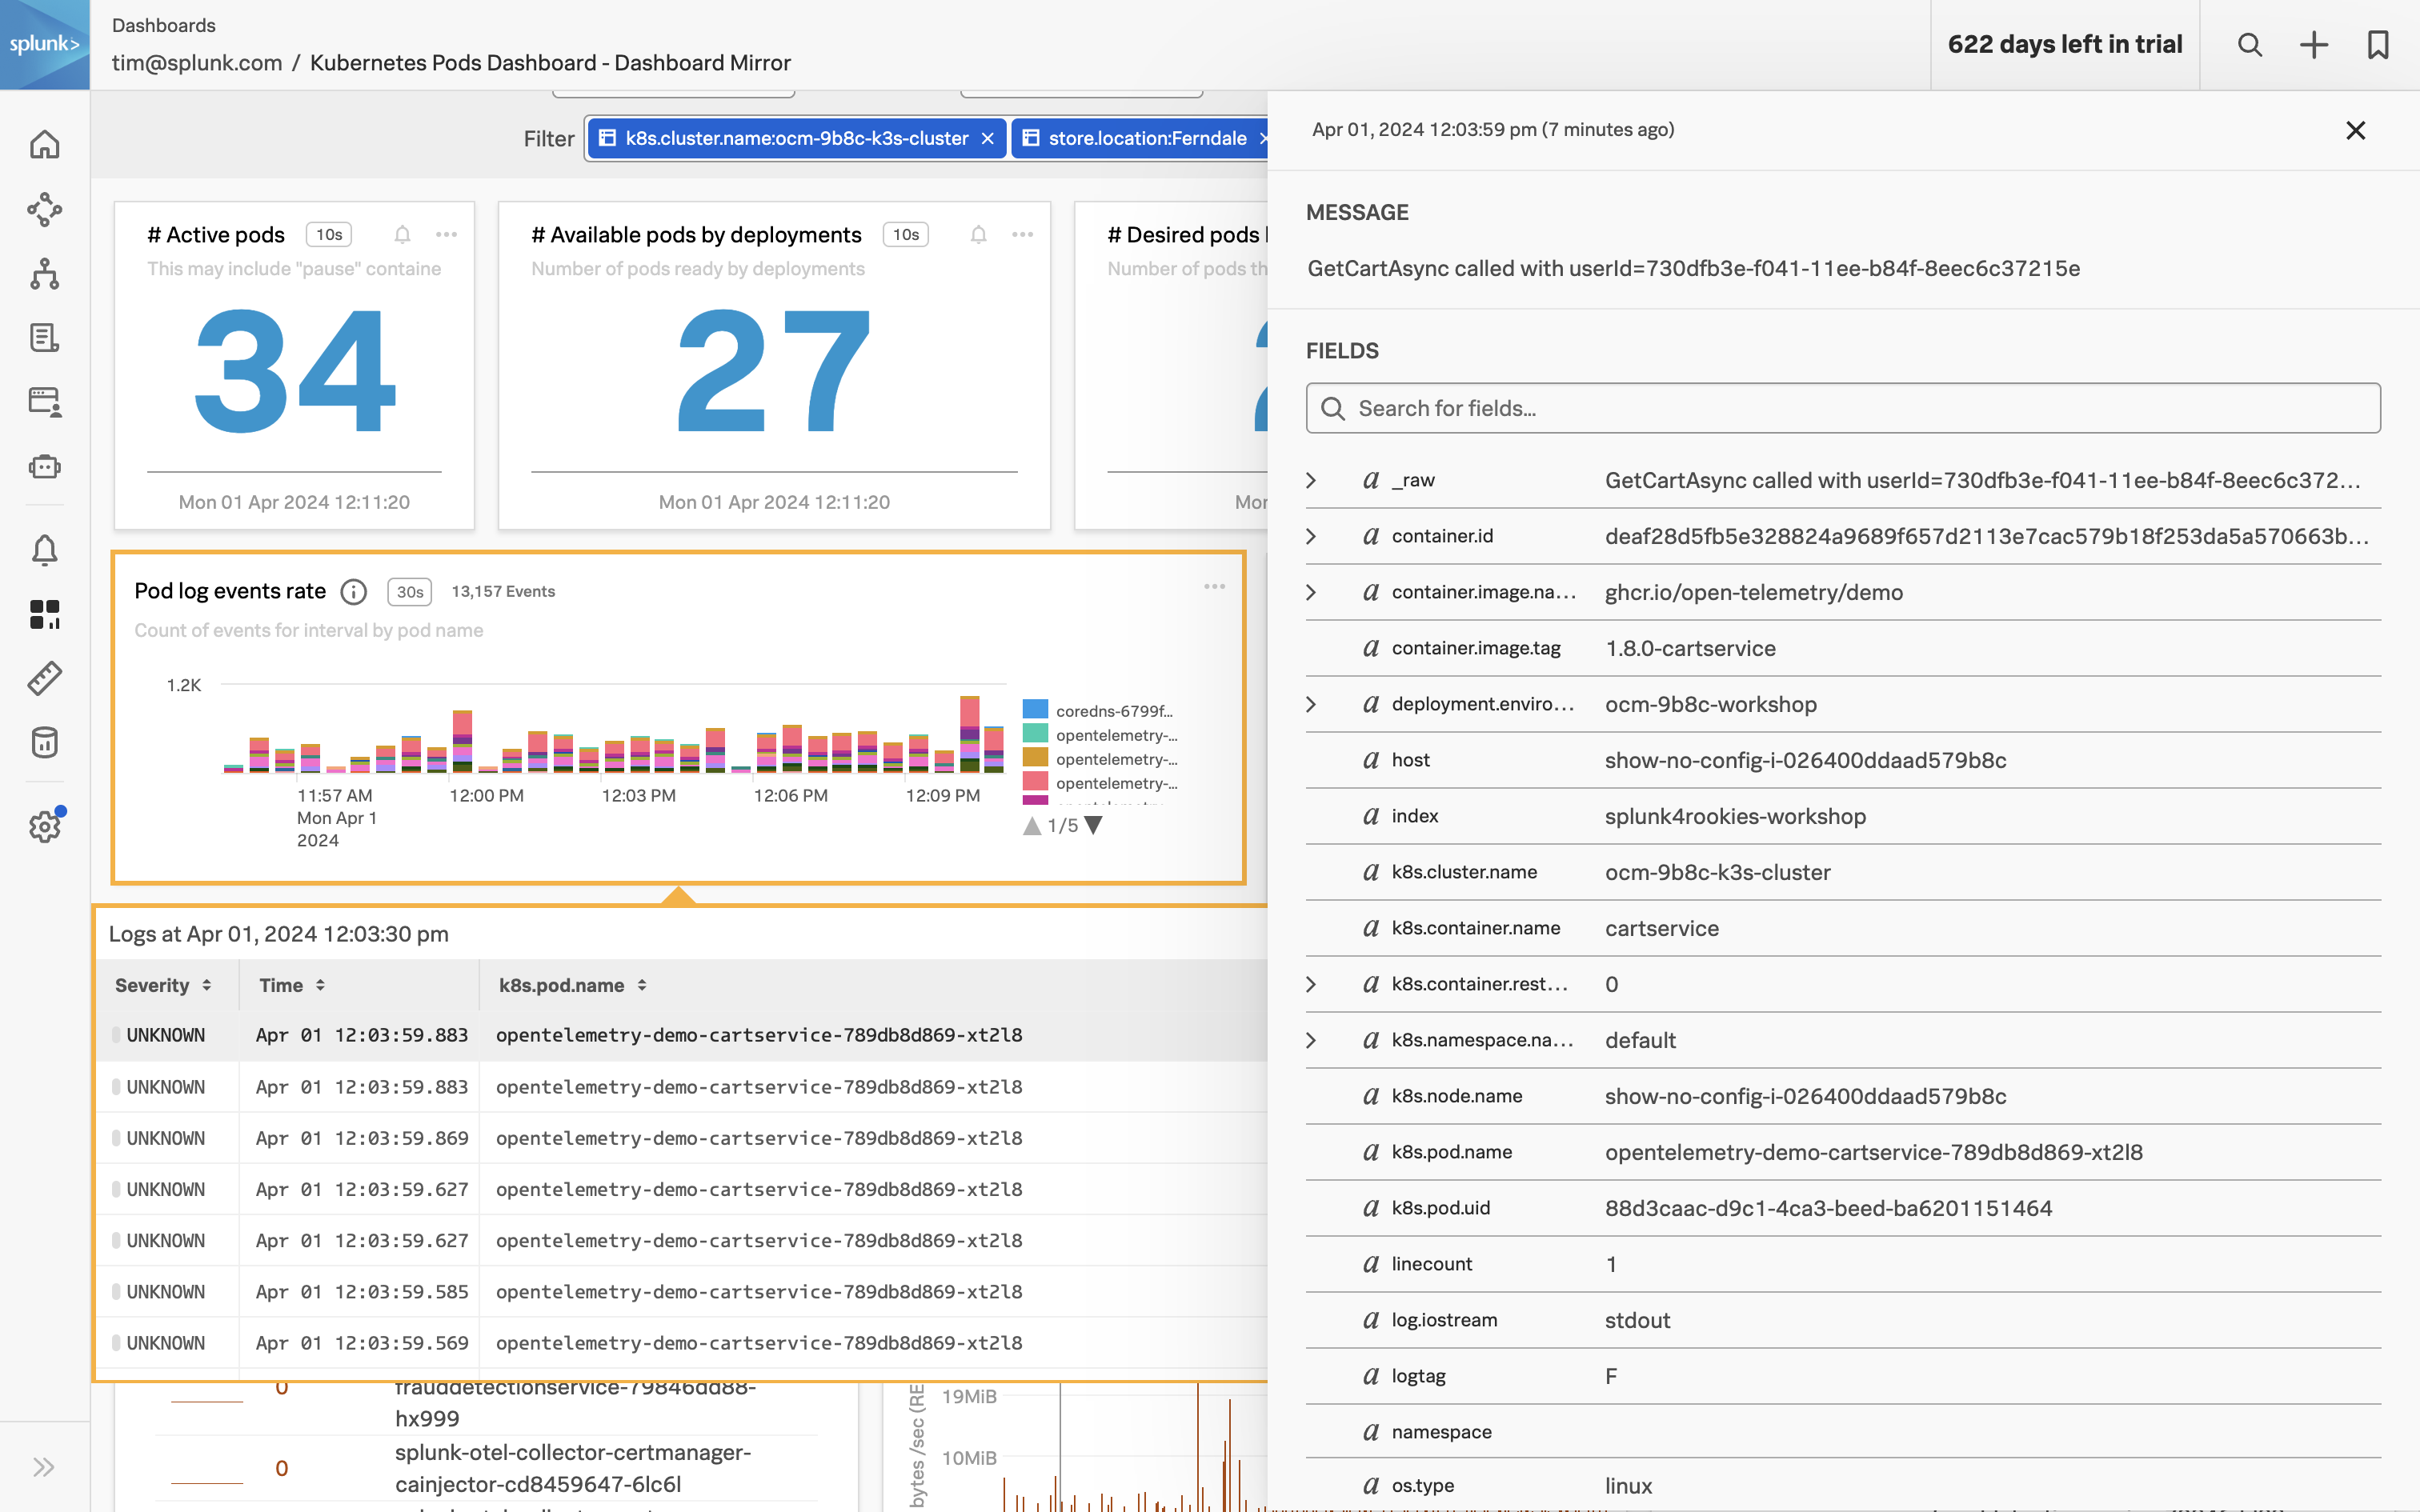
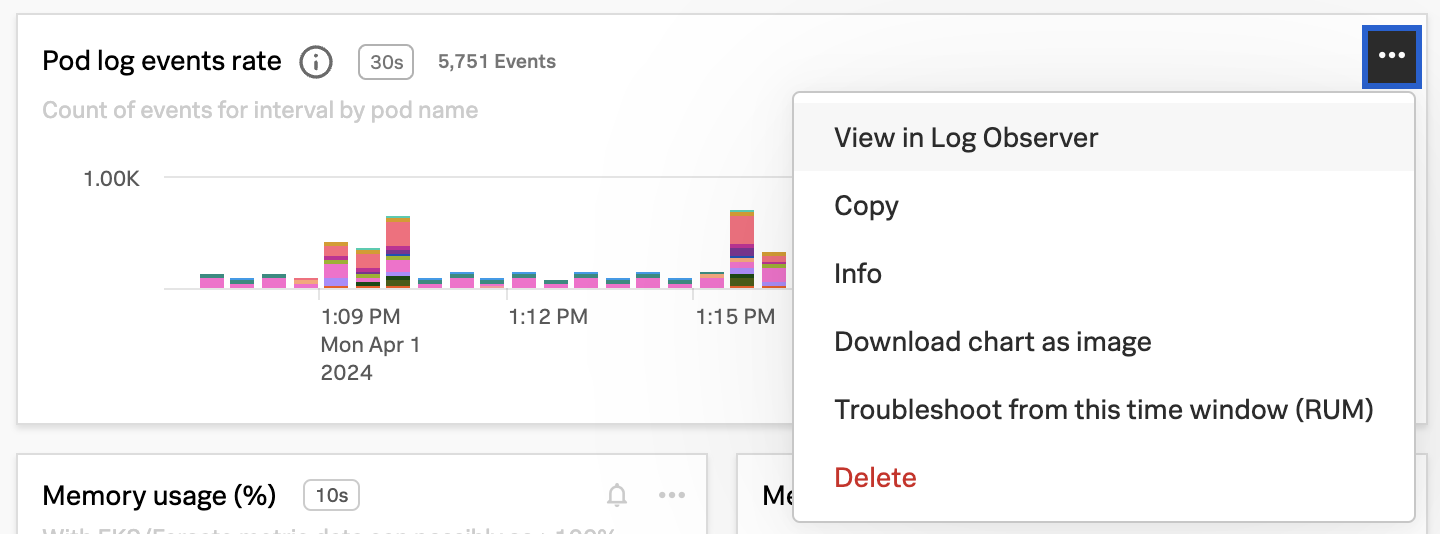
  • Correlate Infrastructure Metrics and Logs: Achieve full monitoring coverage of all IT infrastructure by enabling seamless correlation between infrastructure metrics and logs. High-performing data visualization and a single source of truth for data, dashboards, and alerts will simplify the correlation process, allowing for more effective troubleshooting and analysis of the IT environment.

In this workshop, we’ll explore:

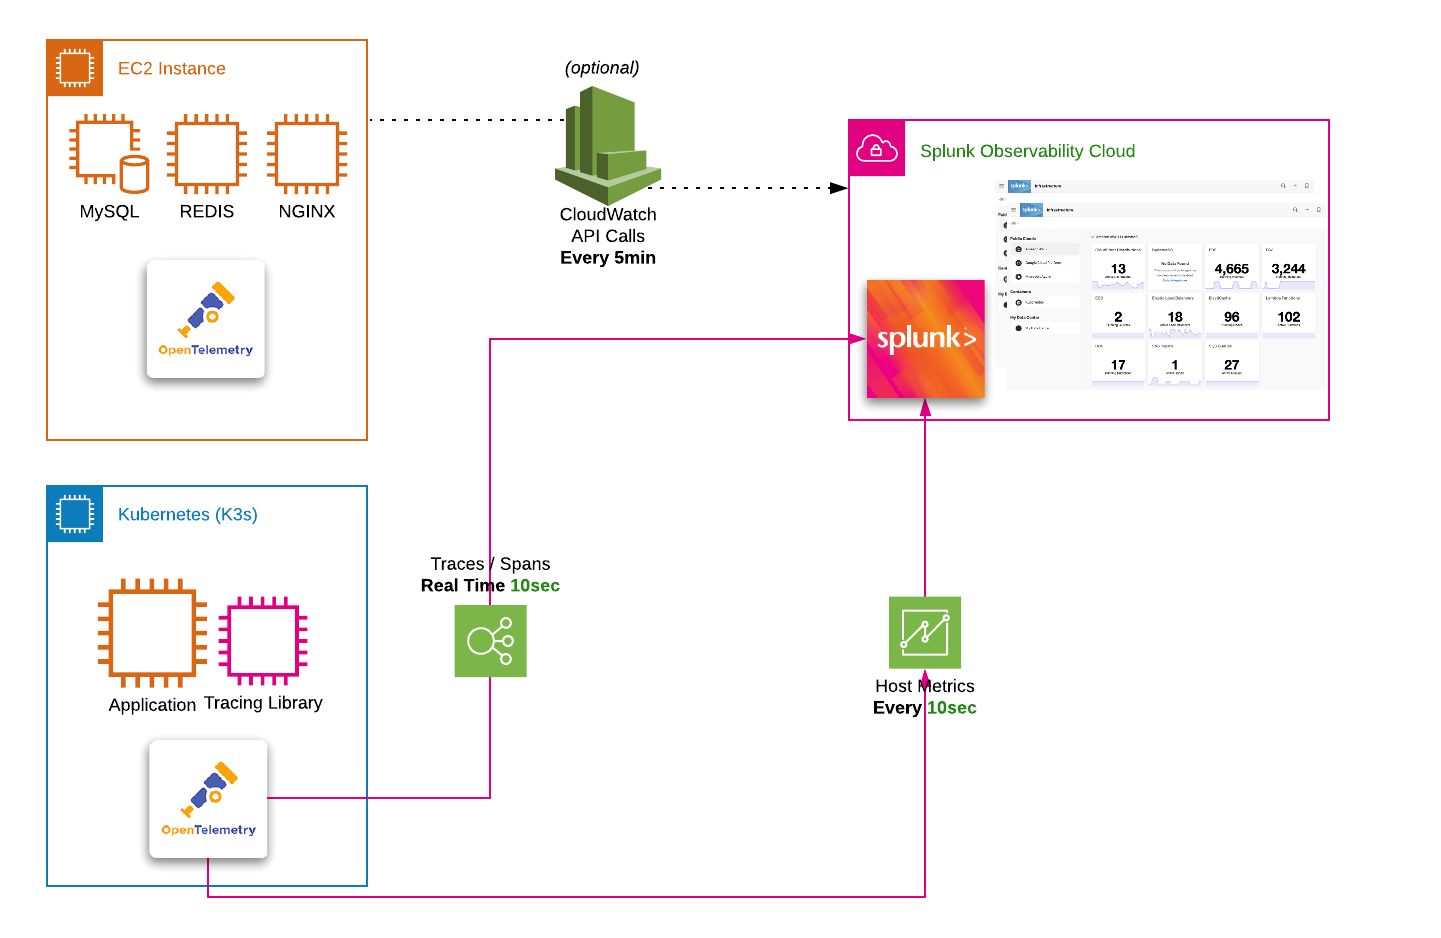
  • How to standardize data collection and tags using OpenTelemetry.
  • How to reuse content across teams.
  • How to improve timelines of alerts.
  • How to correlate infrastructure metrics and logs.
Tip

The easiest way to navigate through this workshop is by using:

  • the left/right arrows (< | >) on the top right of this page
  • the left (ā—€ļø) and right (ā–¶ļø) cursor keys on your keyboard
Last Modified Apr 3, 2024

Subsections of Optimize Cloud Monitoring

Getting Started

3 minutes   Author Tim Hard

During this technical Optimize Cloud Monitoring Workshop, you will build out an environment based on a lightweight Kubernetes1 cluster.

To simplify the workshop modules, a pre-configured AWS/EC2 instance is provided.

The instance is pre-configured with all the software required to deploy the Splunk OpenTelemetry Connector2 and the microservices-based OpenTelemetry Demo Application3 in Kubernetes which has been instrumented using OpenTelemetry to send metrics, traces, spans and logs.

This workshop will introduce you to the benefits of standardized data collection, how content can be re-used across teams, correlating metrics and logs, and creating detectors to fire alerts. By the end of these technical workshops, you will have a good understanding of some of the key features and capabilities of the Splunk Observability Cloud.

Here are the instructions on how to access your pre-configured AWS/EC2 instance

Splunk Architecture Splunk Architecture


  1. Kubernetes is a portable, extensible, open-source platform for managing containerized workloads and services, that facilitates both declarative configuration and automation. ↩︎

  2. OpenTelemetry Collector offers a vendor-agnostic implementation on how to receive, process and export telemetry data. In addition, it removes the need to run, operate and maintain multiple agents/collectors to support open-source telemetry data formats (e.g. Jaeger, Prometheus, etc.) sending to multiple open-source or commercial back-ends. ↩︎

  3. The OpenTelemetry Demo Application is a microservice-based distributed system intended to illustrate the implementation of OpenTelemetry in a near real-world environment. ↩︎

Last Modified Apr 2, 2024

Subsections of Getting Started

How to connect to your workshop environment

5 minutes   Author Tim Hard
  1. How to retrieve the IP address of the AWS/EC2 instance assigned to you.
  2. Connect to your instance using SSH, Putty1 or your web browser.
  3. Verify your connection to your AWS/EC2 cloud instance.
  4. Using Putty (Optional)
  5. Using Multipass (Optional)

1. AWS/EC2 IP Address

In preparation for the workshop, Splunk has prepared an Ubuntu Linux instance in AWS/EC2.

To get access to the instance that you will be using in the workshop please visit the URL to access the Google Sheet provided by the workshop leader.

Search for your AWS/EC2 instance by looking for your first and last name, as provided during registration for this workshop.

attendee spreadsheet attendee spreadsheet

Find your allocated IP address, SSH command (for Mac OS, Linux and the latest Windows versions) and password to enable you to connect to your workshop instance.

It also has the Browser Access URL that you can use in case you cannot connect via SSH or Putty - see EC2 access via Web browser

Important

Please use SSH or Putty to gain access to your EC2 instance if possible and make a note of the IP address as you will need this during the workshop.

2. SSH (Mac OS/Linux)

Most attendees will be able to connect to the workshop by using SSH from their Mac or Linux device, or on Windows 10 and above.

To use SSH, open a terminal on your system and type ssh splunk@x.x.x.x (replacing x.x.x.x with the IP address found in Step #1).

ssh login ssh login

When prompted Are you sure you want to continue connecting (yes/no/[fingerprint])? please type yes.

ssh password ssh password

Enter the password provided in the Google Sheet from Step #1.

Upon successful login, you will be presented with the Splunk logo and the Linux prompt.

ssh connected ssh connected

3. SSH (Windows 10 and above)

The procedure described above is the same on Windows 10, and the commands can be executed either in the Windows Command Prompt or PowerShell. However, Windows regards its SSH Client as an “optional feature”, which might need to be enabled.

You can verify if SSH is enabled by simply executing ssh

If you are shown a help text on how to use the SSH command (like shown in the screenshot below), you are all set.

Windows SSH enabled Windows SSH enabled

If the result of executing the command looks something like the screenshot below, you want to enable the “OpenSSH Client” feature manually.

Windows SSH disabled Windows SSH disabled

To do that, open the “Settings” menu, and click on “Apps”. While in the “Apps & features” section, click on “Optional features”.

Windows Apps Settings Windows Apps Settings

Here, you are presented with a list of installed features. On the top, you see a button with a plus icon to “Add a feature”. Click it. In the search input field, type “OpenSSH”, and find a feature called “OpenSSH Client”, or respectively, “OpenSSH Client (Beta)”, click on it, and click the “Install”-button.

Windows Enable OpenSSH Client Windows Enable OpenSSH Client

Now you are set! In case you are not able to access the provided instance despite enabling the OpenSSH feature, please do not shy away from reaching out to the course instructor, either via chat or directly.

At this point you are ready to continue and start the workshop


4. Putty (For Windows Versions prior to Windows 10)

If you do not have SSH pre-installed or if you are on a Windows system, the best option is to install Putty which you can find here.

Important

If you cannot install Putty, please go to Web Browser (All).

Open Putty and enter in the Host Name (or IP address) field the IP address provided in the Google Sheet.

You can optionally save your settings by providing a name and pressing Save.

putty-2 putty-2

To then login to your instance click on the Open button as shown above.

If this is the first time connecting to your AWS/EC2 workshop instance, you will be presented with a security dialogue, please click Yes.

putty-3 putty-3

Once connected, login in as splunk and the password is the one provided in the Google Sheet.

Once you are connected successfully you should see a screen similar to the one below:

putty-4 putty-4

At this point, you are ready to continue and start the workshop


5. Web Browser (All)

If you are blocked from using SSH (Port 22) or unable to install Putty you may be able to connect to the workshop instance by using a web browser.

Note

This assumes that access to port 6501 is not restricted by your company’s firewall.

Open your web browser and type http://x.x.x.x:6501 (where X.X.X.X is the IP address from the Google Sheet).

http-6501 http-6501

Once connected, login in as splunk and the password is the one provided in the Google Sheet.

http-connect http-connect

Once you are connected successfully you should see a screen similar to the one below:

web login web login

Unlike when you are using regular SSH, copy and paste does require a few extra steps to complete when using a browser session. This is due to cross browser restrictions.

When the workshop asks you to copy instructions into your terminal, please do the following:

Copy the instruction as normal, but when ready to paste it in the web terminal, choose Paste from the browser as show below:

web paste 1 web paste 1

This will open a dialogue box asking for the text to be pasted into the web terminal:

web paste 3 web paste 3

Paste the text in the text box as shown, then press OK to complete the copy and paste process.

Note

Unlike regular SSH connection, the web browser has a 60-second time out, and you will be disconnected, and a Connect button will be shown in the center of the web terminal.

Simply click the Connect button and you will be reconnected and will be able to continue.

web reconnect web reconnect

At this point, you are ready to continue and start the workshop.


6. Multipass (All)

If you are unable to access AWS but want to install software locally, follow the instructions for using Multipass.

Last Modified Apr 4, 2024

Deploy OpenTelemetry Demo Applciation

10 minutes   Author Tim Hard

Introduction

For this workshop, we’ll be using the OpenTelemetry Demo Application running in Kubernetes. This application is for an online retailer and includes more than a dozen services written in many different languages. While metrics, traces, and logs are being collected from this application, this workshop is primarily focused on how Splunk Observability Cloud can be used to more efficiently monitor infrastructure.

Pre-requisites

Initial Steps

The initial setup can be completed by executing the following steps on the command line of your EC2 instance.

cd ~/workshop/optimize-cloud-monitoring && \
./deploy-application.sh

You’ll be asked to enter your favorite city. This will be used in the OpenTelemetry Collector configuration as a custom tag to show how easy it is to add additional context to your observability data.

Note

Custom tagging will be covered in more detail in the Standardize Data Collection section of this workshop.

Enter Favorite City Enter Favorite City

Your application should now be running and sending data to Splunk Observability Cloud. You’ll dig into the data in the next section.

Last Modified Apr 4, 2024

Standardize Data Collection

2 minutes   Author Tim Hard

Why Standards Matter

As cloud adoption grows, we often face requests to support new technologies within a diverse landscape, posing challenges in delivering timely content. Take, for instance, a team containerizing five workloads on AWS requiring EKS visibility. Usually, this involves assisting with integration setup, configuring metadata, and creating dashboards and alertsā€”a process that’s both time-consuming and increases administrative overhead and technical debt.

Splunk Observability Cloud was designed to handle customers with a diverse set of technical requirements and stacks ā€“ from monolithic to microservices architectures, from homegrown applications to Software-as-a-Service.

Splunk offers a native experience for OpenTelemetry, which means OTel is the preferred way to get data into Splunk. Between Splunkā€™s integrations and the OpenTelemetry community, there are a number of integrations available to easily collect from diverse infrastructure and applications. This includes both on-prem systems like VMWare and as well as guided integrations with cloud vendors, centralizing these hybrid environments.

Splunk Observability Cloud Integrations Splunk Observability Cloud Integrations

For someone like a Splunk admin, the OpenTelemetry Collector can additionally be deployed to a Splunk Universal Forwarder as a Technical Add-on. This enables fast roll-out and centralized configuration management using the Splunk Deployment Server. Letā€™s assume that the same team adopting Kubernetes is going to deploy a cluster for each one of our B2B customers. Iā€™ll show you how to make a simple modification to the OpenTelemetry collector to add the customerID, and then use mirrored dashboards to allow any of our SRE teams to easily see the customer they care about.

Last Modified Apr 4, 2024

Subsections of Standardize Data Collection

What Are Tags?

3 minutes   Author Tim Hard

Tags are key-value pairs that provide additional metadata about metrics, spans in a trace, or logs allowing you to enrich the context of the data you send to Splunk Observability Cloud. Many tags are collected by default such as hostname or OS type. Custom tags can be used to provide environment or application-specific context. Examples of custom tags include:

Infrastructure specific attributes
  • What data center a host is in
  • What services are hosted on an instance
  • What team is responsible for a set of hosts
Application specific attributes
  • What Application Version is running
  • Feature flags or experimental identifiers
  • Tenant ID in multi-tenant applications
  • User ID
  • User role (e.g. admin, guest, subscriber)
  • User geographical location (e.g. country, city, region)
There are two ways to add tags to your data
  • Add tags as OpenTelemetry attributes to metrics, traces, and logs when you send data to the Splunk Distribution of OpenTelemetry Collector. This option lets you add spans in bulk.
  • Instrument your application to create span tags. This option gives you the most flexibility at the per-application level.

Why are tags so important?

Tags are essential for an application to be truly observable. Tags add context to the traces to help us understand why some users get a great experience and others don’t. Powerful features in Splunk Observability Cloud utilize tags to help you jump quickly to the root cause.

Contextual Information: Tags provide additional context to the metrics, traces, and logs allowing developers and operators to understand the behavior and characteristics of infrastructure and traced operations.

Filtering and Aggregation: Tags enable filtering and aggregation of collected data. By attaching tags, users can filter and aggregate data based on specific criteria. This filtering and aggregation help in identifying patterns, diagnosing issues, and gaining insights into system behavior.

Correlation and Analysis: Tags facilitate correlation between metrics and other telemetry data, such as traces and logs. By including common identifiers or contextual information as tags, users can correlate metrics, traces, and logs enabling comprehensive analysis and troubleshooting of distributed systems.

Customization and Flexibility: OpenTelemetry allows developers to define custom tags based on their application requirements. This flexibility enables developers to capture domain-specific metadata or contextual information that is crucial for understanding the behavior of their applications.

Attributes vs. Tags

A note about terminology before we proceed. While this workshop is about tags, and this is the terminology we use in Splunk Observability Cloud, OpenTelemetry uses the term attributes instead. So when you see tags mentioned throughout this workshop, you can treat them as synonymous with attributes.

Last Modified Apr 4, 2024

Adding Context With Tags

3 minutes   Author Tim Hard

When you deployed the OpenTelemetry Demo Application in the Getting Started section of this workshop, you were asked to enter your favorite city. For this workshop, we’ll be using that to show the value of custom tags.

For this workshop, the OpenTelemetry collector is pre-configured to use the city you provided as a custom tag called store.location which will be used to emulate Kubernetes Clusters running in different geographic locations. We’ll use this tag as a filter to show how you can use Out-of-the-Box integration dashboards to quickly create views for specific teams, applications, or other attributes about your environment. Efficiently enabling content to be reused across teams without increasing technical debt.

Here is the OpenTelemetry Collector configuration used to add the store.location tag to all of the data sent to this collector. This means any metrics, traces, or logs will contain the store.location tag which can then be used to search, filter, or correlate this value.

Tip

If you’re interested in a deeper dive on the OpenTelemetry Collector, head over to the Self Service Observability workshop where you can get hands-on with configuring the collector or the OpenTelemetry Collector Ninja Workshop where you’ll dissect the inner workings of each collector component.

OpenTelemetry Collector Configuration OpenTelemetry Collector Configuration

While this example uses a hard-coded value for the tag, parameterized values can also be used, allowing you to customize the tags dynamically based on the context of each host, application, or operation. This flexibility enables you to capture relevant metadata, user-specific details, or system parameters, providing a rich context for metrics, tracing, and log data while enhancing the observability of your distributed systems.

Now that you have the appropriate context, which as we’ve established is critical to Observability, let’s head over to Splunk Observability Cloud and see how we can use the data we’ve just configured.

Last Modified Apr 4, 2024

Reuse Content Across Teams

3 minutes   Author Tim Hard

In today’s rapidly evolving technological landscape, where hybrid and cloud environments are becoming the norm, the need for effective monitoring and troubleshooting solutions has never been more critical. However, managing the elasticity and complexity of these modern infrastructures poses a significant challenge for teams across various industries. One of the primary pain points encountered in this endeavor is the inadequacy of existing monitoring and troubleshooting experiences.

Traditional monitoring approaches often fall short in addressing the intricacies of hybrid and cloud environments. Teams frequently encounter slow data visualization and troubleshooting processes, compounded by the clutter of bespoke yet similar dashboards and the manual correlation of data from disparate sources. This cumbersome workflow is made worse by the absence of monitoring tools tailored to ephemeral technologies such as containers, orchestrators like Kubernetes, and serverless functions.

Infrastructure Overview in Splunk Observability Cloud Infrastructure Overview in Splunk Observability Cloud

In this section, we’ll cover how Splunk Observability Cloud provides out-of-the-box content for every integration. Not only do the out-of-the-box dashboards provide rich visibility into the infrastructure that is being monitored they can also be mirrored. This is important because it enables you to create standard dashboards for use by teams throughout your organization. This allows all teams to see any changes to the charts in the dashboard, and members of each team can set dashboard variables and filter customizations relevant to their requirements.

Last Modified Apr 4, 2024

Subsections of Reuse Content Across Teams

Infrastrcuture Navigators

5 minutes   Author Tim Hard

Splunk Infrastructure Monitoring (IM) is a market-leading monitoring and observability service for hybrid cloud environments. Built on a patented streaming architecture, it provides a real-time solution for engineering teams to visualize and analyze performance across infrastructure, services, and applications in a fraction of the time and with greater accuracy than traditional solutions.

300+ Easy-to-use OOTB content: Pre-built navigators and dashboards, deliver immediate visualizations of your entire environment so that you can interact with all your data in real time.
Kubernetes navigator: Provides an instant, comprehensive out-of-the-box hierarchical view of nodes, pods, and containers. Ramp up even the most novice Kubernetes user with easy-to-understand interactive cluster maps.
AutoDetect alerts and detectors: Automatically identify the most important metrics, out-of-the-box, to create alert conditions for detectors that accurately alert from the moment telemetry data is ingested and use real-time alerting capabilities for important notifications in seconds.
Log views in dashboards: Combine log messages and real-time metrics on one page with common filters and time controls for faster in-context troubleshooting.
Metrics pipeline management: Control metrics volume at the point of ingest without re-instrumentation with a set of aggregation and data-dropping rules to store and analyze only the needed data. Reduce metrics volume and optimize observability spend.

Infrastructure Overview Infrastructure Overview

Exercise: Find your Kubernetes Cluster
  • From the Splunk Observability Cloud homepage, click the Infrastructure Infrastructure button -> Kubernetes -> K8s nodes
  • First, use the k8s filter k8s filter option to pick your cluster.
  • From the filter drop-down box, use the store.location value you entered when deploying the application.
  • You then can start typing the city you used which should also appear in the drop-down values. Select yours and make sure just the one for your workshop is highlighted with a blue tick blue tick.
  • Click the Apply Filter button to focus on our Cluster.

Kubernetes Navigator Kubernetes Navigator

  • You should now have your Kubernetes Cluster visible
  • Here we can see all of the different components of the cluster (Nodes, Pods, etc), each of which has relevant metrics associated with it. On the right side, you can also see what services are running in the cluster.

Before moving to the next section, take some time to explore the Kubernetes Navigator to see the data that is available Out of the Box.

Last Modified Apr 4, 2024

Dashboard Cloning

5 minutes   Author Tim Hard

ITOps teams responsible for monitoring fleets of infrastructure frequently find themselves manually creating dashboards to visualize and analyze metrics, traces, and log data emanating from rapidly changing cloud-native workloads hosted in Kubernetes and serverless architectures, alongside existing on-premises systems. Moreover, due to the absence of a standardized troubleshooting workflow, teams often resort to creating numerous custom dashboards, each resembling the other in structure and content. As a result, administrative overhead skyrockets and MTTR slows.

To address this, you can use the out-of-the-box dashboards available in Splunk Observability Cloud for each and every integration. These dashboards are filterable and can be used for ad hoc troubleshooting or as a templated approach to getting users the information they need without having to start from scratch. Not only do the out-of-the-box dashboards provide rich visibility into the infrastructure that is being monitored they can also be cloned.

Exercise: Create a Mirrored Dashboard
  1. In Splunk Observability Cloud, click the Global Search Search Search button. (Global Search can be used to quickly find content)
  2. Search for Pods and select K8s pods (Kubernetes) Search Search
  3. This will take you to the out-of-the-box Kubernetes Pods dashboard which we will use as a template for mirroring dashboards.
  4. In the upper right corner of the dashboard click the Dashboard actions button (3 horizontal dots) -> Click Save As… Search Search
  5. Enter a dashboard name (i.e. Kubernetes Pods Dashboard)
  6. Under Dashboard group search for your e-mail address and select it.
  7. Click Save

Note: Every Observability Cloud user who has set a password and logged in at least once, gets a user dashboard group and user dashboard. Your user dashboard group is your individual workspace within Observability Cloud.

Save Dashboard Save Dashboard

After saving, you will be taken to the newly created dashboard in the Dashboard Group for your user. This is an example of cloning an out-of-the-box dashboard which can be further customized and enables users to quickly build role, application, or environment relevant views.

Custom dashboards are meant to be used by multiple people and usually represent a curated set of charts that you want to make accessible to a broad cross-section of your organization. They are typically organized by service, team, or environment.

Last Modified Apr 4, 2024

Dashboard Mirroring

5 minutes   Author Tim Hard

Not only do the out-of-the-box dashboards provide rich visibility into the infrastructure that is being monitored they can also be mirrored. This is important because it enables you to create standard dashboards for use by teams throughout your organization. This allows all teams to see any changes to the charts in the dashboard, and members of each team can set dashboard variables and filter customizations relevant to their requirements.

Exercise: Create a Mirrored Dashboard
  1. While on the Kubernetes Pods dashboard, you created in the previous step, In the upper right corner of the dashboard click the Dashboard actions button (3 horizontal dots) -> Click Add a mirror…. A configuration modal for the Dashboard Mirror will open.

    Mirror Dashboard Menu Mirror Dashboard Menu

  2. Under My dashboard group search for your e-mail address and select it.

  3. (Optional) Modify the dashboard in Dashboard name override name.

  4. (Optional) Add a dashboard description in Dashboard description override.

  5. Under Default filter overrides search for k8s.cluster.name and select the name of your Kubernetes cluster.

  6. Under Default filter overrides search for store.location and select the city you entered during the workshop setup. Mirror Dashboard Config Mirror Dashboard Config

  7. Click Save

You will now be taken to the newly created dashboard which is a mirror of the Kubernetes Pods dashboard you created in the previous section. Any changes to the original dashboard will be reflected in this dashboard as well. This allows teams to have a consistent yet specific view of the systems they care about and any modifications or updates can be applied in a single location, significantly minimizing the effort needed when compared to updating each individual dashboard.

In the next section, you’ll add a new logs-based chart to the original dashboard and see how the dashboard mirror is automatically updated as well.

Last Modified Apr 4, 2024

Correlate Metrics and Logs

1 minute   Author Tim Hard

Correlating infrastructure metrics and logs is often a challenging task, primarily due to inconsistencies in naming conventions across various data sources, including hosts operating on different systems. However, leveraging the capabilities of OpenTelemetry can significantly simplify this process. With OpenTelemetry’s robust framework, which offers rich metadata and attribution, metrics, traces, and logs can seamlessly correlate using standardized field names. This automated correlation not only alleviates the burden of manual effort but also enhances the overall observability of the system.

By aligning metrics and logs based on common field names, teams gain deeper insights into system performance, enabling more efficient troubleshooting, proactive monitoring, and optimization of resources. In this workshop section, we’ll explore the importance of correlating metrics with logs and demonstrate how Splunk Observability Cloud empowers teams to unlock additional value from their observability data.

Log Observer Log Observer

Last Modified Apr 4, 2024

Subsections of Correlate Metrics and Logs

Correlate Metrics and Logs

5 minutes   Author Tim Hard

In this section, we’ll dive into the seamless correlation of metrics and logs facilitated by the robust naming standards offered by OpenTelemetry. By harnessing the power of OpenTelemetry within Splunk Observability Cloud, we’ll demonstrate how troubleshooting issues becomes significantly more efficient for Site Reliability Engineers (SREs) and operators. With this integration, contextualizing data across various telemetry sources no longer demands manual effort to correlate information. Instead, SREs and operators gain immediate access to the pertinent context they need, allowing them to swiftly pinpoint and resolve issues, improving system reliability and performance.

Exercise: View pod logs

The Kubernetes Pods Dashboard you created in the previous section already includes a chart that contains all of the pod logs for your Kubernetes Cluster. The log entries are split by container in this stacked bar chart. To view specific log entries perform the following steps:

  1. On the **Kubernetes Pods Dashboard click on one of the bar charts. A modal will open with the most recent log entries for the container you’ve selected.

    K8s pod logs K8s pod logs

  2. Click one of the log entries.

    K8s pod log event K8s pod log event

    Here we can see the entire log event with all of the fields and values. You can search for specific field names or values within the event itself using the Search for fields bar in the event.

  3. Enter the city you configured during the application deployment

    K8s pod log field search K8s pod log field search

    The event will now be filtered to the store.location field. This feature is great for exploring large log entries for specific fields and values unique to your environment or to search for keywords like Error or Failure.

  4. Close the event using the X in the upper right corner.

  5. Click the Chart actions (three horizontal dots) on the Pod log event rate chart

  6. Click View in Log Observer

View in Log Observer View in Log Observer

This will take us to Log Observer. In the next section, you’ll create a chart based on log events and add it to the K8s Pod Dashboard you cloned in section 3.2 Dashboard Cloning. You’ll also see how this new chart is automatically added to the mirrored dashboard you created in section 3.3 Dashboard Mirroring.

Last Modified Apr 4, 2024

Create Log-based Chart

5 minutes   Author Tim Hard

In Log Observer, you can perform codeless queries on logs to detect the source of problems in your systems. You can also extract fields from logs to set up log processing rules and transform your data as it arrives or send data to Infinite Logging S3 buckets for future use. See What can I do with Log Observer? to learn more about Log Observer capabilities.

In this section, you’ll create a chart filtered to logs that include errors which will be added to the K8s Pod Dashboard you cloned in section 3.2 Dashboard Cloning.

Exercise: Create Log-based Chart

Because you drilled into Log Observer from the K8s Pod Dashboard in the previous section, the dashboard will already be filtered to your cluster and store location using the k8s.cluster.name and store.location fields and the bar chart is split by k8s.pod.name. To filter the dashboard to only logs that contain errors complete the following steps:

Log Observer can be filtered using Keywords or specific key-value pairs.

  1. In Log Observer click Add Filter along the top.

  2. Make sure you’ve selected Fields as the filter type and enter severity in the Find a field… search bar.

  3. Select severity from the fields list.

    You should now see a list of severities and the number of log entries for each.

  4. Under Top values, hover over Error and click the = button to apply the filter.

    Log Observer: Filter errors Log Observer: Filter errors

    The dashboard will now be filtered to only log entries with a severity of Error and the bar chart will be split by the Kubernetes Pod that contains the errors. Next, you’ll save the chart on your Kubernetes Pods Dashboard.

  5. In the upper right corner of the Log Observer dashboard click Save.

  6. Select Save to Dashboard.

  7. In the Chart name field enter a name for your chart.

  8. (Optional) In the Chart description field enter a description for your chart.

    Log Observer: Save Chart Name Log Observer: Save Chart Name

  9. Click Select Dashboard and search for the name of the Dashboard you cloned in section 3.2 Dashboard Cloning.

  10. Select the dashboard in the Dashboard Group for your email address.

    Log Observer: Select Dashboard Log Observer: Select Dashboard

  11. Click OK

  12. For the Chart type select Log timeline

  13. Click Save and go to the dashboard

You will now be taken to your Kubernetes Pods Dashboard where you should see the chart you just created for pod errors.

Log Errors Chart Log Errors Chart

Because you updated the original Kubernetes Pods Dashboard, your mirrored dashboard will also include this chart as well! You can see this by clicking the mirrored version of your dashboard along the top of the Dashboard Group for your user.

Log Errors Chart Log Errors Chart

Now that you’ve seen how data can be reused across teams by cloning the dashboard, creating dashboard mirrors and how metrics can easily be correlated with logs, let’s take a look at how to create alerts so your teams can be notified when there is an issue with their infrastructure, services, or applications.

Last Modified Apr 4, 2024

Improve Timeliness of Alerts

1 minutes   Author Tim Hard

When monitoring hybrid and cloud environments, ensuring timely alerts for critical infrastructure and applications poses a significant challenge. Typically, this involves crafting intricate queries, meticulously scheduling searches, and managing alerts across various monitoring solutions. Moreover, the proliferation of disparate alerts generated from identical data sources often results in unnecessary duplication, contributing to alert fatigue and noise within the monitoring ecosystem.

In this section, we’ll explore how Splunk Observability Cloud addresses these challenges by enabling the effortless creation of alert criteria. Leveraging its 10-second default data collection capability, alerts can be triggered swiftly, surpassing the timeliness achieved by traditional monitoring tools. This enhanced responsiveness not only reduces Mean Time to Detect (MTTD) but also accelerates Mean Time to Resolve (MTTR), ensuring that critical issues are promptly identified and remediated.

Detector Dashboard Detector Dashboard

Last Modified Apr 2, 2024

Subsections of Improve Timeliness of Alerts

Create Custom Detector

10 minutes   Author Tim Hard

Splunk Observability Cloud provides detectors, events, alerts, and notifications to keep you informed when certain criteria are met. There are a number of pre-built AutoDetect Detectors that automatically surface when common problem patterns occur, such as when an EC2 instanceā€™s CPU utilization is expected to reach its limit. Additionally, you can also create custom detectors if you want something more optimized or specific. For example, you want a message sent to a Slack channel or to an email address for the Ops team that manages this Kubernetes cluster when Memory Utilization on their pods has reached 85%.

Exercise: Create Custom Detector

In this section you’ll create a detector on Pod Memory Utilization which will trigger if utilization surpasses 85%

  1. On the Kubernetes Pods Dashboard you cloned in section 3.2 Dashboard Cloning, click the Get Alerts button (bell icon) for the Memory usage (%) chart -> Click New detector from chart.

    New Detector from Chart New Detector from Chart

  2. In the Create detector add your initials to the detector name.

    Create Detector: Update Detector Name Create Detector: Update Detector Name

  3. Click Create alert rule.

    These conditions are expressed as one or more rules that trigger an alert when the conditions in the rules are met. Importantly, multiple rules can be included in the same detector configuration which minimizes the total number of alerts that need to be created and maintained. You can see which signal this detector will alert on by the bell icon in the Alert On column. In this case, this detector will alert on the Memory Utilization for the pods running in this Kubernetes cluster.

    Alert Signal Alert Signal

  4. Click Proceed To Alert Conditions.

    Many pre-built alert conditions can be applied to the metric you want to alert on. This could be as simple as a static threshold or something more complex, for example, is memory usage deviating from the historical baseline across any of your 50,000 containers?

    Alert Conditions Alert Conditions

  5. Select Static Threshold.

  6. Click Proceed To Alert Settings.

    In this case, you want the alert to trigger if any pods exceed 85% memory utilization. Once youā€™ve set the alert condition, the configuration is back-tested against the historical data so you can confirm that the alert configuration is accurate, meaning will the alert trigger on the criteria youā€™ve defined? This is also a great way to confirm if the alert generates too much noise.

    Alert Settings Alert Settings

  7. Enter 85 in the Threshold field.

  8. Click Proceed To Alert Message.

    Next, you can set the severity for this alert, you can include links to runbooks and short tips on how to respond, and you can customize the message that is included in the alert details. The message can include parameterized fields from the actual data, for example, in this case, you may want to include which Kubernetes node the pod is running on, or the store.location configured when you deployed the application, to provide additional context.

    Alert Message Alert Message

  9. Click Proceed To Alert Recipients.

    You can choose where you want this alert to be sent when it triggers. This could be to a team, specific email addresses, or to other systems such as ServiceNow, Slack, Splunk On-Call or Splunk ITSI. You can also have the alert execute a webhook which enables me to leverage automation or to integrate with many other systems such as homegrown ticketing tools. For the purpose of this workshop do not include a recipient

    Alert Recipients Alert Recipients

  10. Click Proceed To Alert Activation.

    Activate Alert Activate Alert

  11. Click Activate Alert.

    Activate Alert Message Activate Alert Message

    You will receive a warning because no recipients were included in the Notification Policy for this detector. This can be warning can be dismissed.

  12. Click Save.

    Activate Alert Message Activate Alert Message

    You will be taken to your newly created detector where you can see any triggered alerts.

  13. In the upper right corner, Click Close to close the Detector.

The detector status and any triggered alerts will automatically be included in the chart because this detector was configured for this chart.

Alert Chart Alert Chart

Congratulations! You’ve successfully created a detector that will trigger if pod memory utilization exceeds 85%. After a few minutes, the detector should trigger some alerts. You can click the detector name in the chart to view the triggered alerts.

Last Modified Apr 4, 2024

Conclusion

1 minute  

Today youā€™ve seen how Splunk Observability Cloud can help you overcome many of the challenges you face monitoring hybrid and cloud environments. Youā€™ve demonstrated how Splunk Observability Cloud streamlines operations with standardized data collection and tags, ensuring consistency across all IT infrastructure. The Unified Service Telemetry has been a game-changer, providing in-context metrics, logs, and trace data that make troubleshooting swift and efficient. By enabling the reuse of content across teams, youā€™re minimizing technical debt and bolstering the performance of our monitoring systems.

Happy Splunking!

Dancing Buttercup Dancing Buttercup