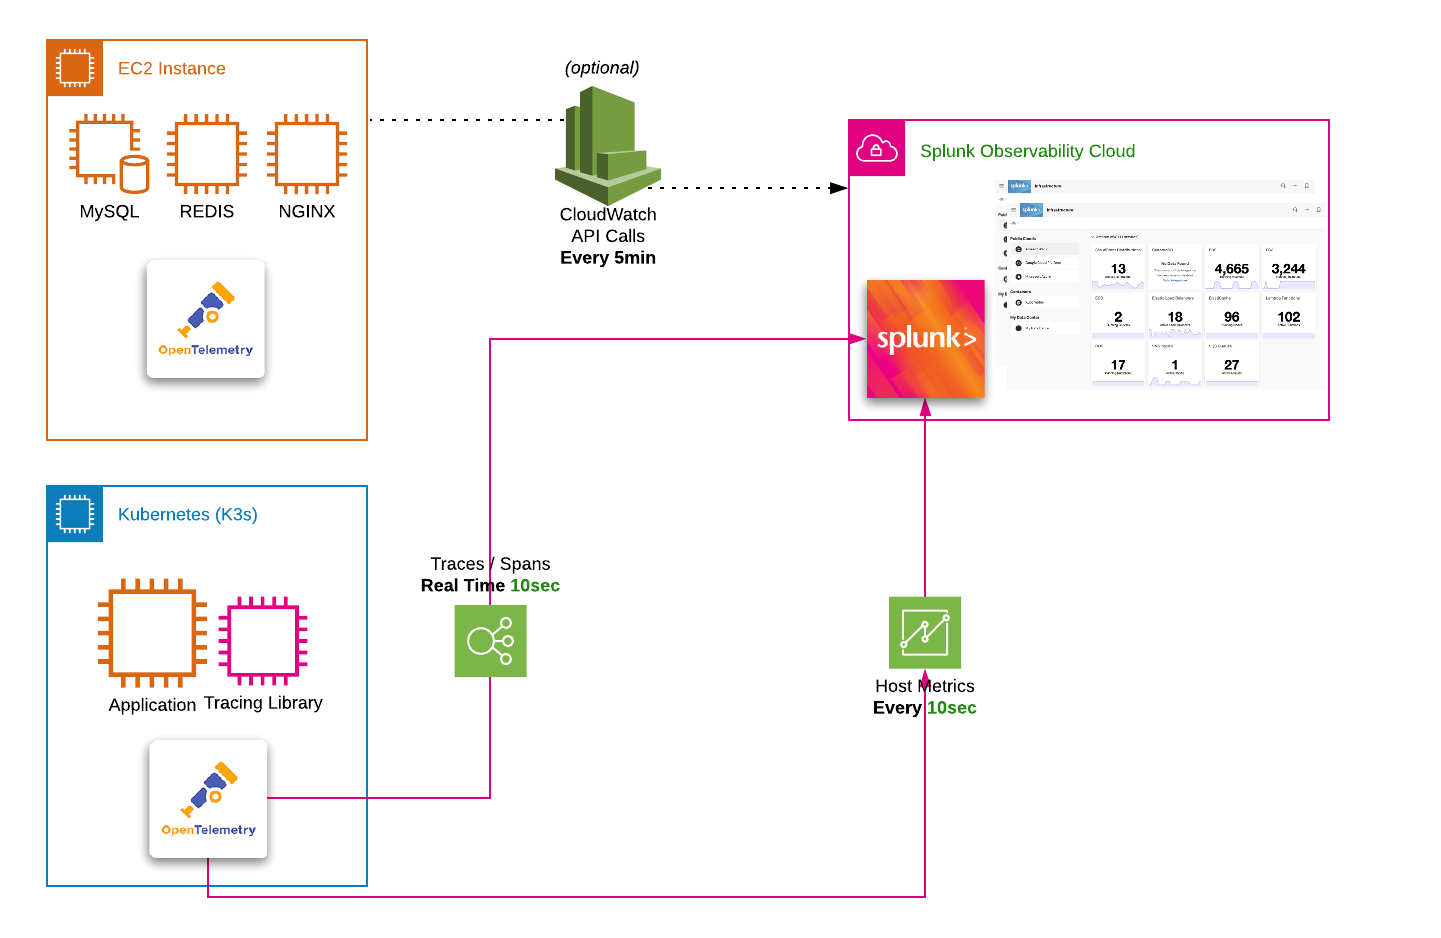
During this technical Splunk Observability Cloud Infrastructure Monitoring and APM Workshop, you will build out an environment based on a lightweight Kubernetes1 cluster.
To simplify the workshop modules, a pre-configured AWS/EC2 instance is provided.
The instance is pre-configured with all the software required to deploy the Splunk OpenTelemetry Connector2 in Kubernetes, deploy an NGINX^3 ReplicaSet^4 and finally deploy a microservices-based application which has been instrumented using OpenTelemetry to send metrics, traces, spans and logs3.
The workshops also introduce you to dashboards, editing and creating charts, creating detectors to fire alerts, Monitoring as Code and the Service Bureau4
By the end of these technical workshops, you will have a good understanding of some of the key features and capabilities of the Splunk Observability Cloud.
Here are the instructions on how to access your pre-configured AWS/EC2 instance
Kubernetes is a portable, extensible, open-source platform for managing containerized workloads and services, that facilitates both declarative configuration and automation. ↩︎
OpenTelemetry Collector offers a vendor-agnostic implementation on how to receive, process and export telemetry data. In addition, it removes the need to run, operate and maintain multiple agents/collectors to support open-source telemetry data formats (e.g. Jaeger, Prometheus, etc.) sending to multiple open-source or commercial back-ends. ↩︎
Jaeger, inspired by Dapper and OpenZipkin, is a distributed tracing system released as open source by Uber Technologies. It is used for monitoring and troubleshooting microservices-based distributed systems ↩︎
How to retrieve the IP address of the AWS/EC2 instance assigned to you.
Connect to your instance using SSH, Putty1 or your web browser.
Verify your connection to your AWS/EC2 cloud instance.
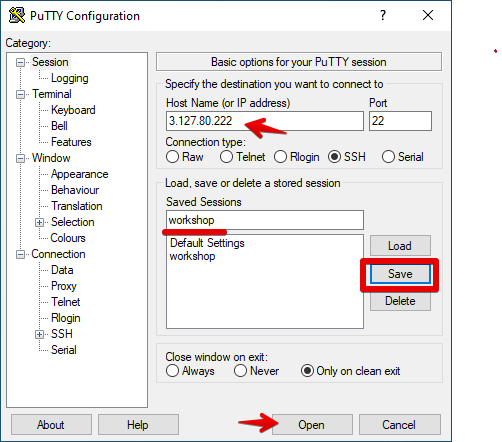
Using Putty (Optional)
Using Multipass (Optional)
1. AWS/EC2 IP Address
In preparation for the workshop, Splunk has prepared an Ubuntu Linux instance in AWS/EC2.
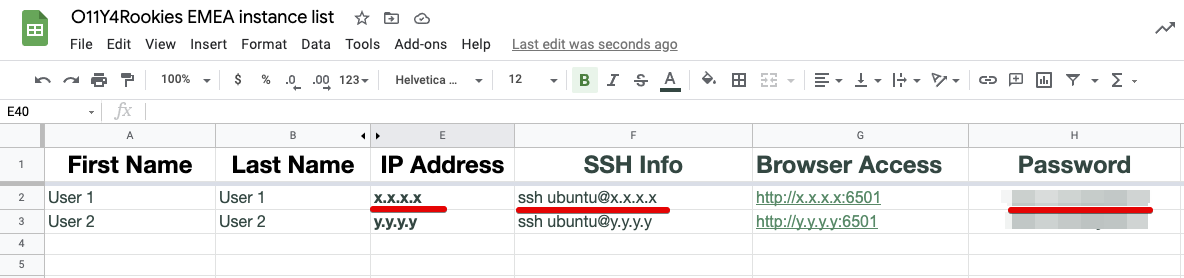
To get access to the instance that you will be using in the workshop please visit the URL to access the Google Sheet provided by the workshop leader.
Search for your AWS/EC2 instance by looking for your first and last name, as provided during registration for this workshop.
Find your allocated IP address, SSH command (for Mac OS, Linux and the latest Windows versions) and password to enable you to connect to your workshop instance.
It also has the Browser Access URL that you can use in case you cannot connect via ssh or Putty - see EC2 access via Web browser
Important
Please use SSH or Putty to gain access to your EC2 instance if possible and
make a note of the IP address as you will need this during the workshop.
2. SSH (Mac OS/Linux)
Most attendees will be able to connect to the workshop by using SSH from their Mac or Linux device, or on Windows 10 and above.
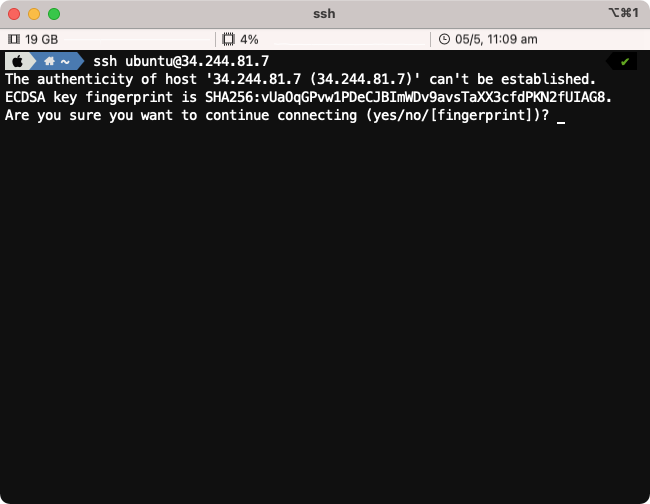
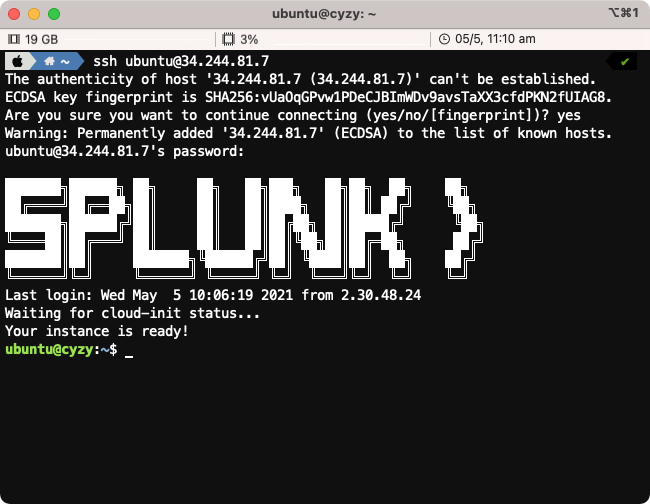
To use SSH, open a terminal on your system and type ssh splunk@x.x.x.x (replacing x.x.x.x with the IP address found in Step #1).
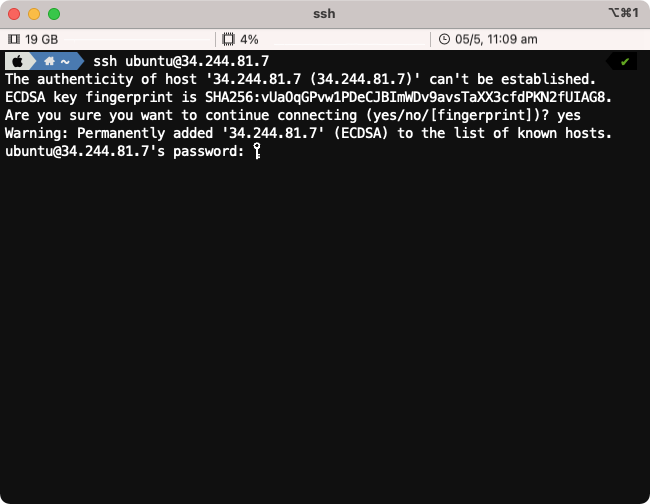
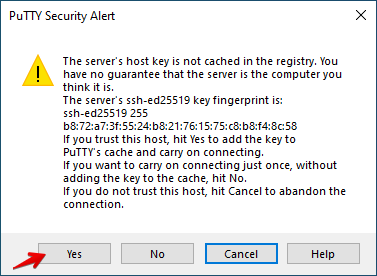
When prompted Are you sure you want to continue connecting (yes/no/[fingerprint])? please type yes.
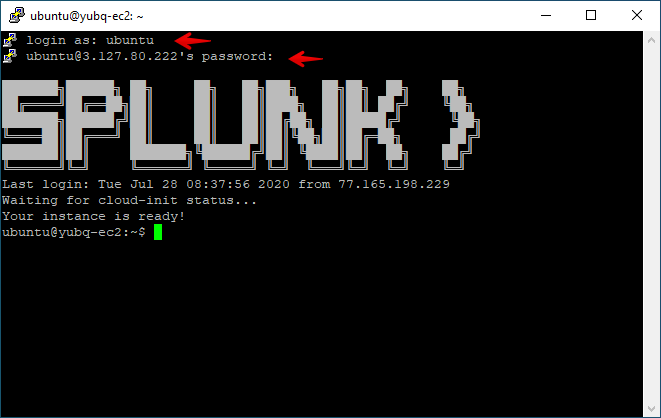
Enter the password provided in the Google Sheet from Step #1.
Upon successful login, you will be presented with the Splunk logo and the Linux prompt.
3. SSH (Windows 10 and above)
The procedure described above is the same on Windows 10, and the commands can be executed either in the Windows Command Prompt or PowerShell.
However, Windows regards its SSH Client as an “optional feature”, which might need to be enabled.
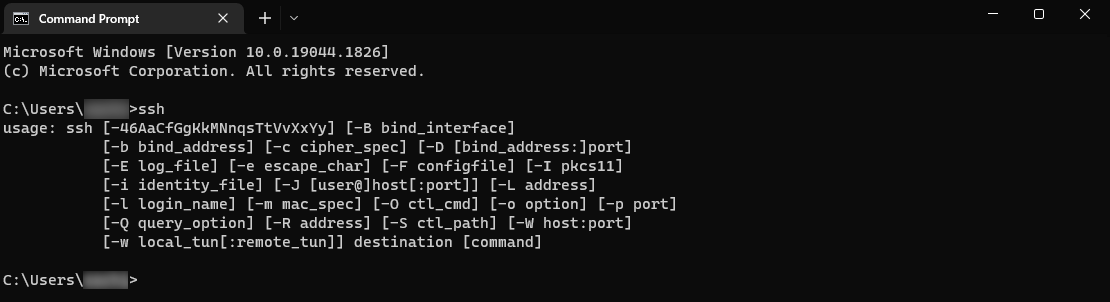
You can verify if SSH is enabled by simply executing ssh
If you are shown a help text on how to use the ssh-command (like shown on the screenshot below), you are all set.
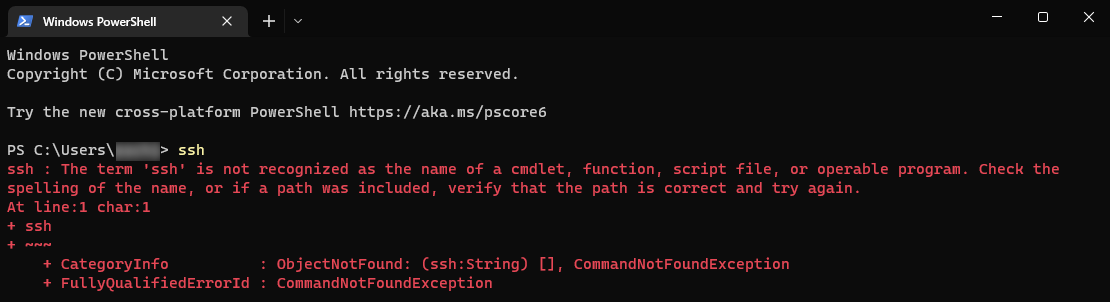
If the result of executing the command looks something like the screenshot below, you want to enable the “OpenSSH Client” feature manually.
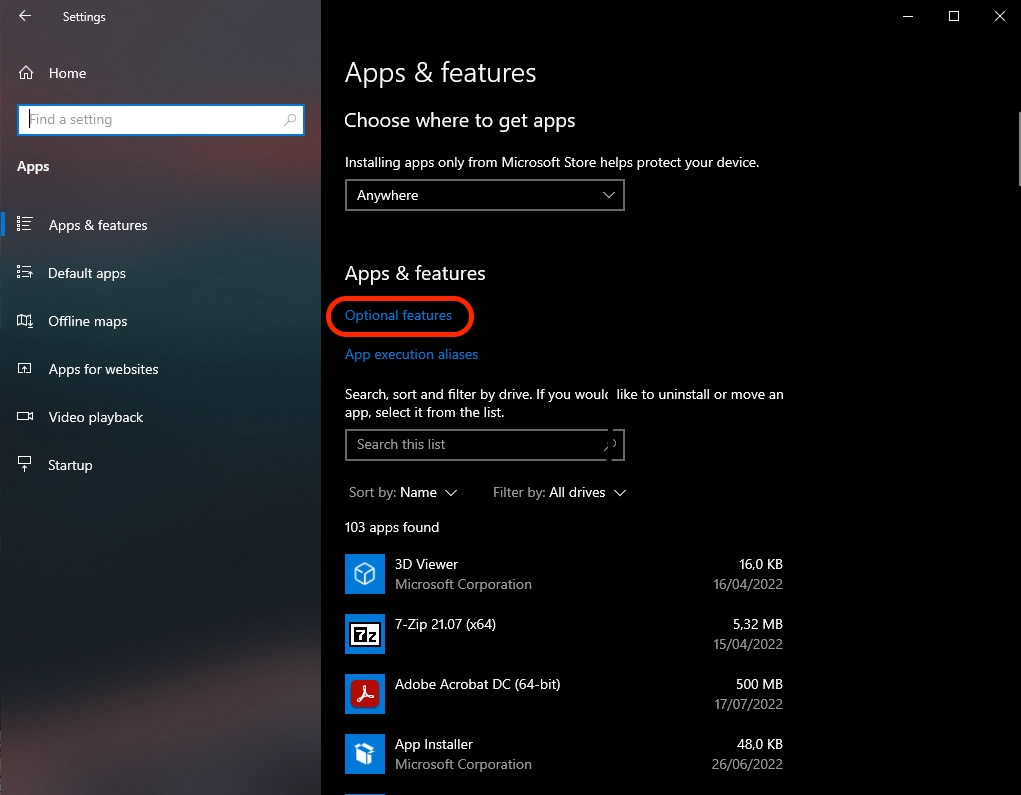
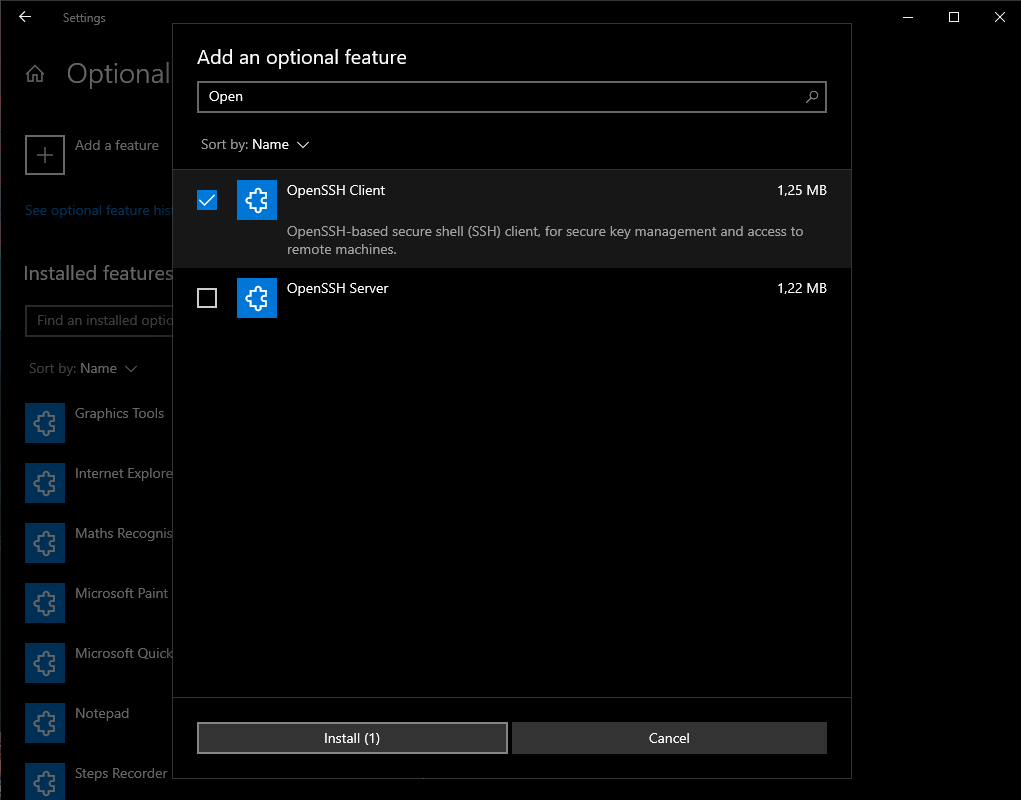
To do that, open the “Settings” menu, and click on “Apps”. While in the “Apps & features” section, click on “Optional features”.
Here, you are presented with a list of installed features. On the top, you see a button with a plus icon to “Add a feature”. Click it.
In the search input field, type “OpenSSH”, and find a feature called “OpenSSH Client”, or respectively, “OpenSSH Client (Beta)”, click on it, and click the “Install”-button.
Now you are set! In case you are not able to access the provided instance despite enabling the OpenSSH feature, please do not shy away from reaching
out to the course instructor, either via chat or directly.
If you are blocked from using SSH (Port 22) or unable to install Putty you may be able to connect to the workshop instance by using a web browser.
Note
This assumes that access to port 6501 is not restricted by your company’s firewall.
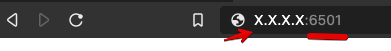
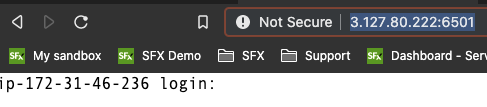
Open your web browser and type http://x.x.x.x:6501 (where X.X.X.X is the IP address from the Google Sheet).
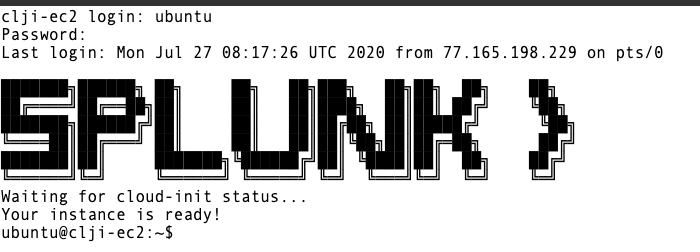
Once connected, login in as splunk and the password is the one provided in the Google Sheet.
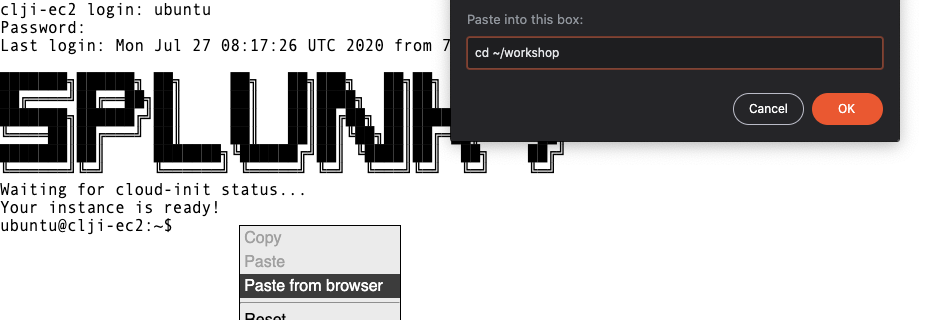
Once you are connected successfully you should see a screen similar to the one below:
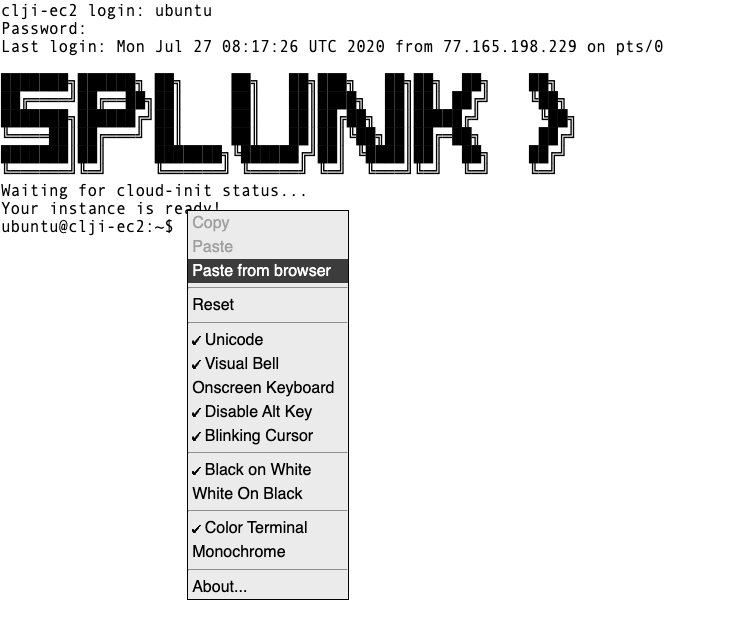
Unlike when you are using regular SSH, copy and paste does require a few extra steps to complete when using a browser session. This is due to cross browser restrictions.
When the workshop asks you to copy instructions into your terminal, please do the following:
Copy the instruction as normal, but when ready to paste it in the web terminal, choose Paste from browser as show below:
This will open a dialogue box asking for the text to be pasted into the web terminal:
Paste the text in the text box as shown, then press OK to complete the copy and paste process.
Note
Unlike regular SSH connection, the web browser has a 60-second time out, and you will be disconnected, and a Connect button will be shown in the center of the web terminal.
Simply click the Connect button and you will be reconnected and will be able to continue.
Using ACCESS_TOKEN={REDACTED}
Using REALM=eu0
“splunk-otel-collector-chart” has been added to your repositories
Using ACCESS_TOKEN={REDACTED}
Using REALM=eu0
Hang tight while we grab the latest from your chart repositories…
…Successfully got an update from the “splunk-otel-collector-chart” chart repository
Update Complete. ⎈Happy Helming!⎈
Install the OpenTelemetry Collector Helm chart with the following commands, do NOT edit this:
Using ACCESS_TOKEN={REDACTED}
Using REALM=eu0
NAME: splunk-otel-collector
LAST DEPLOYED: Fri May  7 11:19:01 2021
NAMESPACE: default
STATUS: deployed
REVISION: 1
TEST SUITE: None
You can monitor the progress of the deployment by running kubectl get pods which should typically report a new pod is up and running after about 30 seconds.
Ensure the status is reported as Running before continuing.
kubectl get pods
NAME                                                          READY   STATUS    RESTARTS   AGE
splunk-otel-collector-agent-2sk6k                             0/1     Running   0          10s
splunk-otel-collector-k8s-cluster-receiver-6956d4446f-gwnd7   0/1     Running   0          10s
Ensure there are no errors by tailing the logs from the OpenTelemetry Collector pod. The output should look similar to the log output shown in the Output tab below.
Use the label set by the helm install to tail logs (You will need to press ctrl+c to exit). Or use the installed k9s terminal UI for bonus points!
2021-03-21T16:11:10.900Z INFO service/service.go:364 Starting receivers…
2021-03-21T16:11:10.900Z INFO builder/receivers_builder.go:70 Receiver is starting… {“component_kind”: “receiver”, “component_type”: “prometheus”, “component_name”: “prometheus”}
2021-03-21T16:11:11.009Z INFO builder/receivers_builder.go:75 Receiver started. {“component_kind”: “receiver”, “component_type”: “prometheus”, “component_name”: “prometheus”}
2021-03-21T16:11:11.009Z INFO builder/receivers_builder.go:70 Receiver is starting… {“component_kind”: “receiver”, “component_type”: “k8s_cluster”, “component_name”: “k8s_cluster”}
2021-03-21T16:11:11.009Z INFO k8sclusterreceiver@v0.21.0/watcher.go:195 Configured Kubernetes MetadataExporter {“component_kind”: “receiver”, “component_type”: “k8s_cluster”, “component_name”: “k8s_cluster”, “exporter_name”: “signalfx”}
2021-03-21T16:11:11.009Z INFO builder/receivers_builder.go:75 Receiver started. {“component_kind”: “receiver”, “component_type”: “k8s_cluster”, “component_name”: “k8s_cluster”}
2021-03-21T16:11:11.009Z INFO healthcheck/handler.go:128 Health Check state change {“component_kind”: “extension”, “component_type”: “health_check”, “component_name”: “health_check”, “status”: “ready”}
2021-03-21T16:11:11.009Z INFO service/service.go:267 Everything is ready. Begin running and processing data.
2021-03-21T16:11:11.009Z INFO k8sclusterreceiver@v0.21.0/receiver.go:59 Starting shared informers and wait for initial cache sync. {“component_kind”: “receiver”, “component_type”: “k8s_cluster”, “component_name”: “k8s_cluster”}
2021-03-21T16:11:11.281Z INFO k8sclusterreceiver@v0.21.0/receiver.go:75 Completed syncing shared informer caches. {“component_kind”: “receiver”, “component_type”: “k8s_cluster”, “component_name”: “k8s_cluster”}
Deleting a failed installation
If you make an error installing the OpenTelemetry Collector you can start over by deleting the installation using:
helm delete splunk-otel-collector
2. Validate metrics in the UI
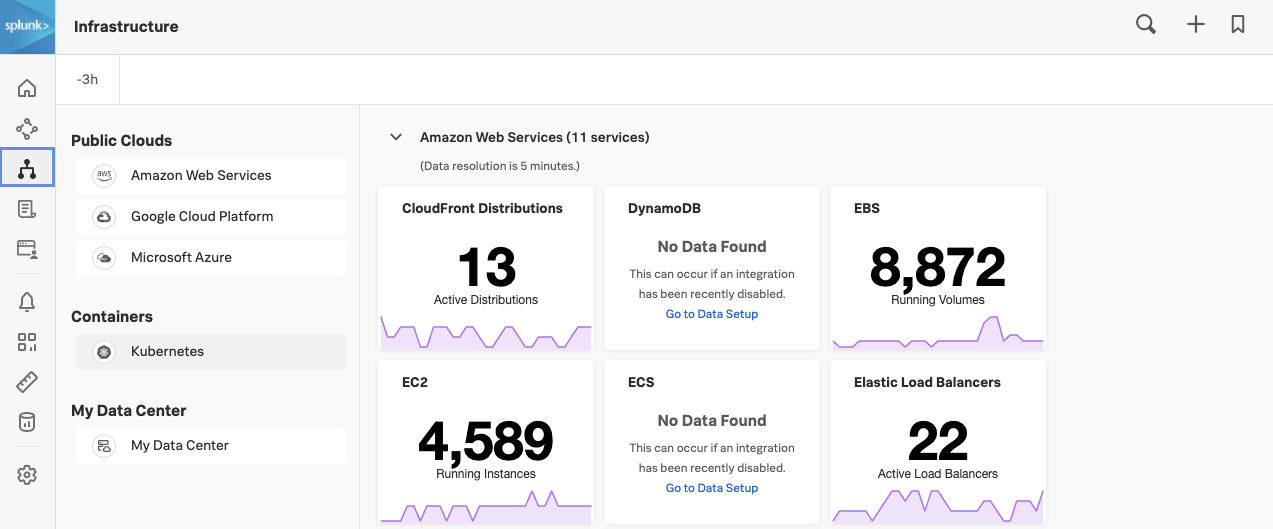
In the Splunk UI, click the » bottom left and click on Infrastructure.
Under Containers click on Kubernetes to open the Kubernetes Navigator Cluster Map to ensure metrics are being sent in.
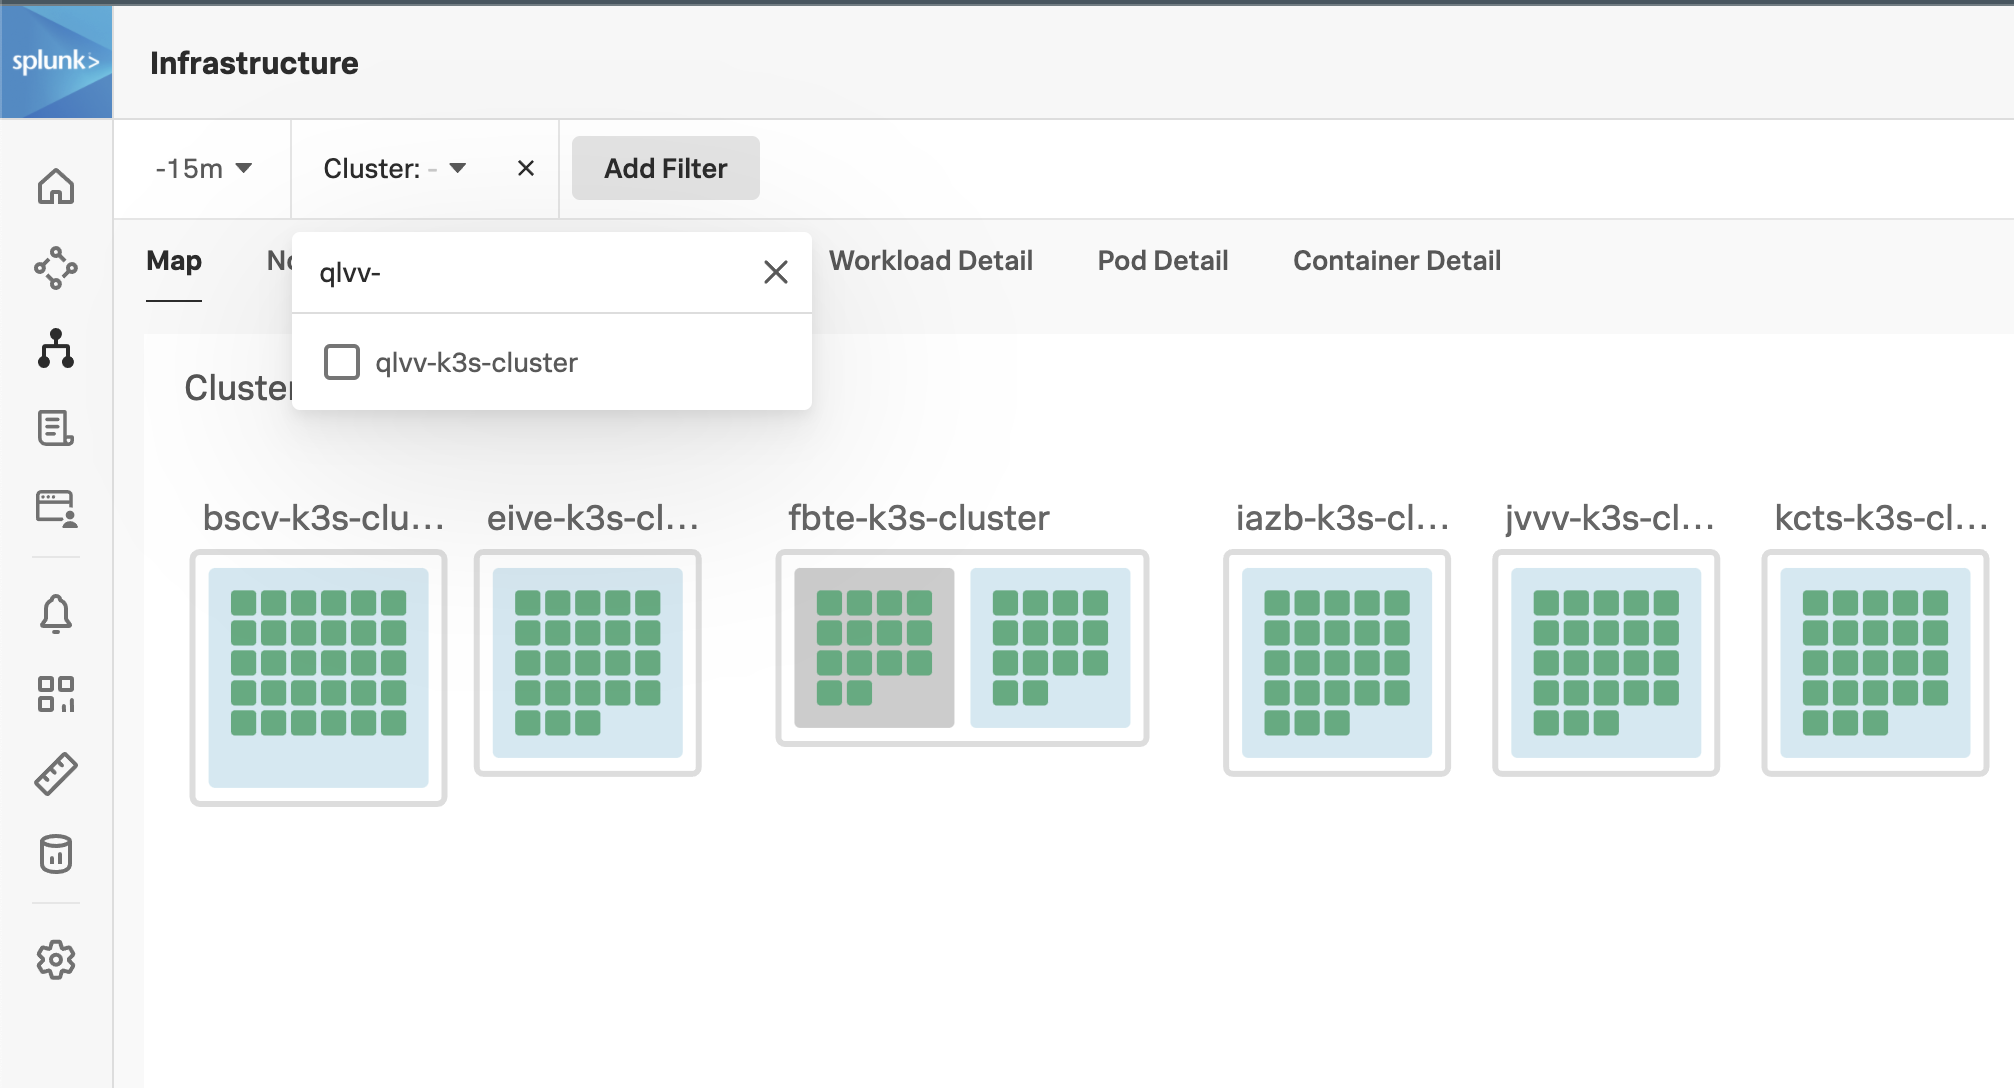
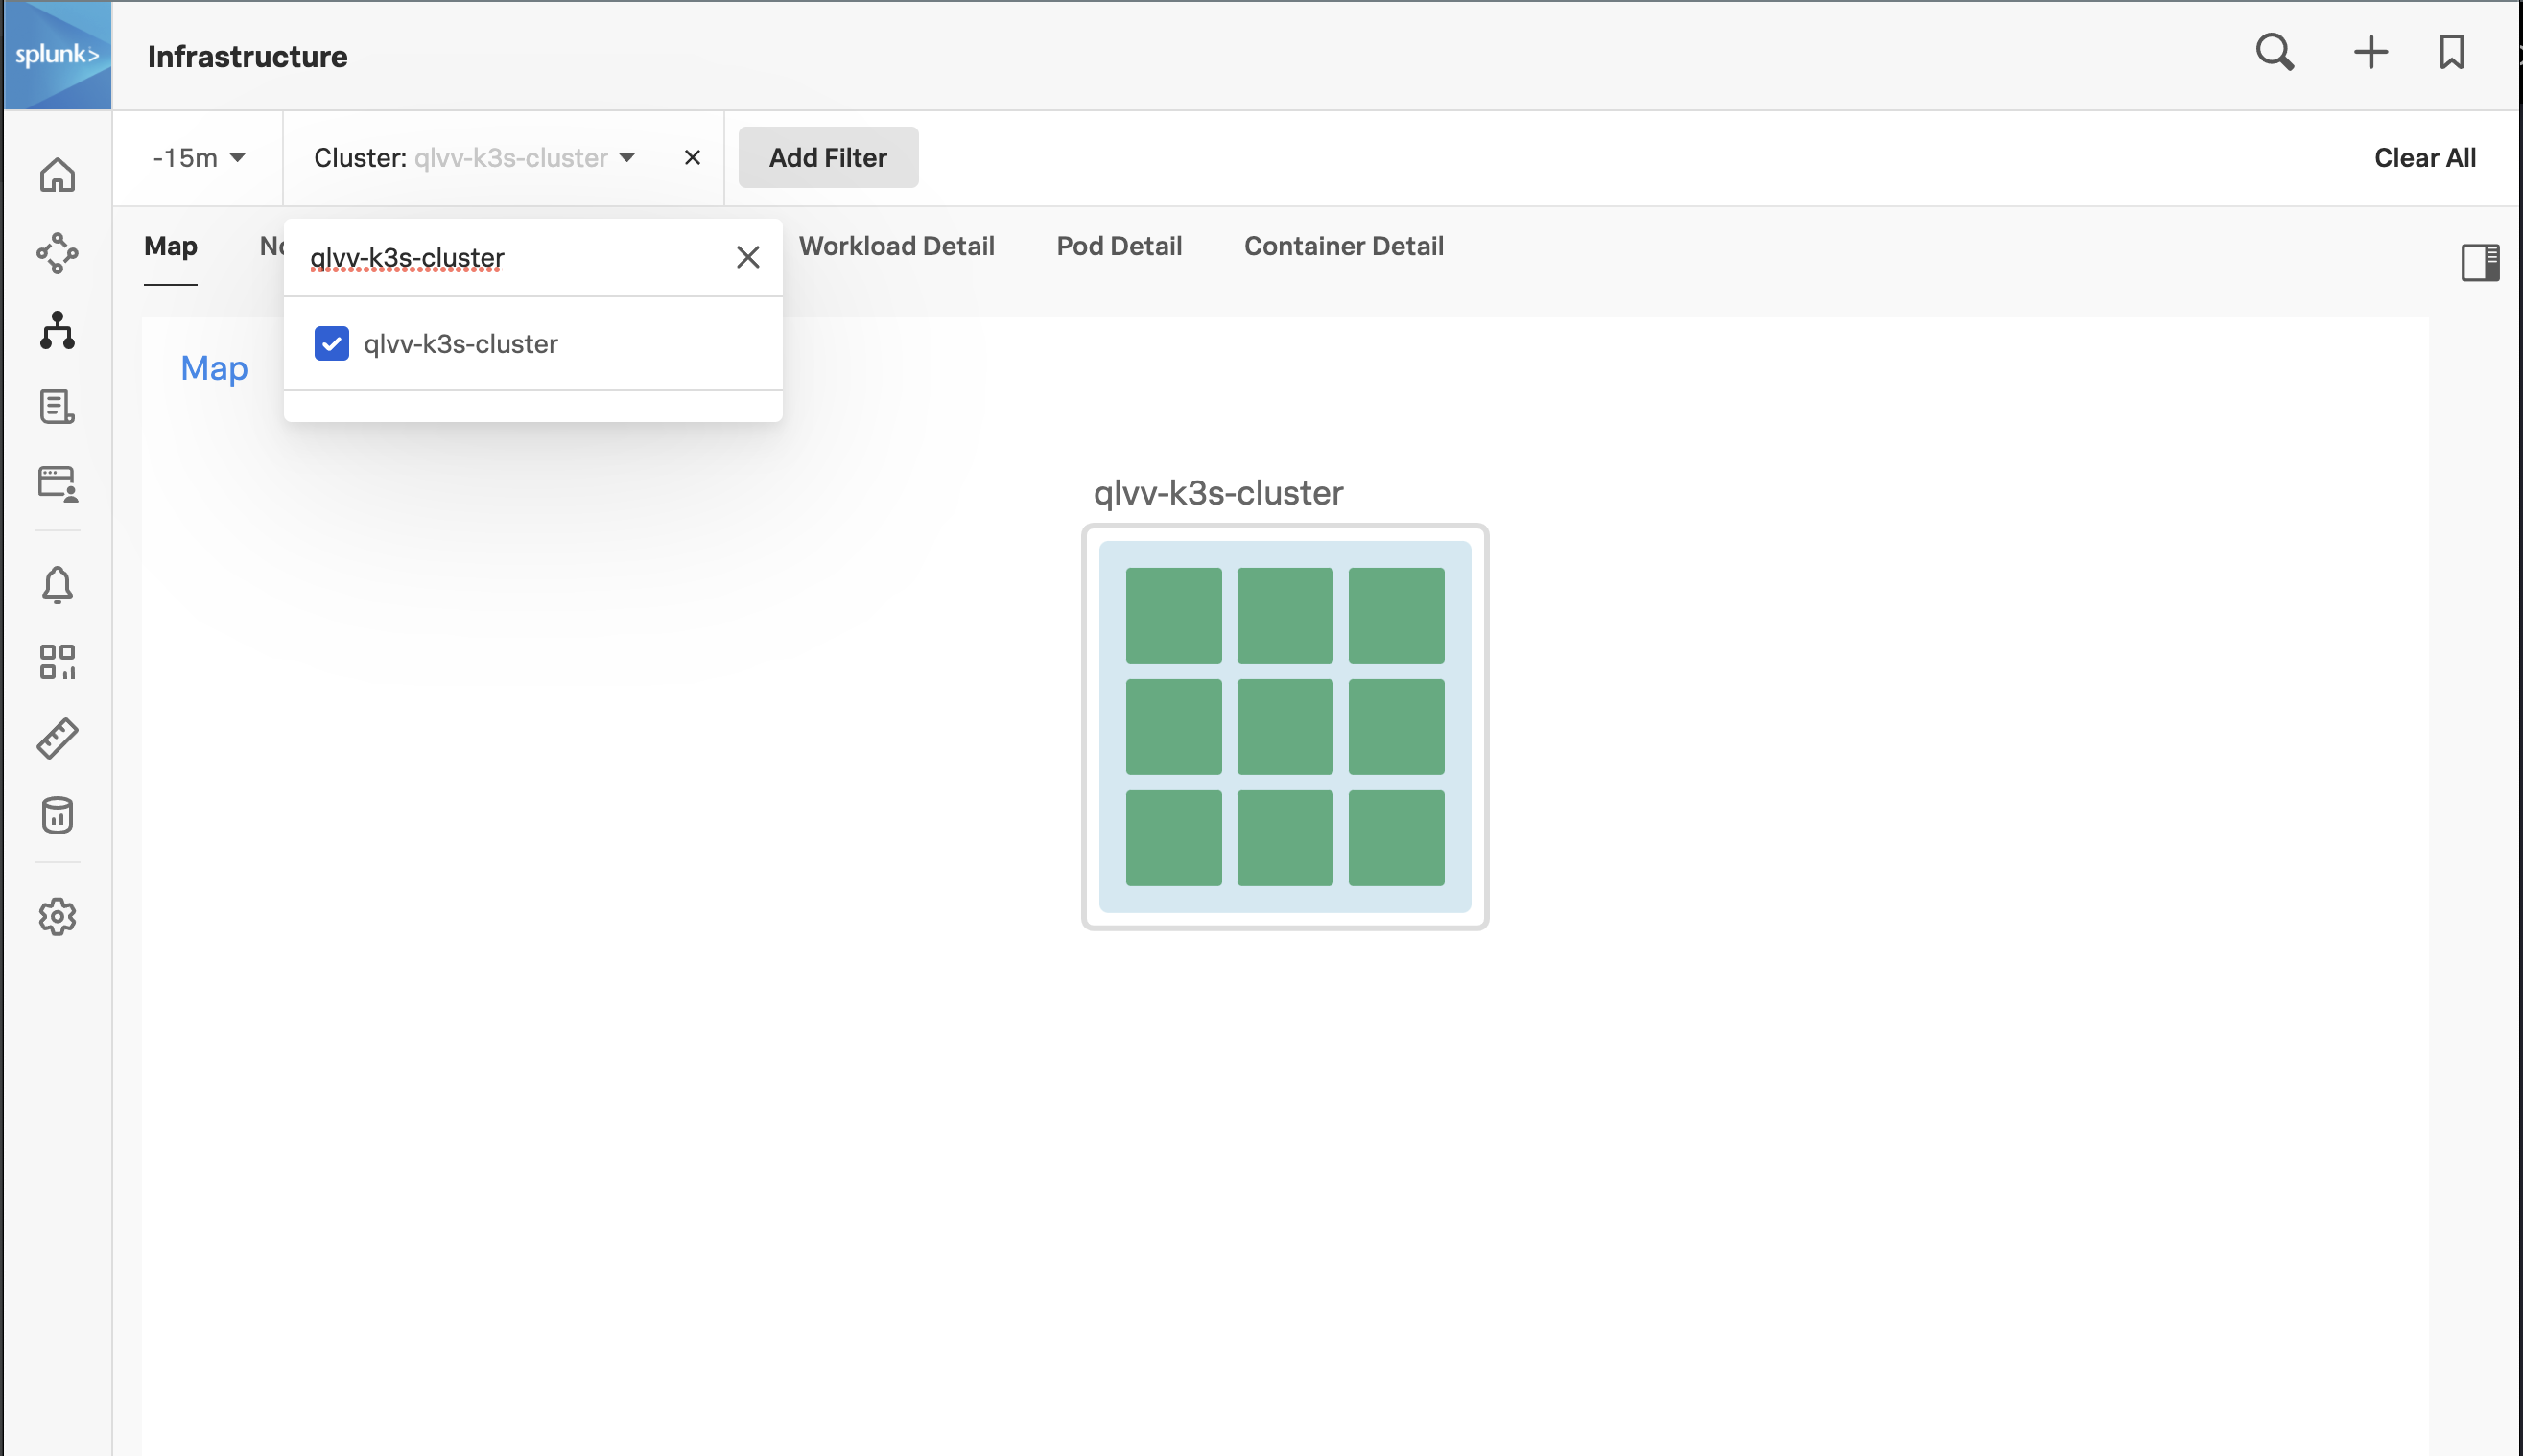
Validate that your cluster is discovered and reported by finding your cluster (in the workshop you will see many other clusters). To find your cluster name run the following command and copy the output to your clipboard:
echo$INSTANCE-k3s-cluster
Then in the UI, click on the “Cluster: - " menu just below the Splunk Logo, paste the Cluster name you just copied into the search box, click the box to select your cluster, and finally click off the menu into white space to apply the filter.
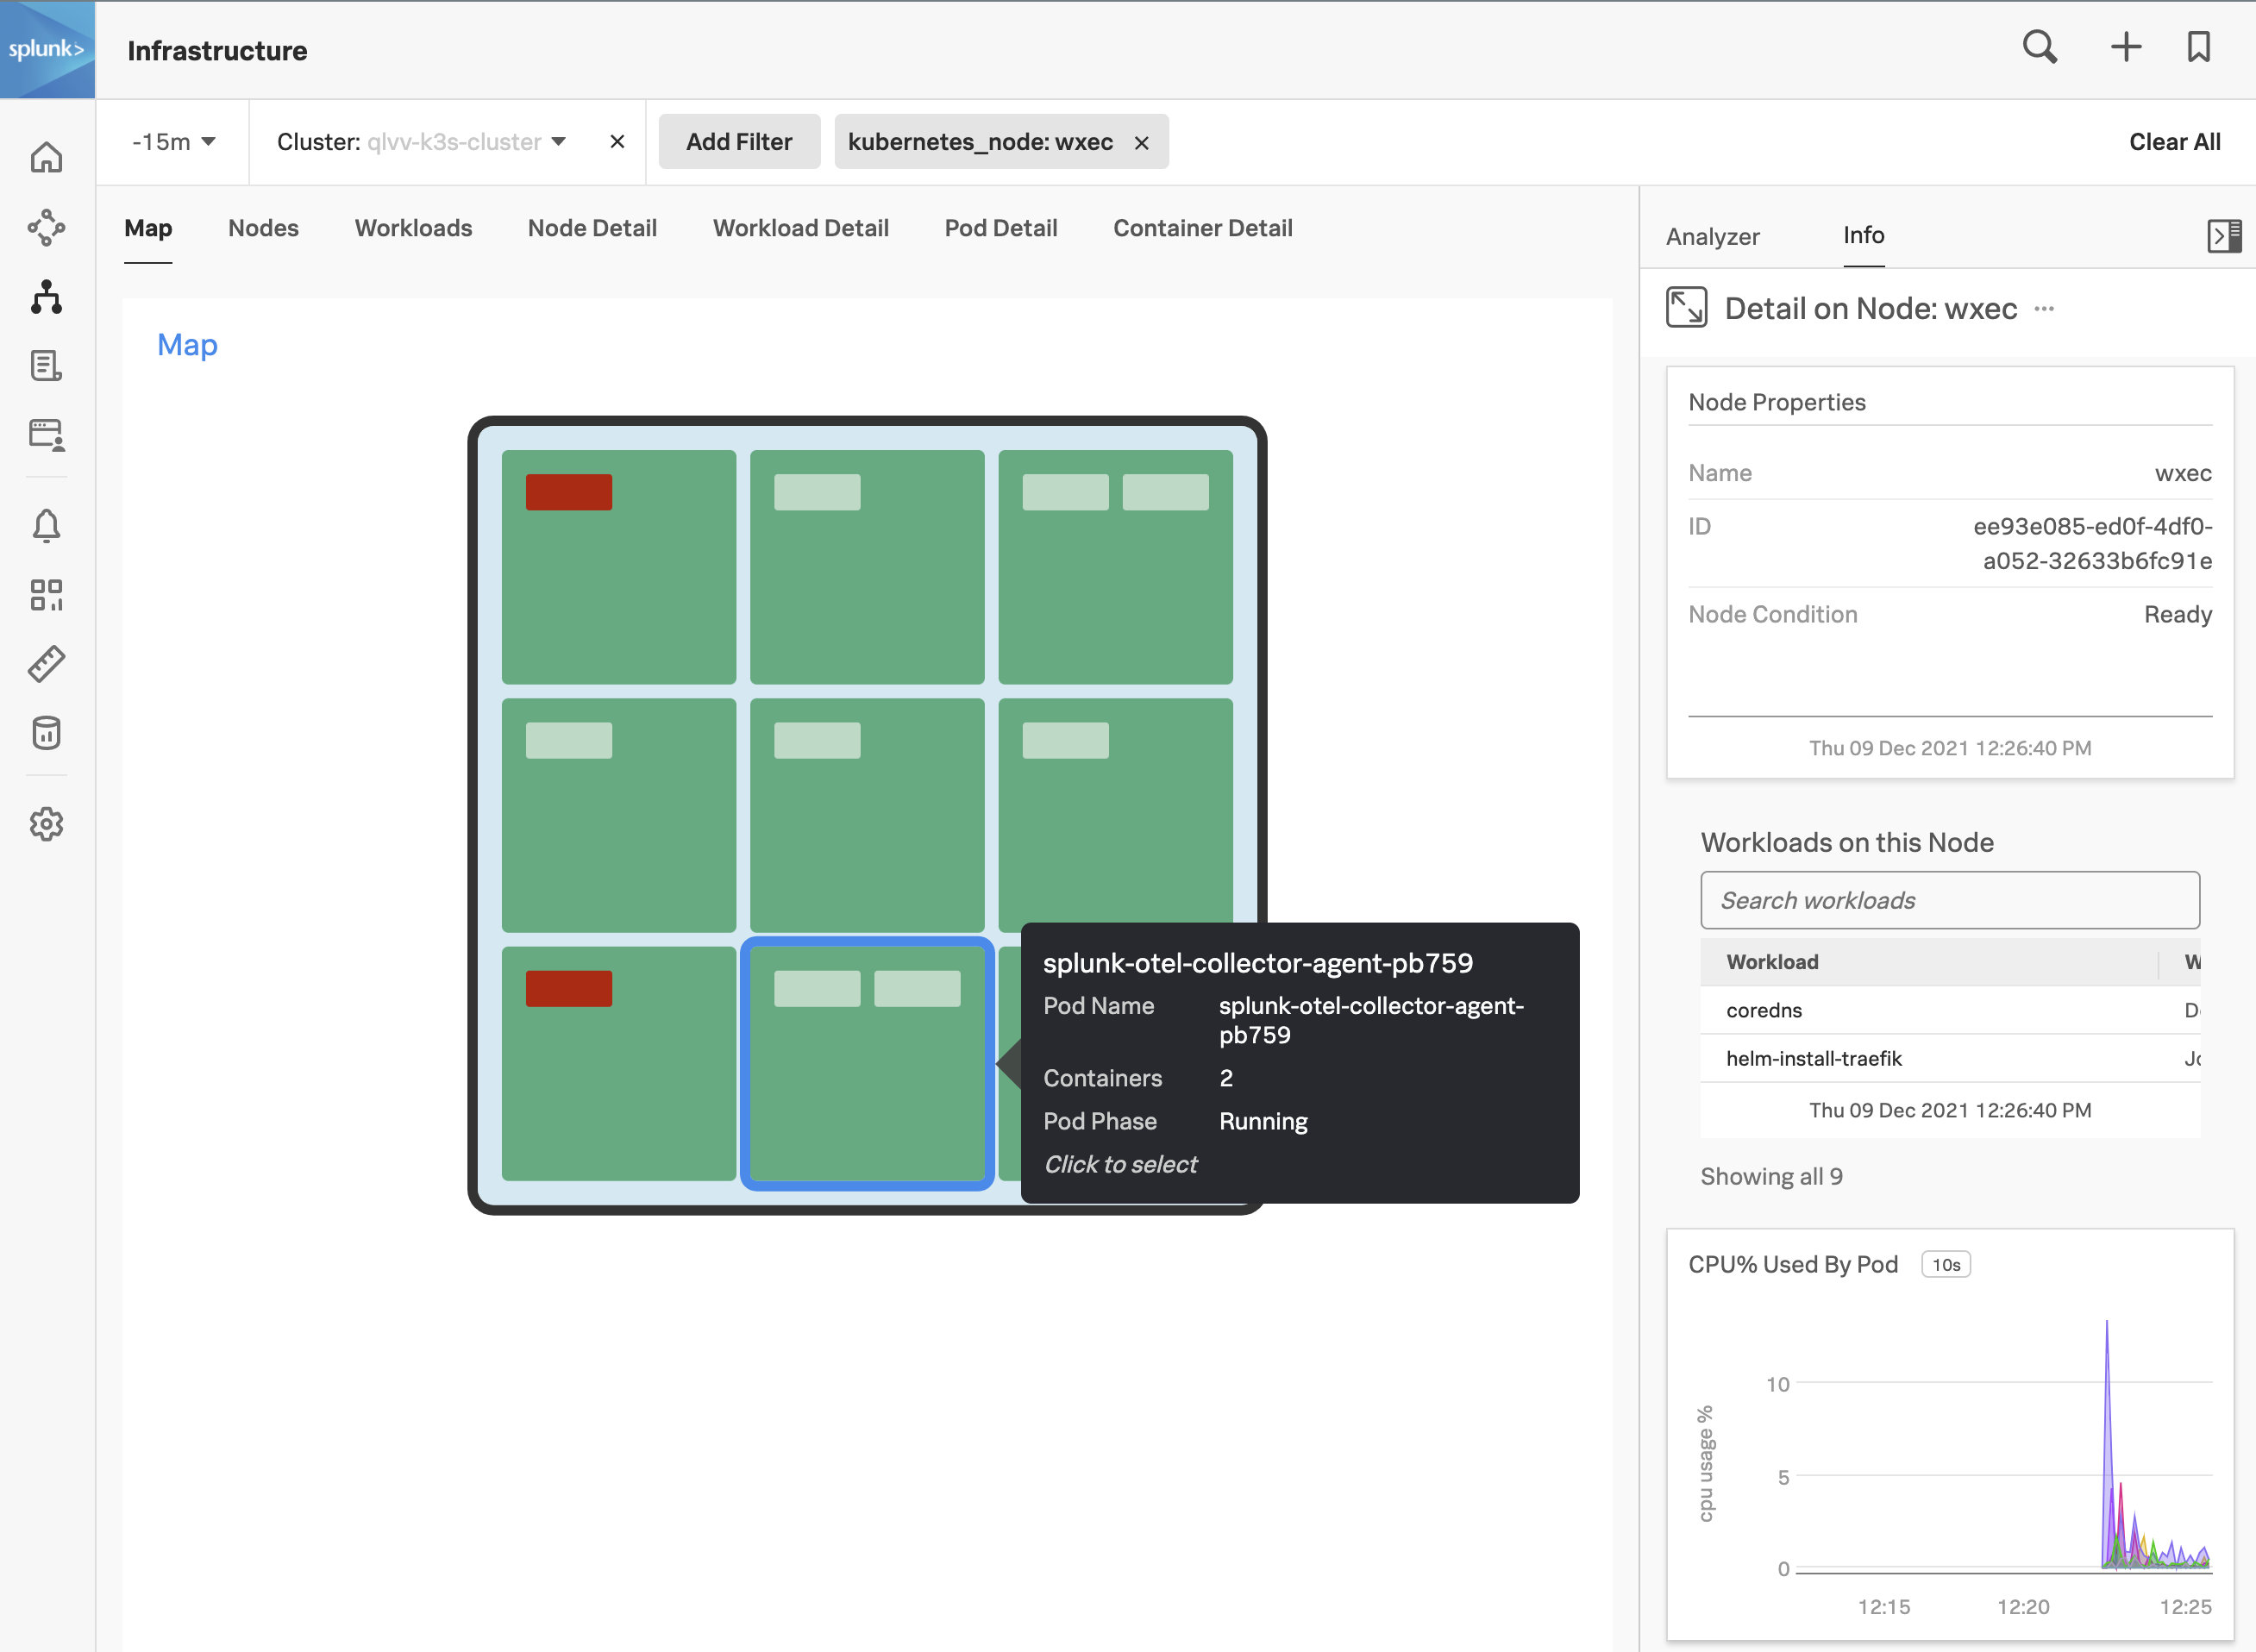
To examine the health of your node, hover over the pale blue background of your cluster, then click on the blue magnifying glass that appears in the top left-hand corner.
This will drill down to the node level. Next, open the Metrics sidebar by clicking on the sidebar button.
Once it is open, you can use the slider on the side to explore the various charts relevant to your cluster/node: CPU, Memory, Network, Events etc.
Subsections of Deploying the OpenTelemetry Collector in Kubernetes
Deploying NGINX in K3s
Deploy a NGINX ReplicaSet into your K3s cluster and confirm the discovery of your NGINX deployment.
Run a load test to create metrics and confirm them streaming into Splunk Observability Cloud!
1. Start your NGINX
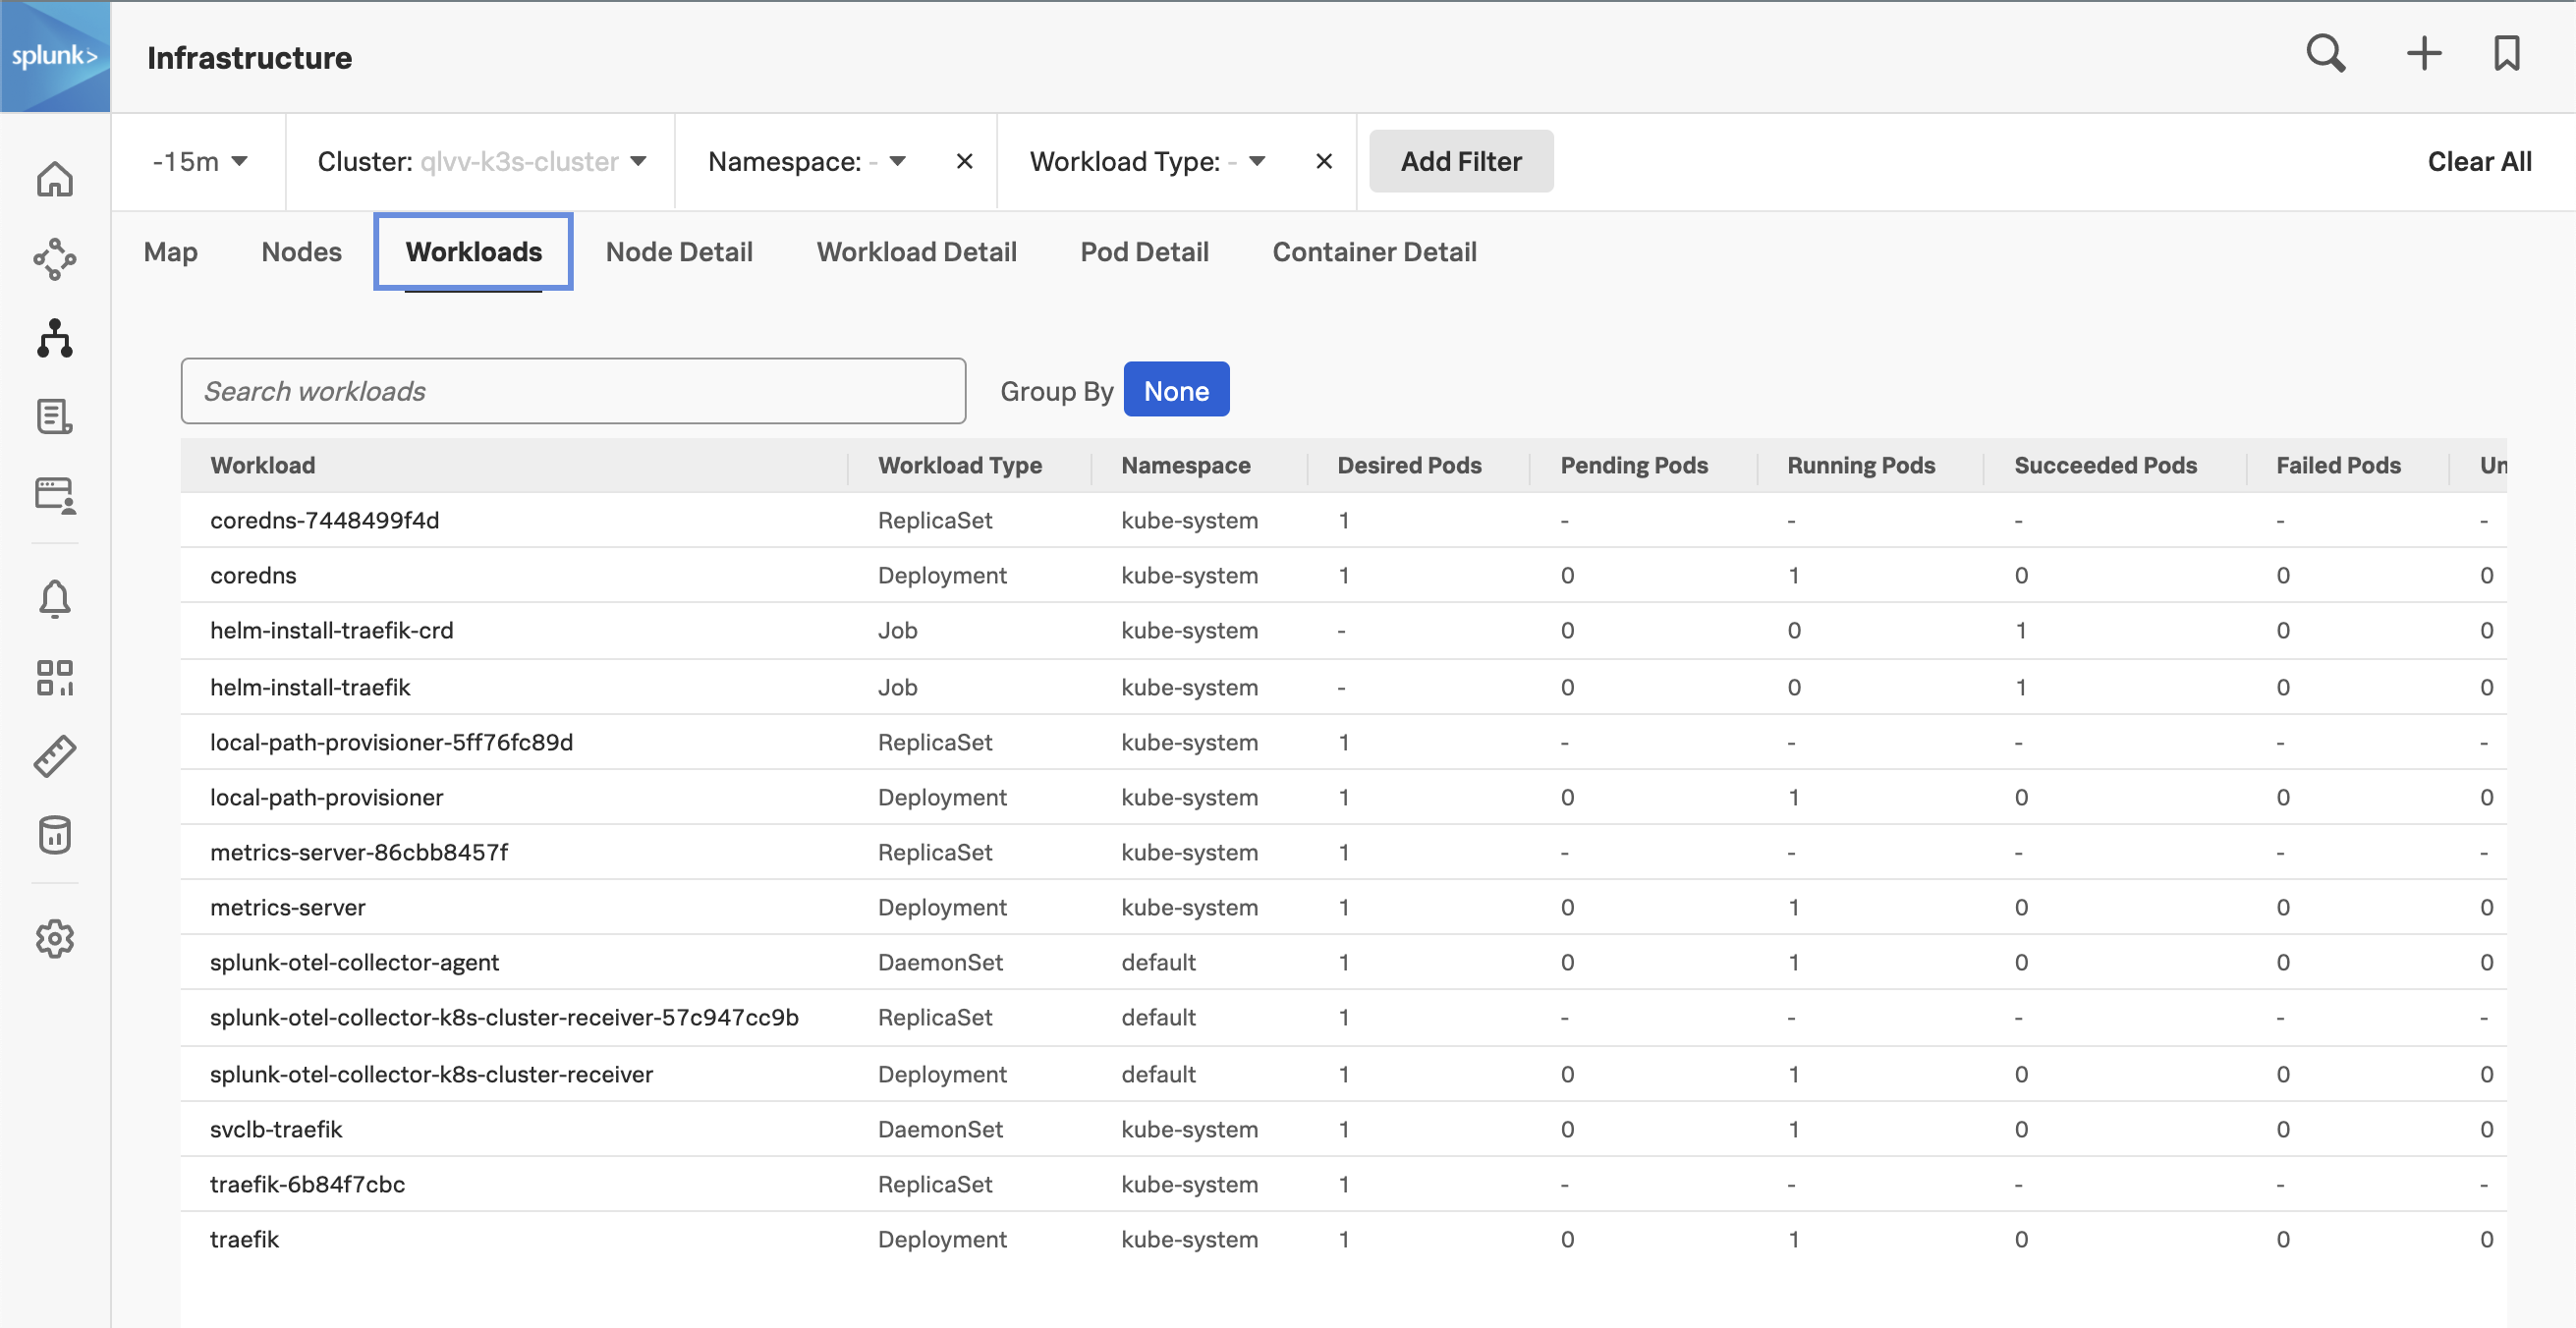
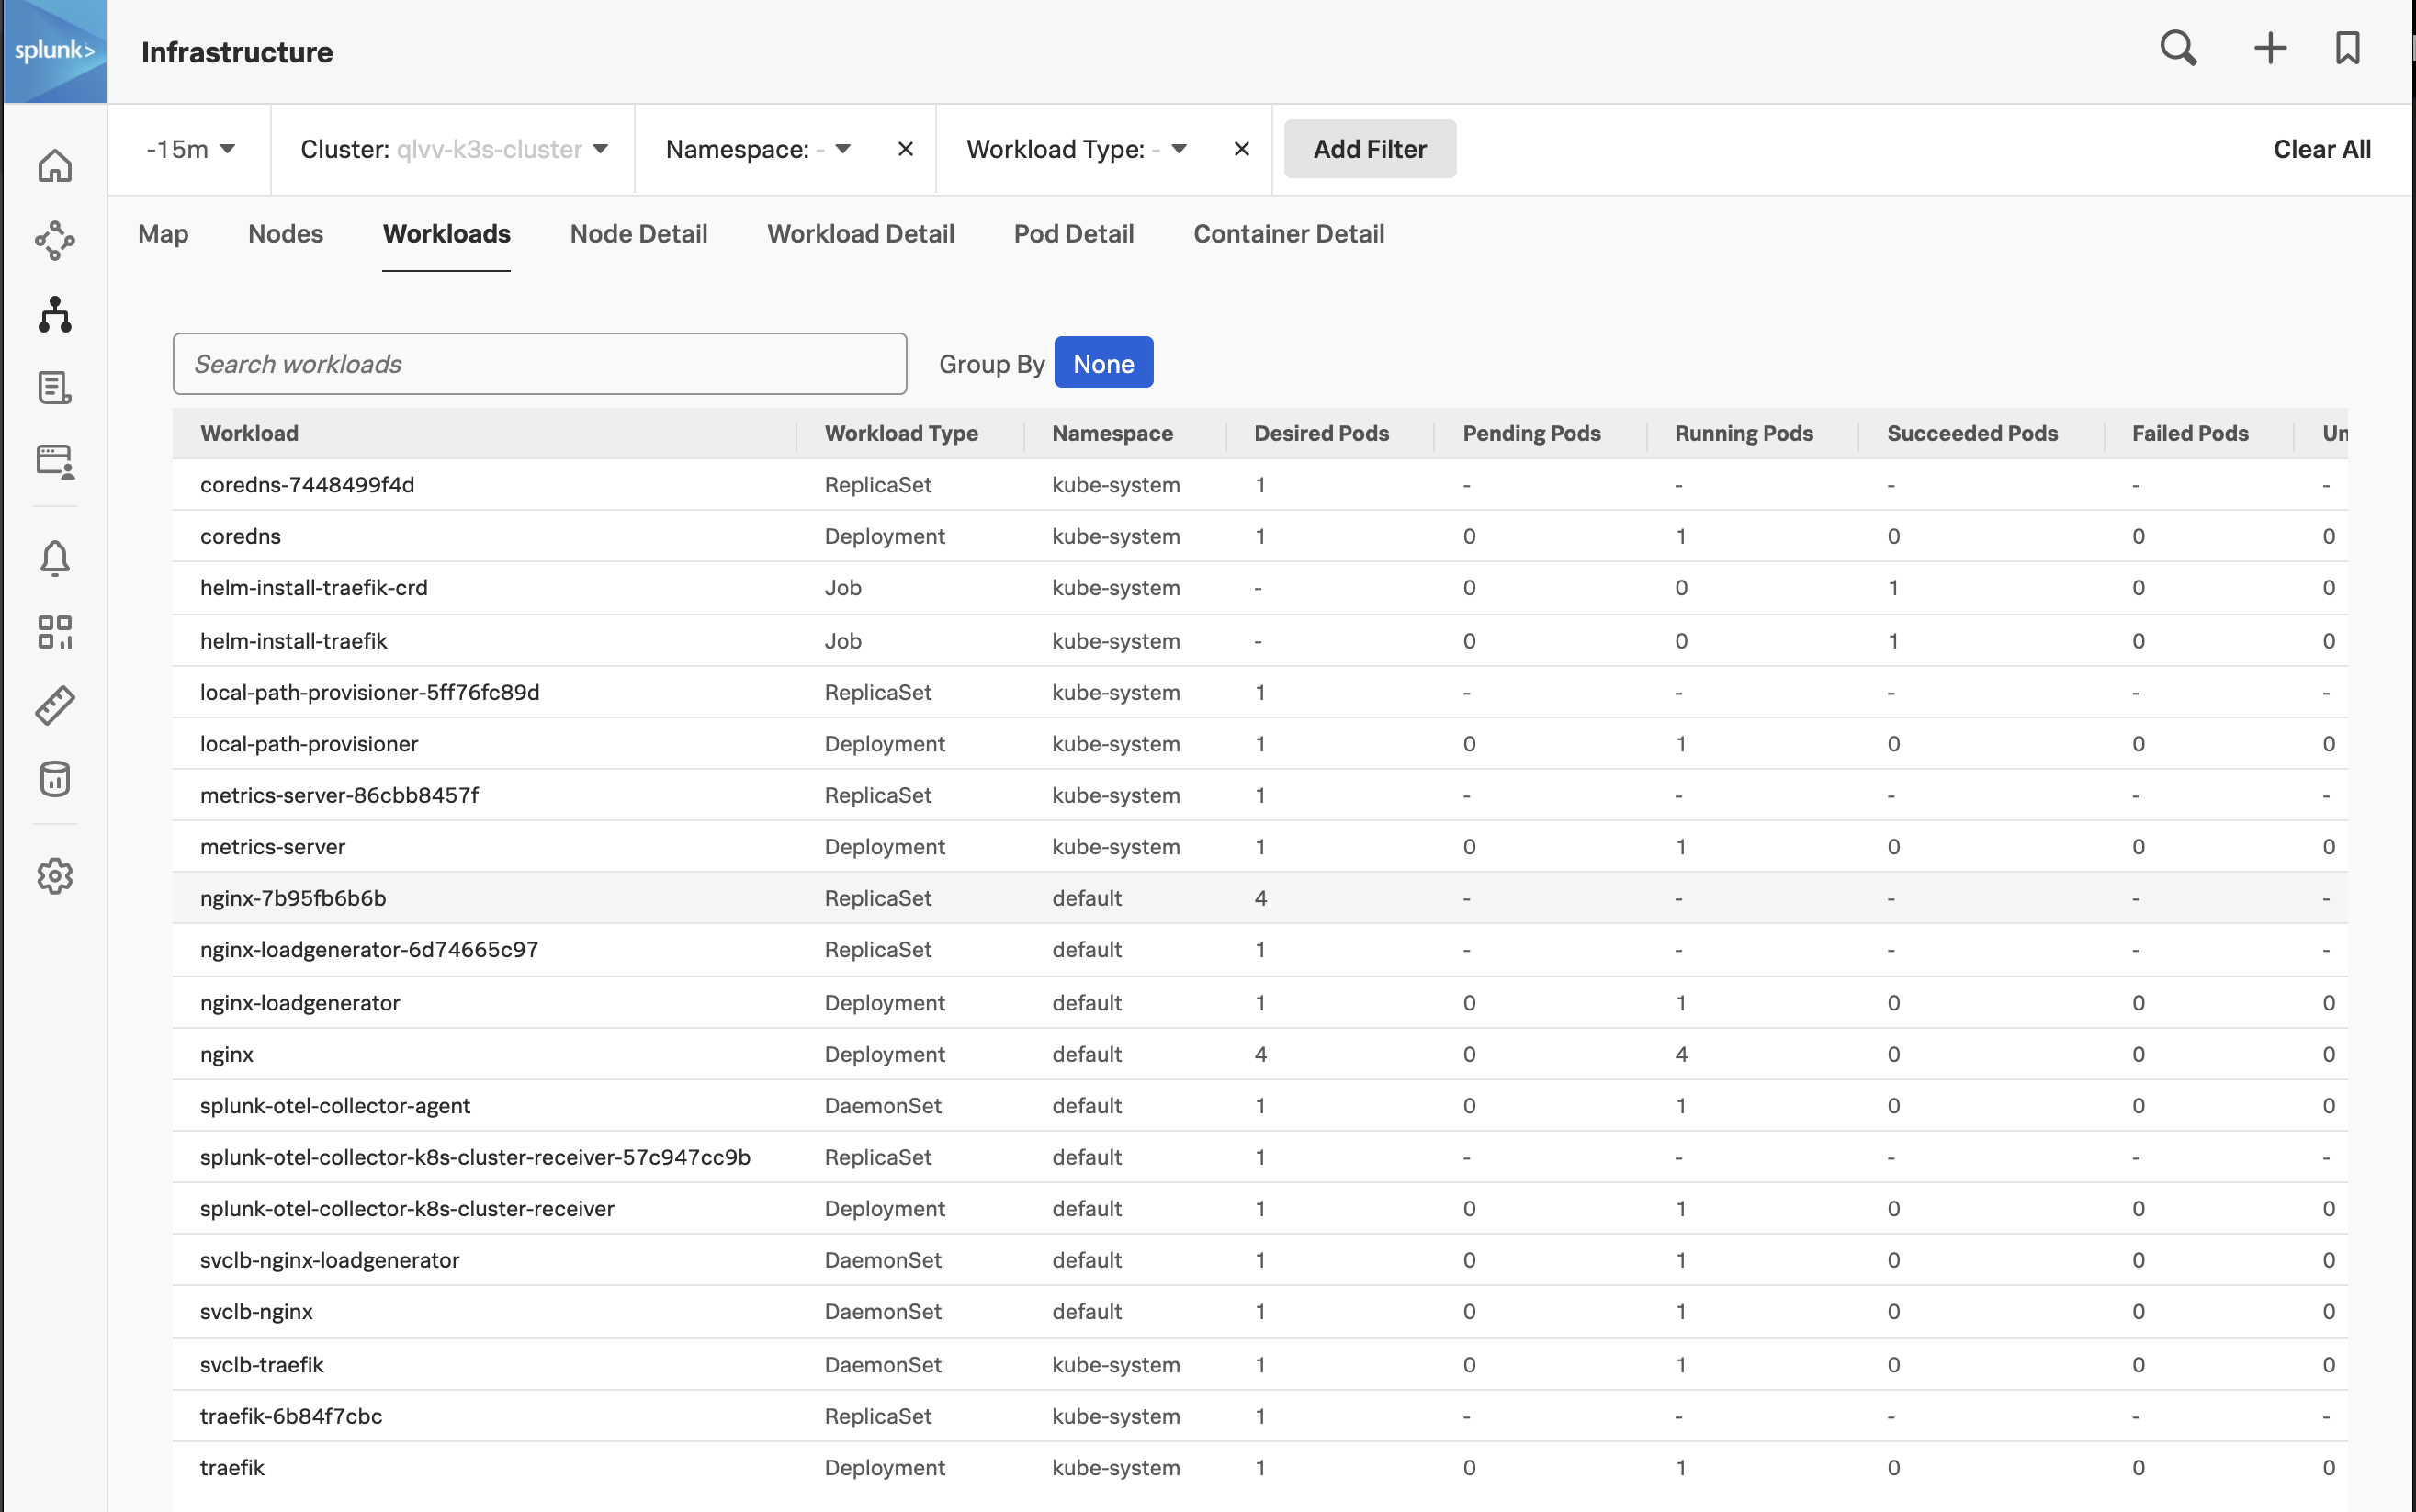
Verify the number of pods running in the Splunk UI by selecting the WORKLOADS tab. This should give you an overview of the workloads on your cluster.
Note the single agent container running per node among the default Kubernetes pods. This single container will monitor all the pods and services being deployed on this node!
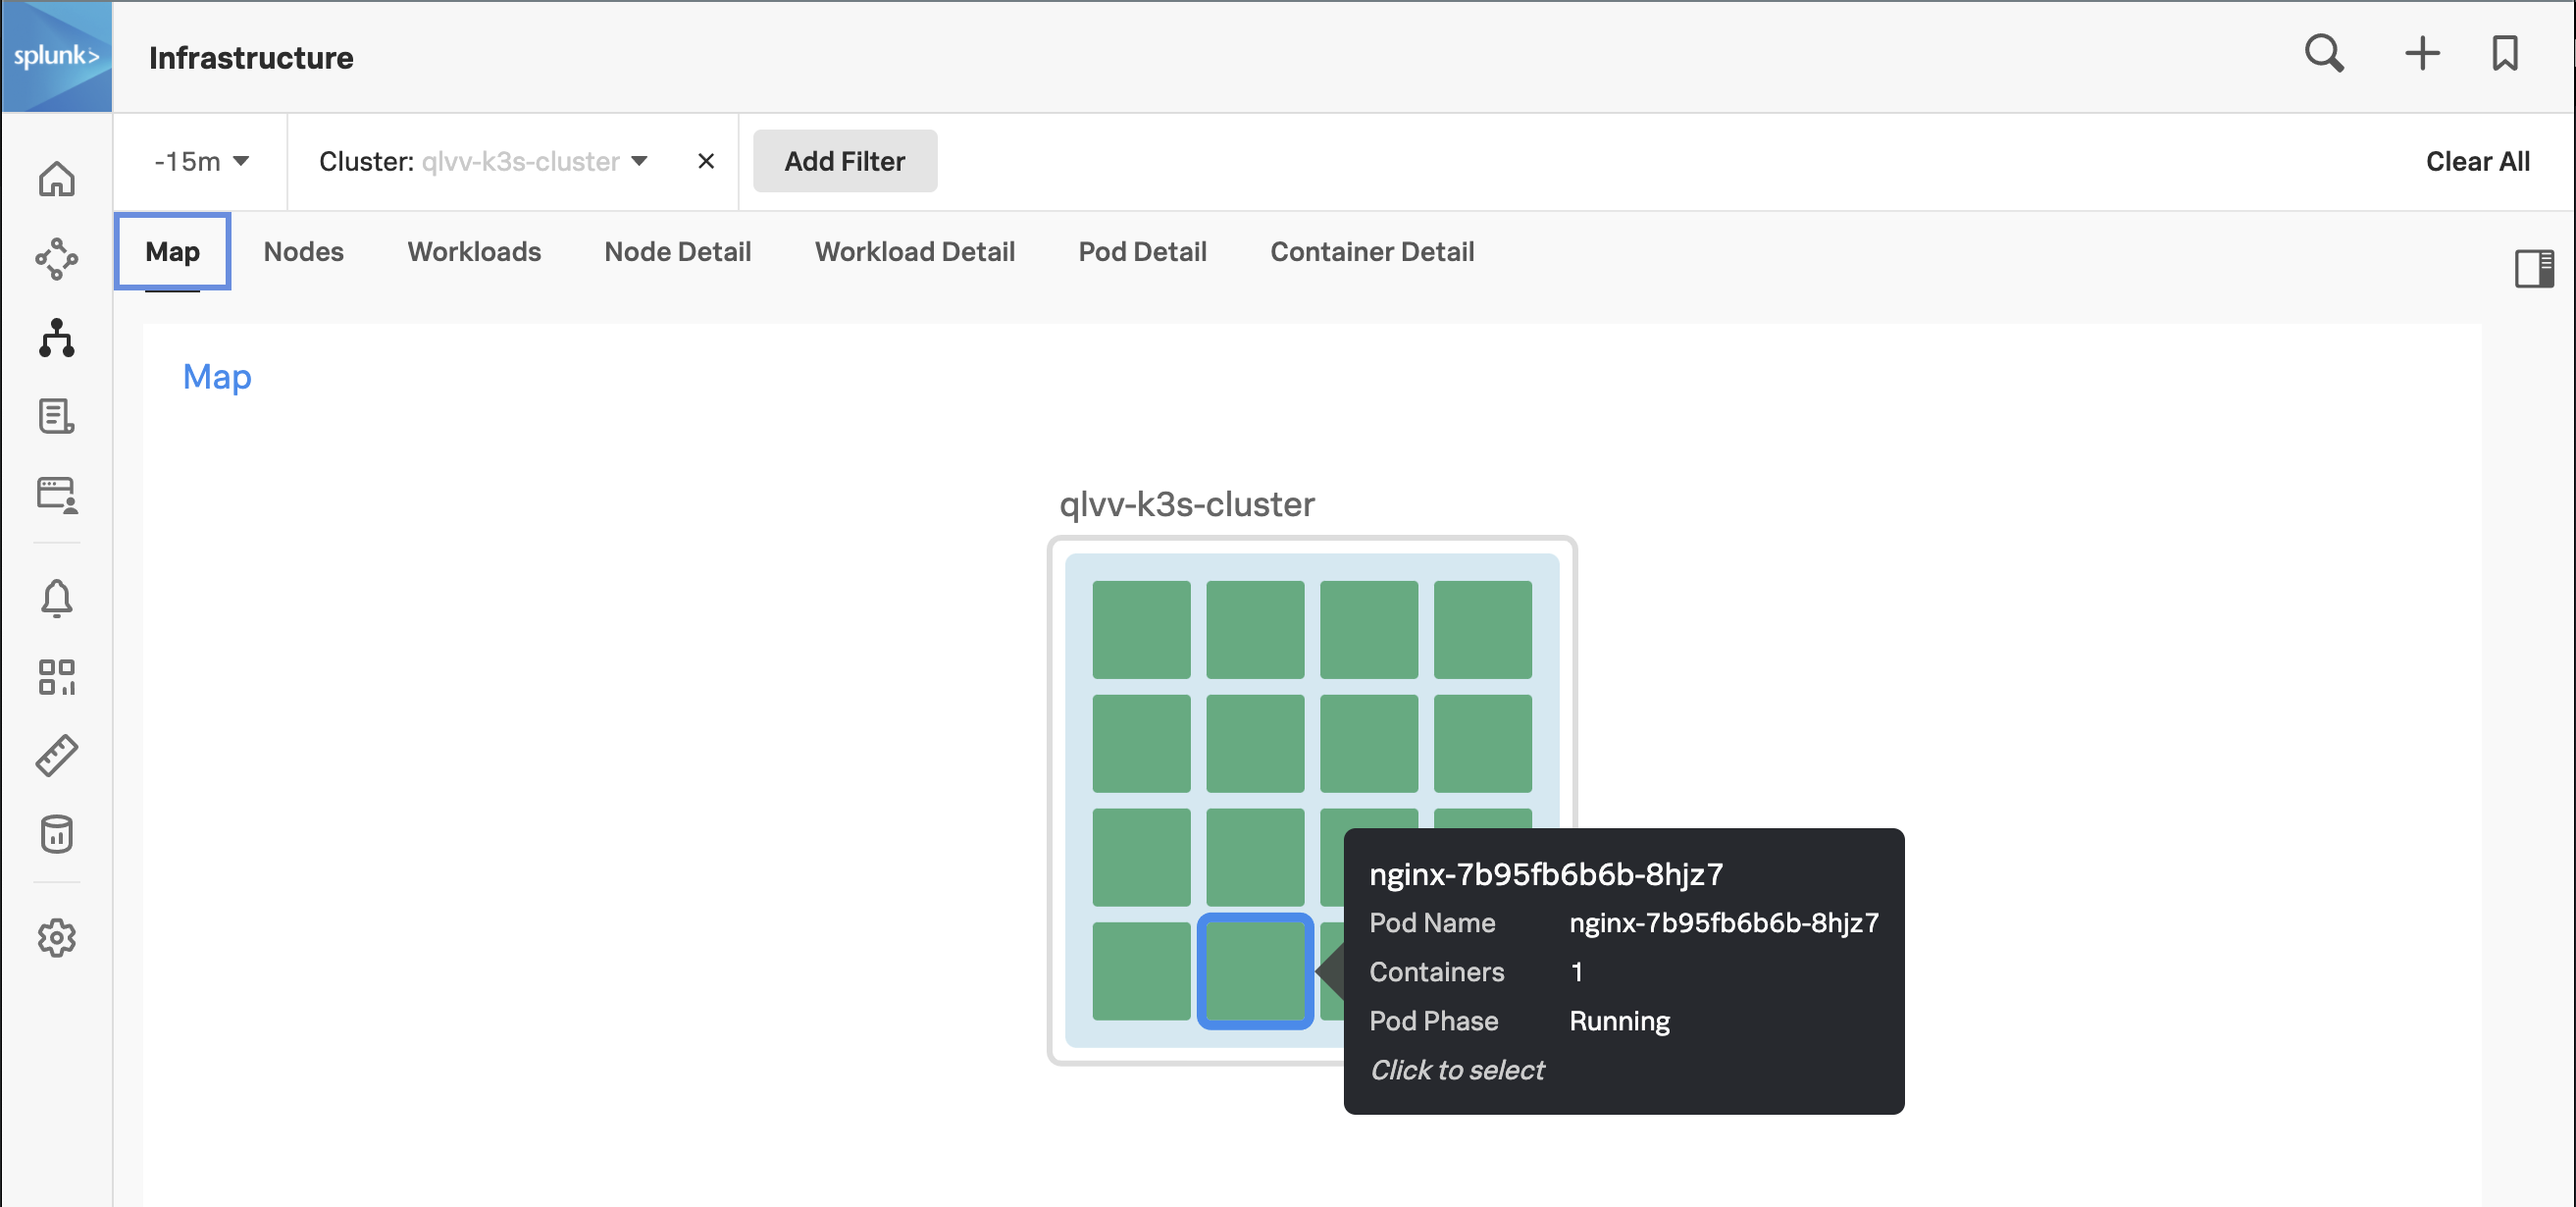
Now switch back to the default cluster node view by selecting the MAP tab and selecting your cluster again.
In your AWS/EC2 or Multipass shell session change into the nginx directory:
cd ~/workshop/k3s/nginx
2. Create NGINX deployment
Create the NGINX ConfigMap1 using the nginx.conf file:
deployment.apps/nginx created
service/nginx created
Next, we will deploy Locust2 which is an open-source tool used for creating a load test against NGINX:
kubectl create -f locust-deployment.yaml
deployment.apps/nginx-loadgenerator created
service/nginx-loadgenerator created
Validate the deployment has been successful and that the Locust and NGINX pods are running.
If you have the Splunk UI open you should see new Pods being started and containers being deployed.
It should only take around 20 seconds for the pods to transition into a Running state. In the Splunk UI you will have a cluster that looks like the screenshot below:
If you select the WORKLOADS tab again you will now see that there is a new ReplicaSet and a deployment added for NGINX:
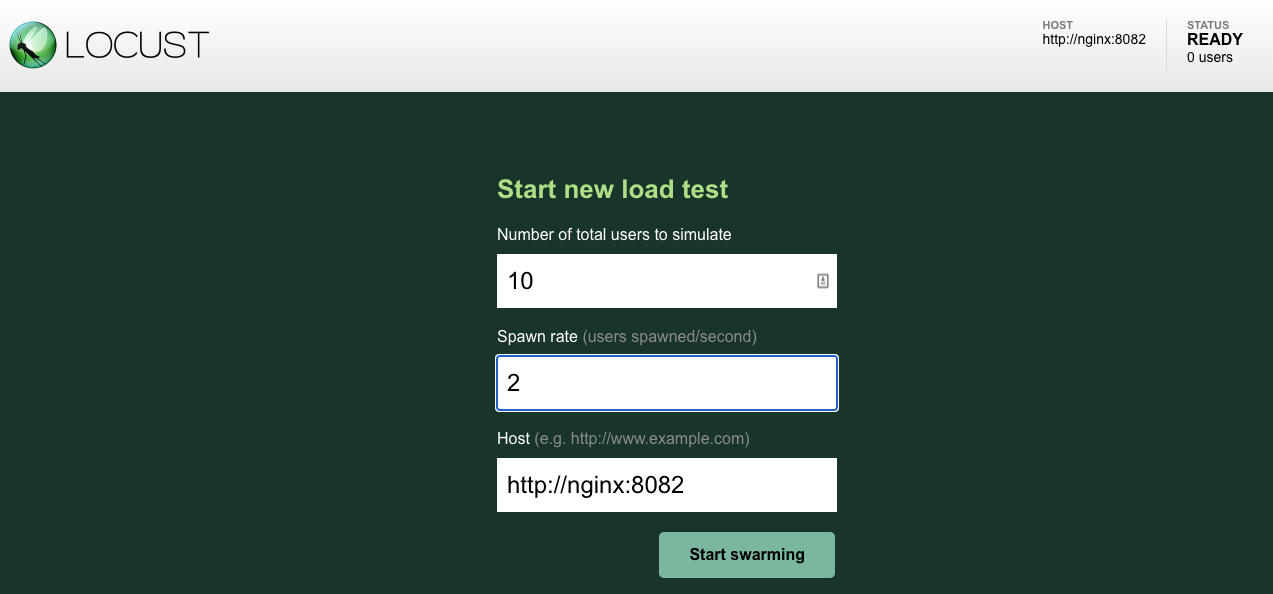
Locust, an open-source load generator, is available on port 8083 of the EC2 instance’s IP address. Open a new tab in your web browser and go to http://{==EC2-IP==}:8083/, you will then be able to see the Locust running.
Set the Spawn rate to 2 and click Start Swarming.
This will start a gentle continuous load on the application.
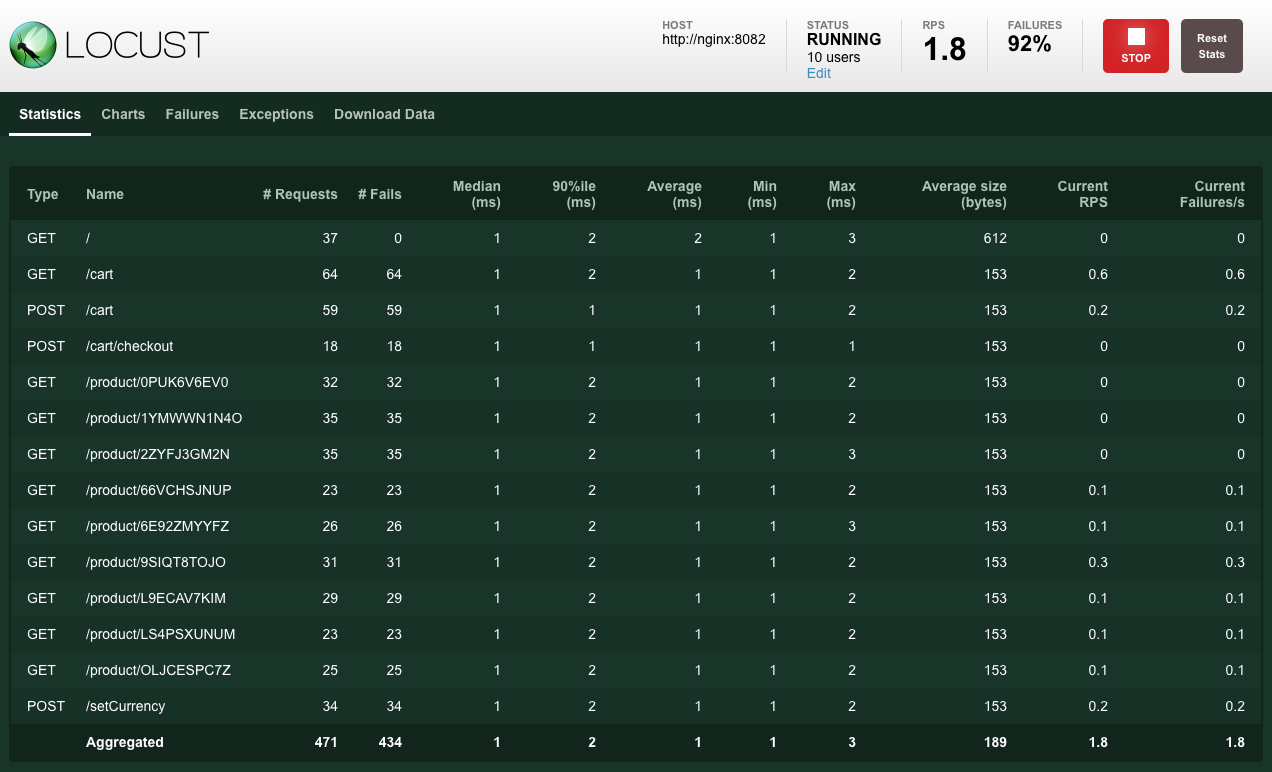
As you can see from the above screenshot, most of the calls will report a fail, this is expected, as we have not yet deployed the application behind it, however, NGINX is reporting on your attempts and you should be able to see those metrics.
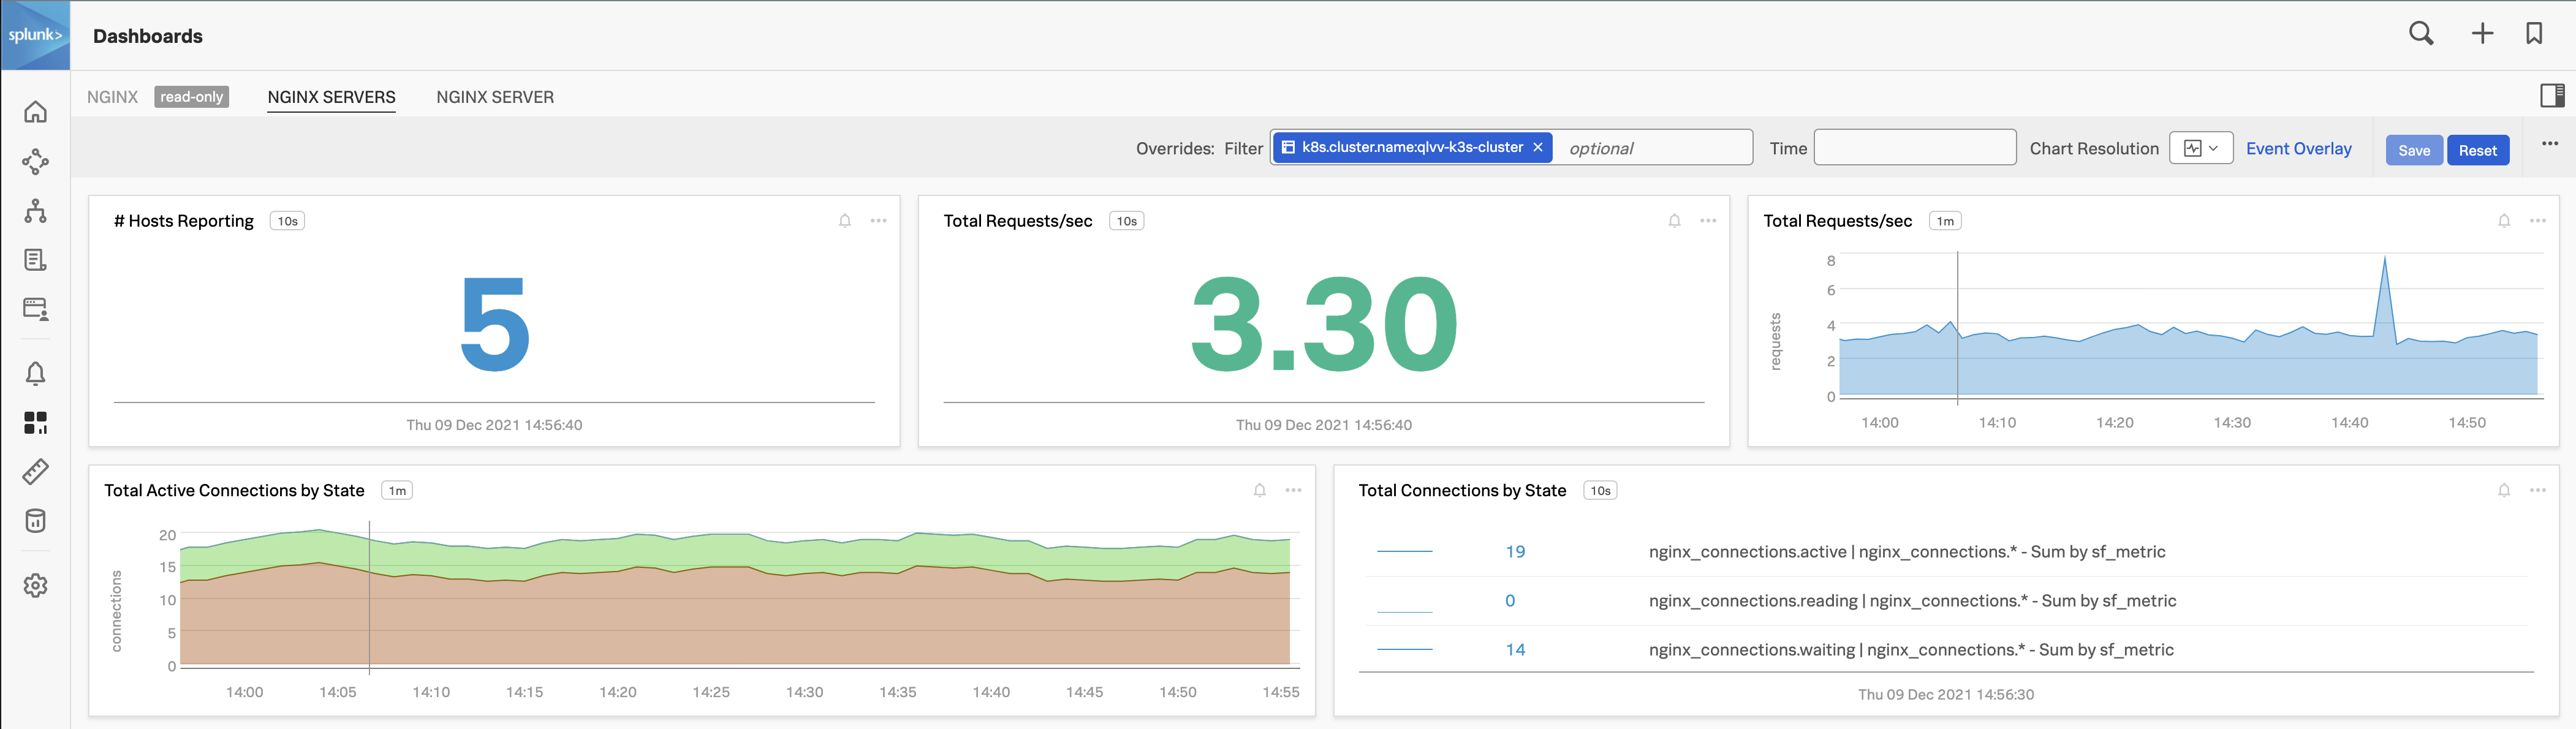
Validate you are seeing those metrics in the UI by selecting Dashboards → Built-in Dashboard Groups → NGINX → NGINX Servers. Using the Overrides filter on k8s.cluster.name:, find the name of your cluster as returned by echo $INSTANCE-k3s-cluster in the terminal.
A ConfigMap is an API object used to store non-confidential data in key-value pairs. Pods can consume ConfigMaps as environment variables, command-line arguments, or configuration files in a volume. A ConfigMap allows you to decouple environment-specific configuration from your container images so that your applications are easily portable. ↩︎
Dashboards are groupings of charts and visualizations of metrics. Well-designed dashboards can provide useful and actionable insight into your system at a glance. Dashboards can be complex or contain just a few charts that drill down only into the data you want to see.
During this module, we are going to create the following charts and dashboard and connect them to your Team page.
2. Your Teams’ Page
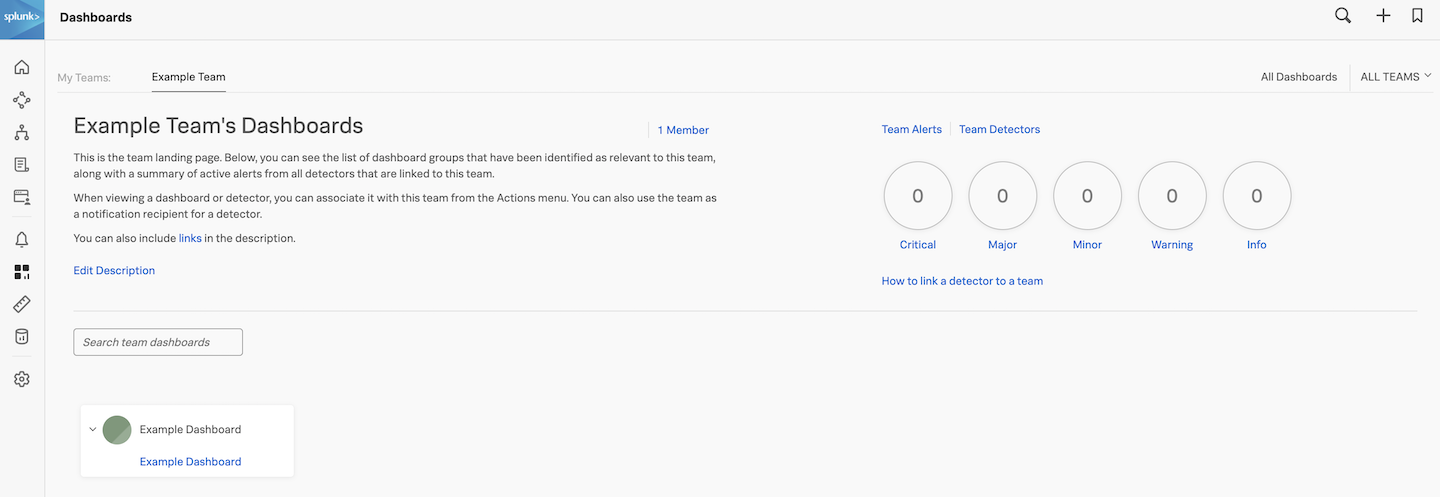
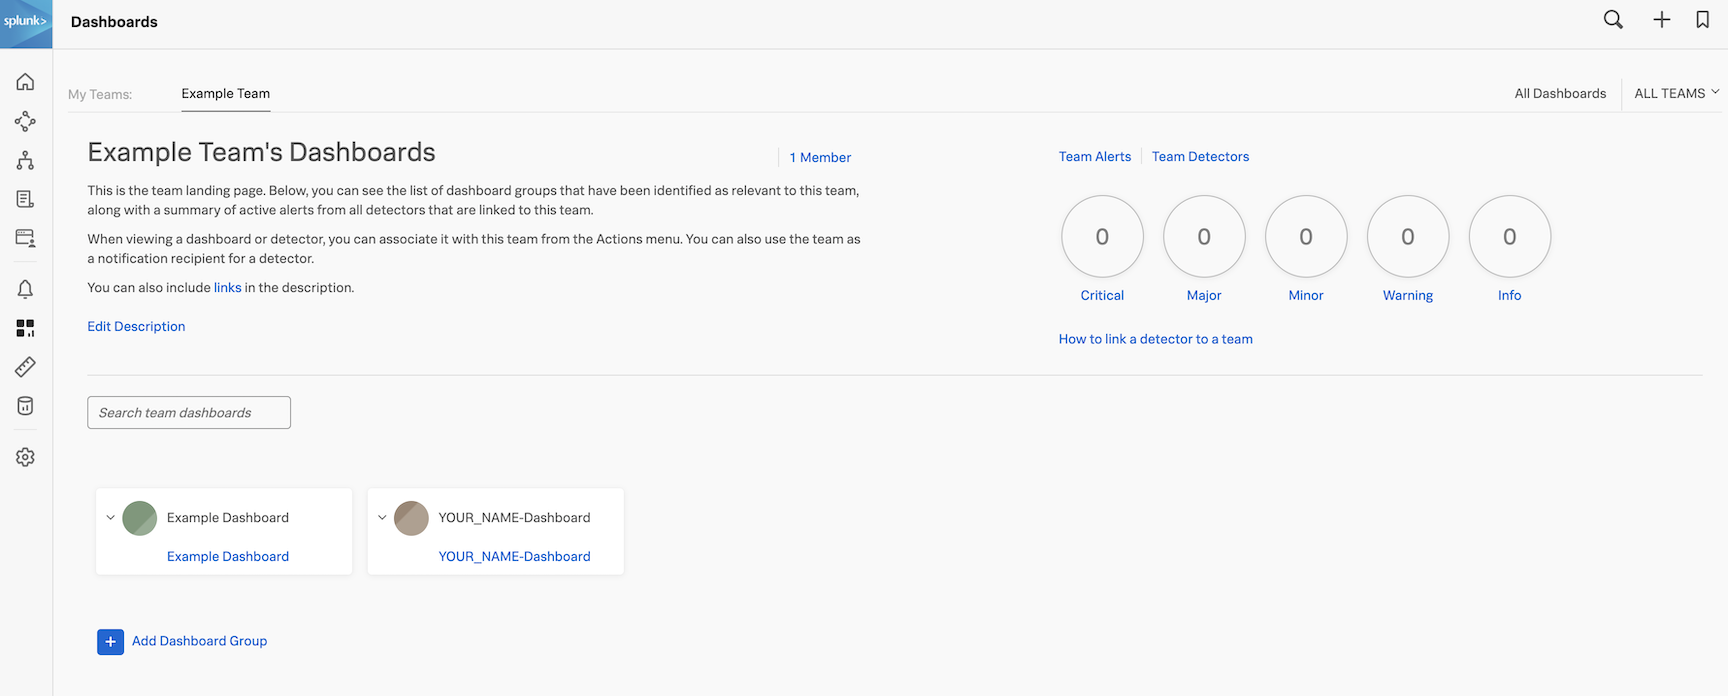
Click on the from the navbar. As you have already been assigned to a team, you will land on the team dashboard. We use the Example Team as an example here. The one in your workshop will be different!
This page shows the total number of team members, how many active alerts for your team and all dashboards that are assigned to your team. Right now there are no dashboards assigned but as stated before, we will add the new dashboard that you will create to your Teams page later.
3. Sample Charts
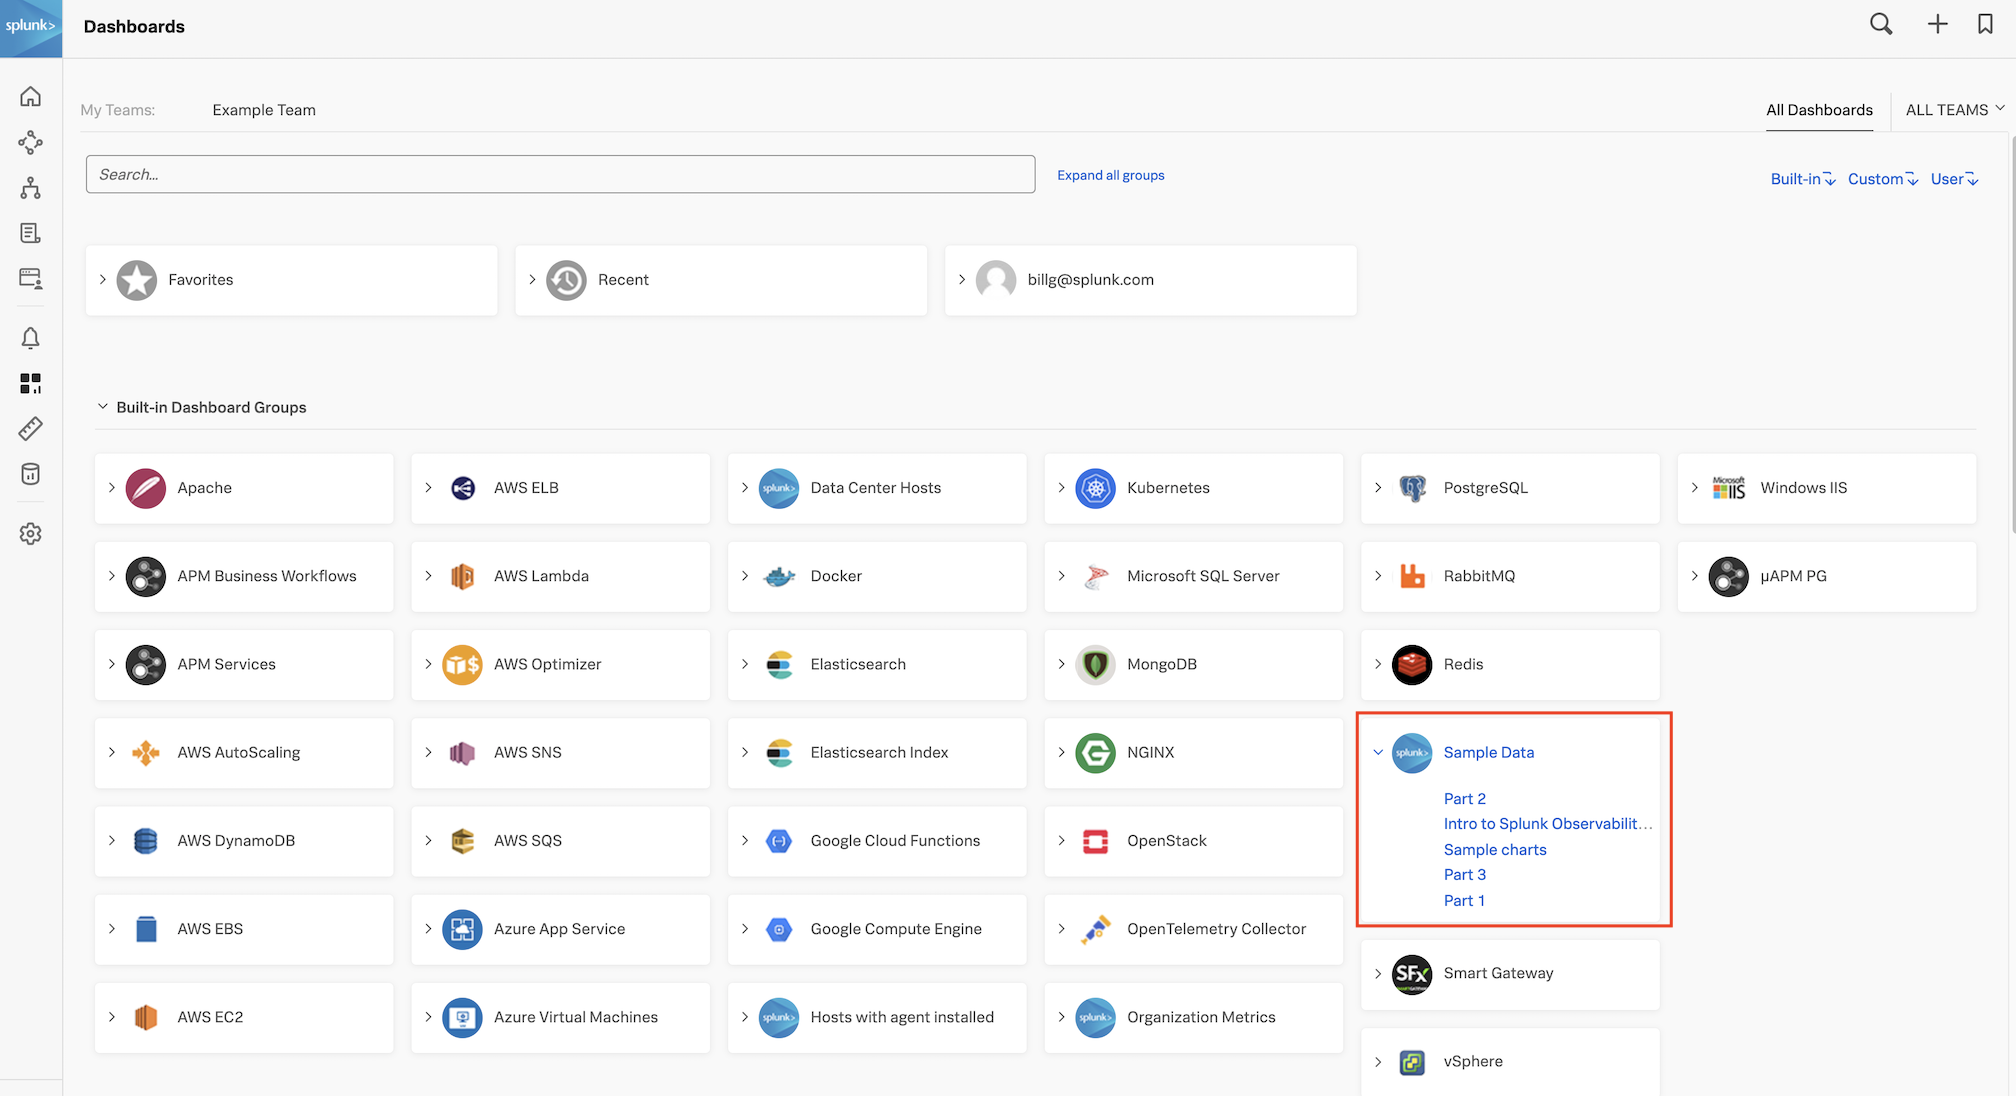
To continue, click on All Dashboards in the top right corner of the screen. This brings you to the view that shows all the available dashboards, including the pre-built ones.
If you are already receiving metrics from a Cloud API integration or another service through the Splunk Agent you will see relevant dashboards for these services.
4. Inspecting the Sample Data
Among the dashboards, you will see a Dashboard group called Sample Data. Expand the Sample Data dashboard group by clicking on it, and then click on the Sample Charts dashboard.
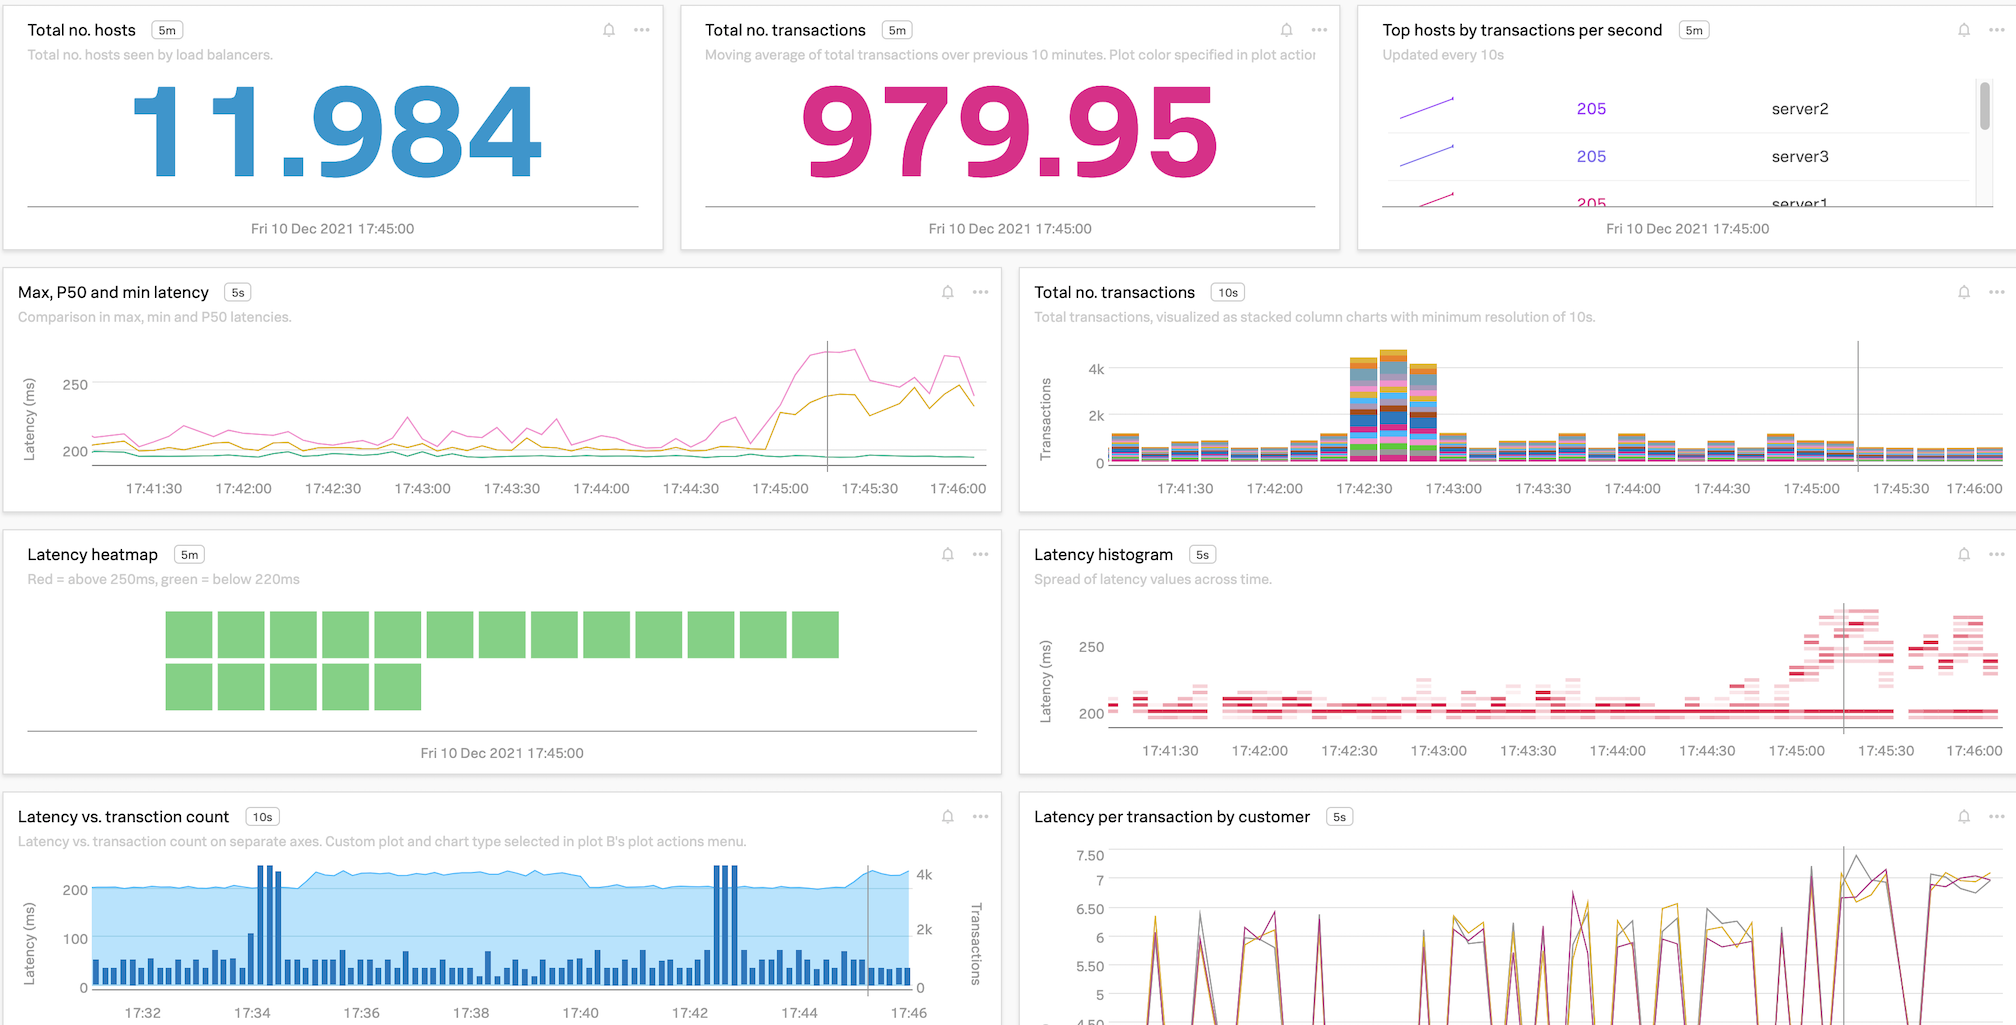
In the Sample Charts dashboard, you can see a selection of charts that show a sample of the various styles, colors and formats you can apply to your charts in the dashboards.
Have a look through all the dashboards in this dashboard group (PART 1, PART 2, PART 3 and INTRO TO SPLUNK OBSERVABILITY CLOUD)
Subsections of Working with Dashboards
Editing charts
1. Editing a chart
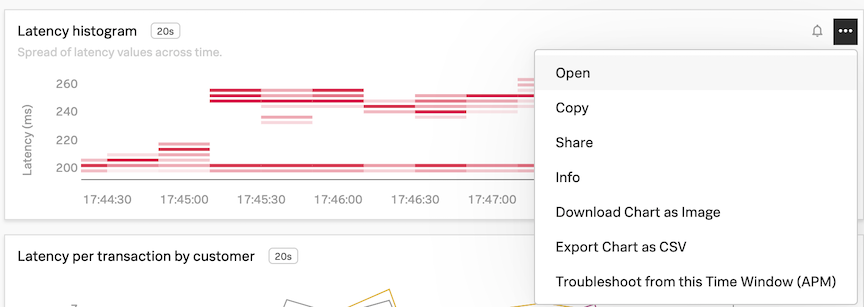
Select the SAMPLE CHARTS dashboard and then click on the three dots ... on the Latency histogram chart, then on Open (or you can click on the name of the chart which here is Latency histogram).
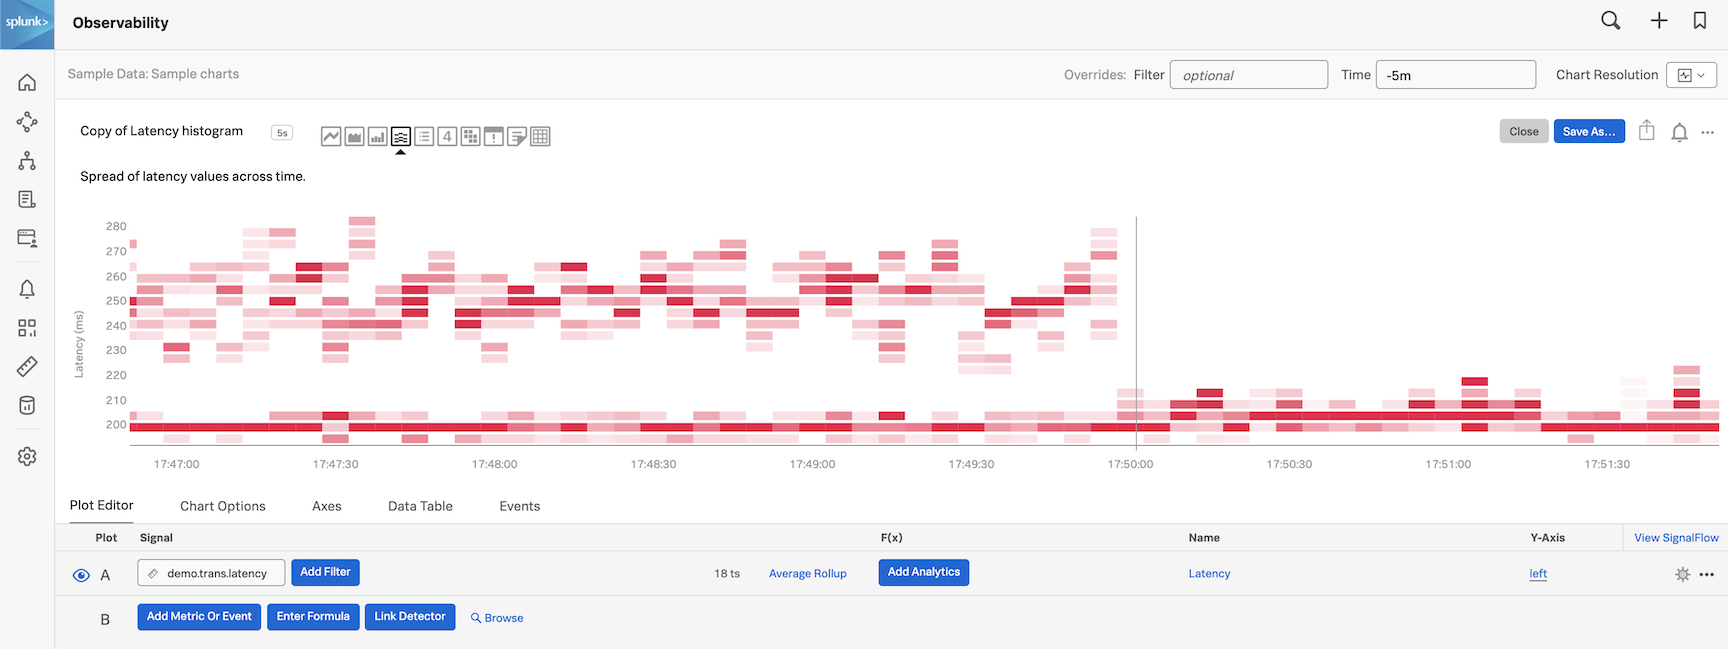
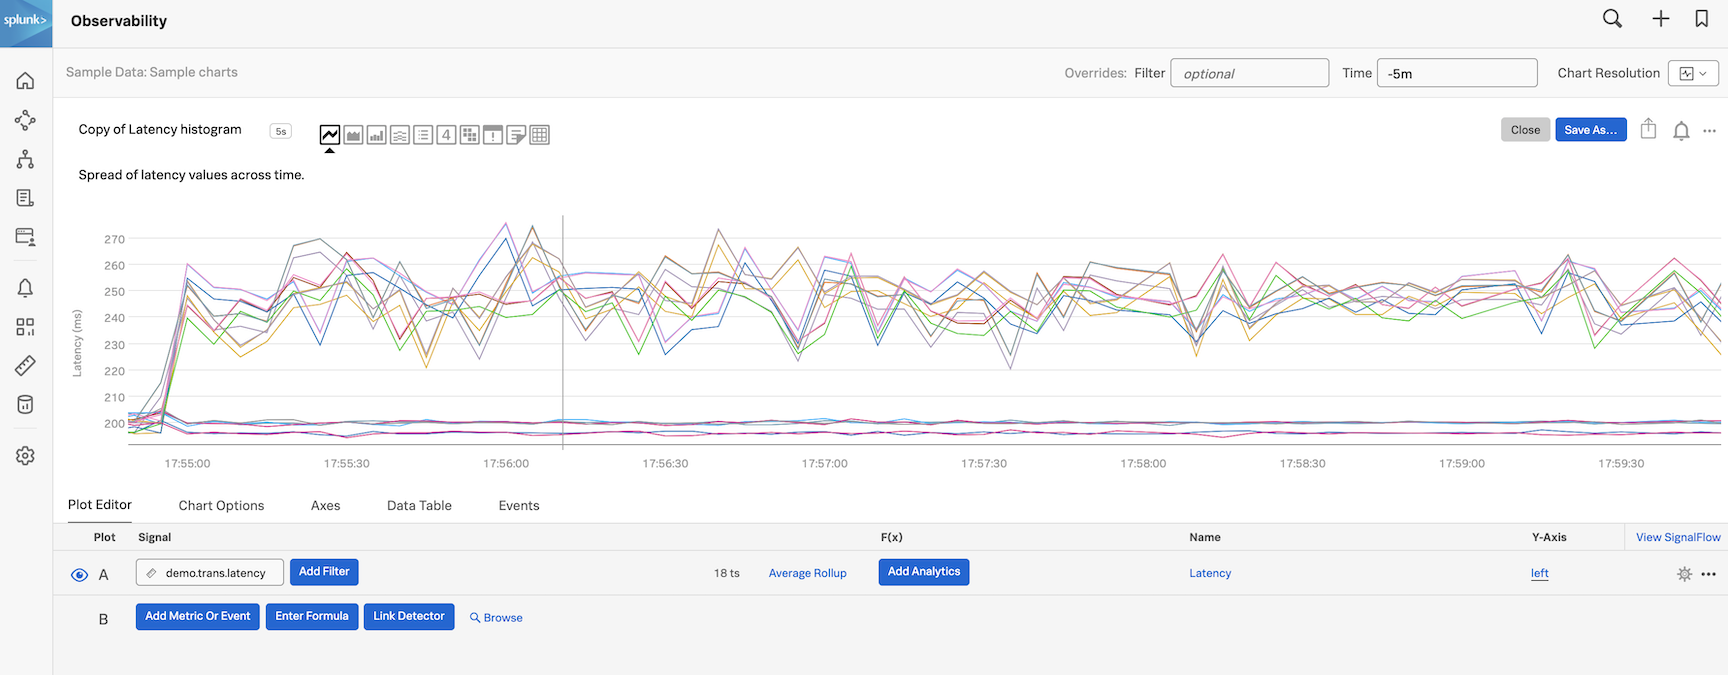
You will see the plot options, current plot and signal (metric) for the Latency histogram chart in the chart editor UI.
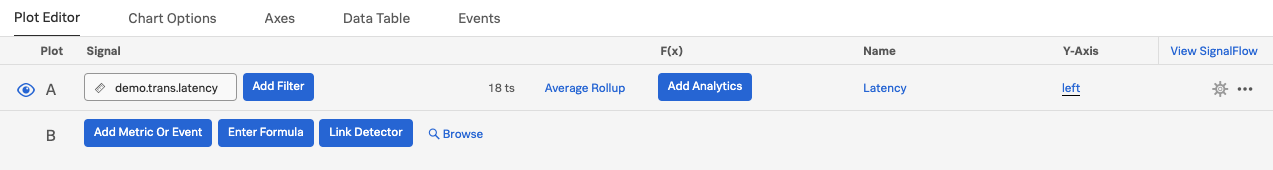
In the Plot Editor tab under Signal you see the metric demo.trans.latency we are currently plotting.
You will see a number of Line plots. The number 18 ts indicates that we are plotting 18 metric time series in the chart.
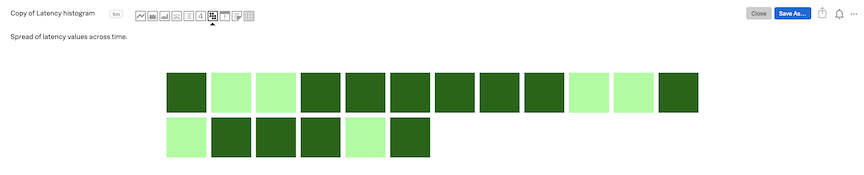
Click on the different chart type icons to explore each of the visualizations. Notice their name while you swipe over them. For example, click on the Heat Map icon:
See how the chart changes to a heat map.
Note
You can use different charts to visualize your metrics - you choose which chart type fits best for the visualization you want to have.
Click on the Line chart type and you will see the line plot.
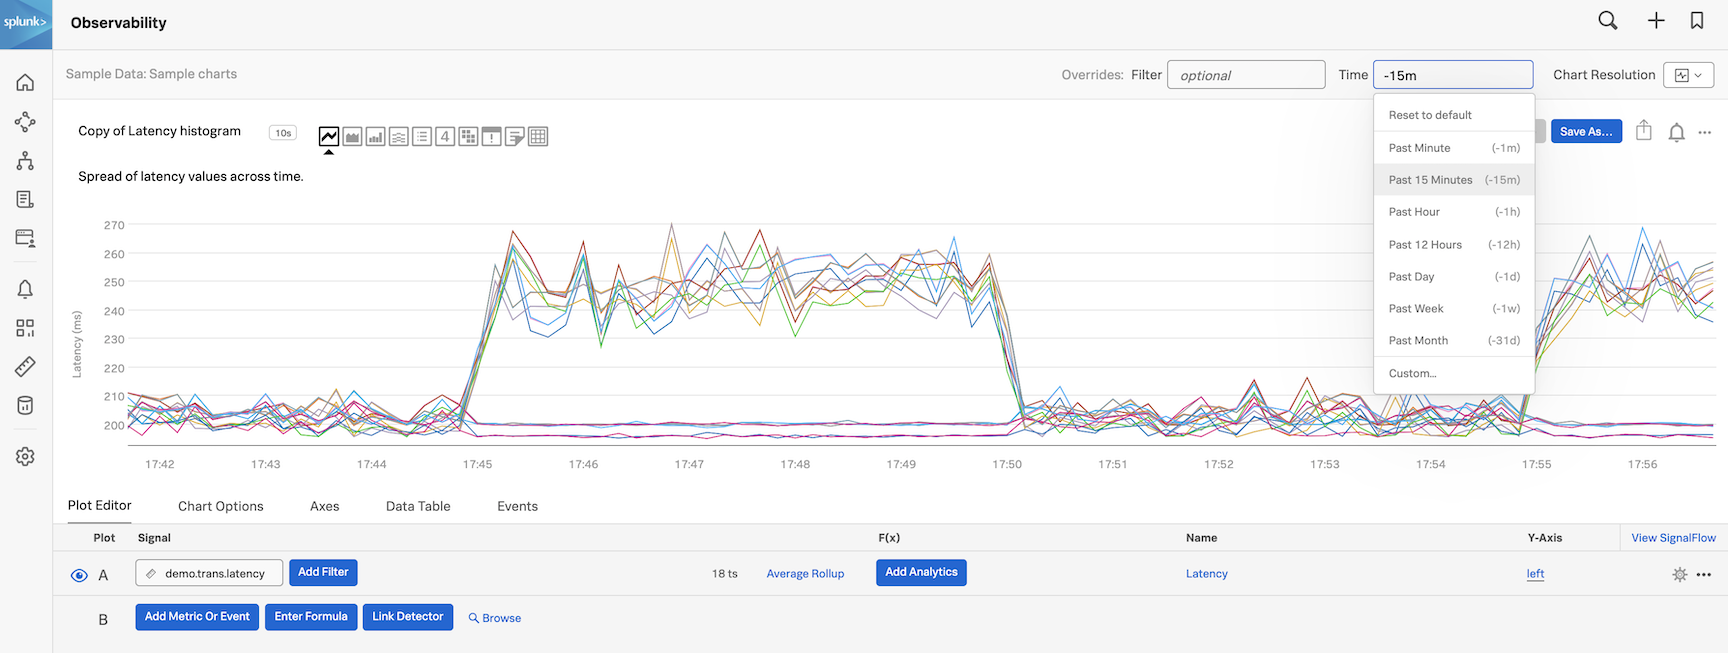
2. Changing the time window
You can also increase the time window of the chart by changing the time to Past 15 minutes by selecting from the Time dropdown.
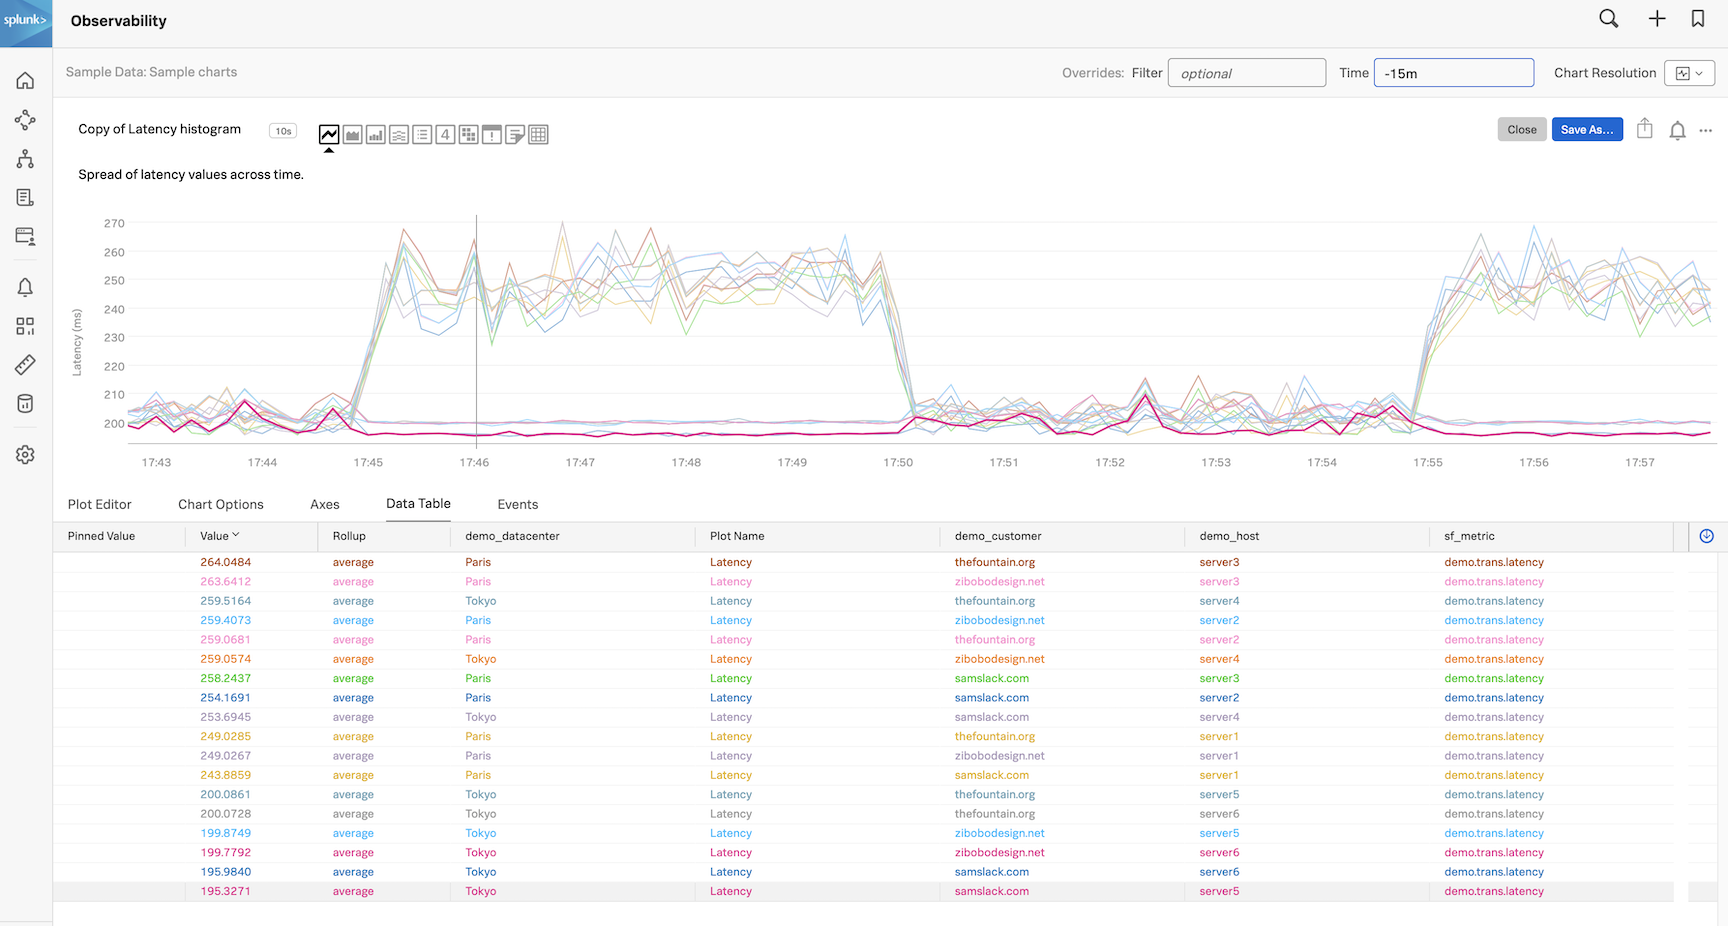
3. Viewing the Data Table
Click on the Data Table tab.
You now see 18 rows, each representing a metric time series with a number of columns. These columns represent the dimensions of the metric. The dimensions for demo.trans.latency are:
demo_datacenter
demo_customer
demo_host
In the demo_datacenter column you see that there are two data centers, Paris and Tokyo, for which we are getting metrics.
If you move your cursor over the lines in the chart horizontally you will see the data table update accordingly. If you click on one of the lines in the chart you will see a pinned value appear in the data table.
Now click on Plot editor again to close the Data Table and let’s save this chart into a dashboard for later use!
Saving charts
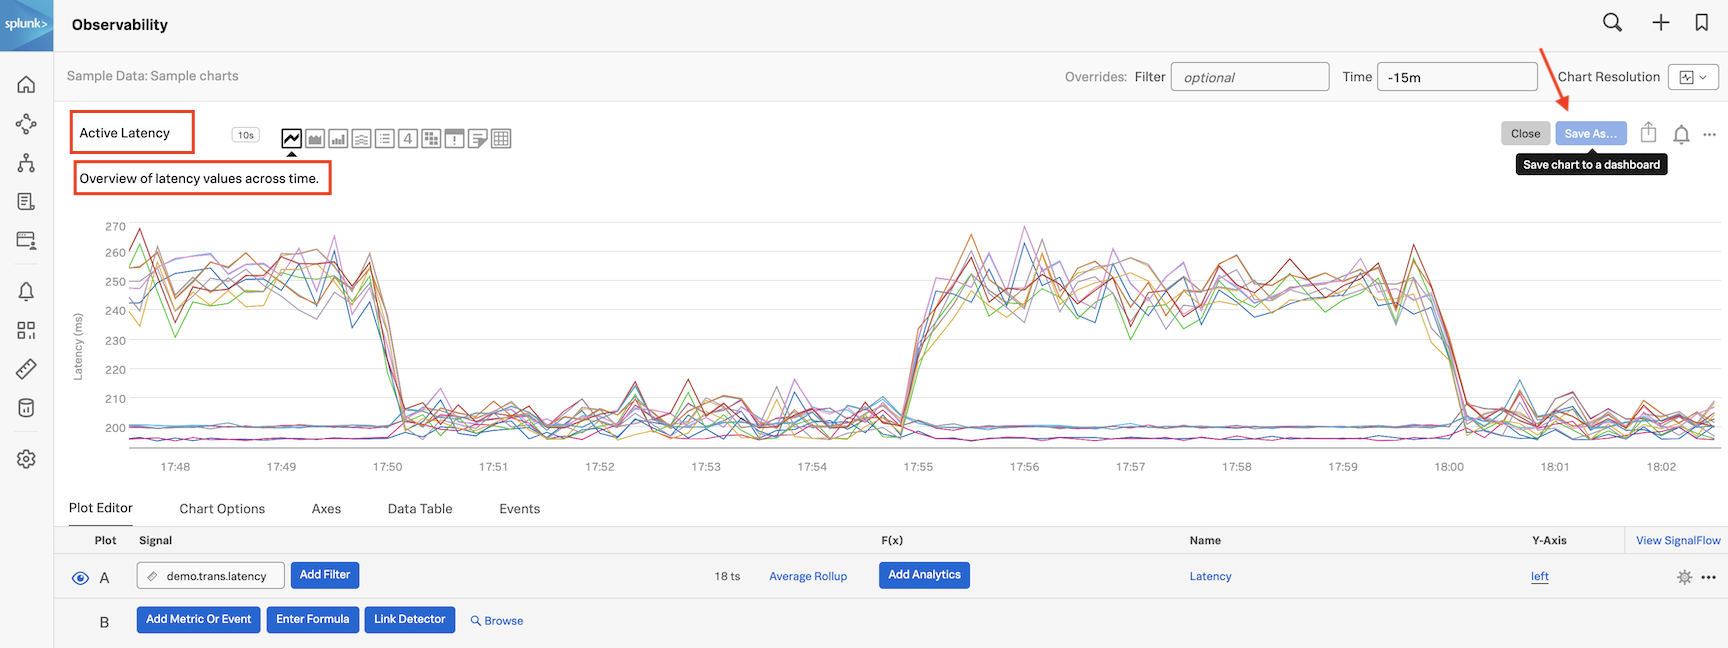
1. Saving a chart
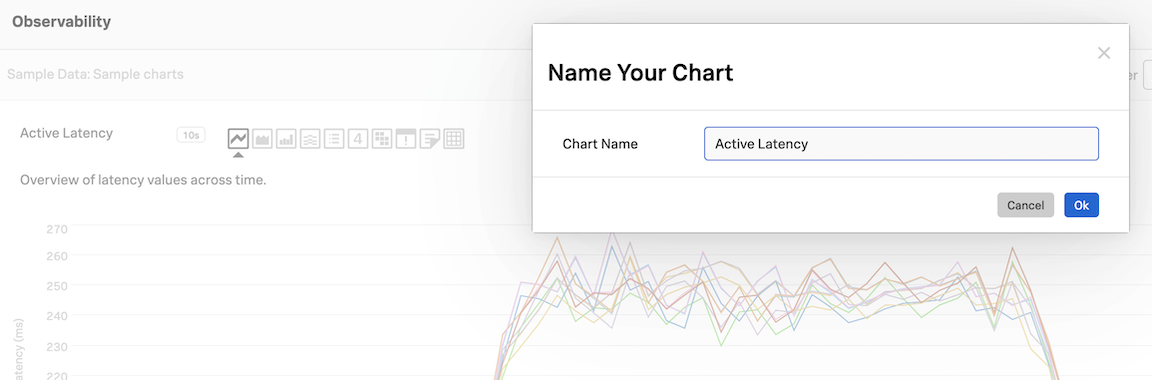
To start saving your chart, lets give it a name and description. Click the name of the chart Copy of Latency Histogram and rename it to “Active Latency”.
To change the description click on Spread of latency values across time. and change this to Overview of latency values in real-time.
Click the Save As button. Make sure your chart has a name, it will use the name Active Latency the you defined in the previous step, but you can edit it here if needed.
Press the Ok
button to continue.
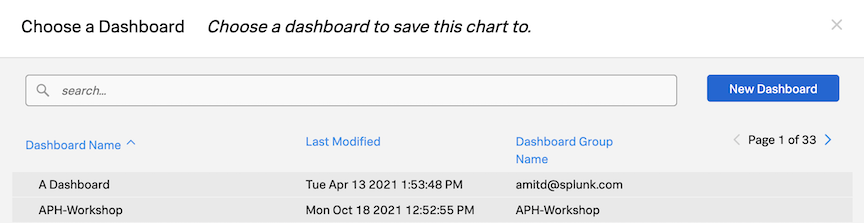
2. Creating a dashboard
In the Choose dashboard dialog, we need to create a new dashboard, click on the New Dashboard
button.
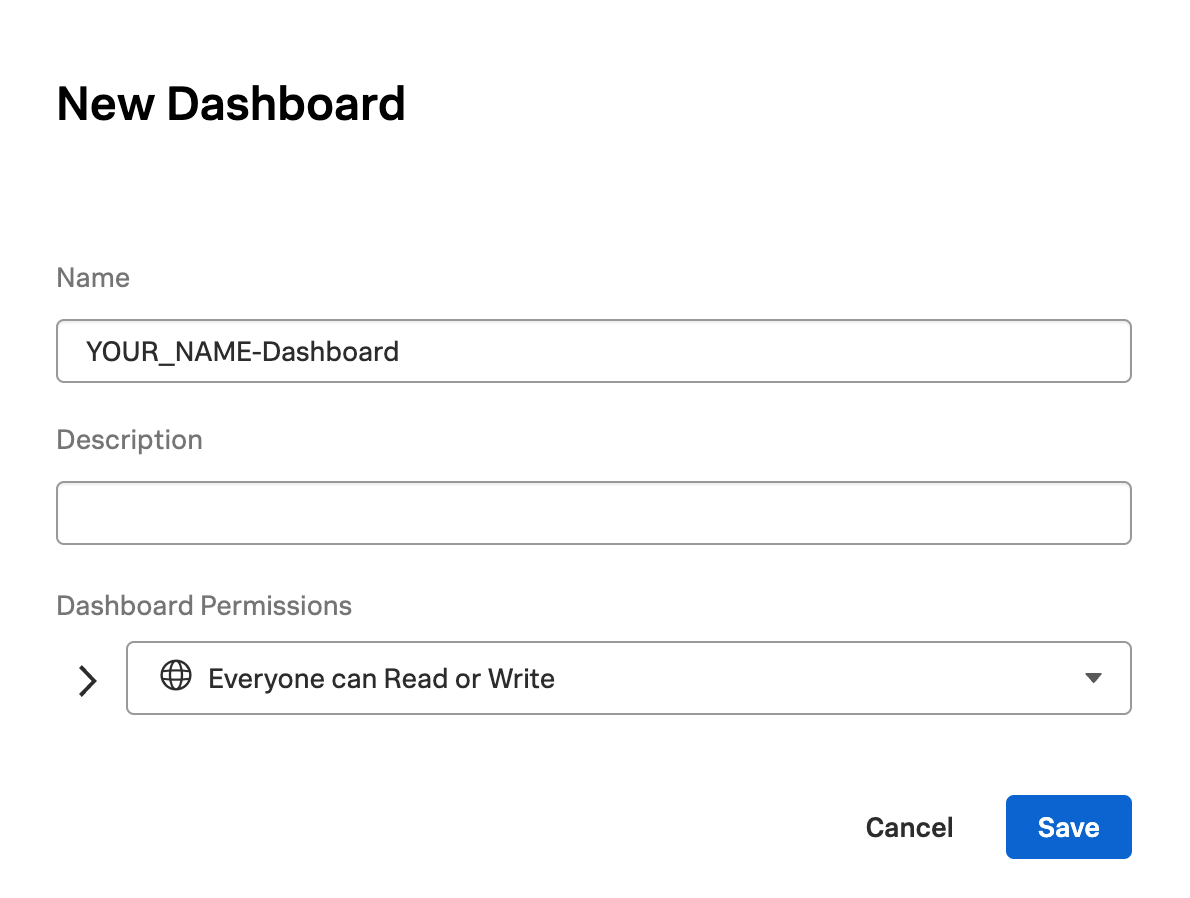
You will now see the New Dashboard Dialog. In here you can give you dashboard a name and description, and set Read and Write Permissions.
Please use your own name in the following format to give your dashboard a name e.g. YOUR_NAME-Dashboard.
Please replace YOUR_NAME with your own name, change the dashboard permissions to Restricted Read and Write access, and verify your user can read/write.
You should see you own login information displayed, meaning you are now the only one who can edit this dashboard. Of course you have the option to add other users or teams from the drop box below that may edit your dashboard and charts, but for now make sure you change it back to Everyone can Read or Write to remove any restrictions and press the Save
Button to continue.
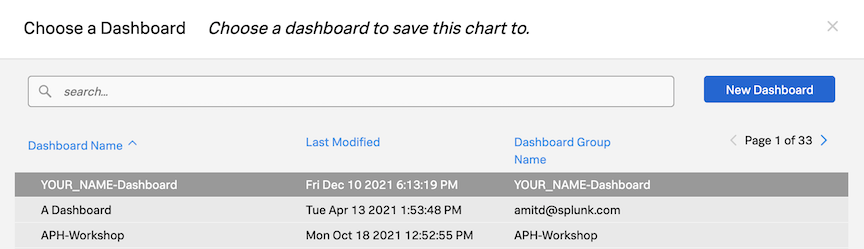
Your new dashboard is now available and selected so you can save your chart in your new dashboard.
Make sure you have your dashboard selected and press the Ok button.
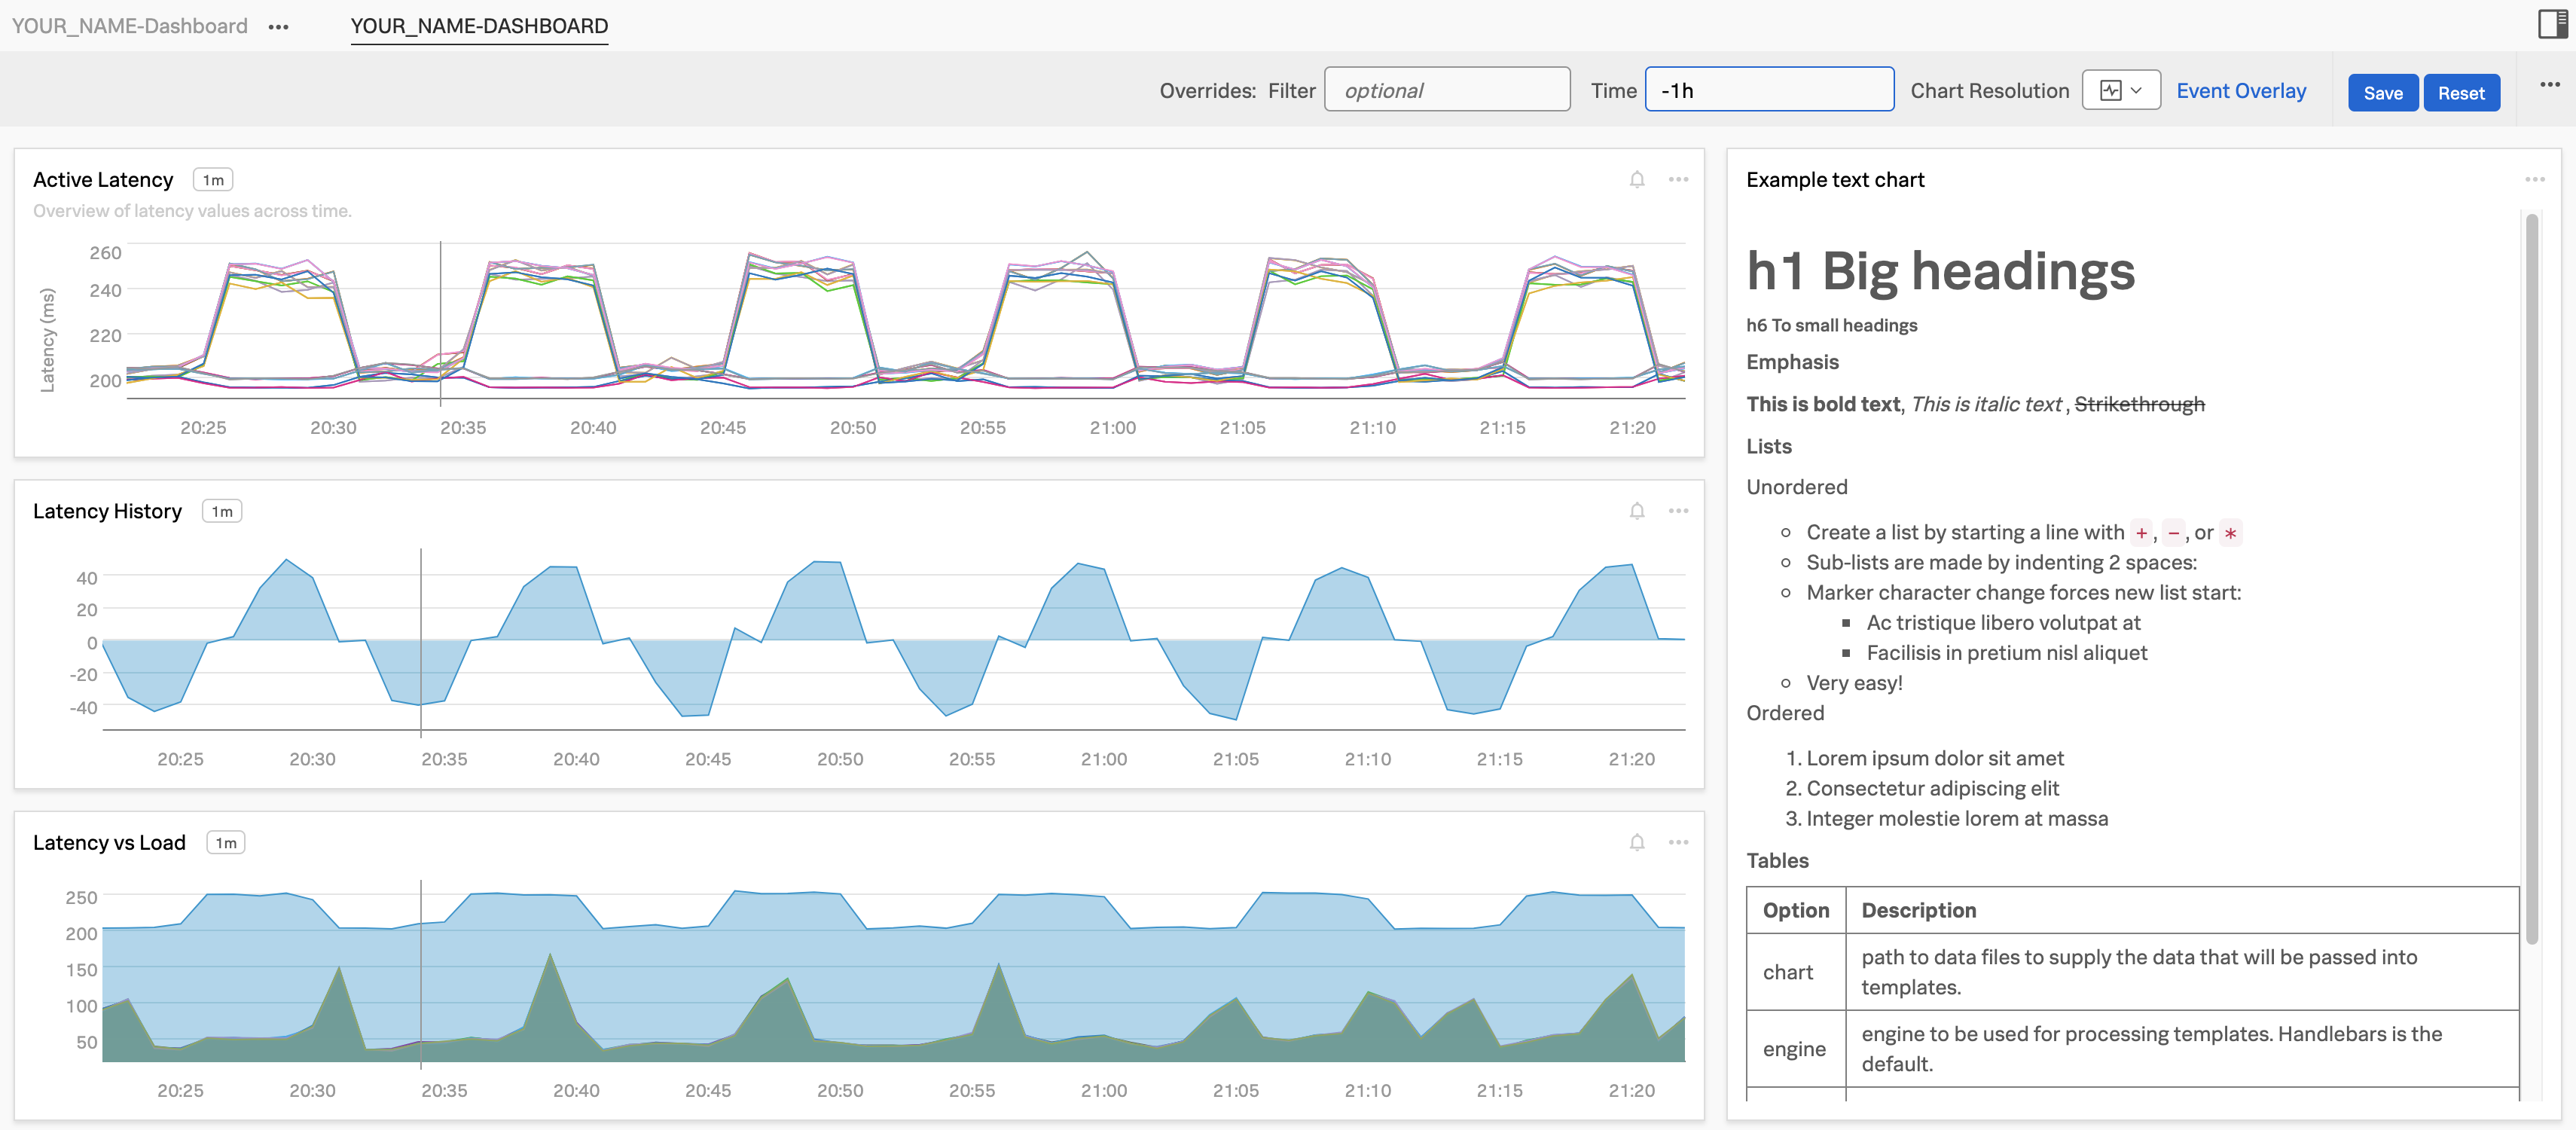
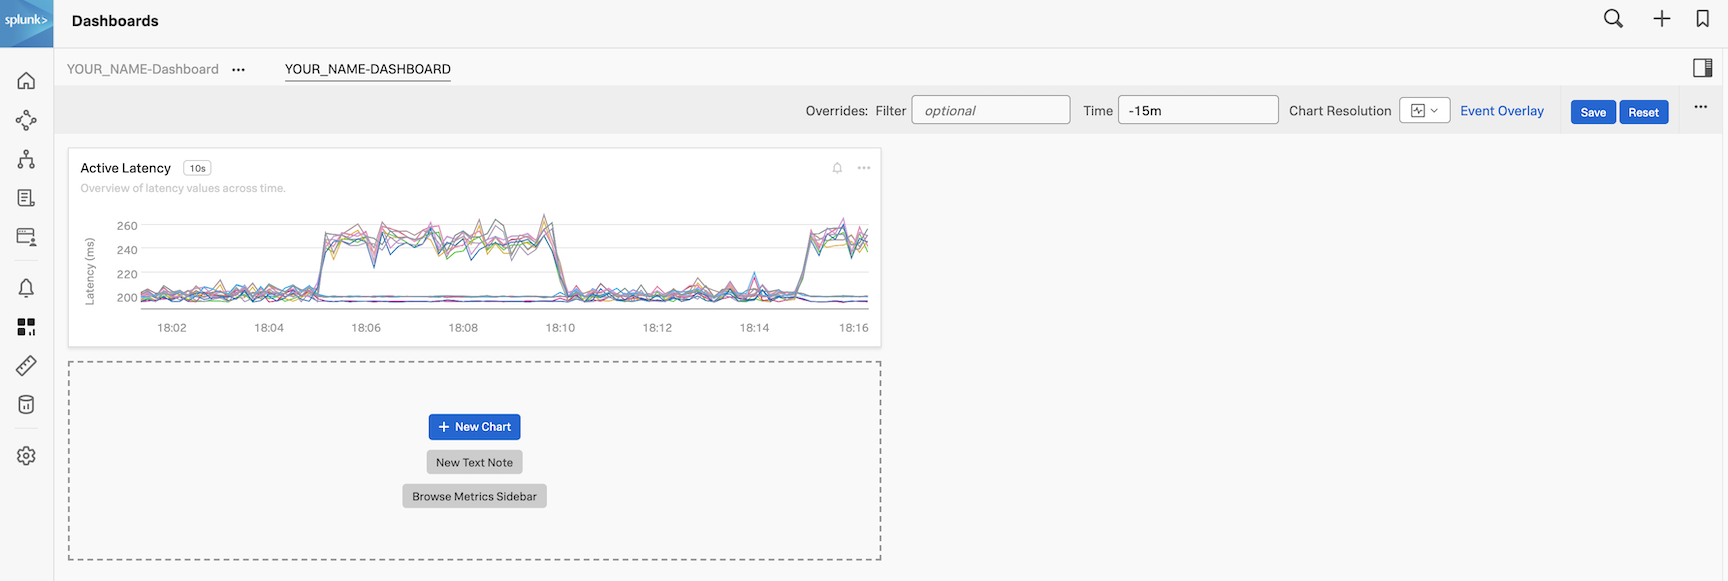
You will now be taken to your dashboard like below. You can see at the top left that your YOUR_NAME-DASHBOARD is part of a Dashboard Group YOUR_NAME-Dashboard. You can add other dashboards to this dashboard group.
3. Add to Team page
It is common practice to link dashboards that are relevant to a Team to a teams page. So let’s add your dashboard to the team page for easy access later. Use the from the navbar again.
This will bring you to your teams dashboard, We use the team Example Team as an example here, the workshop one will be different.
Press the +Add Dashboard Group button to add you dashboard to the team page.
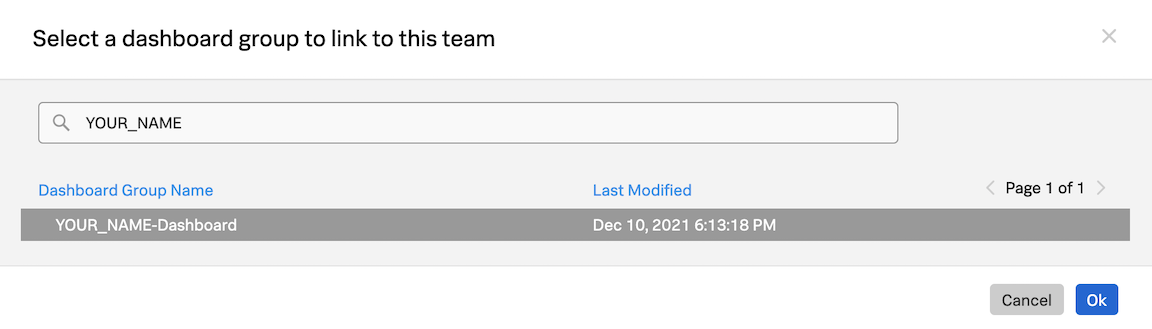
This will bring you to the Select a dashboard group to link to this team dialog.
Type your name (that you used above) in the search box to find your Dashboard. Select it so its highlighted and click the Ok button to add your dashboard.
Your dashboard group will appear as part of the team page. Please note during the course of the workshop many more will appear here.
Now click on the link for your Dashboard to add more charts!
3.3 Using Filters & Formulas
1 Creating a new chart
Let’s now create a new chart and save it in our dashboard!
Select the plus icon (top right of the UI) and from the drop down, choose the option Chart.
Or click on the + New Chart Button to create a new chart.
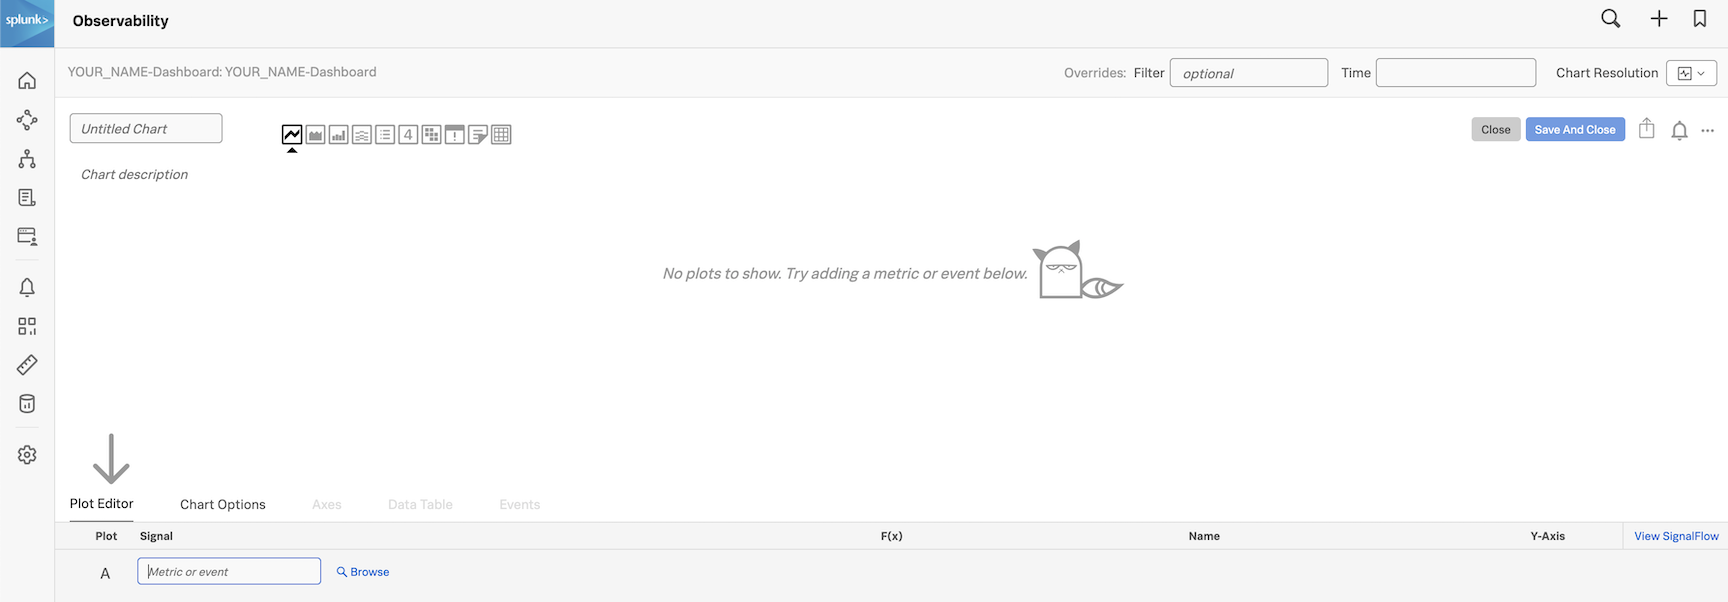
You will now see a chart template like the following.
Let’s enter a metric to plot. We are still going to use the metric demo.trans.latency.
In the Plot Editor tab under Signal enter demo.trans.latency.
You should now have a familiar line chart. Please switch the time to 15 mins.
2. Filtering and Analytics
Let’s now select the Paris datacenter to do some analytics - for that we will use a filter.
Let’s go back to the Plot Editor tab and click on Add Filter
, wait until it automatically populates, choose demo_datacenter, and then Paris.
In the F(x) column, add the analytic function Percentile:Aggregation, and leave the value to 95 (click outside to confirm).
For info on the Percentile function and the other functions see Chart Analytics.
3. Using Timeshift analytical function
Let’s now compare with older metrics. Click on ... and then on Clone in the dropdown to clone Signal A.
You will see a new row identical to A, called B, both visible and plotted.
For Signal B, in the F(x) column add the analytic function Timeshift and enter 1w (or 7d for 7 days), and click outside to confirm.
Click on the cog on the far right, and choose a Plot Color e.g. pink, to change color for the plot of B.
Click on Close.
We now see plots for Signal A (the past 15 minutes) as a blue plot, and the plots from a week ago in pink.
In order to make this clearer we can click on the Area chart icon to change the visualization.
We now can see when last weeks latency was higher!
Next, click into the field next to Time on the Override bar and choose Past Hour from the dropdown.
4. Using Formulas
Let’s now plot the difference of all metric values for a day with 7 days in between.
Click on Enter Formula
then enter A-B (A minus B) and hide (deselect) all Signals using the eye, except C.
We now see only the difference of all metric values of A and B being plotted. We see that we have some negative values on the plot because a metric value of B has some times larger value than the metric value of A at that time.
Lets look at the Signalflow that drives our Charts and Detectors!
3.4 SignalFlow
1. Introduction
Let’s take a look at SignalFlow - the analytics language of Observability Cloud that can be used to setup monitoring as code.
The heart of Splunk Infrastructure Monitoring is the SignalFlow analytics engine that runs computations written in a Python-like language. SignalFlow programs accept streaming input and produce output in real time. SignalFlow provides built-in analytical functions that take metric time series (MTS) as input, perform computations, and output a resulting MTS.
Comparisons with historical norms, e.g. on a week-over-week basis
Population overviews using a distributed percentile chart
Detecting if the rate of change (or other metric expressed as a ratio, such as a service level objective) has exceeded a critical threshold
Finding correlated dimensions, e.g. to determine which service is most correlated with alerts for low disk space
Infrastructure Monitoring creates these computations in the Chart Builder user interface, which lets you specify the input MTS to use and the analytical functions you want to apply to them. You can also run SignalFlow programs directly by using the SignalFlow API.
SignalFlow includes a large library of built-in analytical functions that take a metric time series as an input, performs computations on its datapoints, and outputs time series that are the result of the computation.
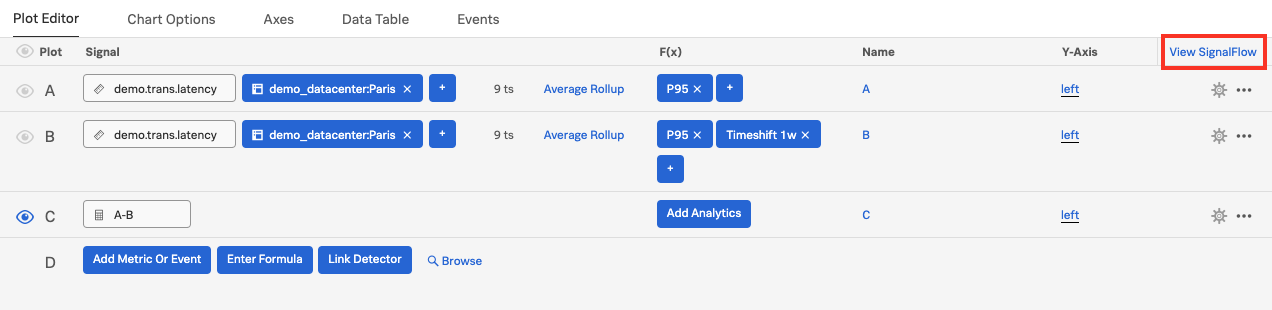
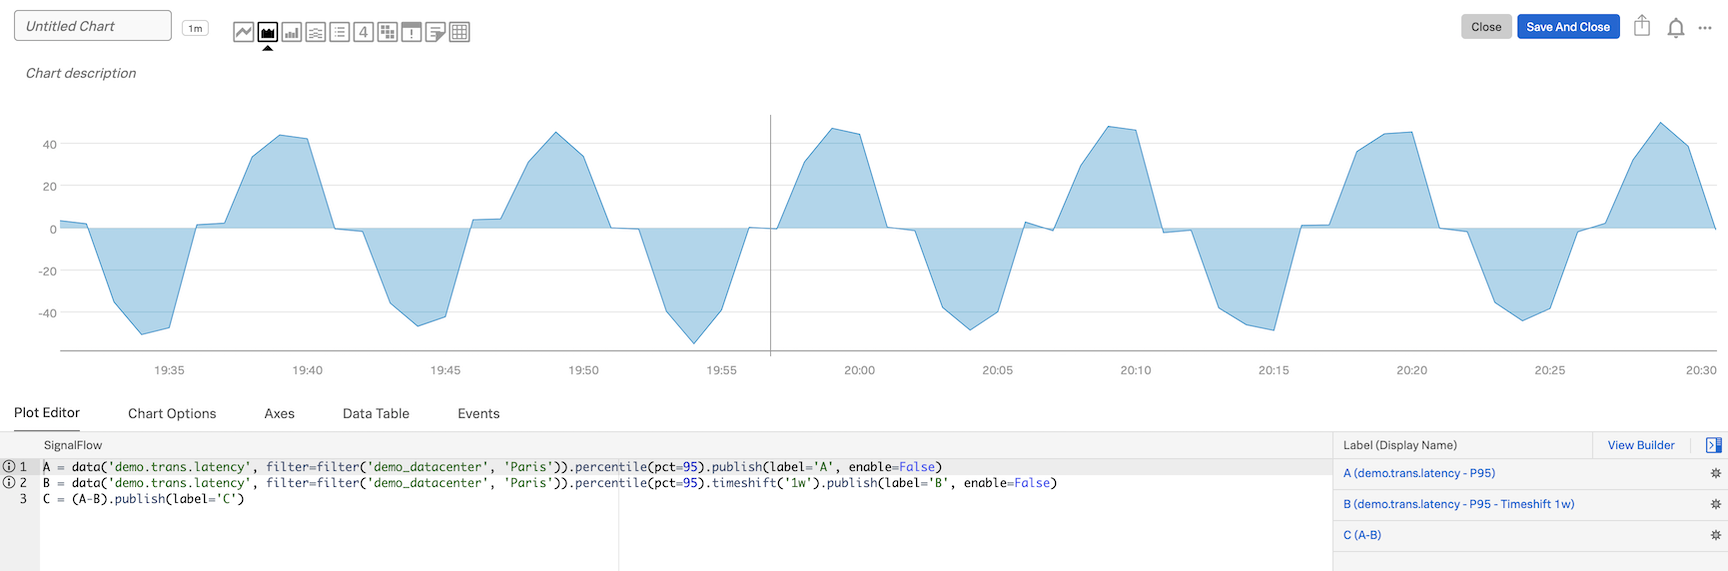
You will see the SignalFlow code that composes the chart we were working on. You can now edit the SignalFlow directly within the UI. Our documentation has the full list of SignalFlow functions and methods.
Also, you can copy the SignalFlow and use it when interacting with the API or with Terraform to enable Monitoring as Code.
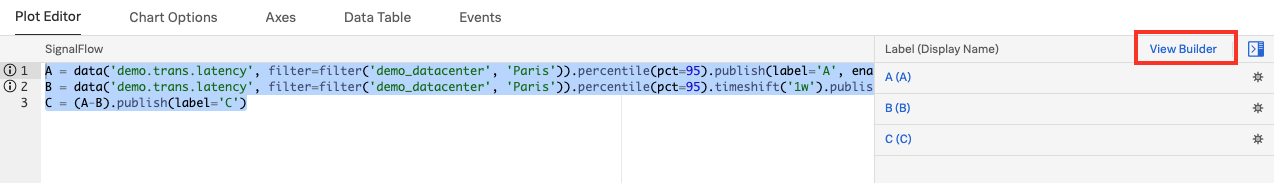
Click on View Builder to go back to the Chart Builder UI.
Let’s save this new chart to our Dashboard!
Adding charts to dashboards
1. Save to existing dashboard
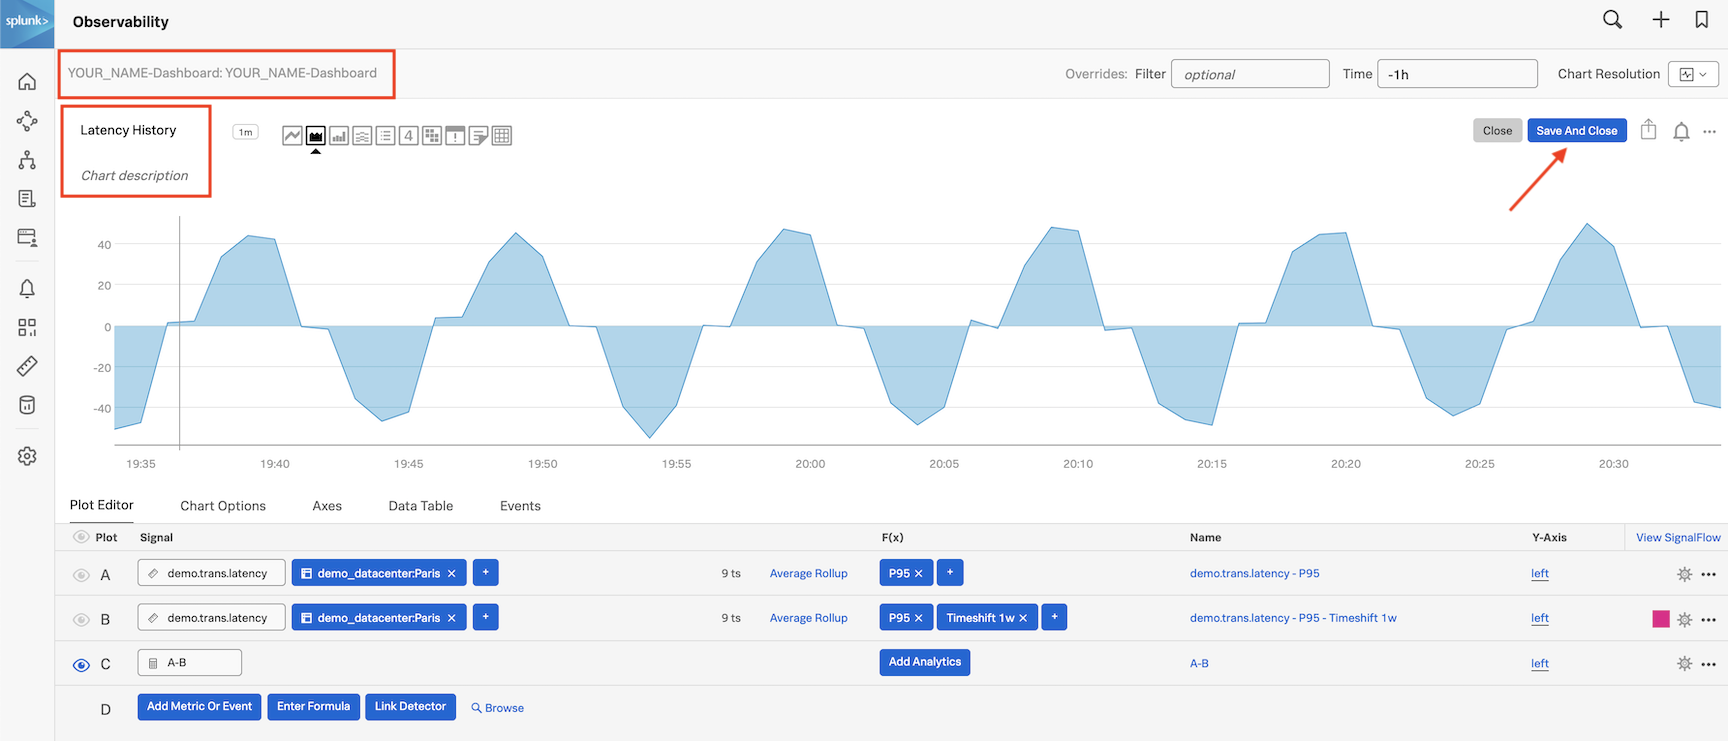
Check that you have YOUR_NAME-Dashboard: YOUR_NAME-Dashboard in the top left corner. This means you chart will be saved in this Dashboard.
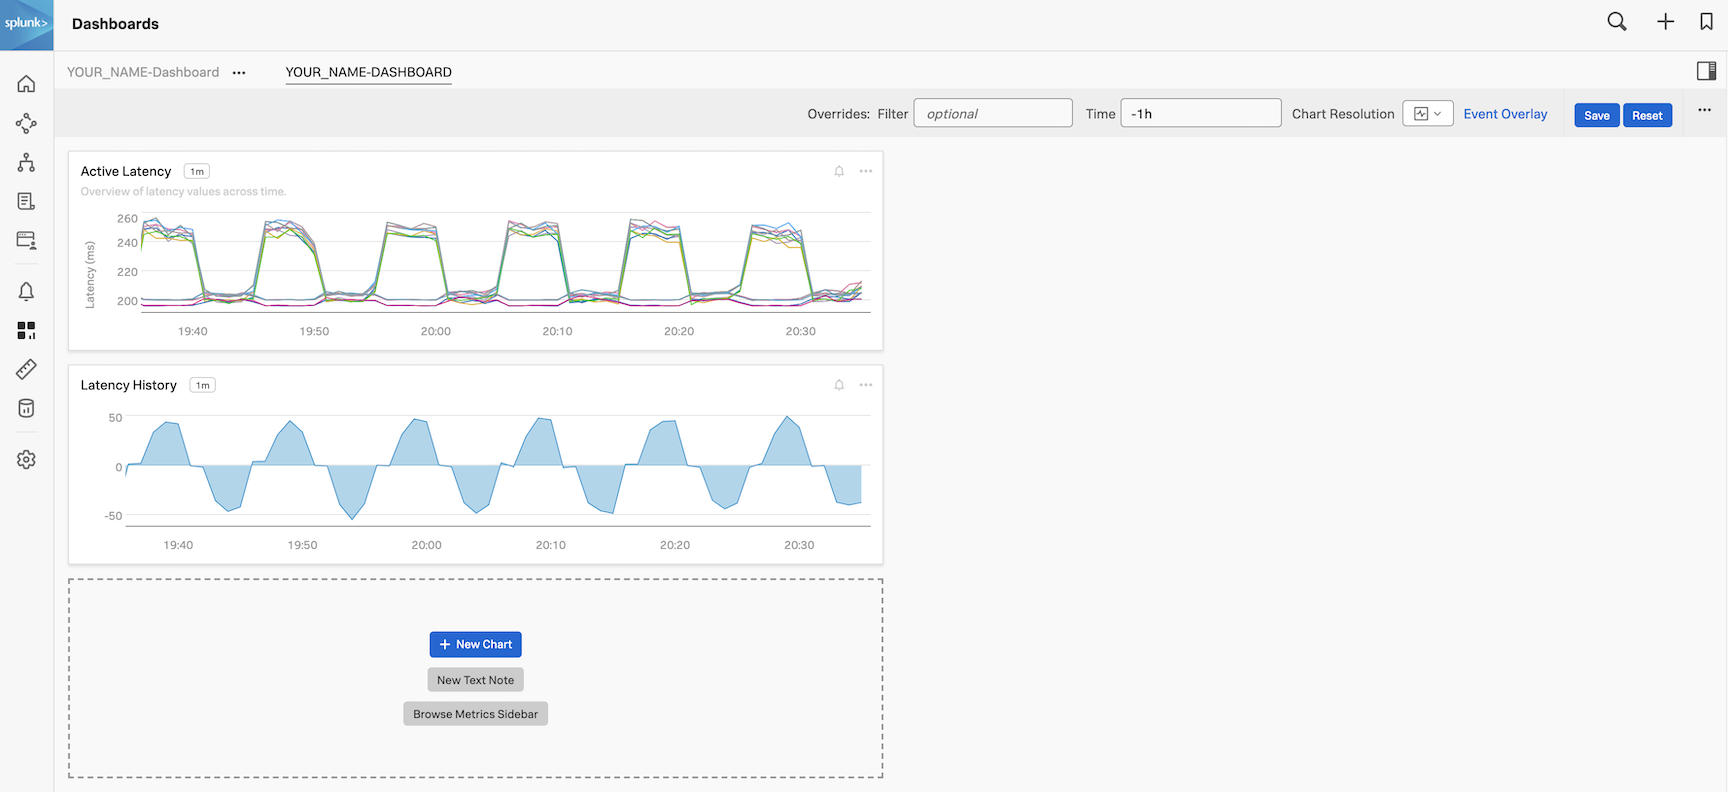
Name the Chart Latency History and add a Chart Description if you wish.
Click on Save And Close. This returns you to your dashboard that now has two charts!
Now let’s quickly add another Chart based on the previous one.
2. Copy and Paste a chart
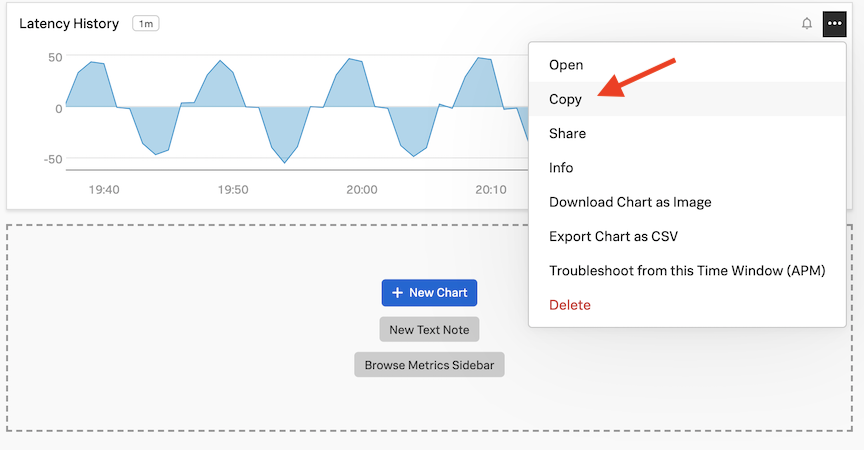
Click on the three dots ... on the Latency History chart in your dashboard and then on Copy.
You see the chart being copied, and you should now have a red circle with a white 1 next to the + on the top left of the page.
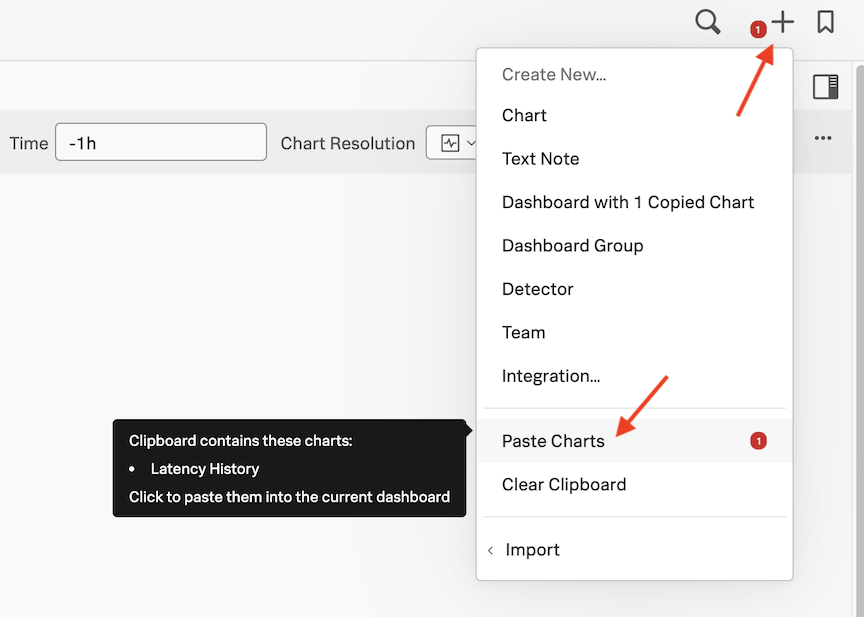
Click on the plus icon the top of the page, and then in the menu on Paste Charts (There should also be a red dot with a 1 visible at the end of the line).
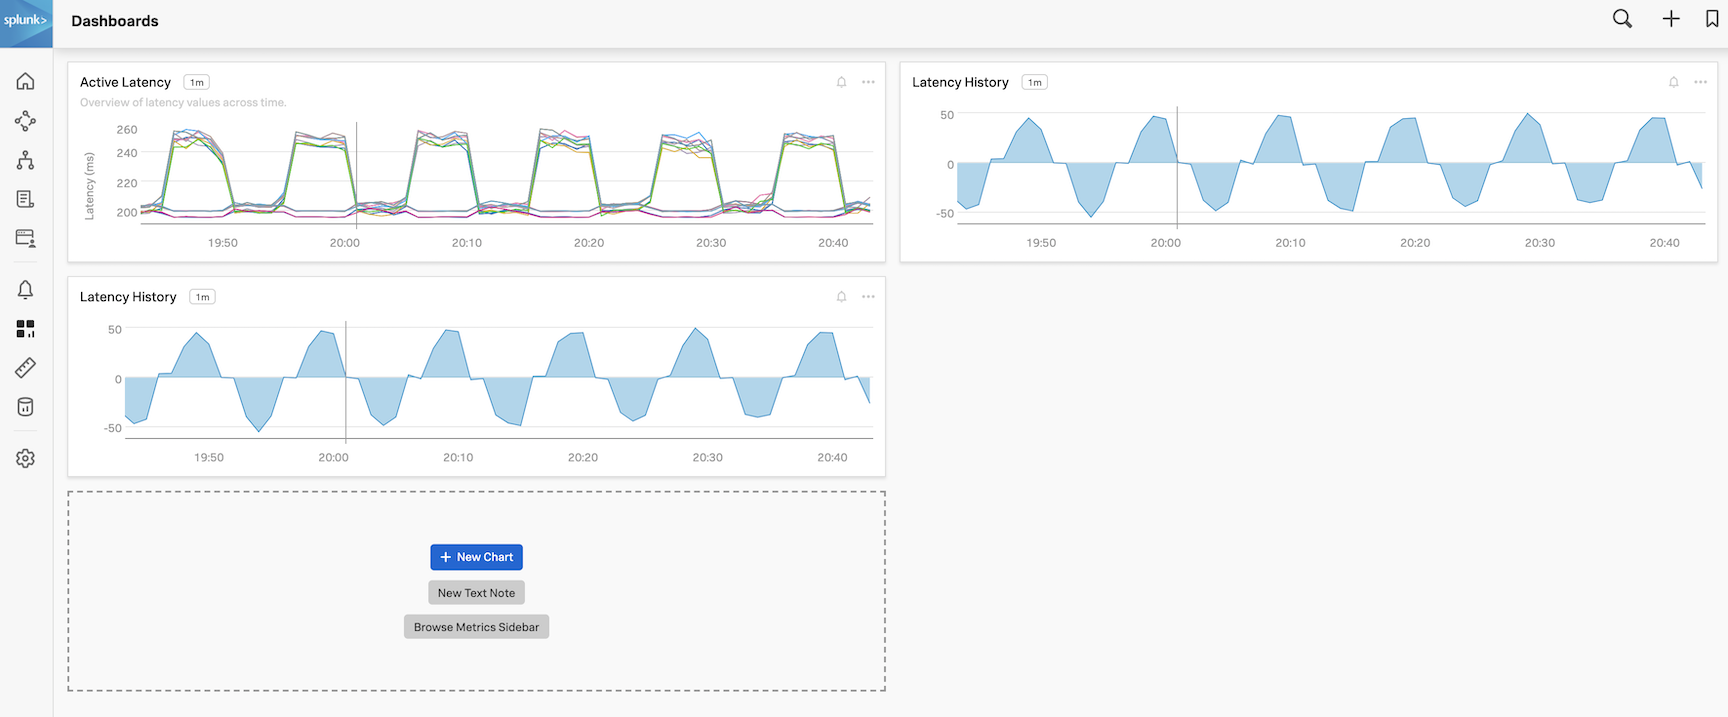
This will place a copy of the previous chart in your dashboard.
3. Edit the pasted chart
Click on the three dots ... on one of the Latency History charts in your dashboard and then on Open (or you can click on the name of the chart which here is Latency History).
This will bring you to the editor environment again.
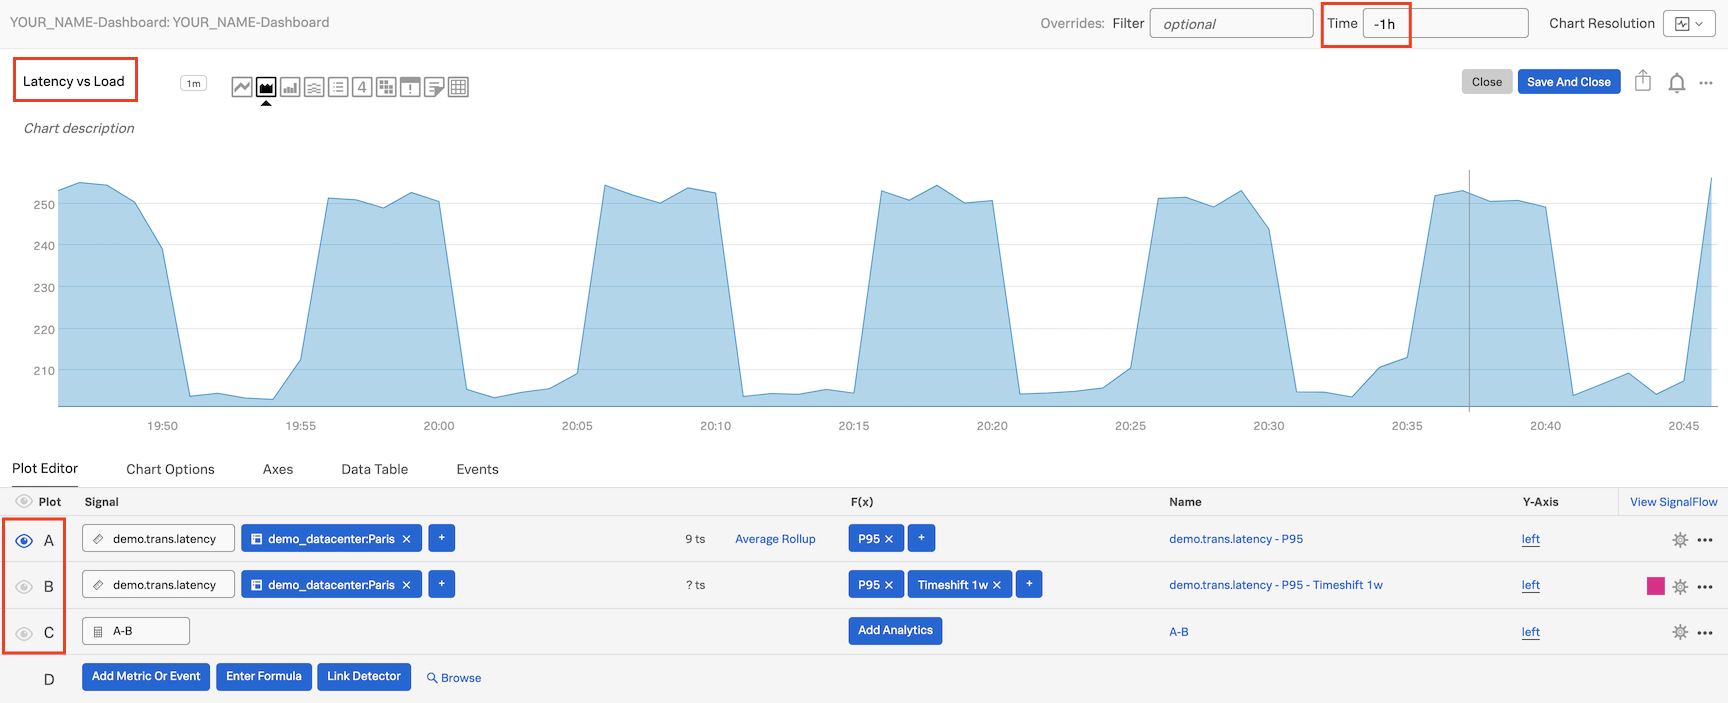
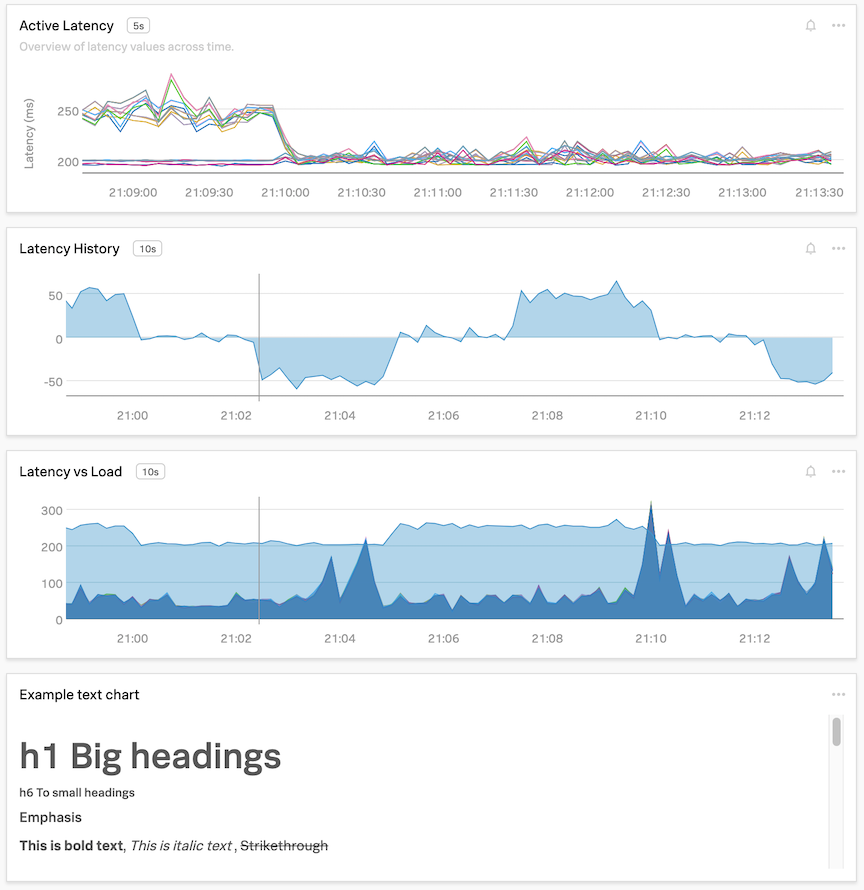
First set the time for the chart to -1 hour in the Time box at the top right of the chart. Then to make this a different chart, click on the eye icon in front of signal “A” to make it visible again, and then hide signal “C” via the eye icon and change the name for Latency history to Latency vs Load.
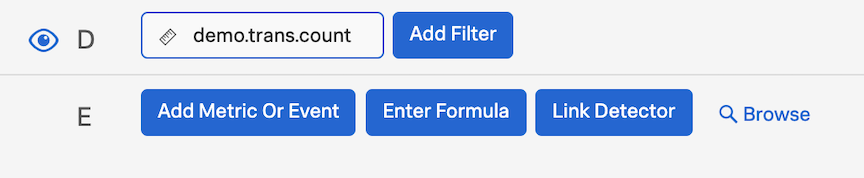
Click on the Add Metric Or Event button. This will bring up the box for a new signal. Type and select demo.trans.count for Signal D.
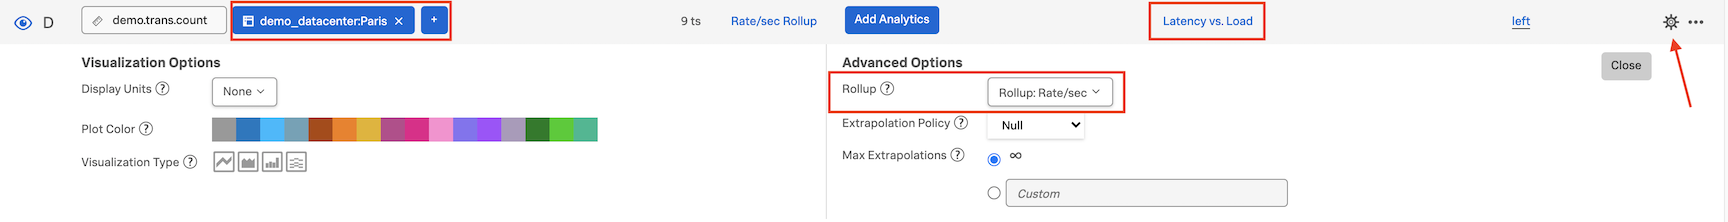
This will add a new Signal D to your chart, It shows the number of active requests. Add the filter for the demo_datacenter:Paris, then change the Rollup type by clicking on the Configure Plot button and changing the roll-up from Auto (Delta) to Rate/sec. Change the name from demo.trans.count to Latency vs Load.
Finally press the Save And Close button. This returns you to your dashboard that now has three different charts!
Let’s add an “instruction” note and arrange the charts!
Adding Notes and Dashboard Layout
1. Adding Notes
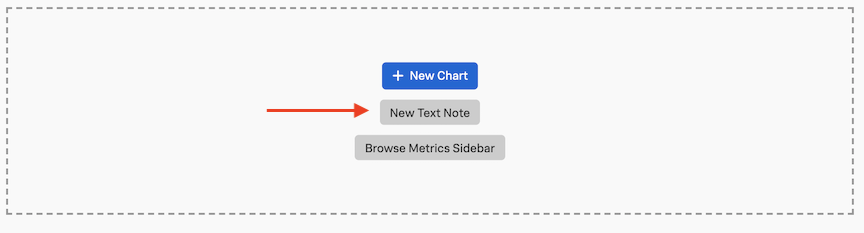
Often on dashboards it makes sense to place a short “instruction” pane that helps users of a dashboard. Lets add one now by clicking on the New Text Note
Button.
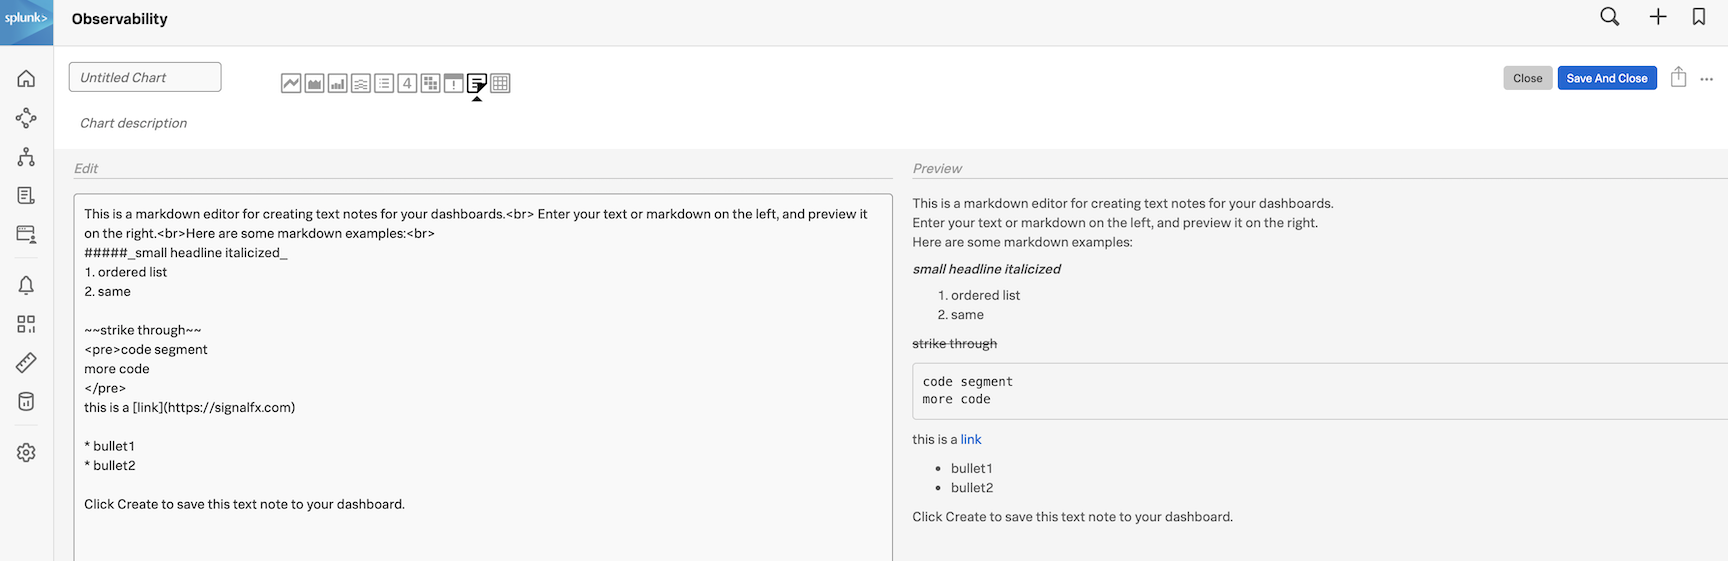
This will open the notes editor.
To allow you to add more then just text to you notes, Splunk is allowing you to use Markdown in these notes/panes.
Markdown is a lightweight markup language for creating formatted text using plain-text often used in Webpages.
This includes (but not limited to):
Headers. (in various sizes)
Emphasis styles.
Lists and Tables.
Links. These can be external webpages (for documentation for example) or directly to other Splunk IM Dashboards
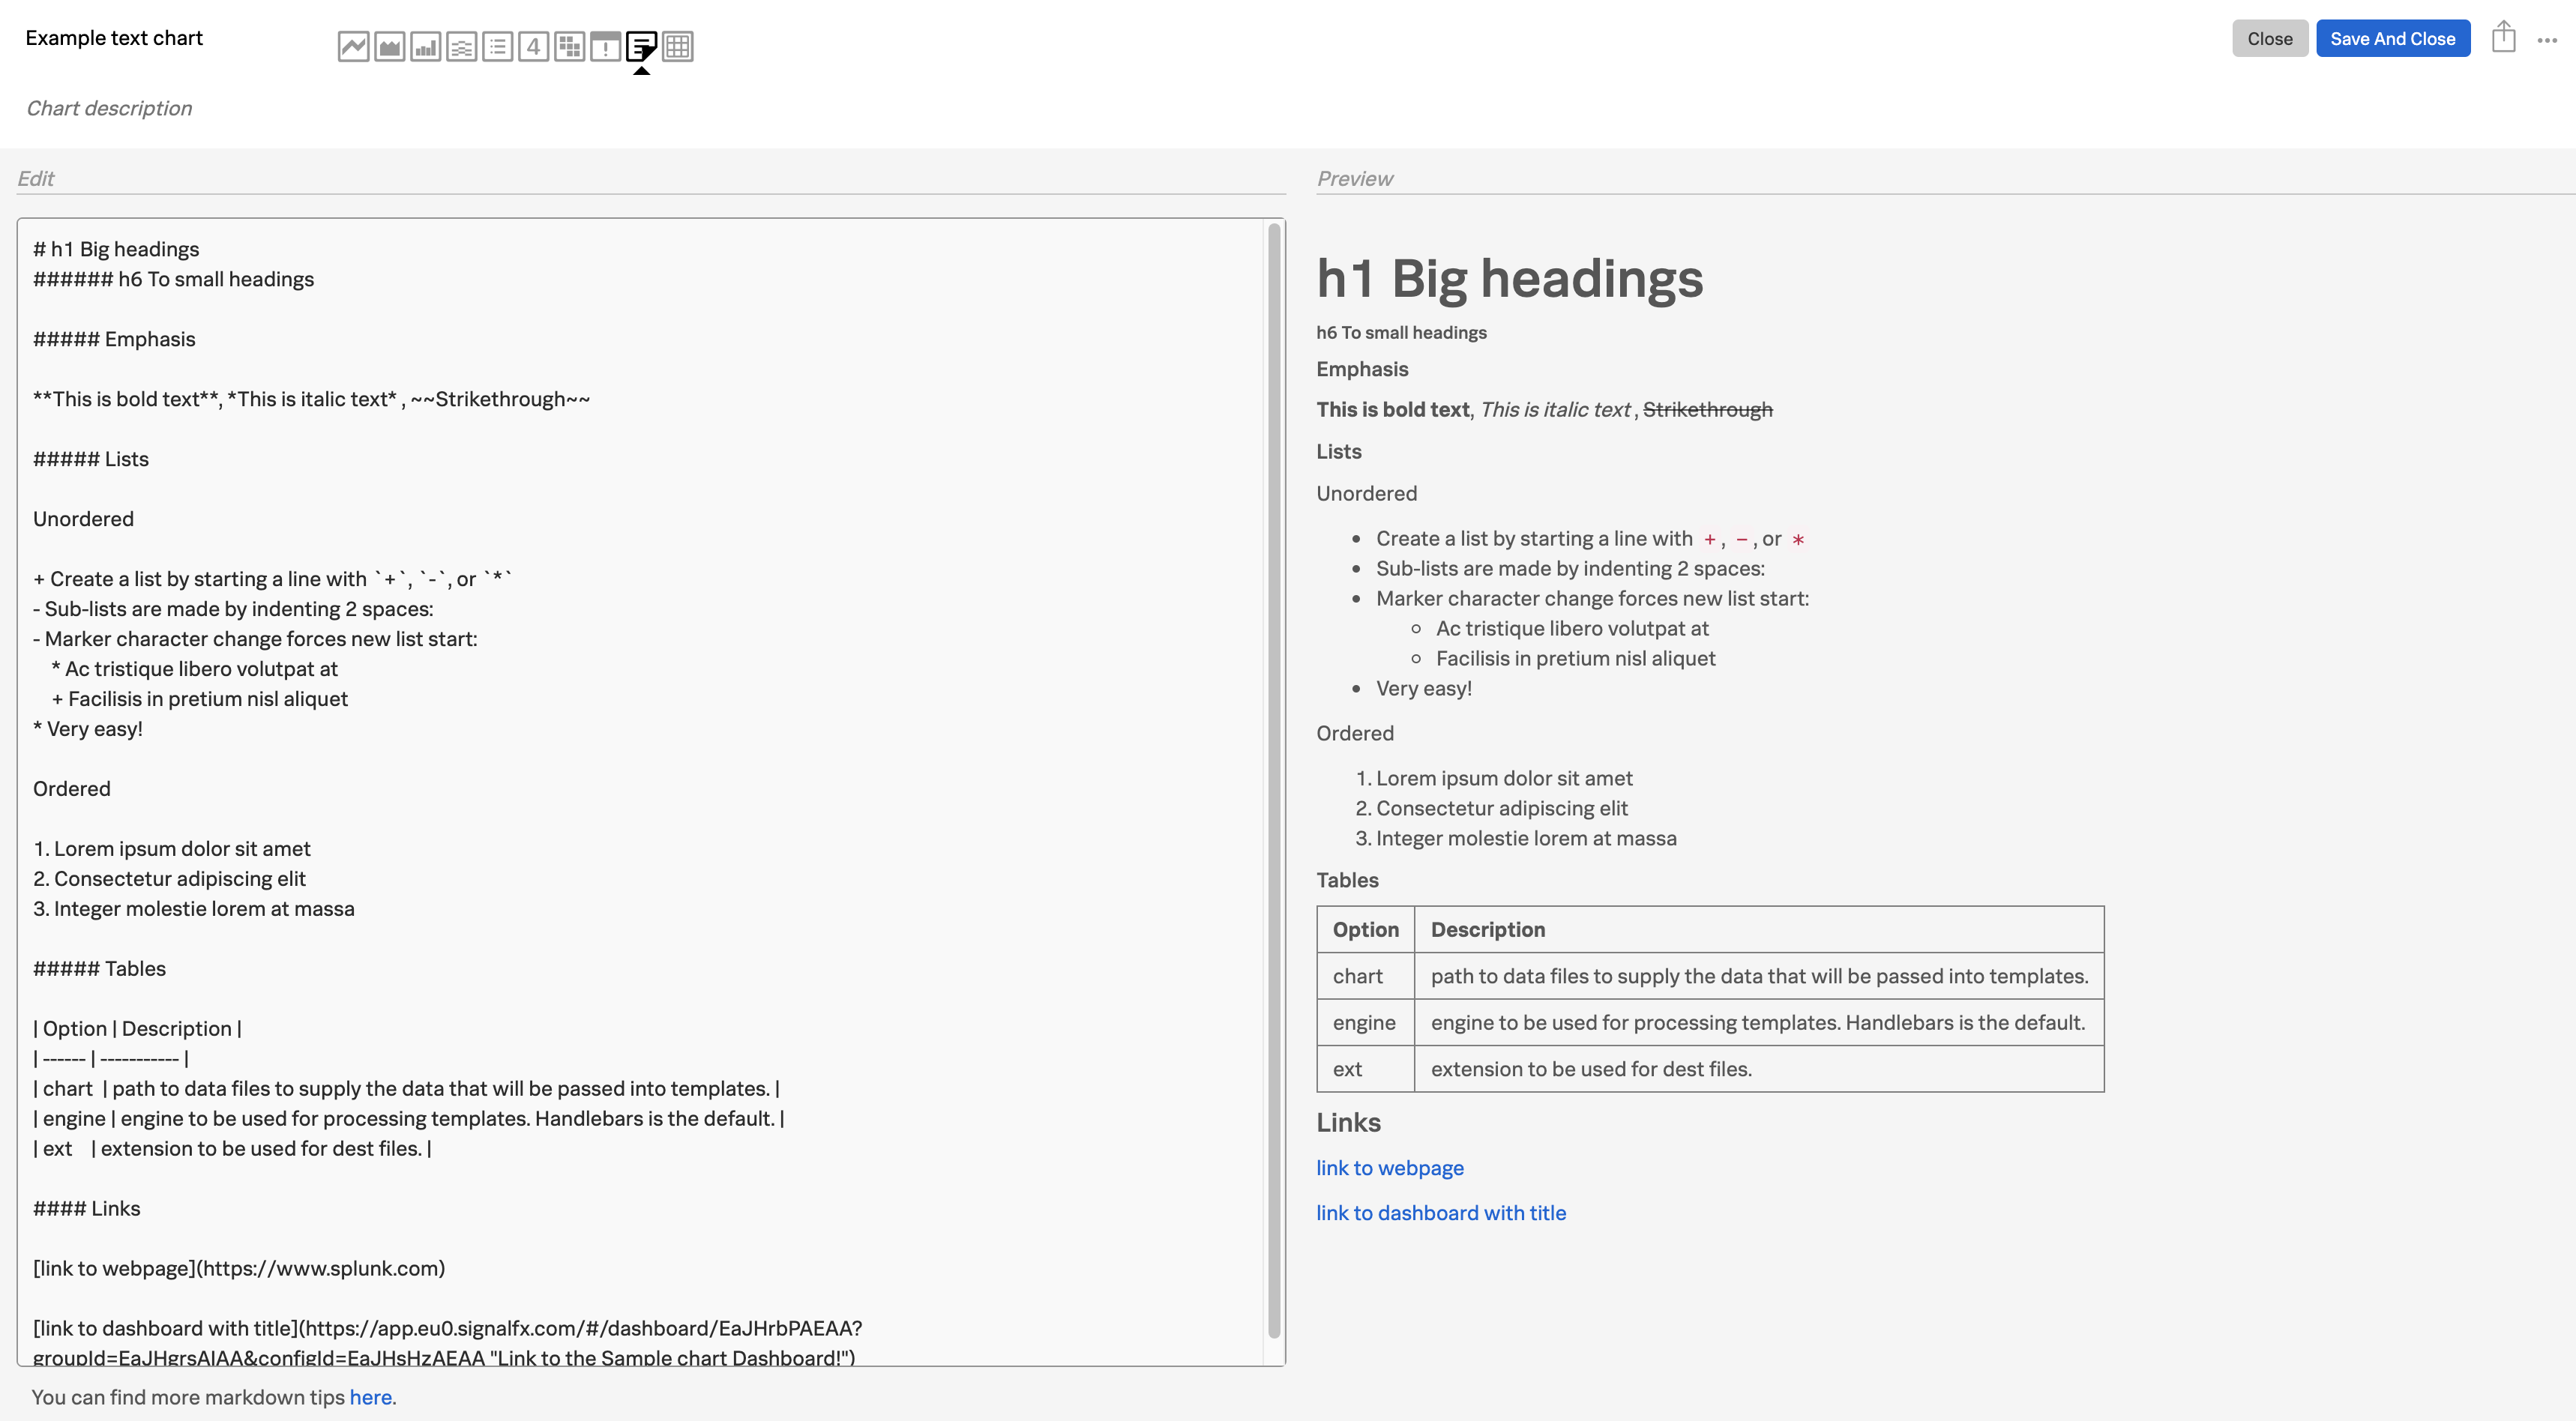
Below is an example of above Markdown options you can use in your note.
# h1 Big headings
###### h6 To small headings
##### Emphasis
**This is bold text**, *This is italic text* , ~~Strikethrough~~##### Lists
Unordered
+ Create a list by starting a line with `+`, `-`, or `*`- Sub-lists are made by indenting 2 spaces:
- Marker character change forces new list start:
* Ac tristique libero volutpat at
+ Facilisis in pretium nisl aliquet
* Very easy!
Ordered
1. Lorem ipsum dolor sit amet
2. Consectetur adipiscing elit
3. Integer molestie lorem at massa
##### Tables
| Option | Description |
| ------ | ----------- |
| chart | path to data files to supply the data that will be passed into templates. |
| engine | engine to be used for processing templates. Handlebars is the default. |
| ext | extension to be used for dest files. |
#### Links
[link to webpage](https://www.splunk.com)
[link to dashboard with title](https://app.eu0.signalfx.com/#/dashboard/EaJHrbPAEAA?groupId=EaJHgrsAIAA&configId=EaJHsHzAEAA "Link to the Sample chart Dashboard!")
Copy the above by using the copy button and paste it in the Edit box.
the preview will show you how it will look.
2. Saving our chart
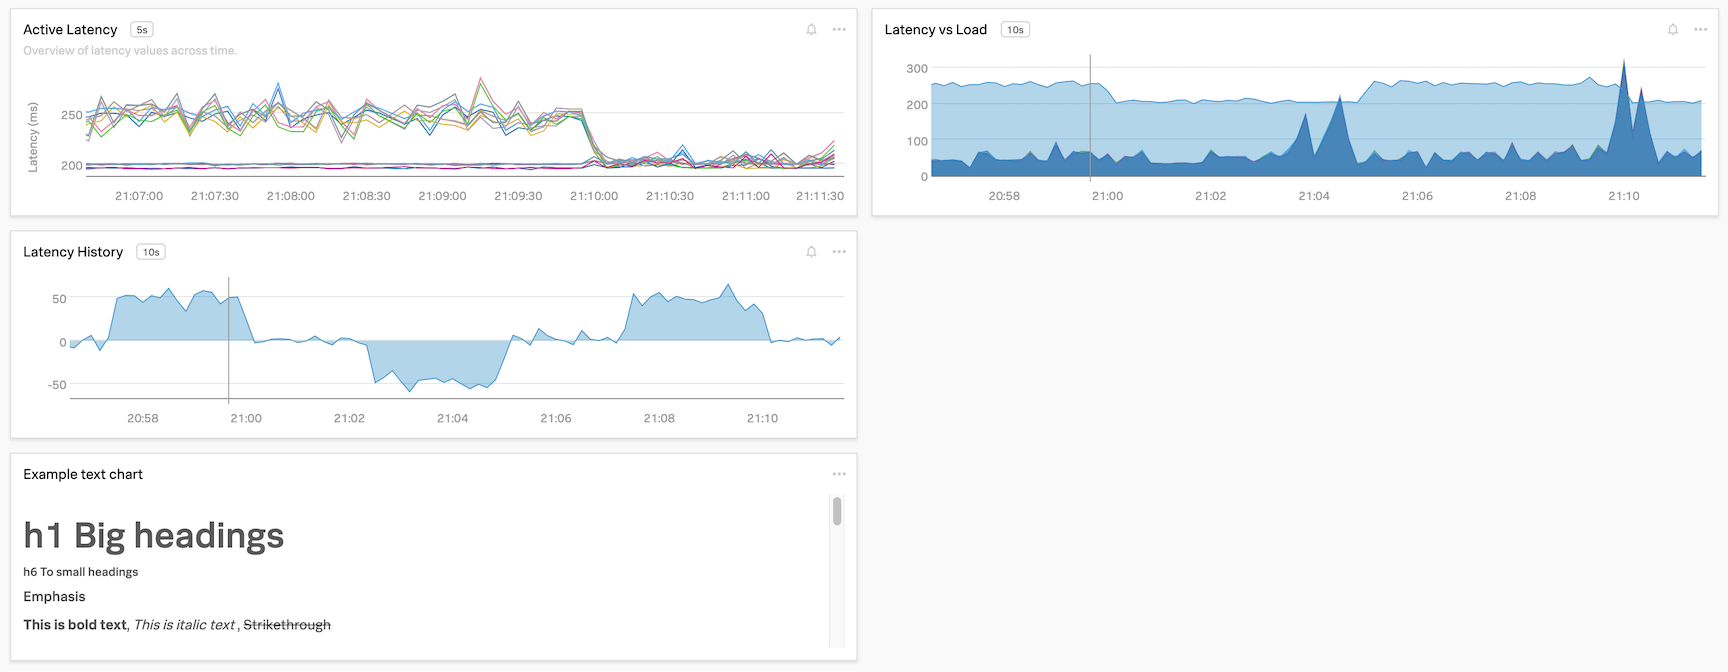
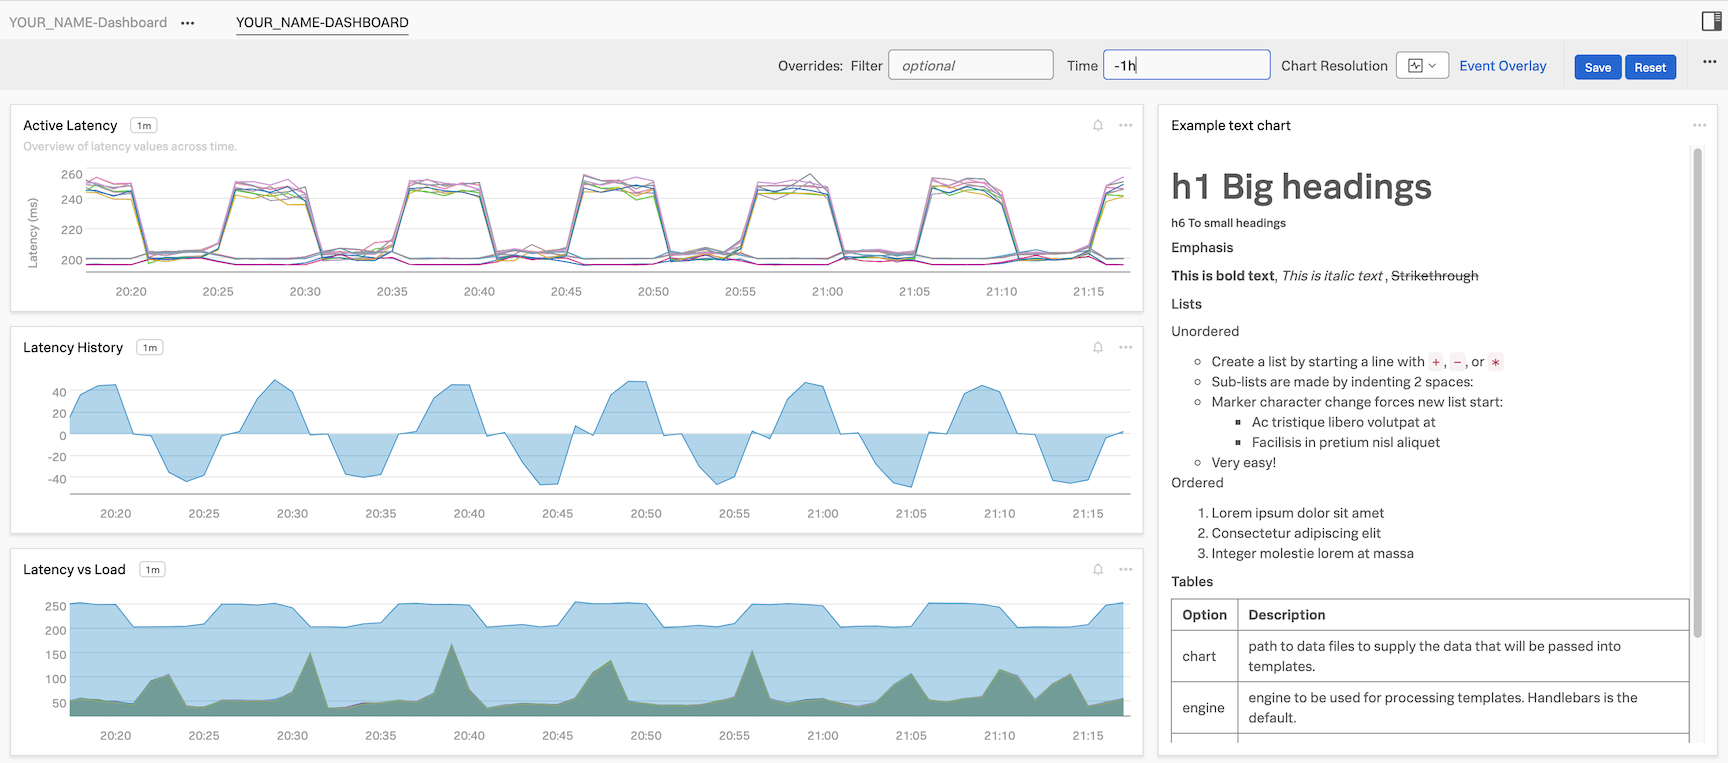
Give the Note chart a name, in our example we used Example text chart, then press the Save And Close Button.
This will bring you back to you Dashboard, that now includes the note.
3. Ordering & sizing of charts
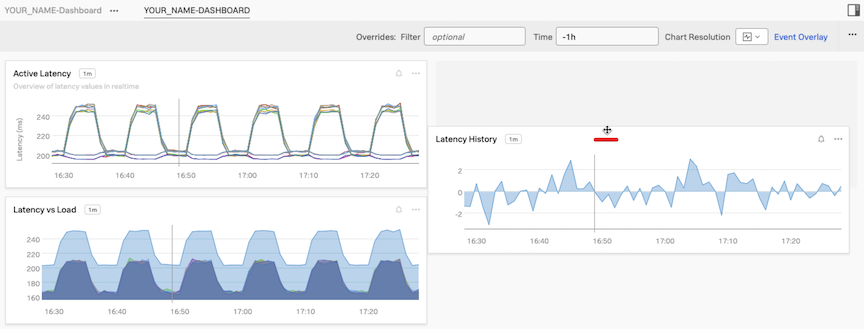
If you do not like the default order and sizes of your charts you can simply use window dragging technique to move and size them to the desired location.
Grab the top border of a chart and you should see the mouse pointer change to a drag icon (see picture below).
Now drag the Latency vs Load chart to sit between the Latency History Chart and the Example text chart.
You can also resize windows by dragging from the left, right and bottom edges.
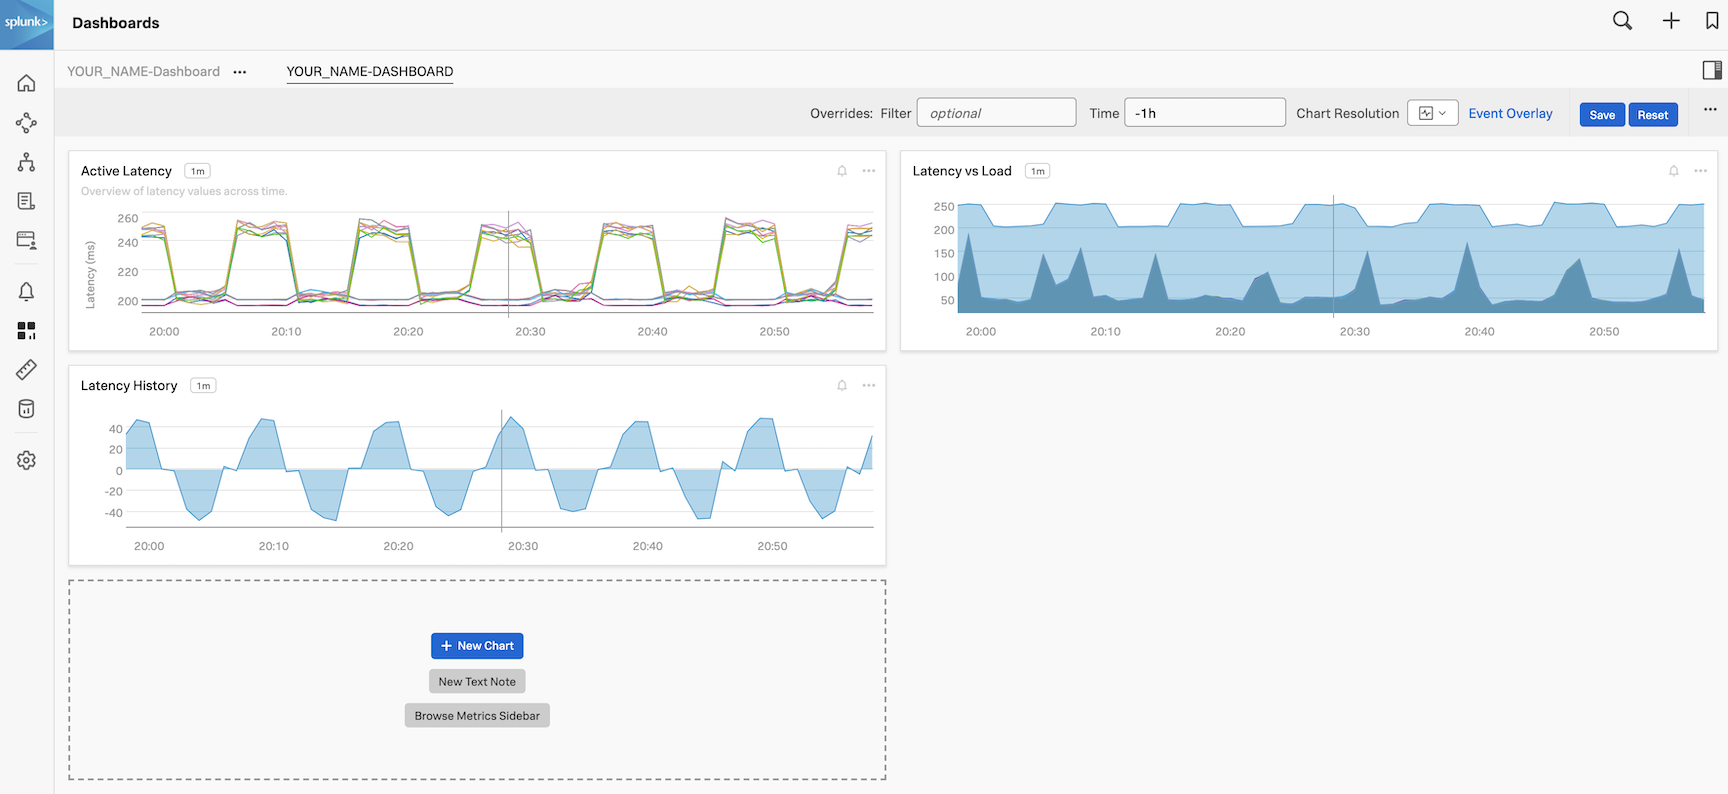
As a last exercise reduce the width of the note chart to about a third of the other charts. The chart will automatically snap to one of the sizes it supports. Widen the 3 other charts to about a third of the Dashboard. Drag the notes to the right of the others and resize it to match it to the 3 others. Set the Time to -1h and you should have the following dashboard!
On to Detectors!
Working with Detectors
10 minutes
Create a Detector from one of your charts
Setting Alert conditions
Running a pre-flight check
Working with muting rules
1. Introduction
Splunk Observability Cloud uses detectors, events, alerts, and notifications to keep you informed when certain criteria are met. For example, you might want a message sent to a Slack channel or an email address for the Ops team when CPU Utilization has reached 95%, or when the number of concurrent users is approaching a limit that might require you to spin up an additional AWS instance.
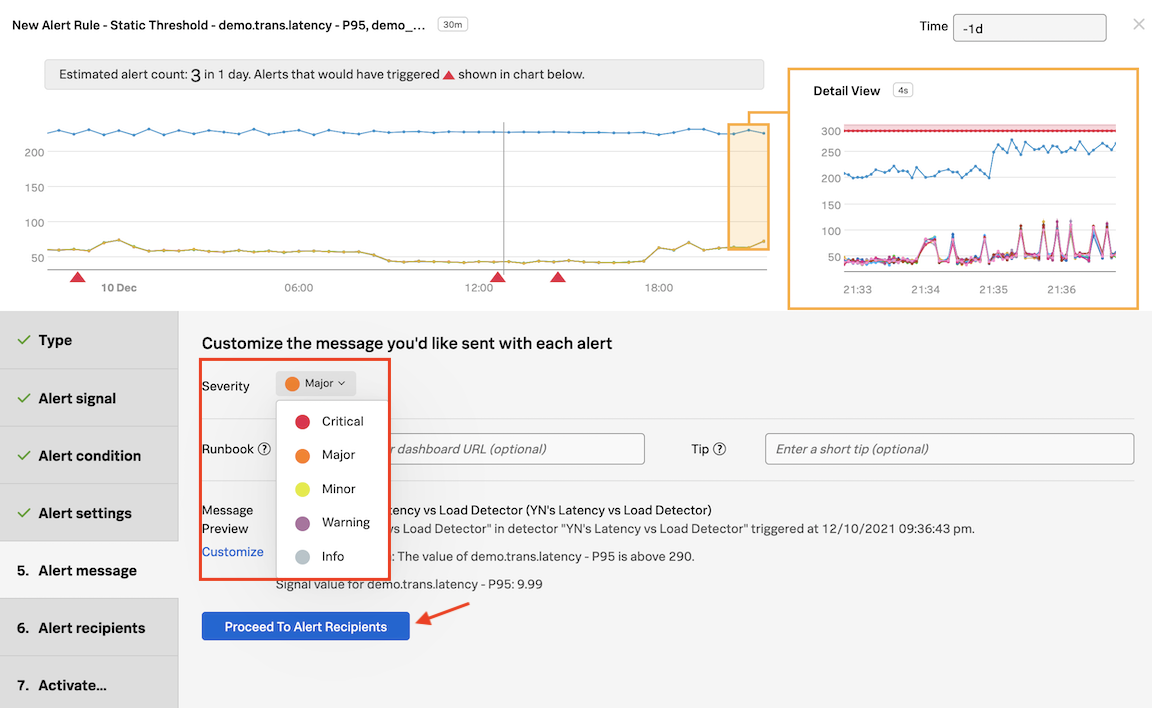
These conditions are expressed as one or more rules that trigger an alert when the conditions in the rules are met. Individual rules in a detector are labeled according to criticality: Info, Warning, Minor, Major, and Critical.
2. Creating a Detector
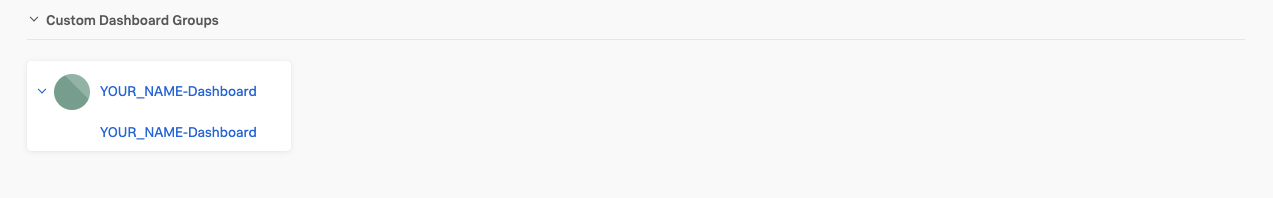
In Dashboards click on your Custom Dashboard Group (that you created in the previous module) and then click on the dashboard name.
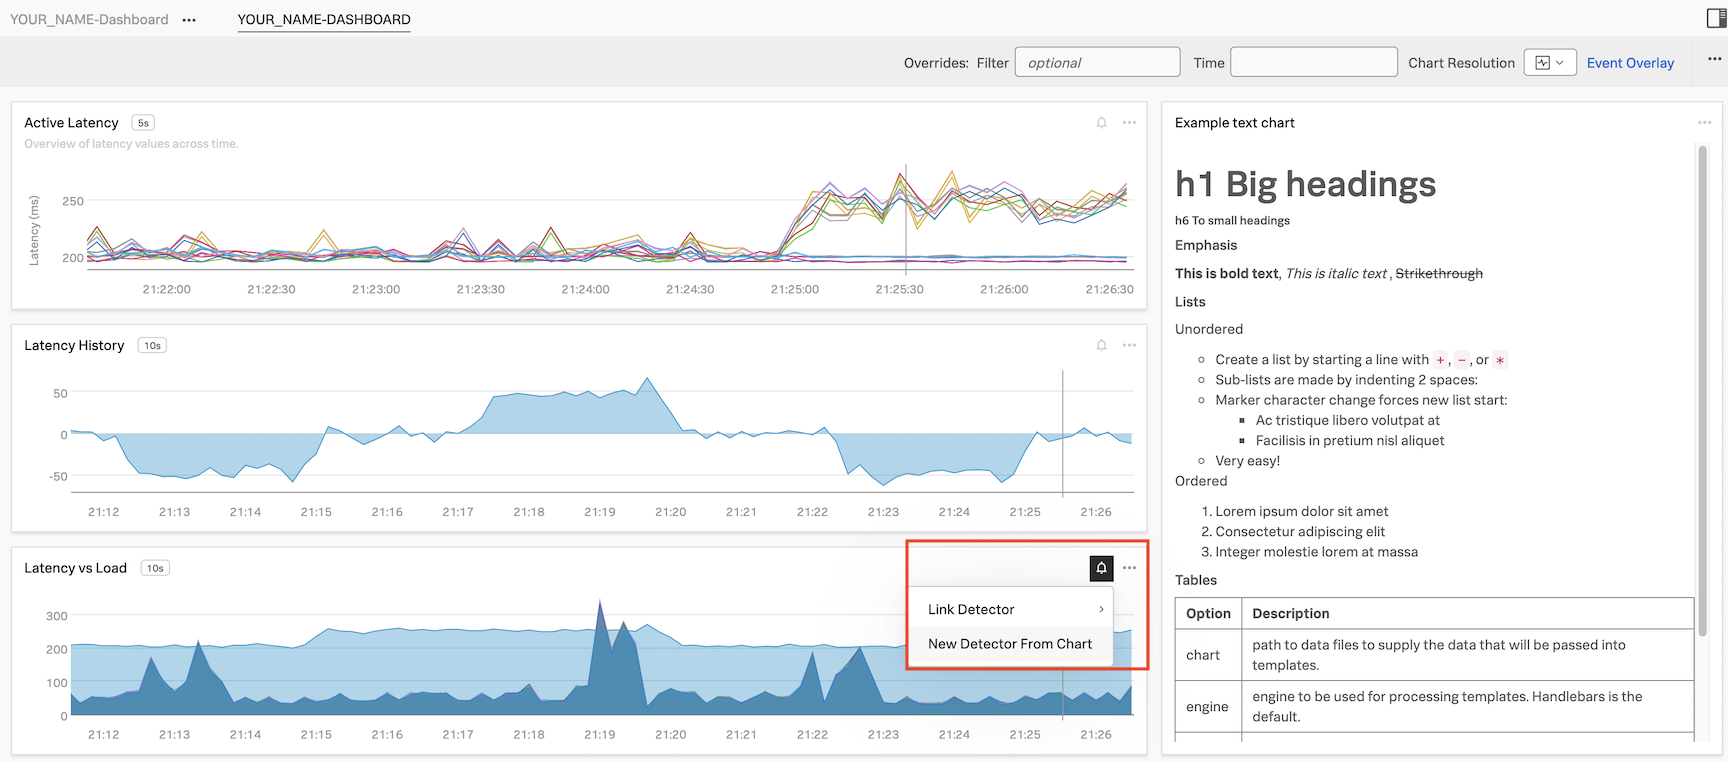
We are now going to create a new detector from a chart on this dashboard. Click on the bell icon on the Latency vs Load chart, and then click New Detector From Chart.
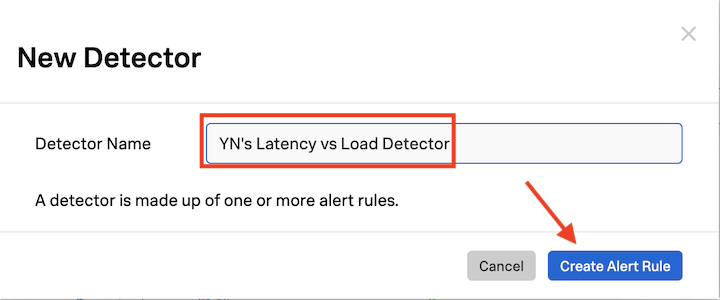
In the text field next to Detector Name, ADD YOUR INITIALS before the proposed detector name.
Naming the detector
It’s important that you add your initials in front of the proposed detector name.
It should be something like this: XYZ’s Latency Chart Detector.
Click on Create Alert Rule
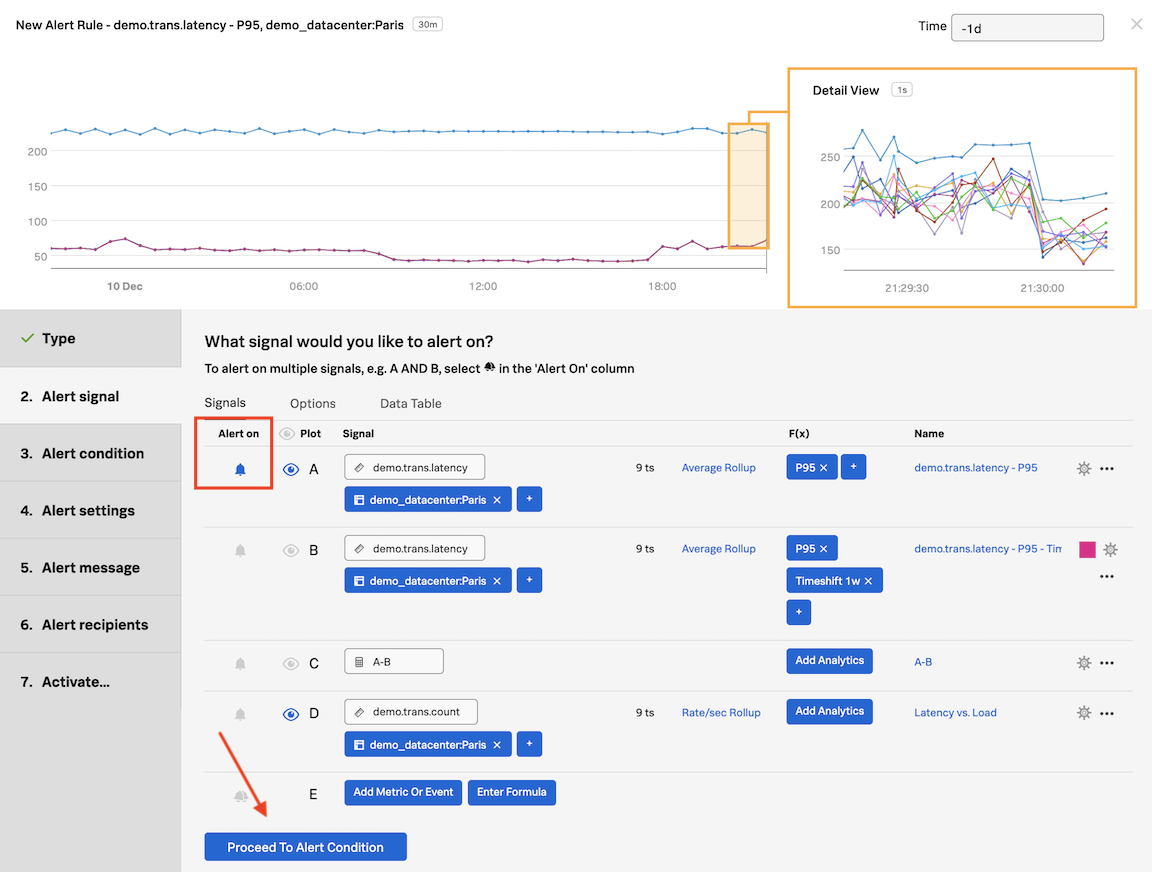
In the Detector window, inside Alert signal, the Signal we will alert on is marked with a (blue) bell in the Alert on column. The bell indicates which Signal is being used to generate the alert.
Click on Proceed to Alert Condition
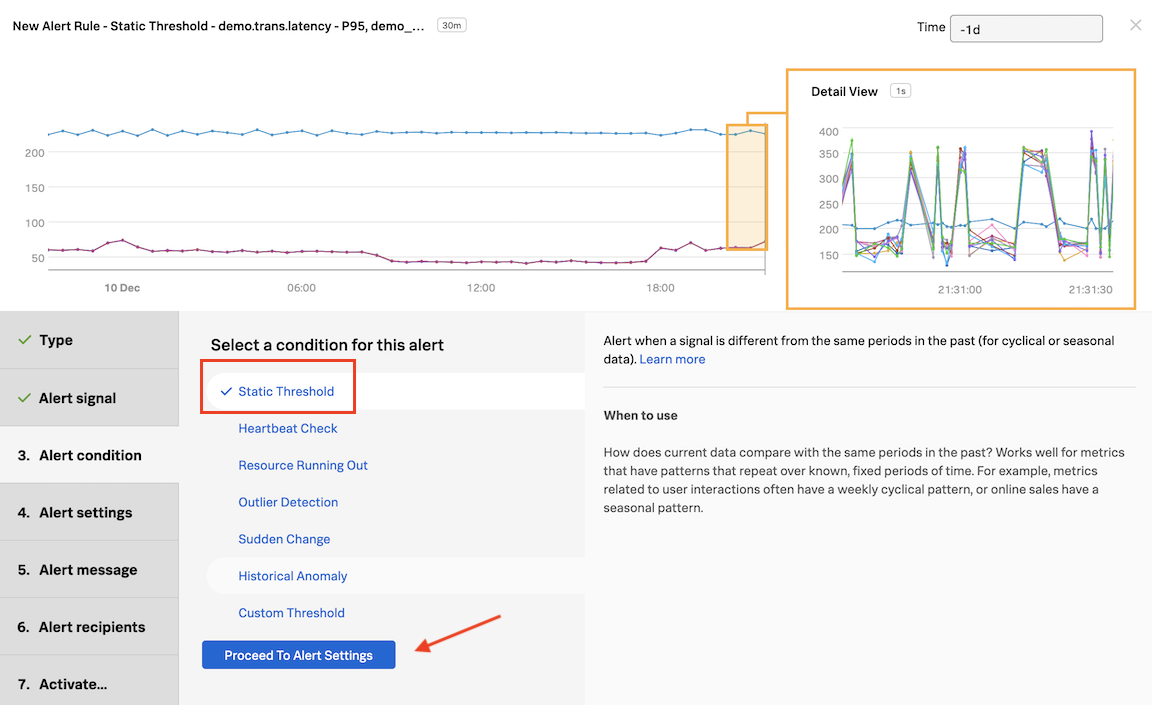
3. Setting Alert condition
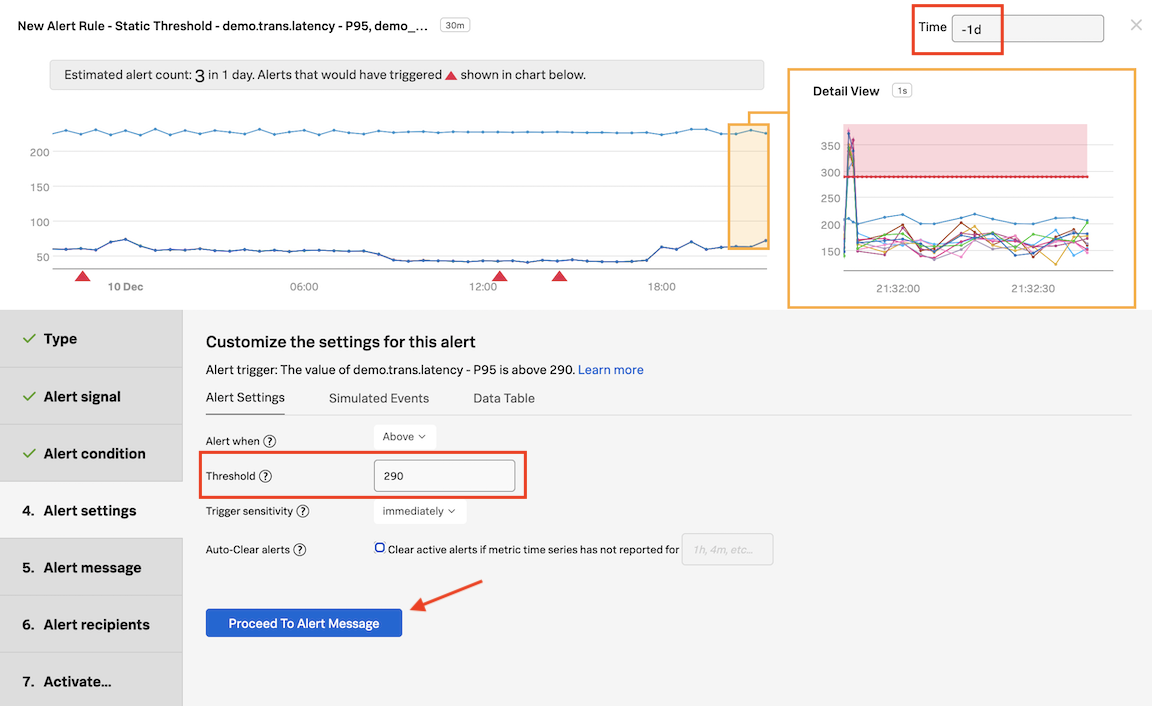
In Alert condition, click on Static Threshold and then on Proceed to Alert Settings
In Alert Settings, enter the value 290 in the Threshold field. In the same window change Time on top right to past day (-1d).
4. Alert pre-flight check
A pre-flight check will take place after 5 seconds. See the Estimated alert count. Based on the current alert settings, the amount of alerts we would have received in 1 day would have been 3.
About pre-flight checks
Once you set an alert condition, the UI estimates how many alerts you might get based on the current settings, and in the timeframe set on the upper right corner - in this case, the past day.
Immediately, the platform will start analyzing the signals with the current settings, and perform something we call a Pre-flight Check. This enables you to test the alert conditions using the historical data in the platform, to ensure the settings are logical and will not inadvertently generate an alert storm, removing the guesswork from configuring alerts in a simple but very powerful way, only available using the Splunk Observability Cloud.
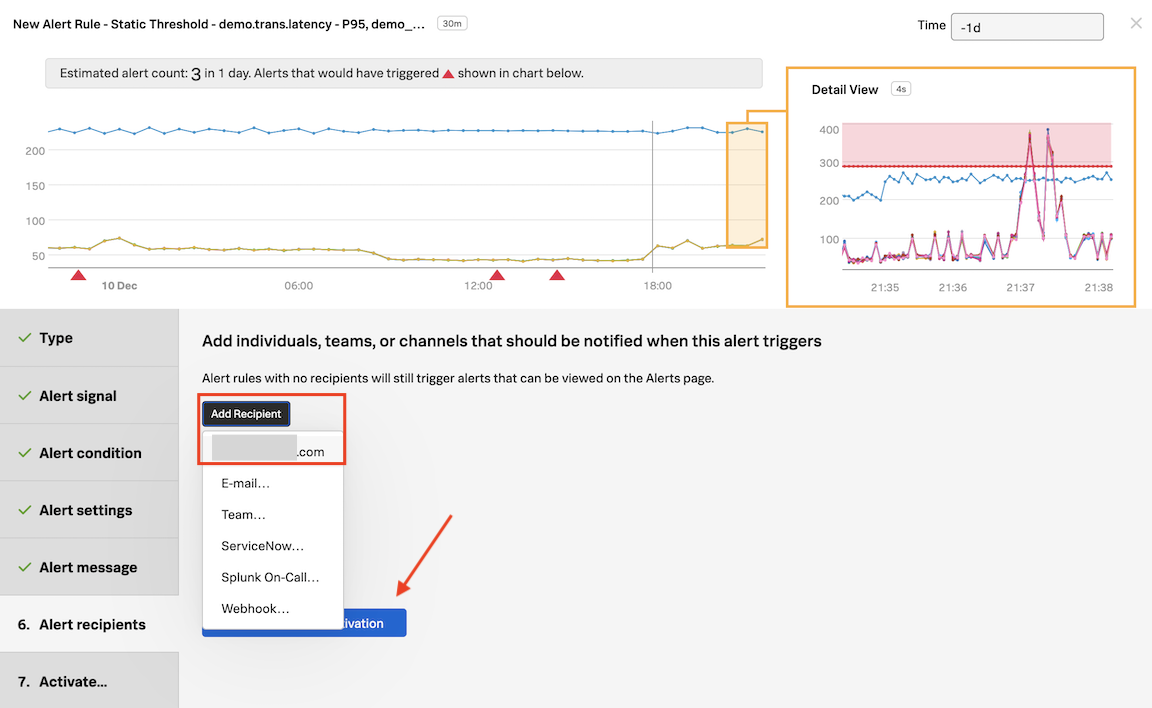
Click on Add Recipient and then on your email address displayed as the first option.
Notification Services
That’s the same as entering that email address OR you can enter another email address by clicking on E-mail….
This is just one example of the many Notification Services the platform has available. You can check this out by going to the Integrations tab of the top menu, and see Notification Services.
6. Alert Activation
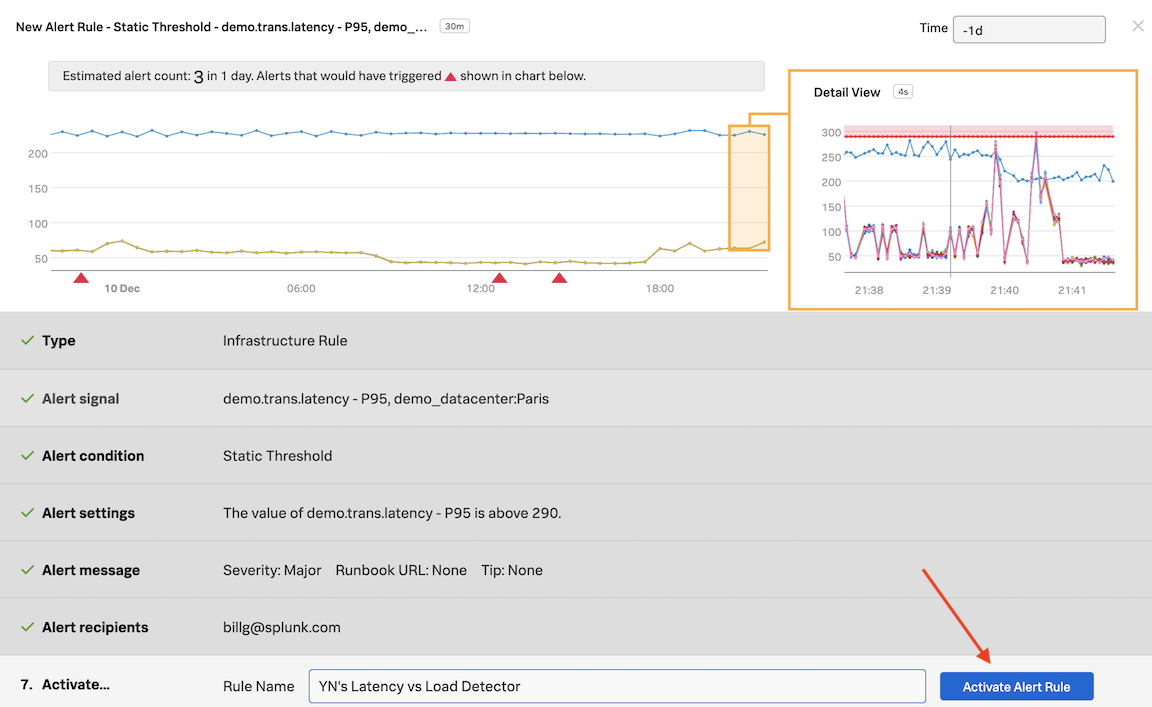
Click on Proceed to Alert Activation
In Activate… click on Activate Alert Rule
If you want to get alerts quicker you edit the rule and lower the value from 290 to say 280.
If you change the Time to -1h you can see how many alerts you might get with the threshold you have chosen based on the metrics from the last 1 hour.
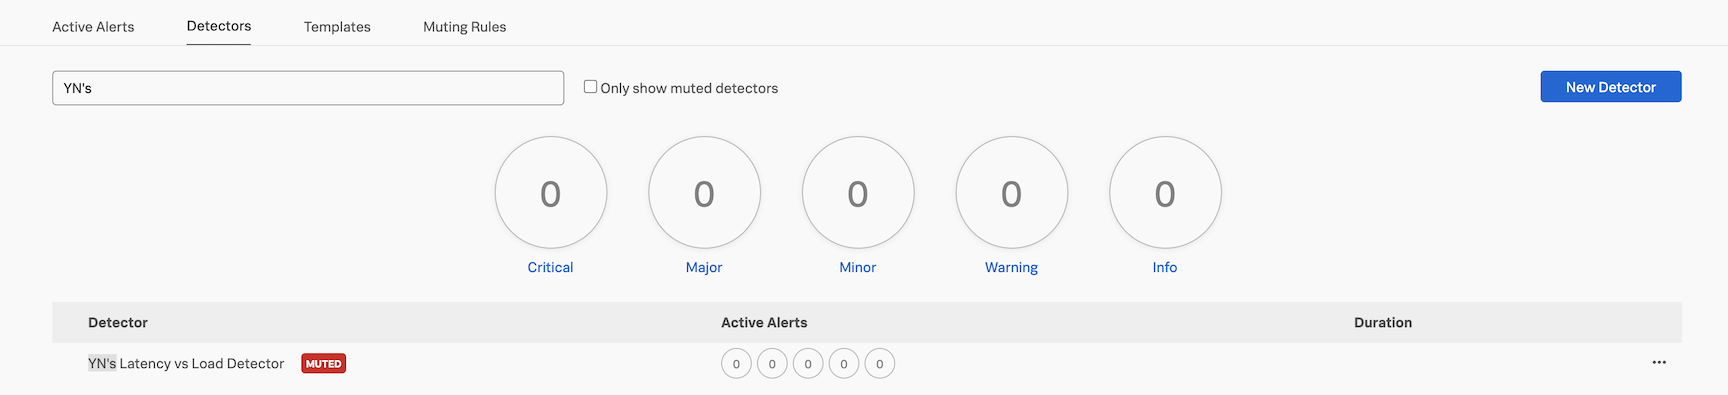
Click on the in the navbar and then click on Detectors. You can optionally filter for your initials. You will see you detector listed here. If you don’t then please refresh your browser.
Congratulations! You have created your first detector and activated it!
Subsections of Working with Detectors
Working with Muting Rules
Learn how to configure Muting Rules
Learn how to resume notifications
1. Configuring Muting Rules
There will be times when you might want to mute certain notifications. For example, if you want to schedule downtime for maintenance on a server or set of servers, or if you are testing new code or settings etc. For that you can use muting rules in Splunk Observability Cloud. Let’s create one!
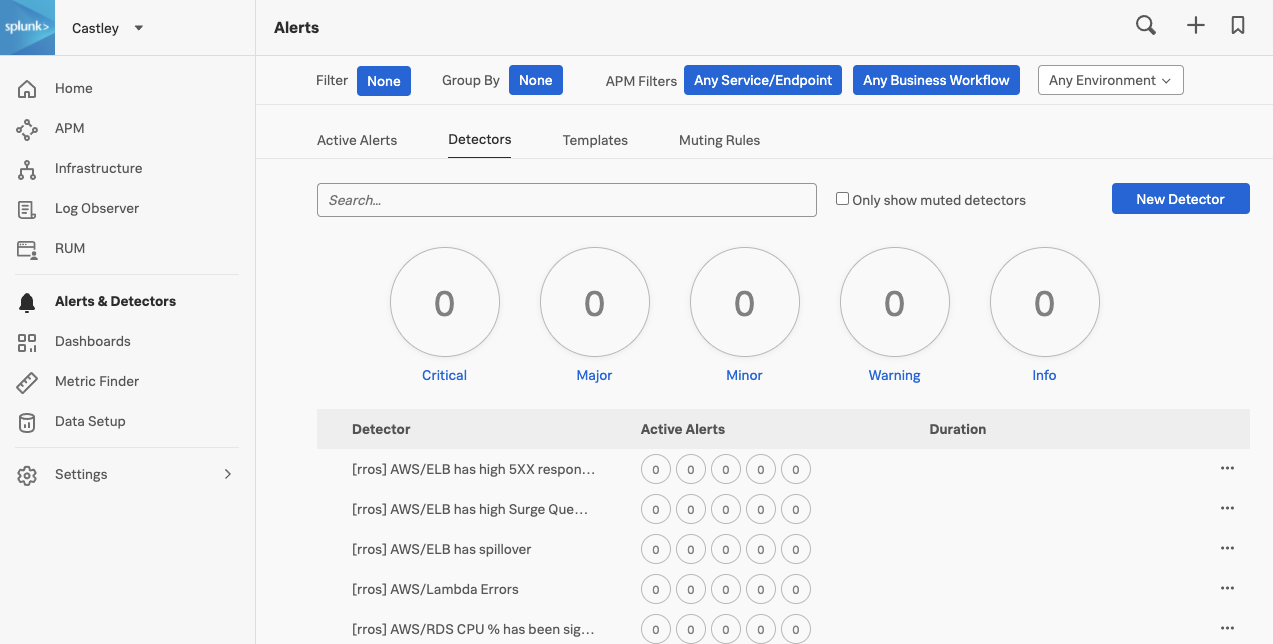
Click on Alerts & Detectors in the sidebar and then click Detectors to see the list of active detectors.
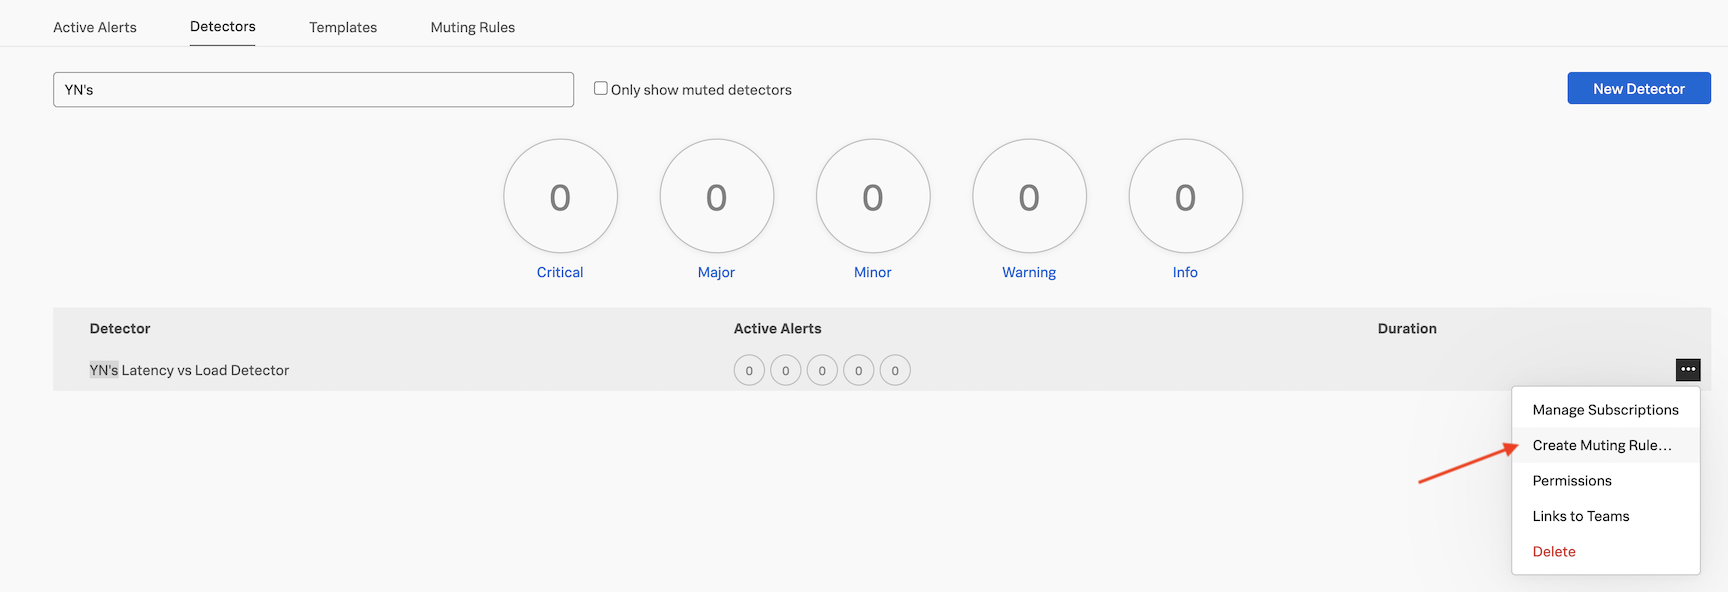
If you created a detector in Creating a Detector you can click on the three dots ... on the far right for that detector; if not, do that for another detector.
From the drop-down click on Create Muting Rule…
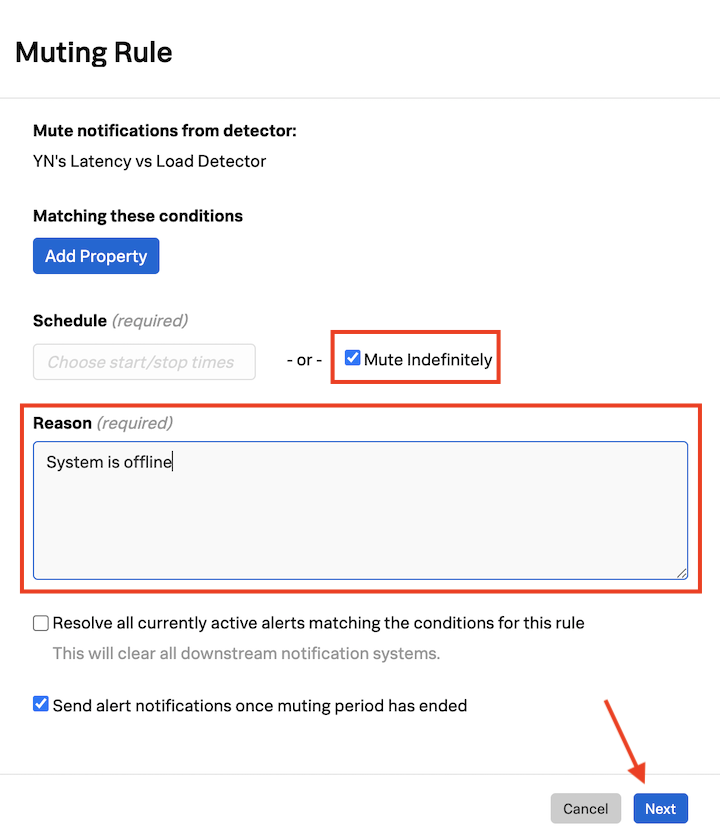
In the Muting Rule window check Mute Indefinitely and enter a reason.
Important
This will mute the notifications permanently until you come back here and un-check this box or resume notifications for this detector.
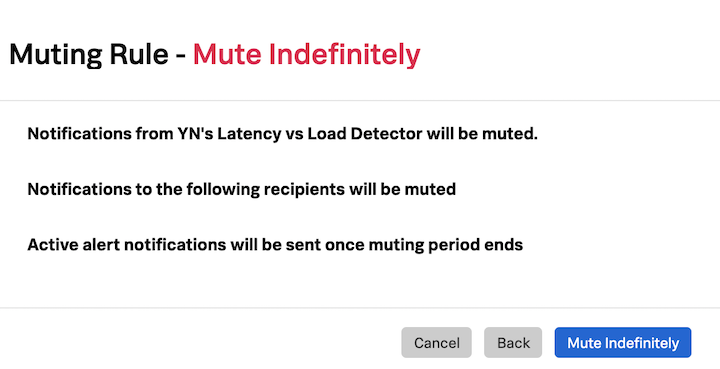
Click Next and in the new modal window confirm the muting rule setup.
Click on Mute Indefinitely to confirm.
You won’t be receiving any email notifications from your detector until you resume notifications again. Let’s now see how to do that!
2. Resuming notifications
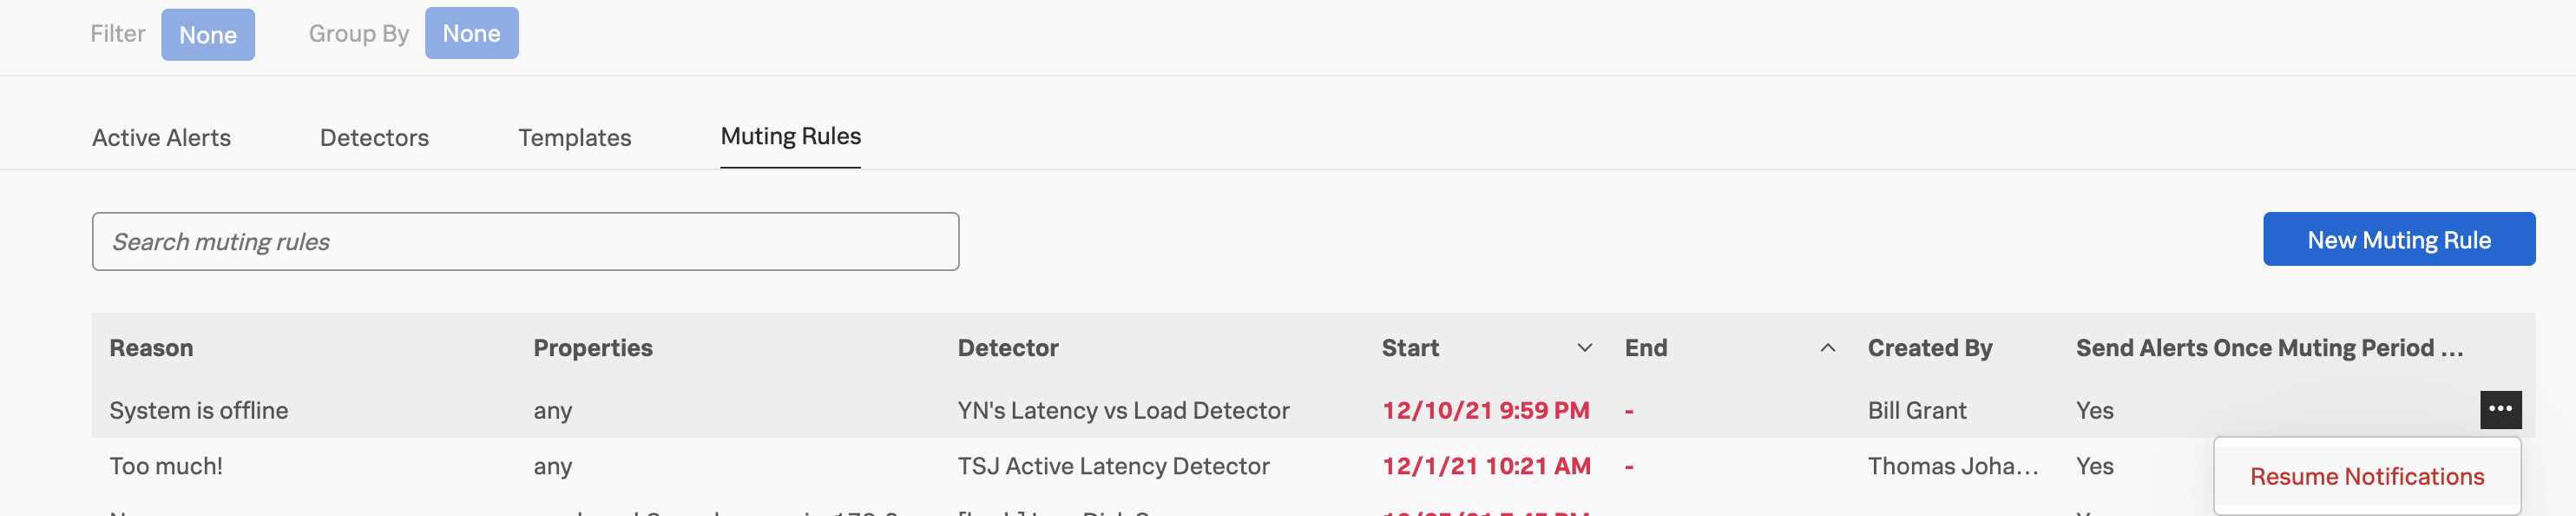
To Resume notifications, click on Muting Rules, you will see the name of the detector you muted notifications for under Detector heading.
Click on the thee dots ... on the far right, and click on Resume Notifications.
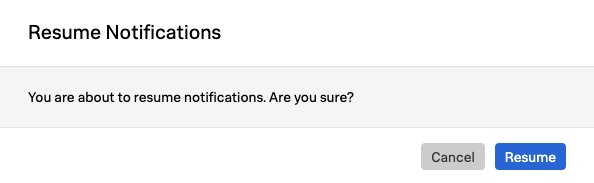
Click on Resume to confirm and resume notifications for this detector.
Congratulations! You have now resumed your alert notifications!
Monitoring as Code
10 minutes
Use Terraform1 to manage Observability Cloud Dashboards and Detectors
Run Terraform to create detectors and dashboards from code using the Splunk Terraform Provider.
See how Terraform can also delete detectors and dashboards.
1. Initial setup
Monitoring as code adopts the same approach as infrastructure as code. You can manage monitoring the same way you do applications, servers, or other infrastructure components.
You can use monitoring as code to build out your visualizations, what to monitor, and when to alert, among other things. This means your monitoring setup, processes, and rules can be versioned, shared, and reused.
Full documentation for the Splunk Terraform Provider is available here.
Remaining in your AWS/EC2 instance, change into the o11y-cloud-jumpstart directory
cd ~/observability-content-contrib/integration-examples/terraform-jumpstart
Initialize Terraform and upgrade to the latest version of the Splunk Terraform Provider.
Note: Upgrading the SignalFx Terraform Provider
You will need to run the command below each time a new version of the Splunk Terraform Provider is released. You can track the releases on GitHub.
terraform init -upgrade
    Upgrading modules...
    - aws in modules/aws
    - azure in modules/azure
    - docker in modules/docker
    - gcp in modules/gcp
    - host in modules/host
    - kafka in modules/kafka
    - kubernetes in modules/kubernetes
    - parent_child_dashboard in modules/dashboards/parent
    - pivotal in modules/pivotal
    - rum_and_synthetics_dashboard in modules/dashboards/rum_and_synthetics
    - usage_dashboard in modules/dashboards/usage

    Initializing the backend...

    Initializing provider plugins...
    - Finding latest version of splunk-terraform/signalfx...
    - Installing splunk-terraform/signalfx v6.20.0...
    - Installed splunk-terraform/signalfx v6.20.0 (self-signed, key ID CE97B6074989F138)

    Partner and community providers are signed by their developers.
    If you'd like to know more about provider signing, you can read about it here:
    https://www.terraform.io/docs/cli/plugins/signing.html

    Terraform has created a lock file .terraform.lock.hcl to record the provider
    selections it made above. Include this file in your version control repository
    so that Terraform can guarantee to make the same selections by default when
    you run "terraform init" in the future.

    Terraform has been successfully initialized!

    You may now begin working with Terraform. Try running "terraform plan" to see
    any changes that are required for your infrastructure. All Terraform commands
    should now work.

    If you ever set or change modules or backend configuration for Terraform,
    rerun this command to reinitialize your working directory. If you forget, other
    commands will detect it and remind you to do so if necessary.
2. Create execution plan
The terraform plan command creates an execution plan. By default, creating a plan consists of:
Reading the current state of any already-existing remote objects to make sure that the Terraform state is up-to-date.
Comparing the current configuration to the prior state and noting any differences.
Proposing a set of change actions that should, if applied, make the remote objects match the configuration.
The plan command alone will not actually carry out the proposed changes, and so you can use this command to check whether the proposed changes match what you expected before you apply the changes
terraform plan -var="api_token=$API_TOKEN" -var="realm=$REALM" -var="o11y_prefix=[$INSTANCE]"
Plan: 146 to add, 0 to change, 0 to destroy.
If the plan executes successfully, we can go ahead and apply:
3. Apply execution plan
The terraform apply command executes the actions proposed in the Terraform plan above.
The most straightforward way to use terraform apply is to run it without any arguments at all, in which case it will automatically create a new execution plan (as if you had run terraform plan) and then prompt you to provide the API Token, Realm (the prefix defaults to Splunk) and approve the plan, before taking the indicated actions.
Due to this being a workshop it is required that the prefix is to be unique so you need to run the terraform apply below.
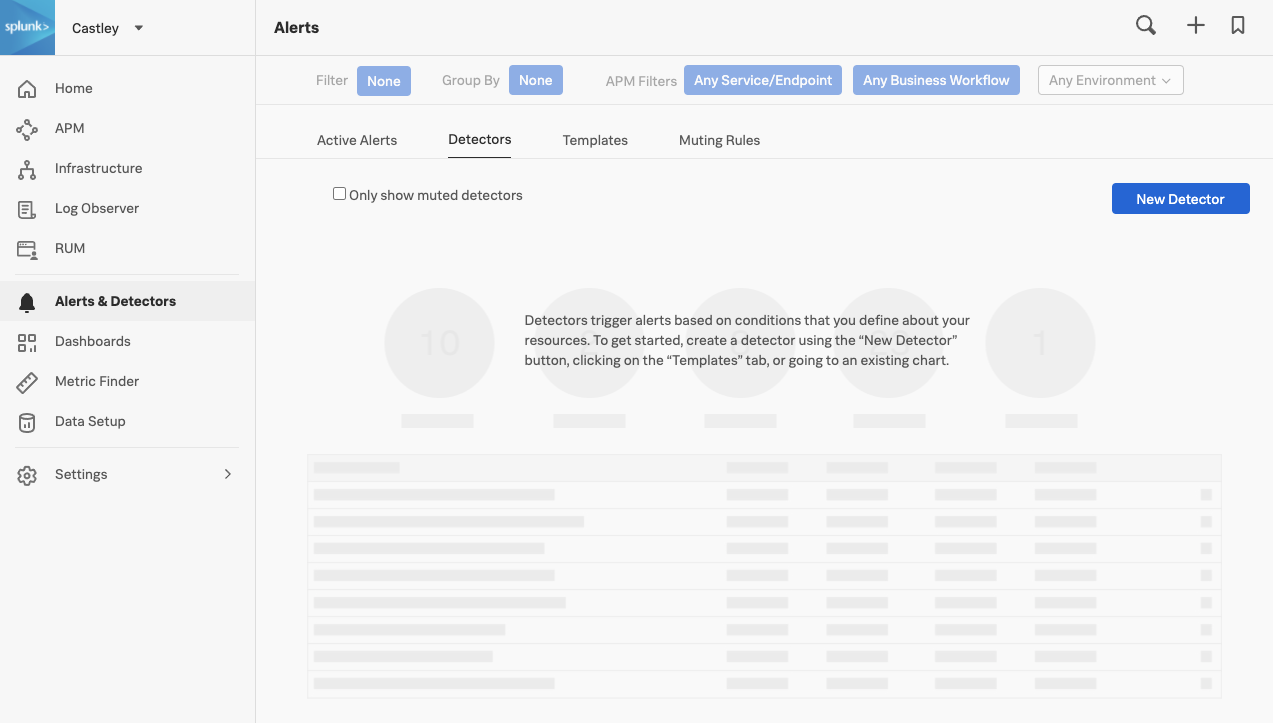
Once the apply has been completed, validate that the detectors were created, under the Alerts & Detectors and click on the Detectors tab. They will be prefixed by the instance name. To check the prefix value run:
echo$INSTANCE
You will see a list of the new detectors and you can search for the prefix that was output from above.
3. Destroy all your hard work
The terraform destroy command is a convenient way to destroy all remote objects managed by your Terraform configuration.
While you will typically not want to destroy long-lived objects in a production environment, Terraform is sometimes used to manage ephemeral infrastructure for development purposes, in which case you can use terraform destroy to conveniently clean up all of those temporary objects once you are finished with your work.
Now go and destroy all the Detectors and Dashboards that were previously applied!
Validate all the detectors have been removed by navigating to Alerts → Detectors
Terraform is a tool for building, changing, and versioning infrastructure safely and efficiently. Terraform can manage existing and popular service providers as well as custom in-house solutions. ↩︎
A provider is responsible for understanding API interactions and exposing resources. Providers generally are an IaaS (e.g. Alibaba Cloud, AWS, GCP, Microsoft Azure, OpenStack), PaaS (e.g. Heroku), or SaaS services (e.g. Splunk, Terraform Cloud, DNSimple, Cloudflare). ↩︎
Service Bureau
10 minutes
How to keep track of the usage of Observability Cloud in your organization
Learn how to keep track of spend by exploring the Subscription Usage interface
Creating Teams
Adding notification rules to Teams
Controlling usage
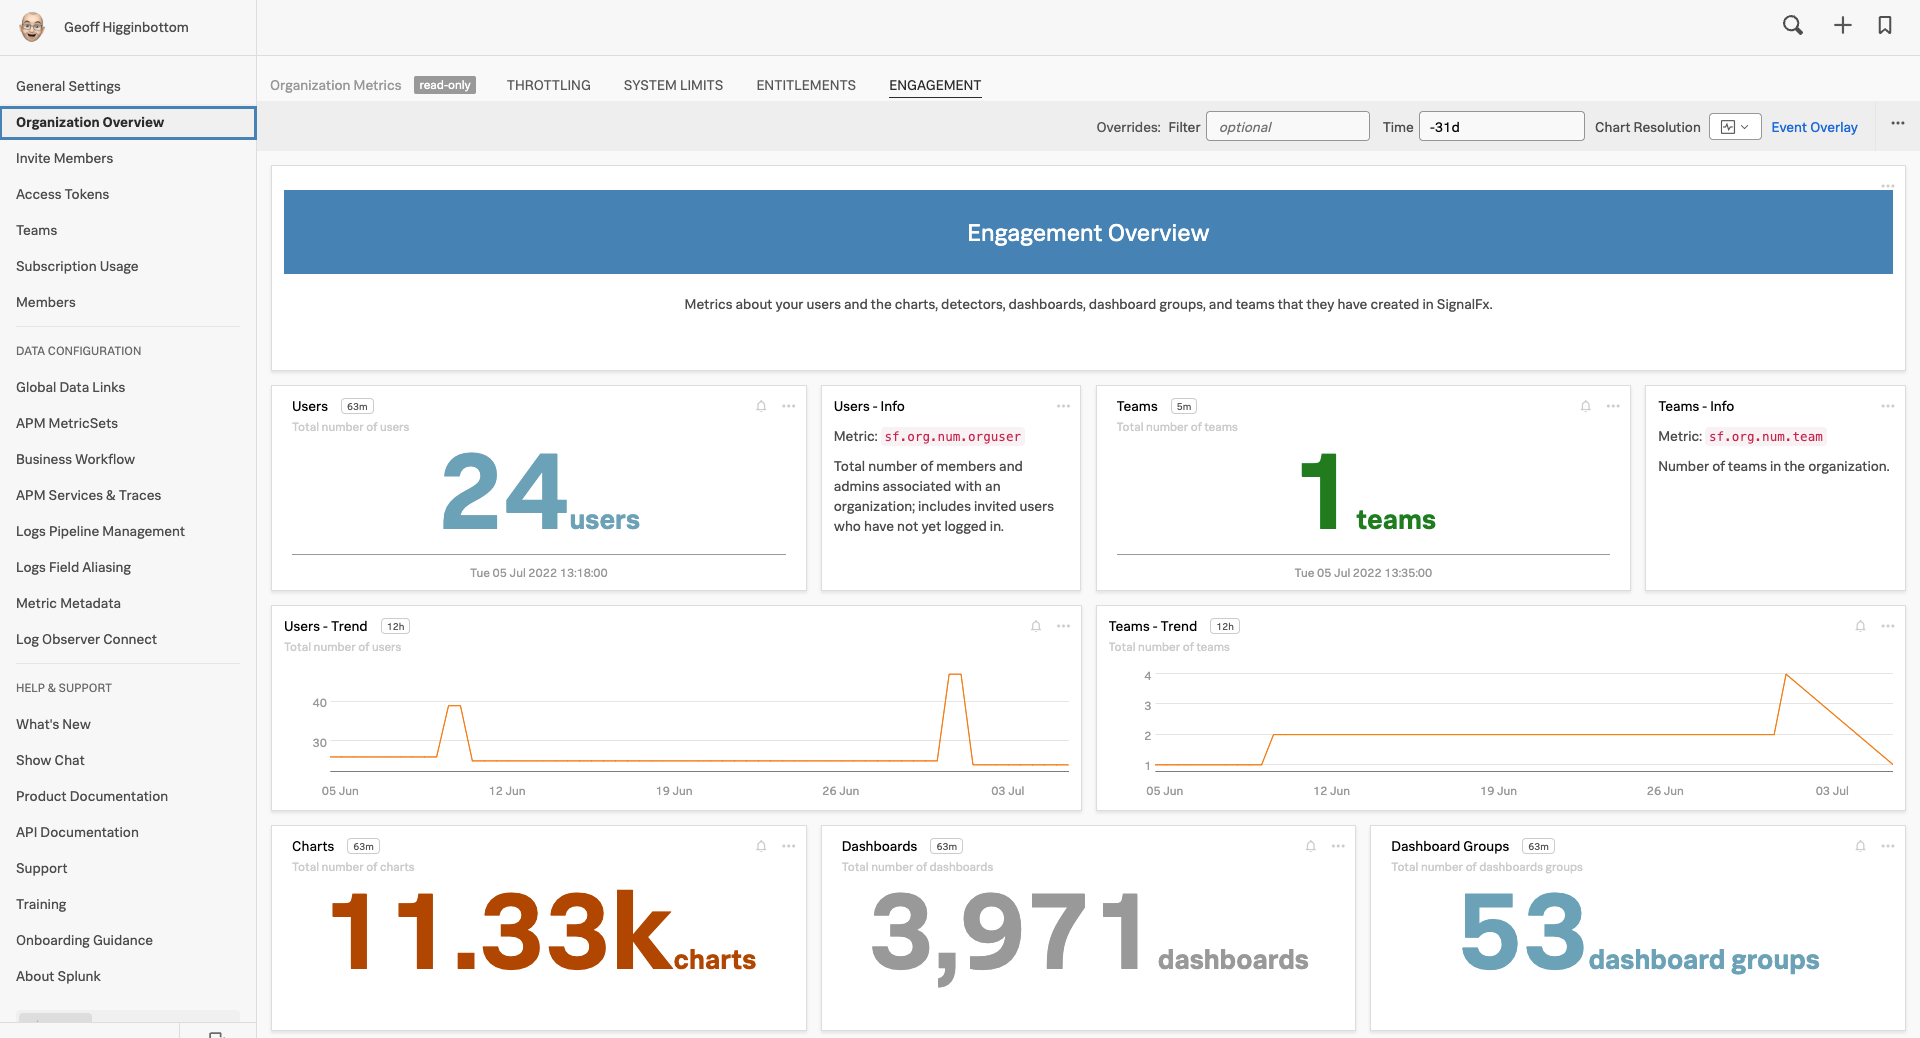
1. Understanding engagement
To fully understand Observability Cloud engagement inside your organization, click on the » bottom left and select the Settings → Organization Overview, this will provide you with the following dashboards that show you how your Observability Cloud organization is being used:
You will see various dashboards such as Throttling, System Limits, Entitlements & Engagement. The workshop organization you’re using now may have less data to work with as this is cleared down after each workshop.
Take a minute to explore the various dashboards and charts in the Organization Overview of this workshop instance.
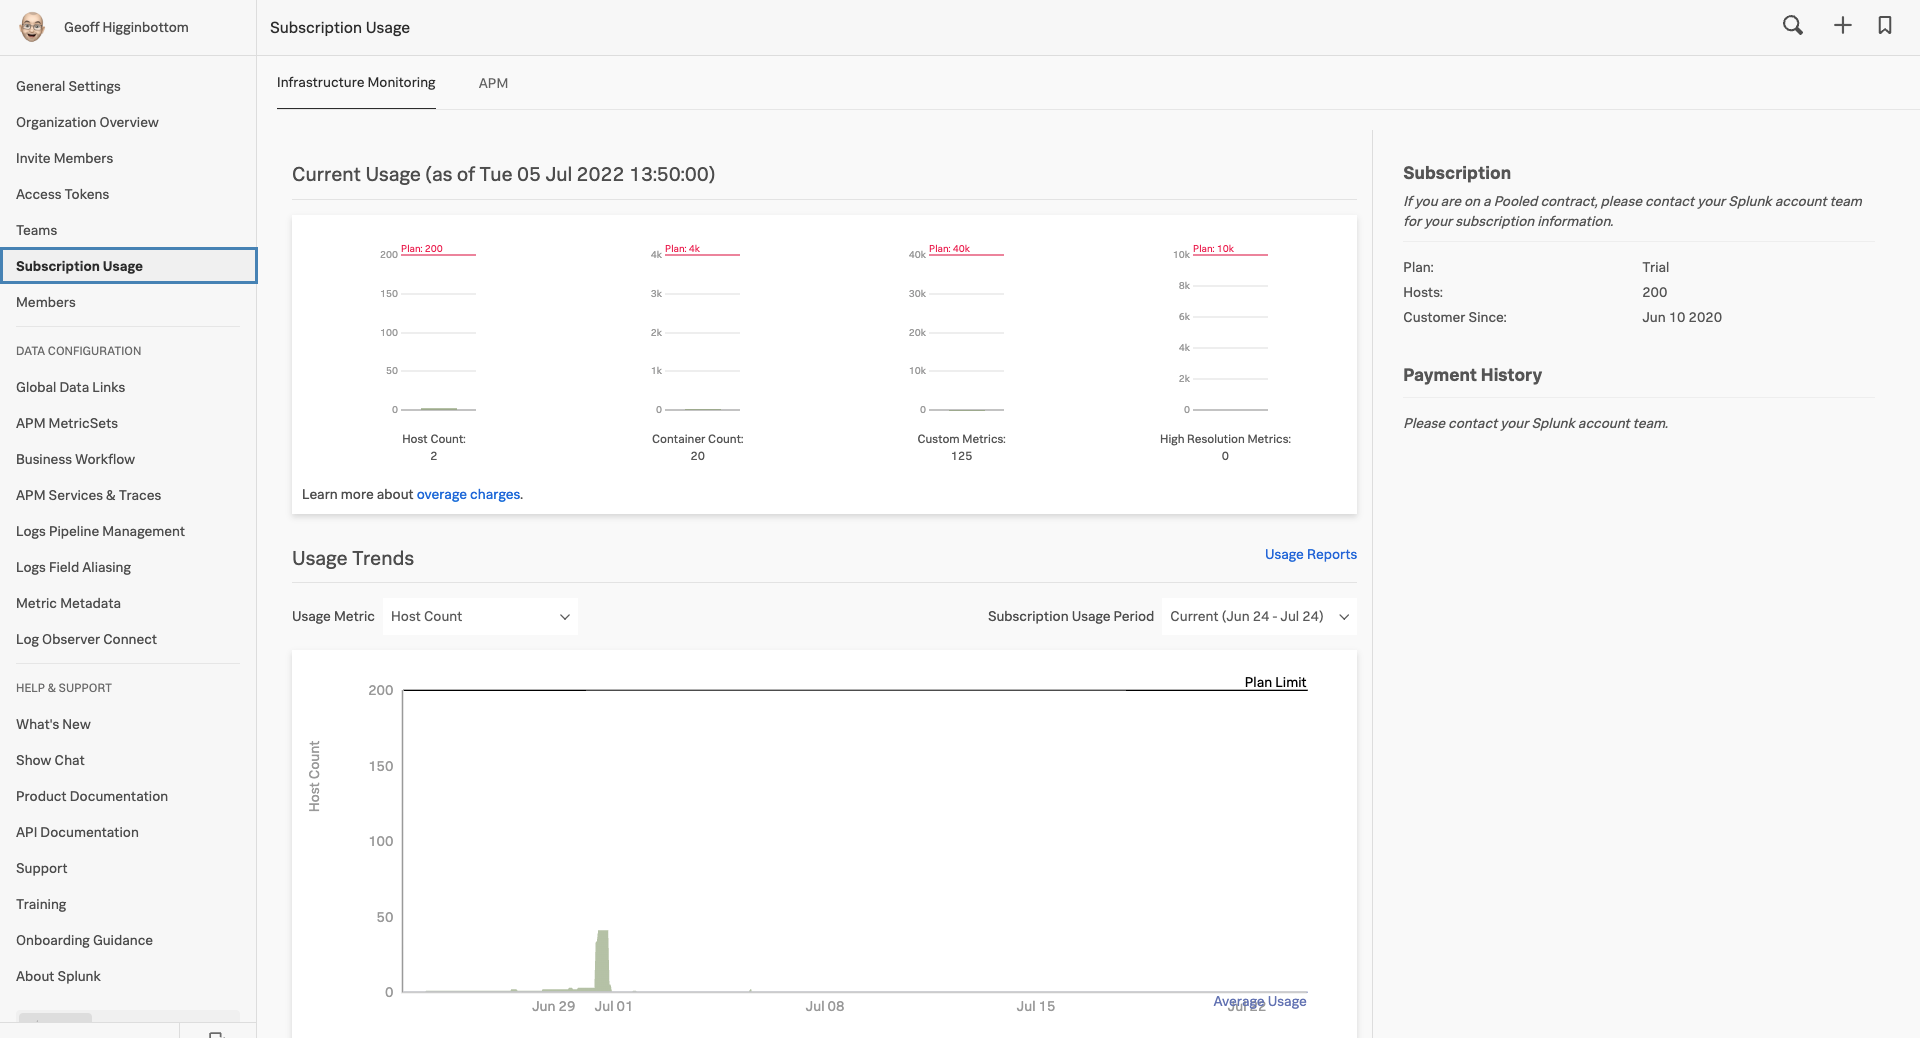
2. Subscription Usage
If you want to see what your usage is against your subscription you can select Subscription Usage.
This screen may take a few seconds to load whilst it calculates and pulls in the usage.
3. Understanding usage
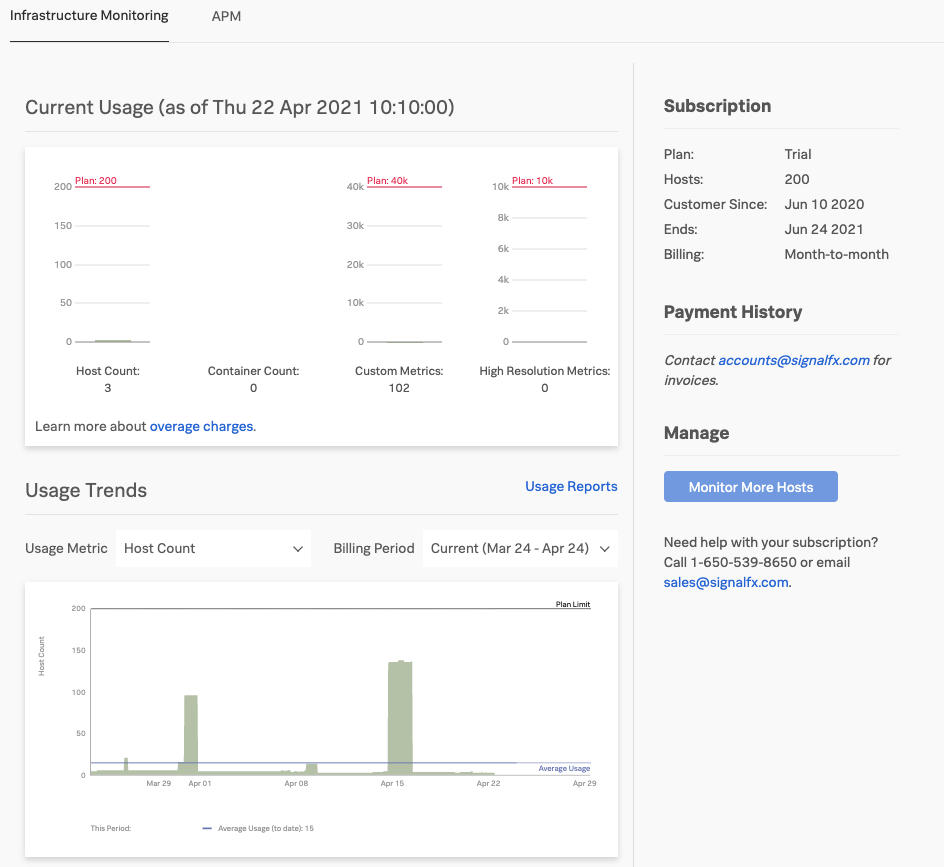
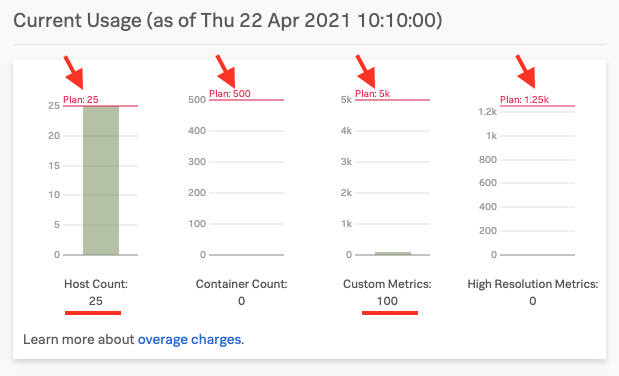
You will see a screen similar to the one below that will give you an overview of the current usage, the average usage and your entitlement per category: Hosts, Containers, Custom Metrics and High Resolution Metrics.
The top chart shows you the current subscription levels per category (shown by the red arrows at the top in the screenshot below).
Also, your current usage of the four categories is displayed (shown in the red lines at the bottom of the chart).
In this example, you can see that there are 25 Hosts, 0 Containers, 100 Custom Metrics and 0 High Resolution Metrics.
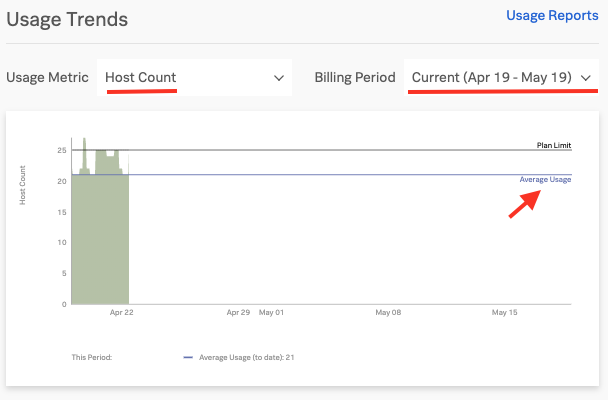
In the bottom chart, you can see the usage per category for the current period (shown in the drop-down box on the top right of the chart).
The blue line marked Average Usage indicates what Observability Cloud will use to calculate your average usage for the current Subscription Usage Period.
Info
As you can see from the screenshot, Observability Cloud does not use High Watermark or P95% for cost calculation but the actual average hourly usage, allowing you to do performance testing or Blue/Green style deployments etc. without the risk of overage charges.
To get a feel for the options you can change the metric displayed by selecting the different options from the Usage Metric drop-down on the left, or change the Subscription Usage Period with the drop-down on the right.
Please take a minute to explore the different time periods & categories and their views.
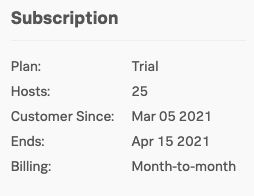
Finally, the pane on the right shows you information about your Subscription.
Subsections of Service Bureau
Teams
Introduction to Teams
Create a Team and add members to the Team
1. Introduction to Teams
To make sure that users see the dashboards and alerts that are relevant to them when using Observability Cloud, most organizations will use Observability Cloud’s Teams feature to assign a member to one or more Teams.
Ideally, this matches work-related roles, for example, members of a Dev-Ops or Product Management group would be assigned to the corresponding Teams in Observability Cloud.
When a user logs into Observability Cloud, they can choose which Team Dashboard will be their home page and they will typically select the page for their primary role.
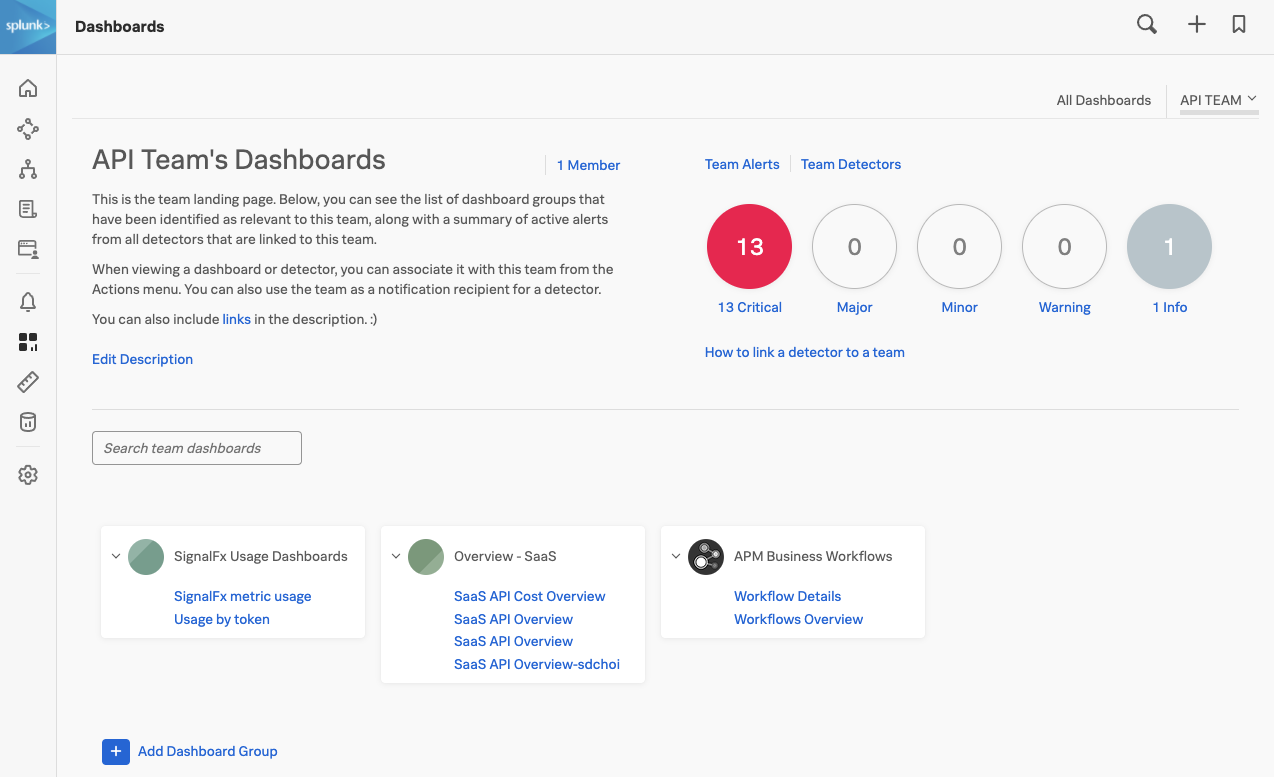
In the example below, the user is a member of the Development, Operations and Product Management Teams, and is currently viewing the Dashboard for the Operations Team.
This Dashboard has specific Dashboard Groups for Usage, SaaS and APM Business Workflows assigned but any Dashboard Group can be linked to a Teams Dashboard.
They can use the menu along the top left to quickly navigate between their allocated teams, or they can use the ALL TEAMS dropdown on the right to select specific Team Dashboards, as well as quickly access ALL Dashboards** using the adjacent link.
Alerts can be linked to specific Teams so the Team can monitor only the Alerts they are interested in, and in the above example, they currently have 1 active Critical Alert.
The Description for the Team Dashboard can be customized and can include links to team-specific resources (using Markdown).
2. Creating a new Team
To work with Splunk’s Team UI click on the hamburger icon top left and select the Organizations Settings → Teams.
When the Team UI is selected you will be presented with the list of current Teams.
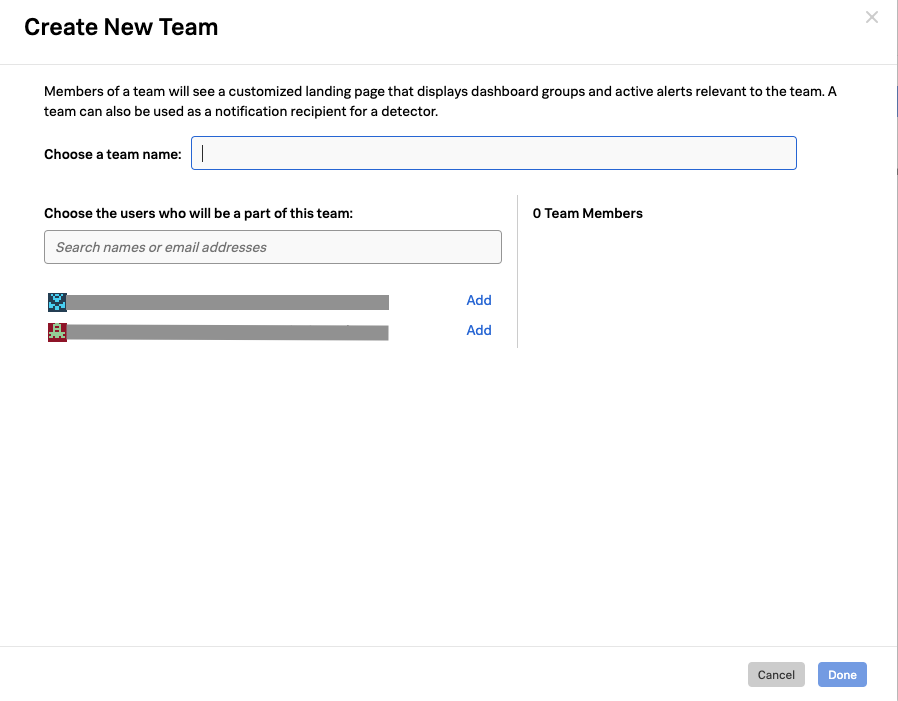
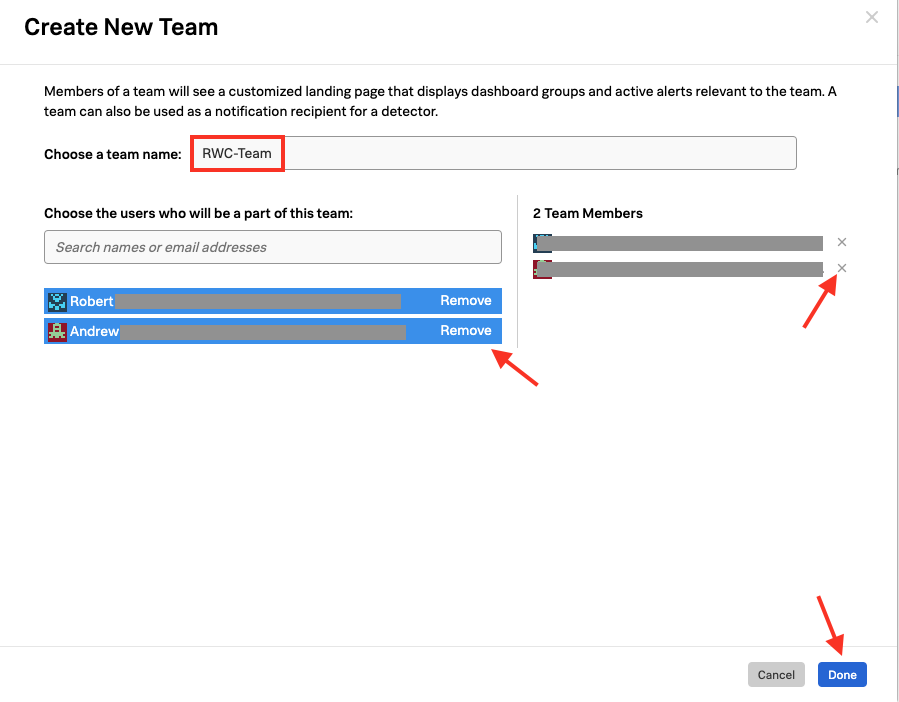
To add a new Team click on the Create New Team button. This will present you with the Create New Team dialog.
Create your own team by naming it [YOUR-INITIALS]-Team and add yourself by searching for your name and selecting the Add link next to your name. This should result in a dialog similar to the one below:
You can remove selected users by pressing Remove or the small x.
Make sure you have your group created with your initials and with yourself added as a member, then click Done
This will bring you back to the Teams list that will now show your Team and the ones created by others.
Note
The Teams(s) you are a member of have a grey Member icon in front of it.
If no members are assigned to your Team, you should see a blue Add Members link instead of the member count, clicking on that link will get you to the Edit Team dialog where you can add yourself.
This is the same dialog you get when pressing the 3 dots … at the end of the line with your Team and selecting Edit Team
The … menu gives you the option to Edit, Join, Leave or Delete a Team (leave and join will depend on if you are currently a member).
3. Adding Notification Rules
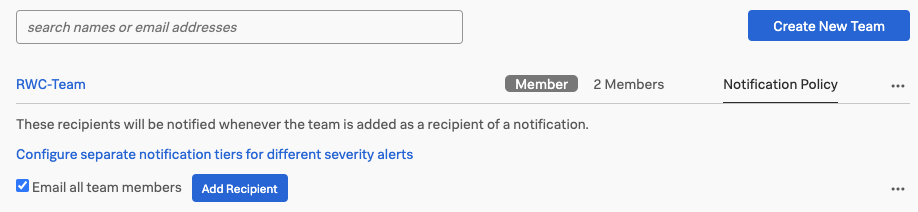
You can set up specific Notification rules per team, by clicking on the Notification Policy tab, this will open the notification edit menu.
By default, the system offers you the ability to set up a general notification rule for your team.
Note
The Email all team members option means all members of this Team will receive an email with the Alert information, regardless of the alert type.
3.1 Adding recipients
You can add other recipients, by clicking Add Recipient. These recipients do not need to be Observability Cloud users.
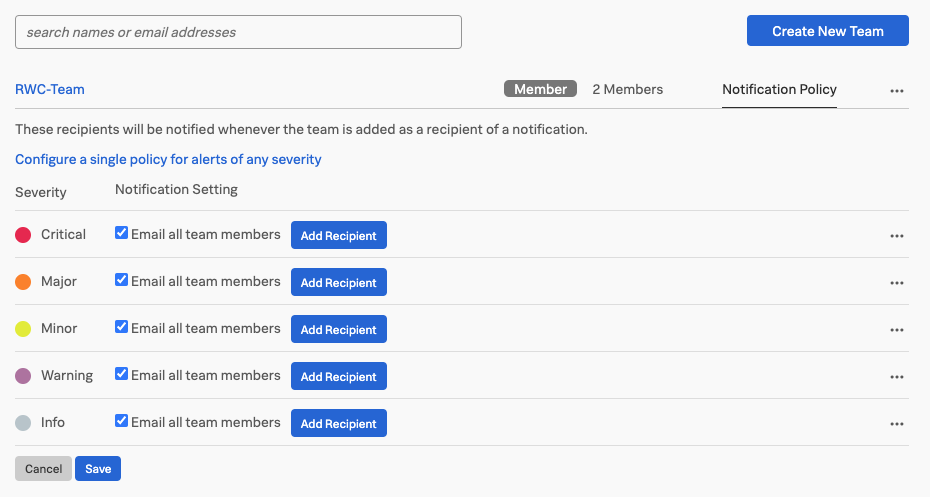
However, if you click on the link Configure separate notification tiers for different severity alerts you can configure every alert level independently.
Different alert rules for the different alert levels can be configured, as shown in the above image.
Critical and Major are using Splunk's On-Call Incident Management solution. For the Minor alerts, we send it to the Teams Slack channel and for Warning and Info we send an email.
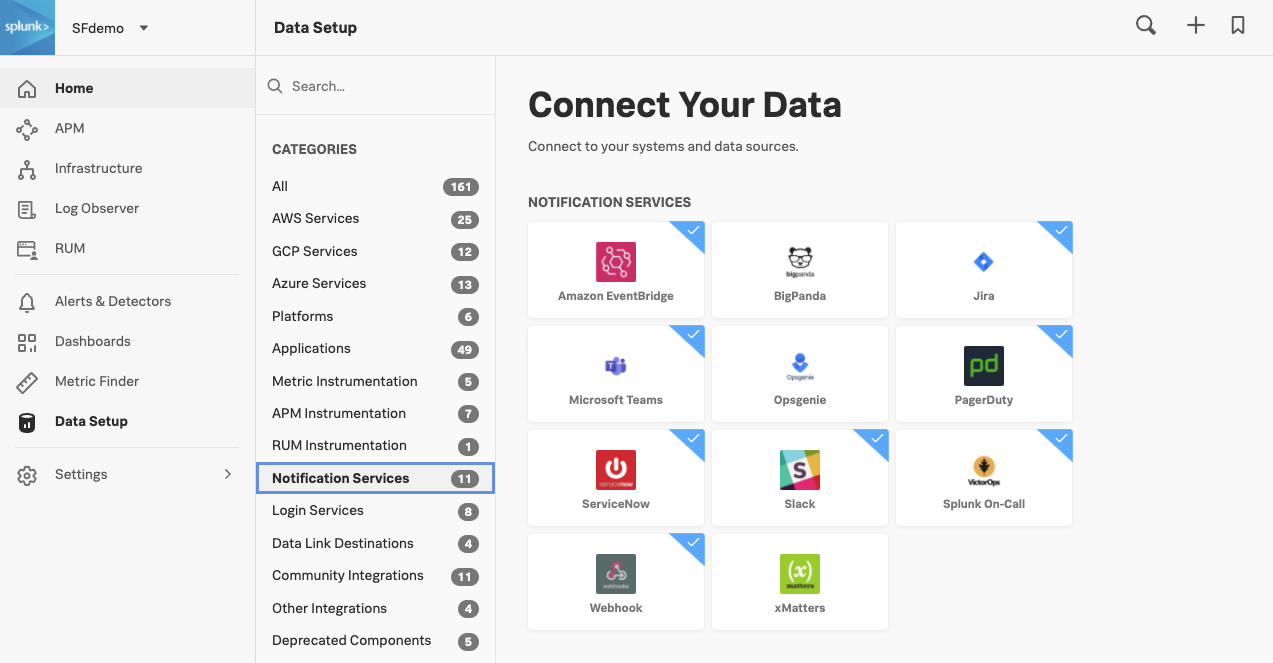
3.2 Notification Integrations
In addition to sending alert notifications via email, you can configure Observability Cloud to send alert notifications to the services shown below.
Take a moment to create some notification rules for your Team.
Controlling Usage
Discover how you can restrict usage by creating separate Access Tokens and setting limits.
1. Access Tokens
If you wish to control the consumption of Hosts, Containers, Custom Metrics and High Resolution Metrics, you can create multiple Access Tokens and allocate them to different parts of your organization.
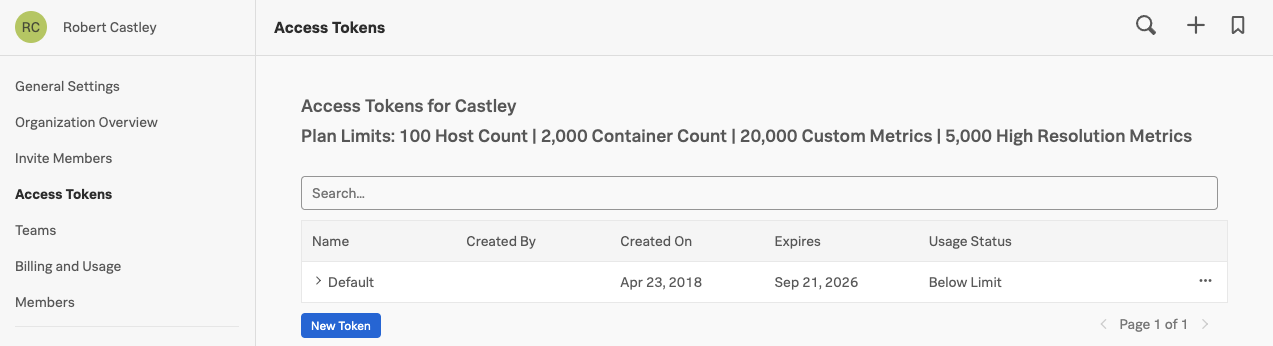
In the UI click on the » bottom left and select the Settings → Access Tokens under General Settings.
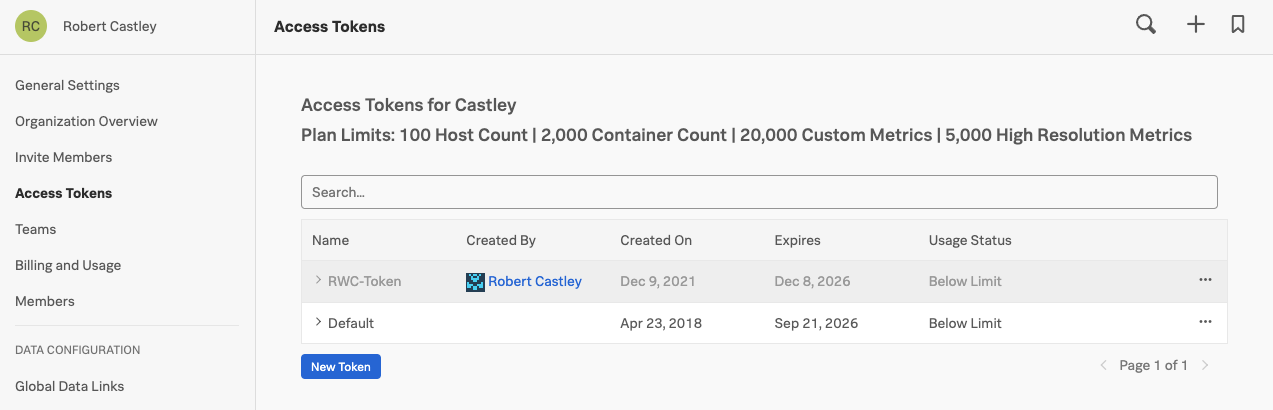
The Access Tokens Interface provides an overview of your allotments in the form of a list of Access Tokens that have been generated. Every Organization will have a Default token generated when they are first set up, but there will typically be multiple Tokens configured.
Each Token is unique and can be assigned limits for the number of Hosts, Containers, Custom Metrics and High Resolution Metrics it can consume.
The Usage Status Column quickly shows if a token is above or below its assigned limits.
2. Creating a new token
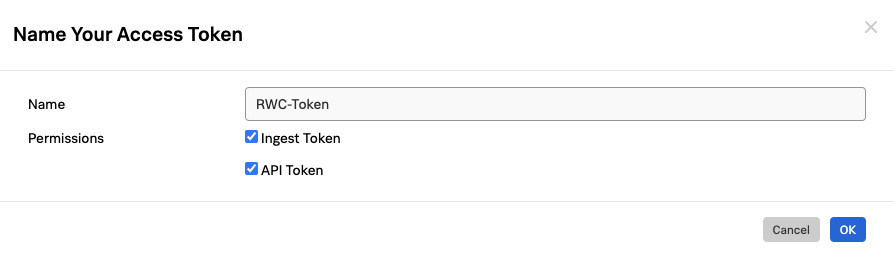
Let create a new token by clicking on the New Token button. This will provide you with the Name Your Access Token dialog.
Enter the new name of the new Token by using your Initials e.g. RWC-Token and make sure to tick both Ingest Token and API Token checkboxes!
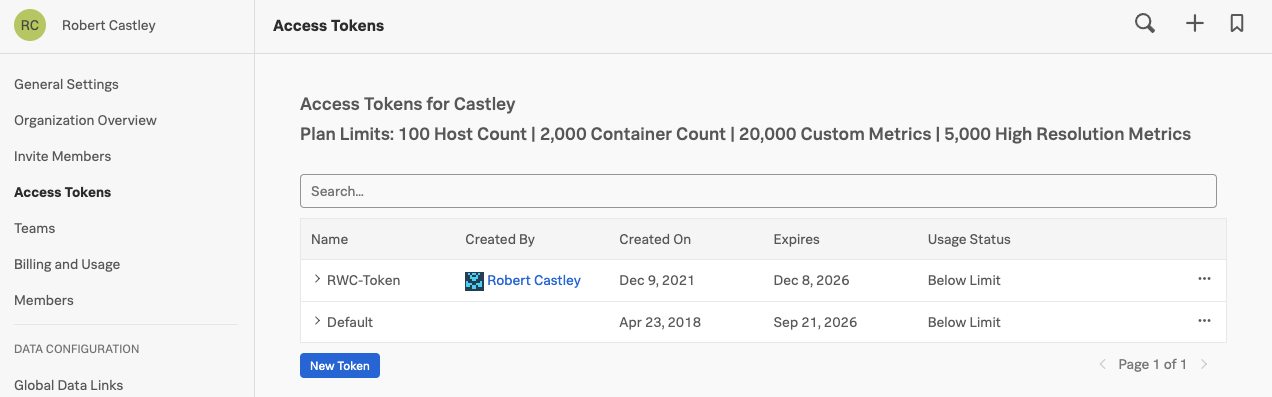
After you press OK you will be taken back to the Access Token UI. Here your new token should be present, among the ones created by others.
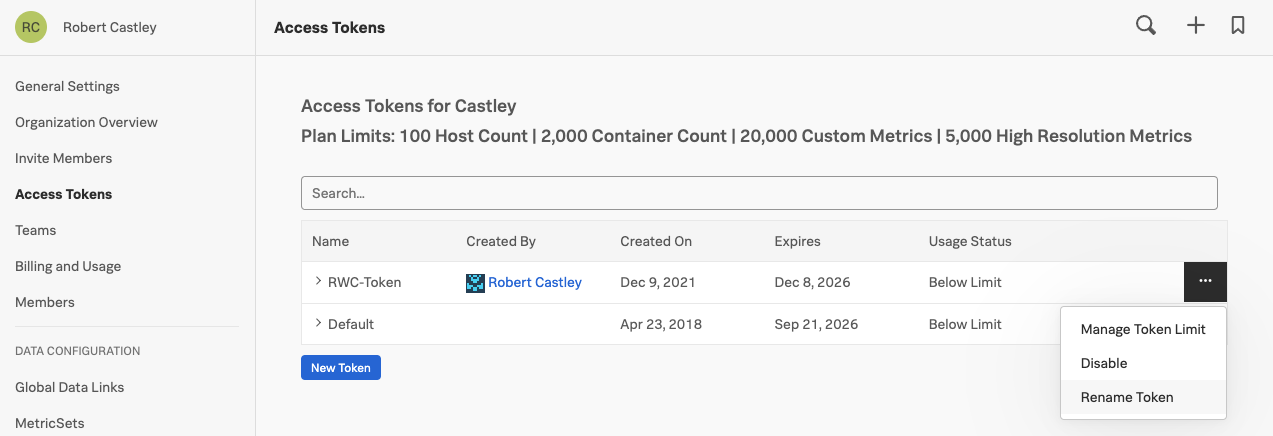
If you have made an error in your naming, want to disable/enable a token or set a Token limit, click on the ellipsis (…) menu button behind a token limit to open the manage token menu.
If you made a typo you can use the Rename Token option to correct the name of your token.
3. Disabling a token
If you need to make sure a token cannot be used to send Metrics in you can disable a token.
Click on Disable to disable the token, this means the token cannot be used for sending in data to Splunk Observability Cloud.
The line with your token should have become greyed out to indicate that it has been disabled as you can see in the screenshot below.
Go ahead and click on the ellipsis (…) menu button to Disable and Enable your token.
4. Manage token usage limits
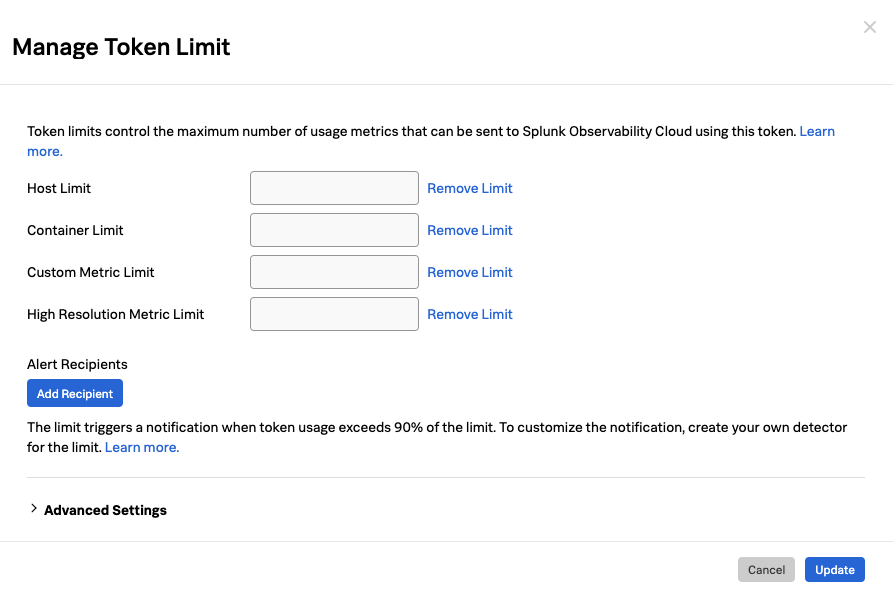
Now, let’s start limiting usage by clicking on Manage Token Limit in the 3 … menu.
This will show the Manage Token Limit Dialog:
In this dialog, you can set the limits per category.
Please go ahead and specify the limits as follows for each usage metric:
Limit
Value
Host Limit
5
Container Limit
15
Custom Metric Limit
20
High Resolution Metric Limit
0
For our lab use your email address, and double check that you have the correct numbers in your dialog box as shown in the table above.
Token limits are used to trigger an alert that notifies one or more recipients when the usage has been above 90% of the limit for 5 minutes.
To specify the recipients, click Add Recipient, then select the recipient or notification method you want to use (specifying recipients is optional but highly recommended).
The severity of token alerts is always Critical.
Click on Update to save your Access Tokens limits and The Alert Settings.
Note: Going above token limit
When a token is at or above its limit in a usage category, new metrics for that usage category will not be stored and processed by Observability Cloud. This will make sure there will be no unexpected cost due to a team sending in data without restriction.
Note: Advanced alerting
If you wish to get alerts before you hit 90%, you can create additional detectors using whatever values you want. These detectors could target the Teams consuming the specific Access Tokens so they can take action before the admins need to get involved.
In your company you would distribute these new Access Tokens to various teams, controlling how much information/data they can send to Observability Cloud.
This will allow you to fine-tune the way you consume your Observability Cloud allotment and prevent overages from happening.
Congratulations! You have now completed the Service Bureau module.