Teams
- Introduction to Teams
- Create a Team and add members to the Team
1. Introduction to Teams
To make sure that users see the dashboards and alerts that are relevant to them when using Observability Cloud, most organizations will use Observability Cloud’s Teams feature to assign a member to one or more Teams.
Ideally, this matches work-related roles, for example, members of a Dev-Ops or Product Management group would be assigned to the corresponding Teams in Observability Cloud.
When a user logs into Observability Cloud, they can choose which Team Dashboard will be their home page and they will typically select the page for their primary role.
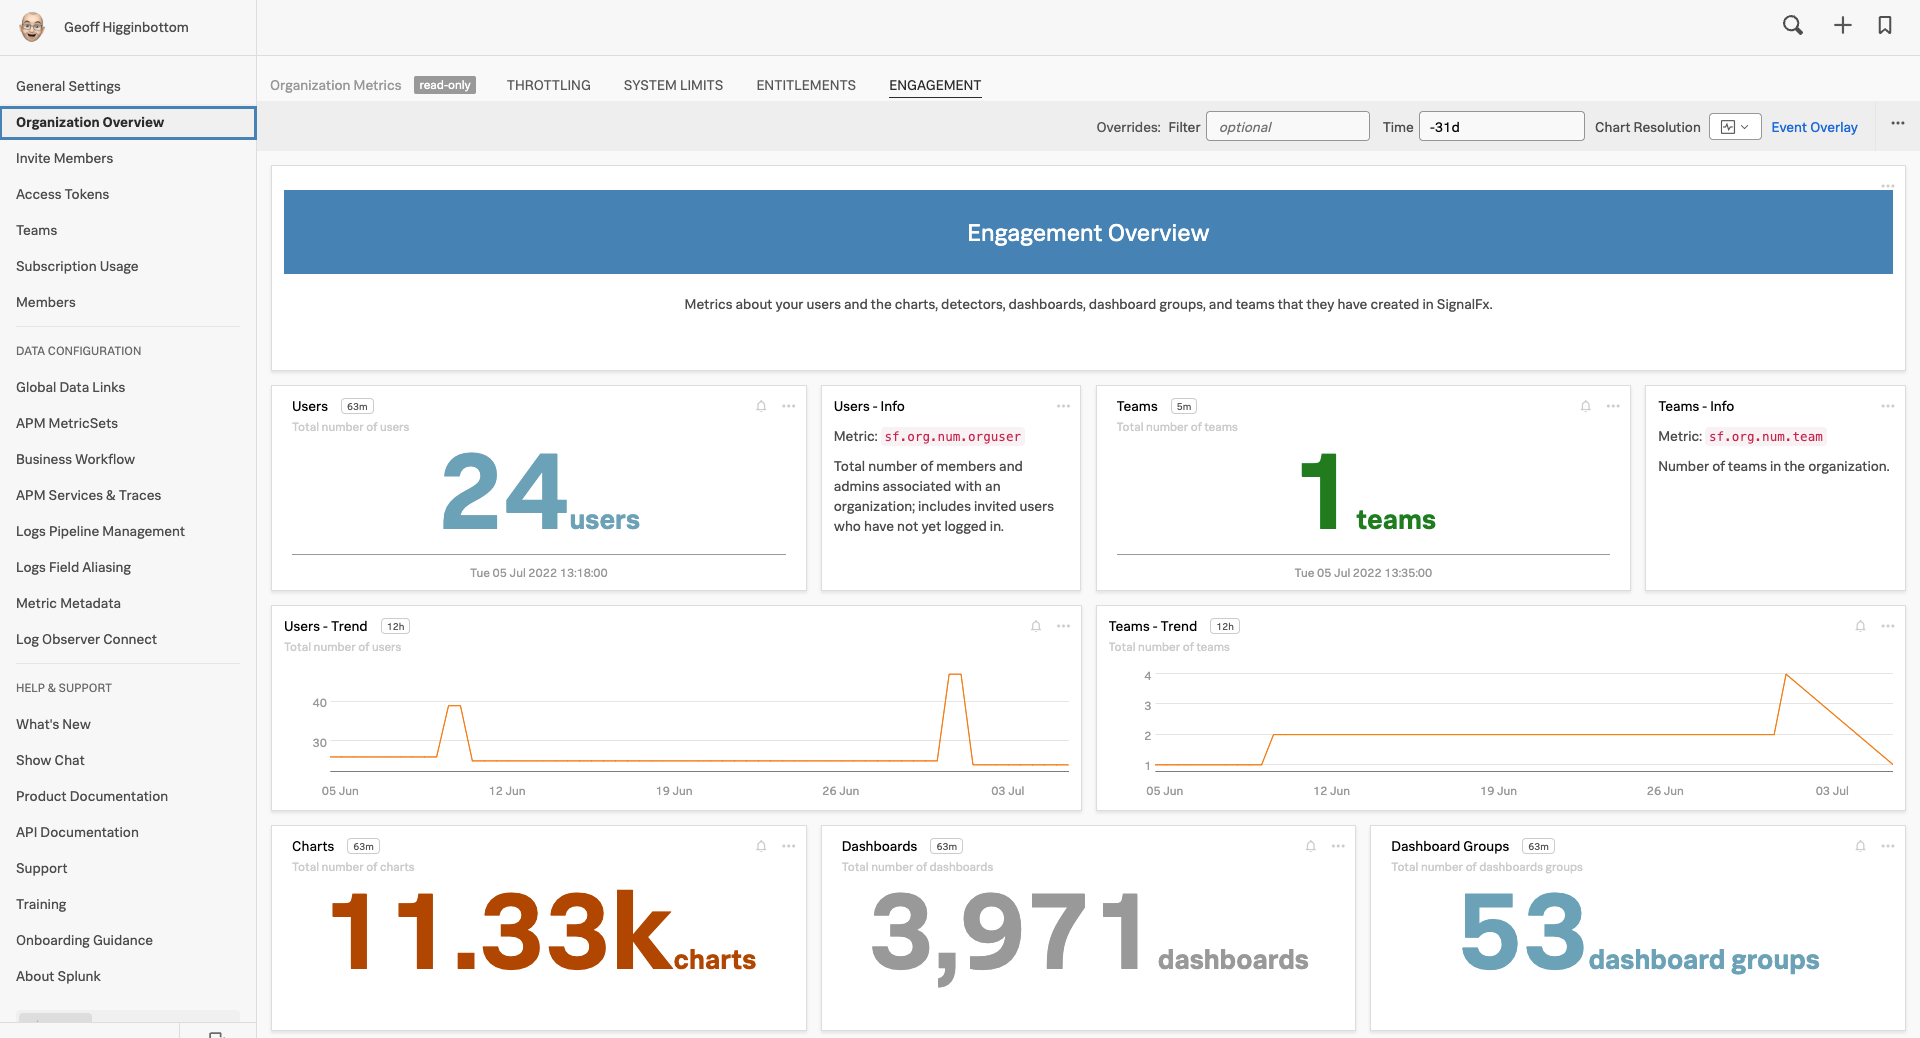
In the example below, the user is a member of the Development, Operations and Product Management Teams, and is currently viewing the Dashboard for the Operations Team.
This Dashboard has specific Dashboard Groups for Usage, SaaS and APM Business Workflows assigned but any Dashboard Group can be linked to a Teams Dashboard.
They can use the menu along the top left to quickly navigate between their allocated teams, or they can use the ALL TEAMS dropdown on the right to select specific Team Dashboards, as well as quickly access ALL Dashboards** using the adjacent link.
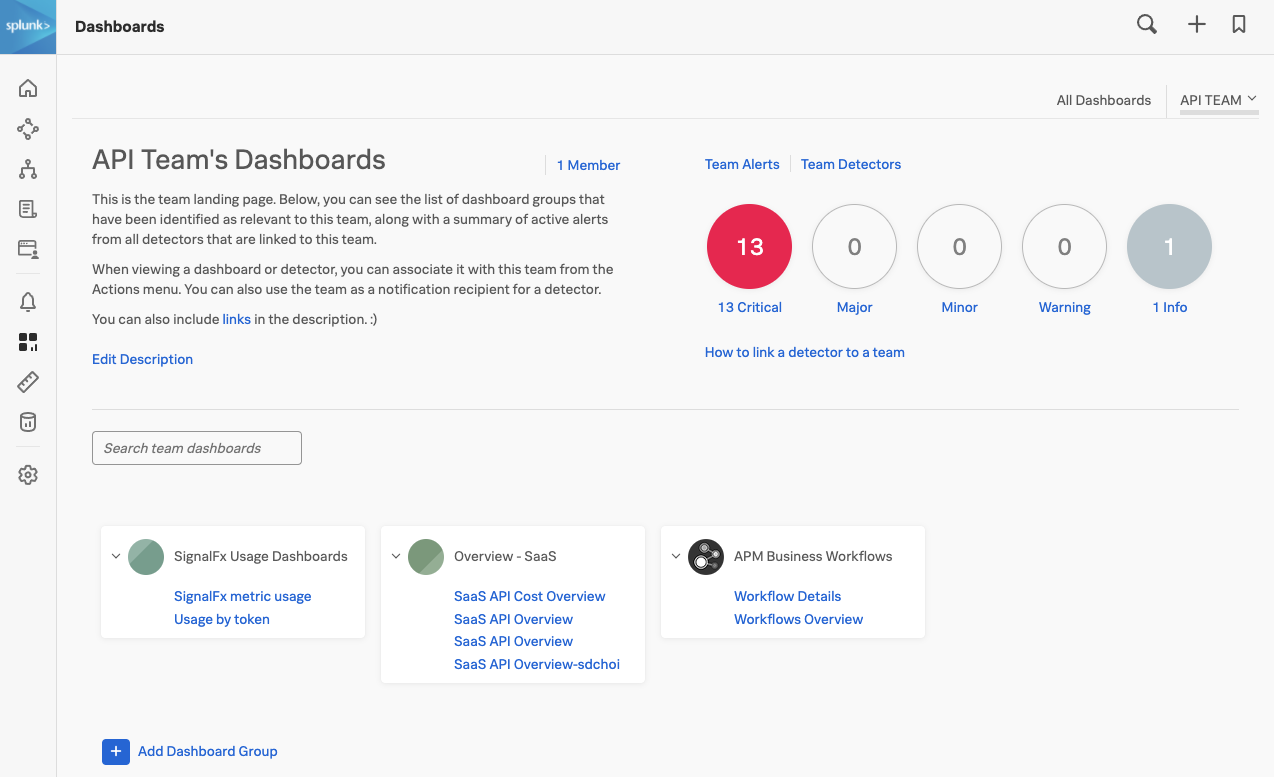
Alerts can be linked to specific Teams so the Team can monitor only the Alerts they are interested in, and in the above example, they currently have 1 active Critical Alert.
The Description for the Team Dashboard can be customized and can include links to team-specific resources (using Markdown).
2. Creating a new Team
To work with Splunk’s Team UI click on the hamburger icon top left and select the Organizations Settings → Teams.
When the Team UI is selected you will be presented with the list of current Teams.
To add a new Team click on the Create New Team button. This will present you with the Create New Team dialog.
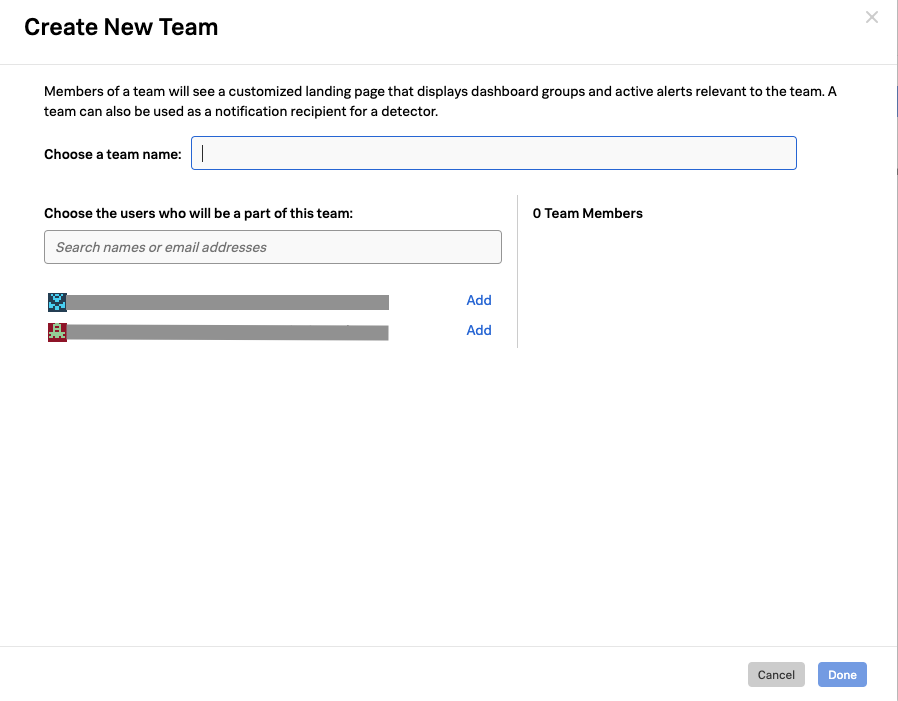
Create your own team by naming it [YOUR-INITIALS]-Team and add yourself by searching for your name and selecting the Add link next to your name. This should result in a dialog similar to the one below:
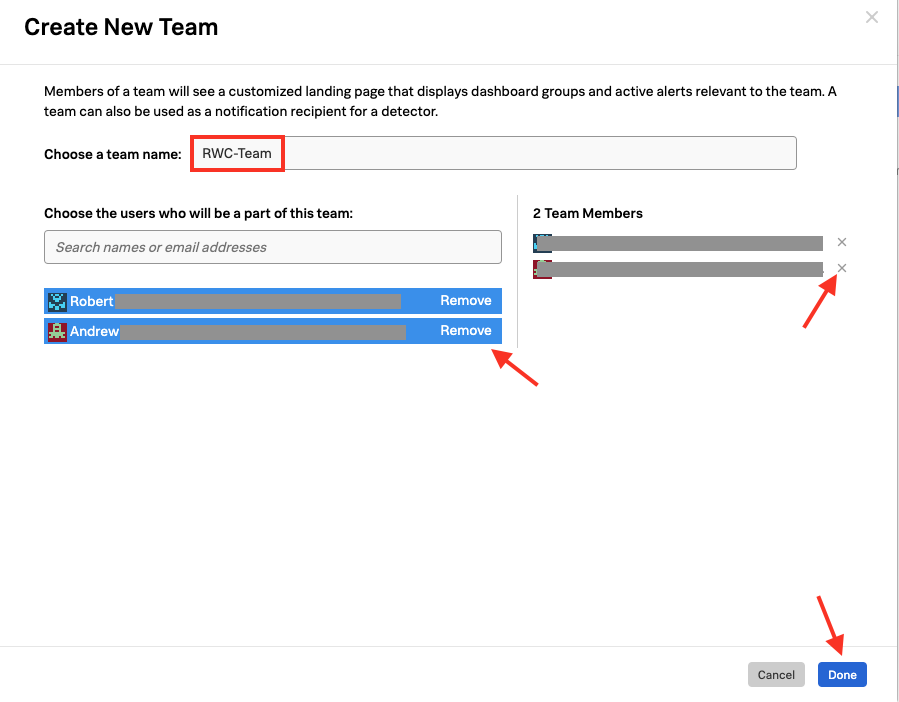
You can remove selected users by pressing Remove or the small x.
Make sure you have your group created with your initials and with yourself added as a member, then click Done
This will bring you back to the Teams list that will now show your Team and the ones created by others.
Note
The Teams(s) you are a member of have a grey Member icon in front of it.
If no members are assigned to your Team, you should see a blue Add Members link instead of the member count, clicking on that link will get you to the Edit Team dialog where you can add yourself.
This is the same dialog you get when pressing the 3 dots … at the end of the line with your Team and selecting Edit Team
The … menu gives you the option to Edit, Join, Leave or Delete a Team (leave and join will depend on if you are currently a member).
3. Adding Notification Rules
You can set up specific Notification rules per team, by clicking on the Notification Policy tab, this will open the notification edit menu.
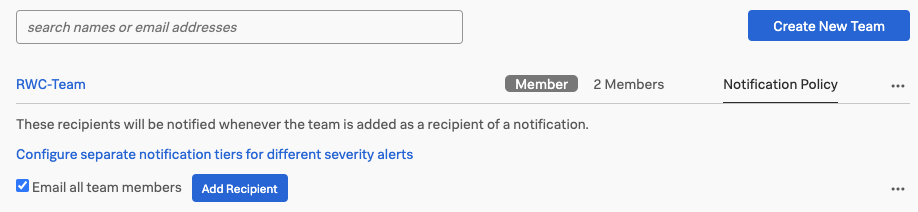
By default, the system offers you the ability to set up a general notification rule for your team.
Note
The Email all team members option means all members of this Team will receive an email with the Alert information, regardless of the alert type.
3.1 Adding recipients
You can add other recipients, by clicking Add Recipient. These recipients do not need to be Observability Cloud users.
However, if you click on the link Configure separate notification tiers for different severity alerts you can configure every alert level independently.
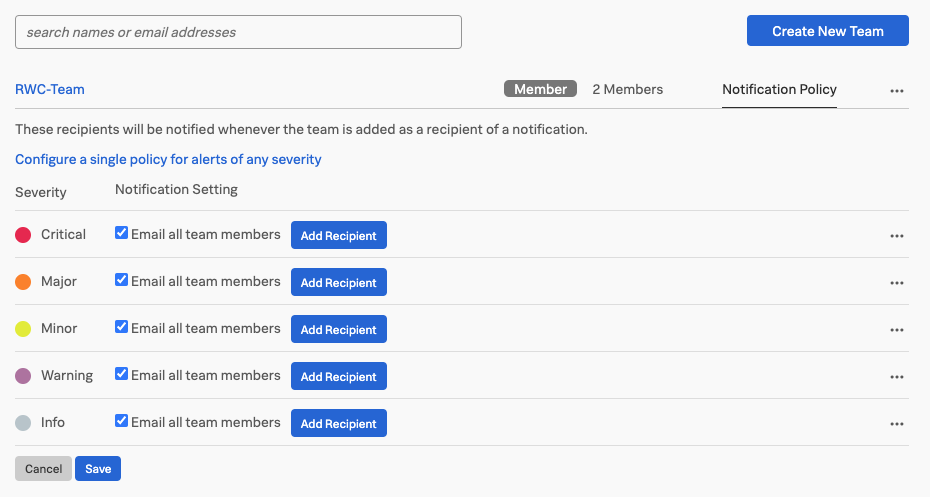
Different alert rules for the different alert levels can be configured, as shown in the above image.
Critical and Major are using Splunk's On-Call Incident Management solution. For the Minor alerts, we send it to the Teams Slack channel and for Warning and Info we send an email.
3.2 Notification Integrations
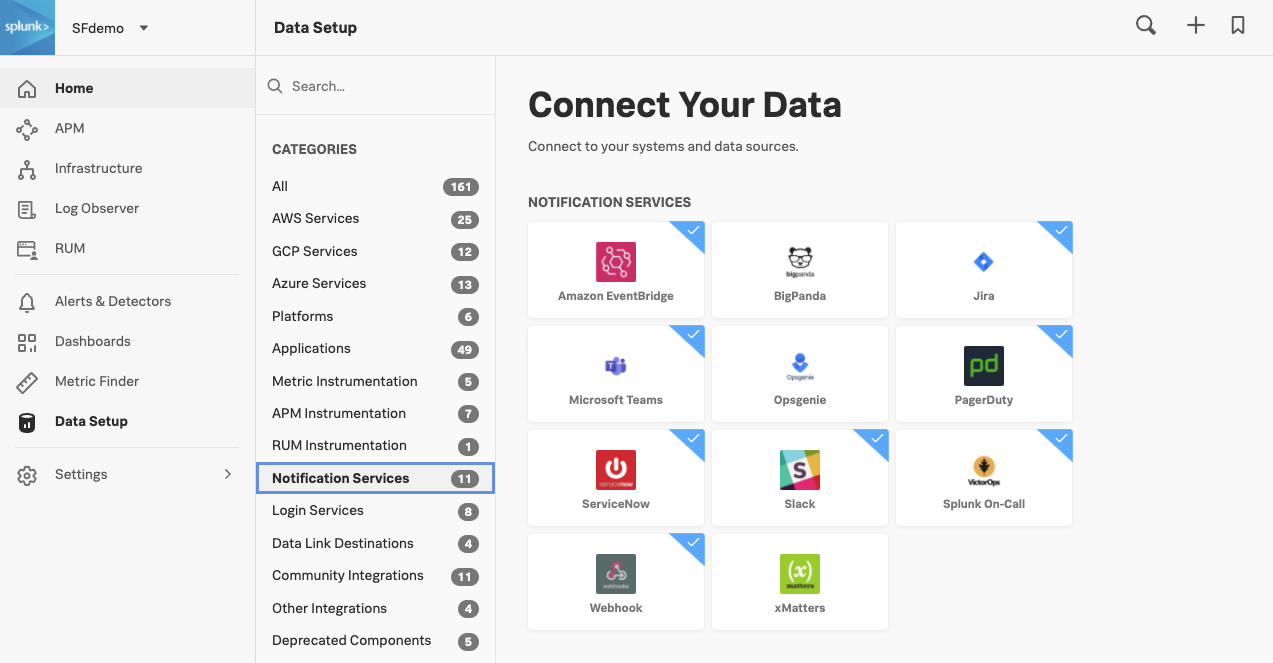
In addition to sending alert notifications via email, you can configure Observability Cloud to send alert notifications to the services shown below.
Take a moment to create some notification rules for your Team.
Controlling Usage
- Discover how you can restrict usage by creating separate Access Tokens and setting limits.
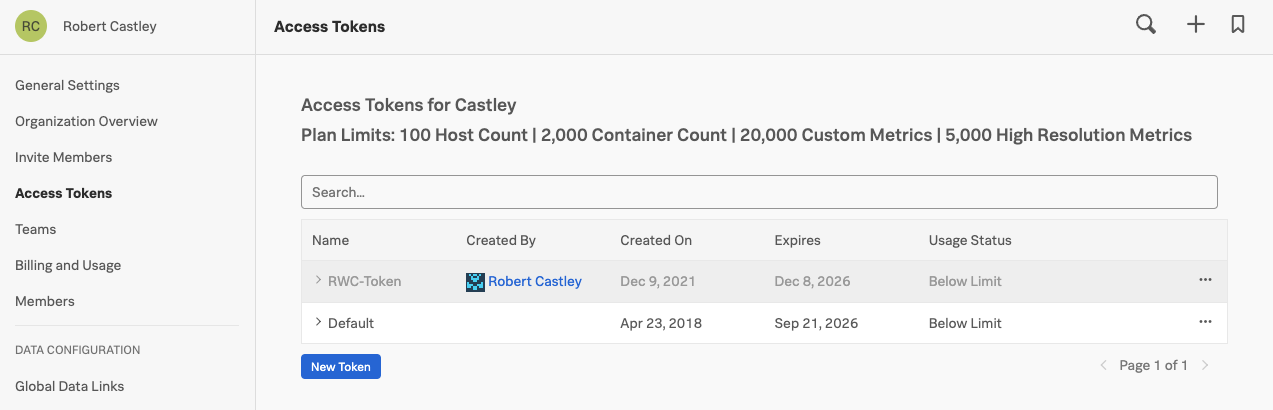
1. Access Tokens
If you wish to control the consumption of Hosts, Containers, Custom Metrics and High Resolution Metrics, you can create multiple Access Tokens and allocate them to different parts of your organization.
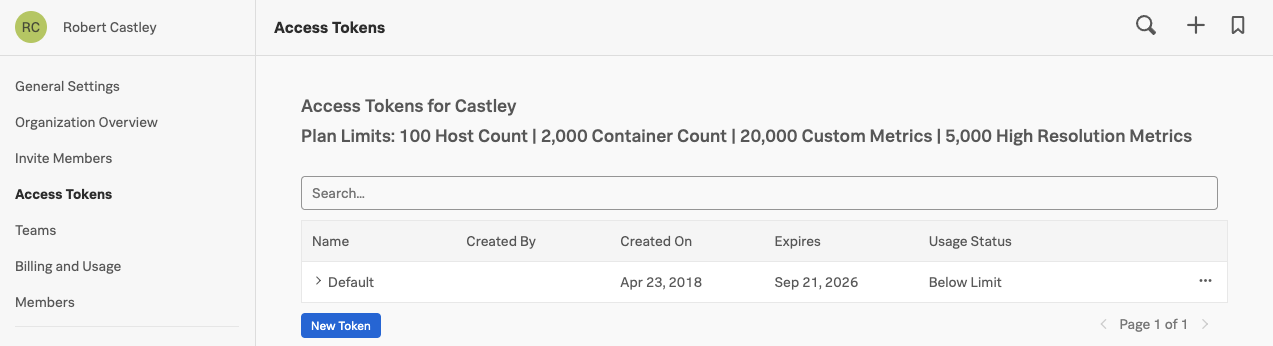
In the UI click on the » bottom left and select the Settings → Access Tokens under General Settings.
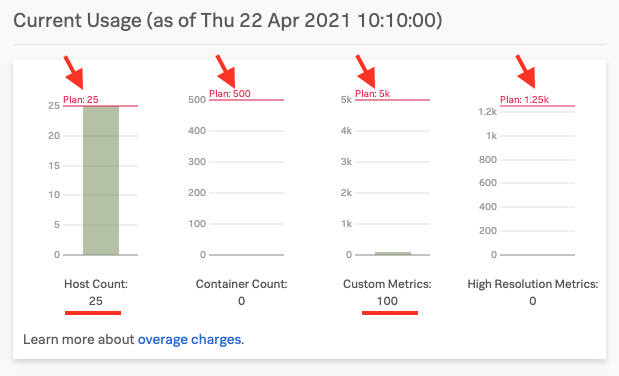
The Access Tokens Interface provides an overview of your allotments in the form of a list of Access Tokens that have been generated. Every Organization will have a Default token generated when they are first set up, but there will typically be multiple Tokens configured.
Each Token is unique and can be assigned limits for the number of Hosts, Containers, Custom Metrics and High Resolution Metrics it can consume.
The Usage Status Column quickly shows if a token is above or below its assigned limits.
2. Creating a new token
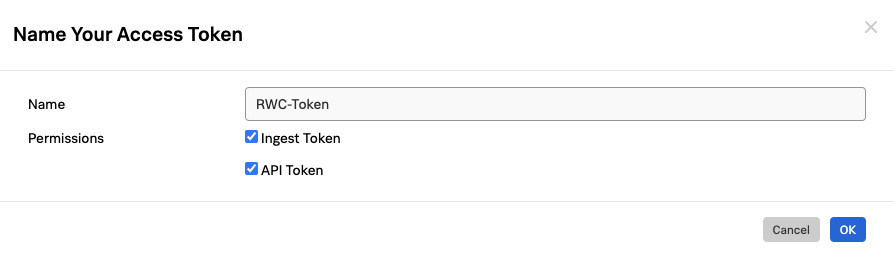
Let create a new token by clicking on the New Token button. This will provide you with the Name Your Access Token dialog.
Enter the new name of the new Token by using your Initials e.g. RWC-Token and make sure to tick both Ingest Token and API Token checkboxes!
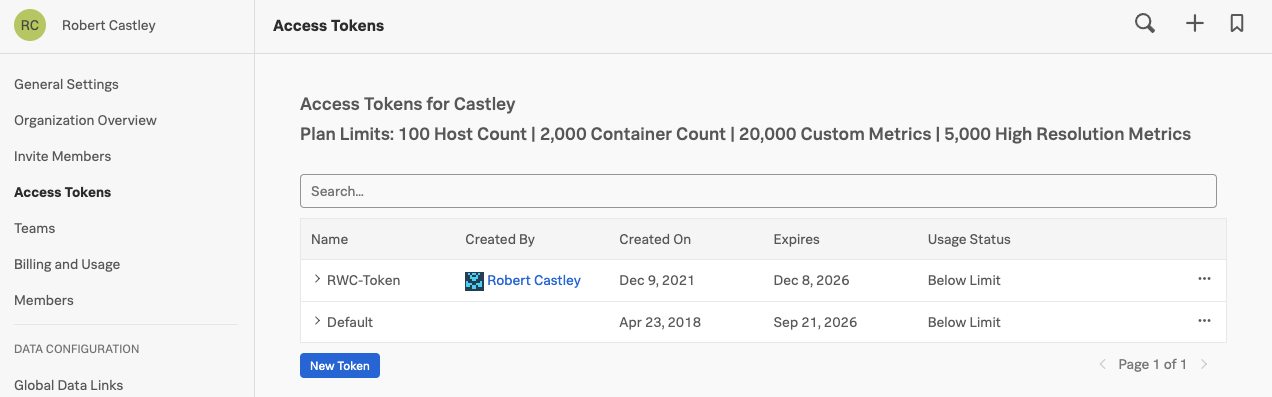
After you press OK you will be taken back to the Access Token UI. Here your new token should be present, among the ones created by others.
If you have made an error in your naming, want to disable/enable a token or set a Token limit, click on the ellipsis (…) menu button behind a token limit to open the manage token menu.
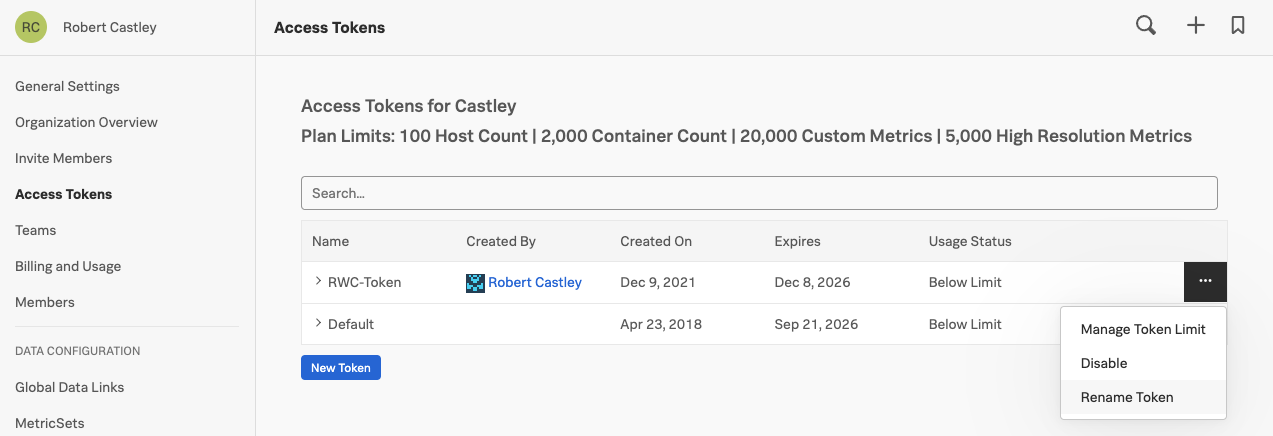
If you made a typo you can use the Rename Token option to correct the name of your token.
3. Disabling a token
If you need to make sure a token cannot be used to send Metrics in you can disable a token.
Click on Disable to disable the token, this means the token cannot be used for sending in data to Splunk Observability Cloud.
The line with your token should have become greyed out to indicate that it has been disabled as you can see in the screenshot below.
Go ahead and click on the ellipsis (…) menu button to Disable and Enable your token.
4. Manage token usage limits
Now, let’s start limiting usage by clicking on Manage Token Limit in the 3 … menu.
This will show the Manage Token Limit Dialog:
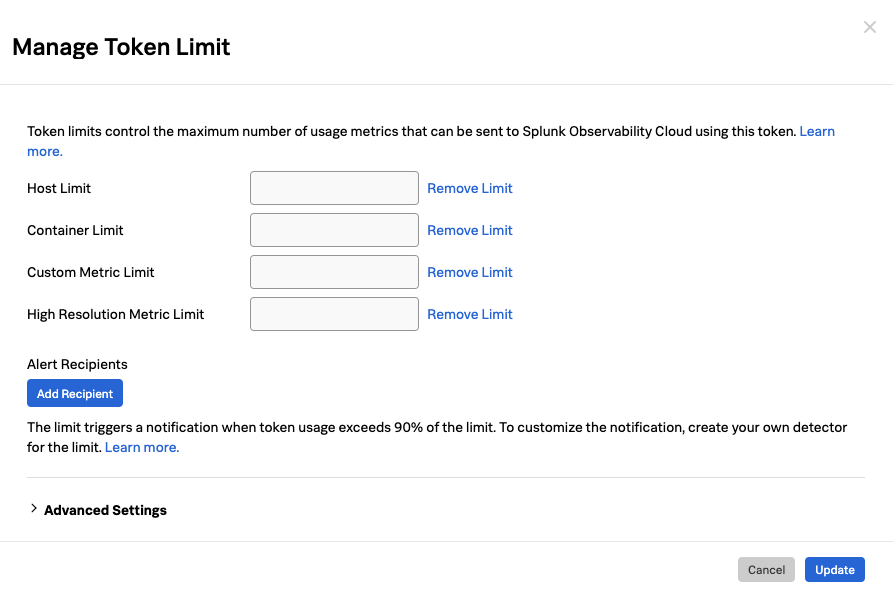
In this dialog, you can set the limits per category.
Please go ahead and specify the limits as follows for each usage metric:
| Limit | Value |
|---|
| Host Limit | 5 |
| Container Limit | 15 |
| Custom Metric Limit | 20 |
| High Resolution Metric Limit | 0 |
For our lab use your email address, and double check that you have the correct numbers in your dialog box as shown in the table above.
Token limits are used to trigger an alert that notifies one or more recipients when the usage has been above 90% of the limit for 5 minutes.
To specify the recipients, click Add Recipient, then select the recipient or notification method you want to use (specifying recipients is optional but highly recommended).
The severity of token alerts is always Critical.
Click on Update to save your Access Tokens limits and The Alert Settings.
Note: Going above token limit
When a token is at or above its limit in a usage category, new metrics for that usage category will not be stored and processed by Observability Cloud. This will make sure there will be no unexpected cost due to a team sending in data without restriction.
Note: Advanced alerting
If you wish to get alerts before you hit 90%, you can create additional detectors using whatever values you want. These detectors could target the Teams consuming the specific Access Tokens so they can take action before the admins need to get involved.
In your company you would distribute these new Access Tokens to various teams, controlling how much information/data they can send to Observability Cloud.
This will allow you to fine-tune the way you consume your Observability Cloud allotment and prevent overages from happening.
Congratulations! You have now completed the Service Bureau module.