Incident Lifecycle

Aim

The aim of this module is for you to get more familiar with the Timeline Tab and the filtering features.

1. Timeline

The aim of Splunk On-Call is to make being on call more bearable, and it does this by getting the critical data, to the right people, at the right time.

The key to making it work for you is to centralize all your alerting sources, sending them all to the Splunk On-Call platform, then you have a single pane of glass in which to manage all of your alerting.

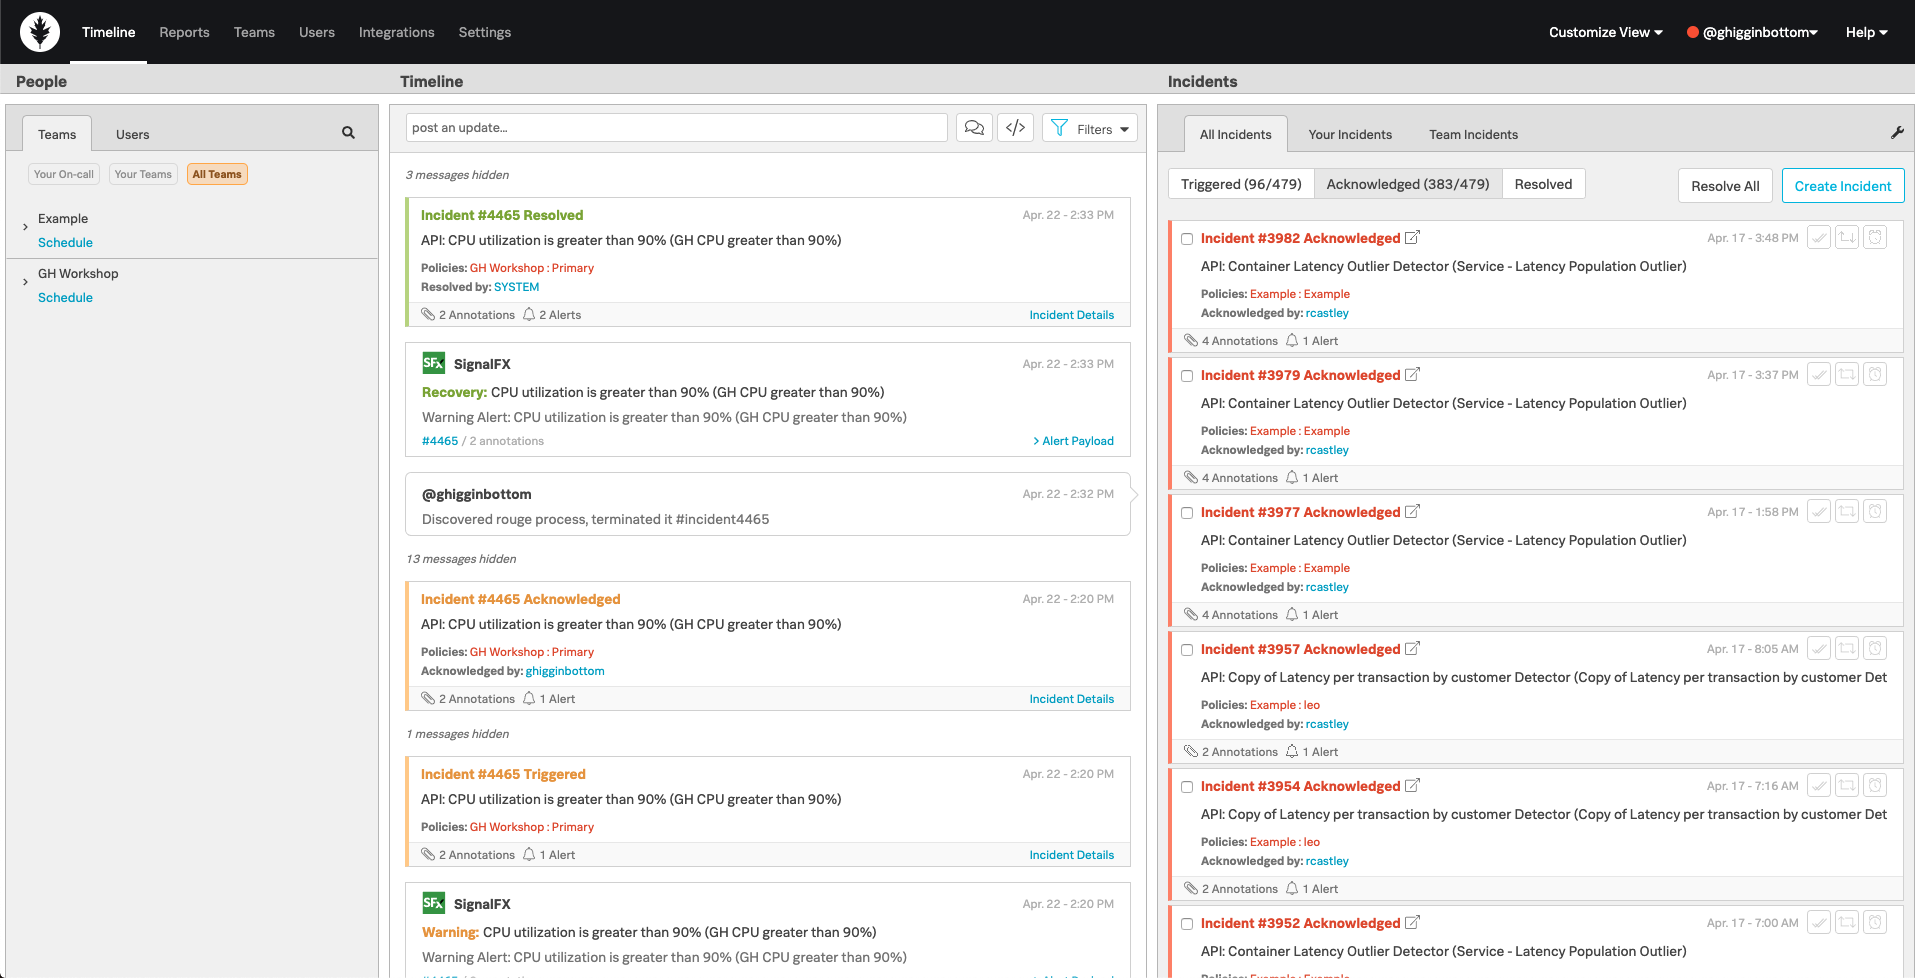
Login to the Splunk On-Call UI and select the Timeline tab on the main menu bar, you should have a screen similar to the following image:

Splunk On-Call UI Splunk On-Call UI

2. People

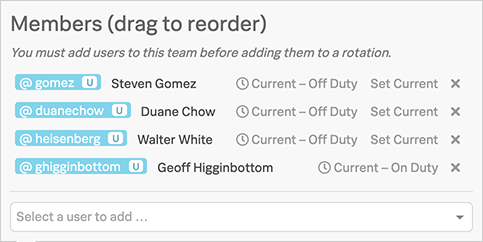
On the left we have the People section with the Teams and Users sub tabs. On the Teams tab, click on All Teams then expand [Your Team name].

Users with the Splunk On-Call Logo against their name are currently on call. Here you can see who is on call within a particular Team, or across all Teams via Users → On-Call.

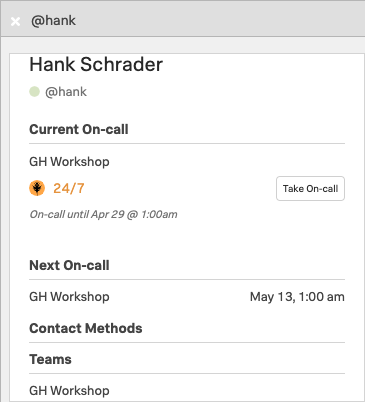
If you click into one of the currently on call users, you can see their status. It shows which Rotation they are on call for, when their current Shift ends and their next Shift starts (times are displayed in your time zone), what contact methods they have and which Teams they belong to (dummy users such as Hank do not have Contact Methods configured).

User Detail User Detail

3. Timeline

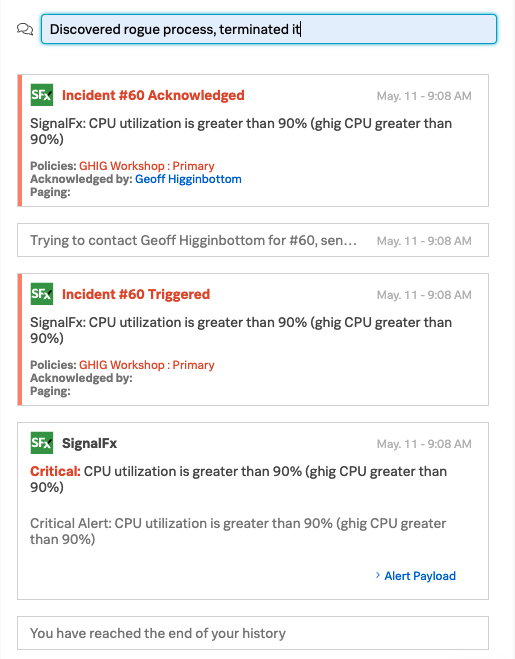
In the centre Timeline section you get a realtime view of what is happening within your environment with the newest messages at the top. Here you can quickly post update messages to make your colleagues aware of important developments etc.

You can filter the view using the buttons on the top toolbar showing only update messages, GitHub integrations, or apply more advanced filters.

Lets change the Filters settings to streamline your view. Click the Filters button then within the Routing Keys tab change the Show setting from all routing keys to selected routing keys. Change the My Keys value to all and the Other Keys value to selected and deselect all keys under the Other Keys section.

Click anywhere outside of the dialogue box to close it.

Timeline Filters Timeline Filters

You will probably now have a much simpler view as you will not currently have Incidents created using your Routing Keys, so you are left with the other types of messages that the Timeline can display.

Click on Filters again, but this time switch to the Message Types tab. Here you control the types of messages that are displayed.

For example, deselect On-call Changes and Escalations, this will reduce the amount of messages displayed.

Timeline Filters Message Types Timeline Filters Message Types

4. Incidents

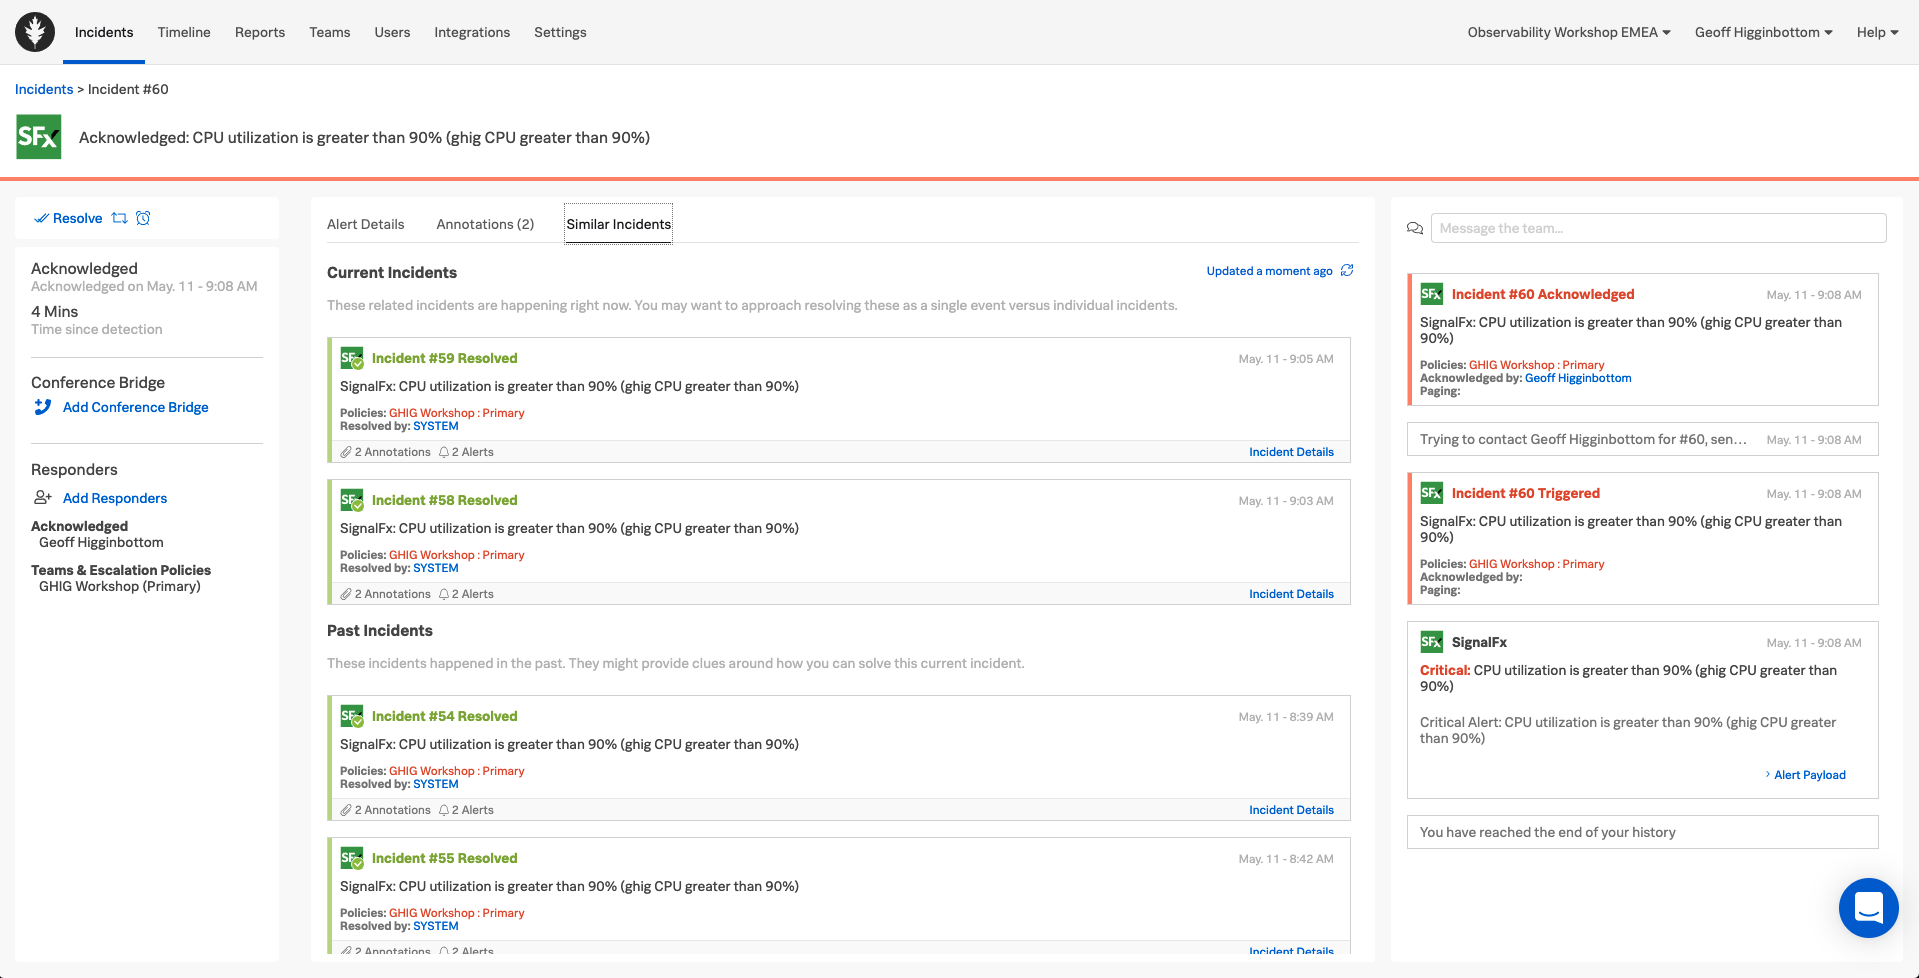
On the right we have the Incidents section. Here we get a list of all the incidents within the platform, or we can view a more specific list such as incidents you are specifically assigned to, or for any of the Teams you are a member of.

Select the Team Incidents tab you should find that the Triggered, Acknowledged & Resolved tabs are currently all empty as you have had no incidents logged.

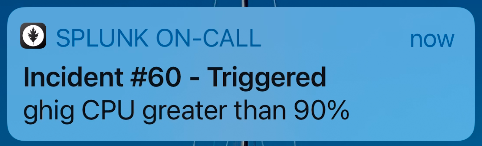
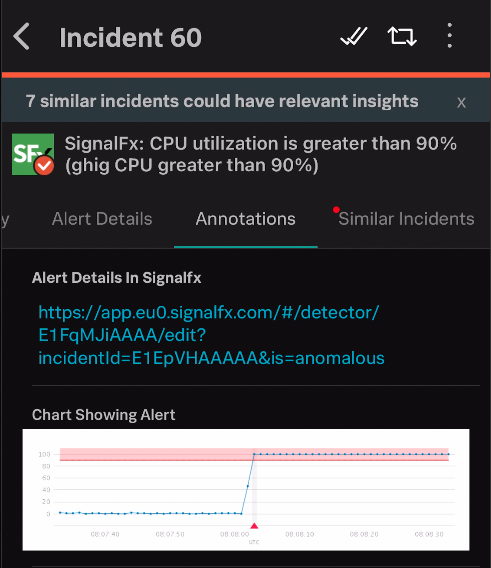
Let’s change that by generating your first incident!

Continue with the Create Incidents module.

Last Modified Sep 19, 2024

Subsections of Incident Lifecycle

Create Incidents

Aim

The aim of this module is for you to place yourself ‘On-Call’ then generate an Incident using the supplied EC2 Instance so you can then work through the lifecycle of an Incident.


1. On-Call

Before generating any incidents you should assign yourself to the current Shift within your Follow the Sun Support - Business Hours Rotation and also place yourself On-Call.

  • Click on the Schedule link within your Team in the People section on the left, or navigate to Teams → [Your Team] → Rotations
  • Expand the Follow the Sun Support - Business Hours Rotation
  • Click on the Manage members icon (the figures) for the current active shift depending on your time zone Manage Members Manage Members
  • Use the Select a user to add… dropdown to add yourself to the shift
  • Then click on Set Current next to your name to make yourself the current on-call user within the shift
  • You should now get a Push Notification to your phone informing you that You Are Now On-Call On Duty On Duty

2. Trigger Alert

Switch back to your shell session connected to your EC2 Instance; all of the following commands will be executed from your Instance.

Force the CPU to spike to 100% by running the following command:

openssl speed -multi $(grep -ci processor /proc/cpuinfo)
Forked child 0
+DT:md4:3:16
+R:19357020:md4:3.000000
+DT:md4:3:64
+R:14706608:md4:3.010000
+DT:md4:3:256
+R:8262960:md4:3.000000
+DT:md4:3:1024

This will result in an Alert being generated by Splunk Infrastructure Monitoring which in turn will generate an Incident within Splunk On-Call within a maximum of 10 seconds. This is the default polling time for the OpenTelemetry Collector installed on your instance (note it can be reduced to 1 second).


Continue with the Manage Incidents module.

Last Modified Sep 19, 2024

Manage Incidents

1. Acknowledge

Use your Splunk On-Call App on your phone to acknowledge the Incident by clicking on the push notification

Push Notification Push Notification

…to open the alert in the Splunk On-Call mobile app, then clicking on either the single tick in the top right hand corner, or the Acknowledge link to acknowledge the incident and stop the escalation process.

The :fontawesome-solid-check: will then transform into a :fontawesome-solid-check::fontawesome-solid-check:, and the status will change from TRIGGERED to ACKNOWLEDGED.

Triggered IncidentAcknowledge Incident
Acknowledge Alert Acknowledge AlertAlert Acknowledged Alert Acknowledged

2. Details and Annotations

Still on your phone, select the Alert Details tab. Then on the Web UI, navigate back to Timeline, select Team Incidents on the right, then select Acknowledged and click into the new Incident, this will open up the War Room Dashboard view of the Incident.

You should now have the Details tab displayed on both your Phone and the Web UI. Notice how they both show the exact same information.

Now select the Annotations tab on both the Phone and the Web UI, you should have a Graph displayed in the UI which is generated by Splunk Infrastructure Monitoring.

UI Annotations UI Annotations

On your phone you should get the same image displayed (sometimes it’s a simple hyperlink depending on the image size)

Phone Link Phone Link

Splunk On-Call is a ‘Mobile First’ platform meaning the phone app is full functionality and you can manage an incident directly from your phone.

For the remainder of this module we will focus on the Web UI however please spend some time later exploring the phone app features.

Sticking with the Web UI, click the 2. Alert Details in SignalFx link.

Alert Details Alert Details

This will open a new browser tab and take you directly to the Alert within Splunk Infrastructure Monitoring where you could then progress your troubleshooting using the powerful tools built into its UI.

SFX Alert Details SFX Alert Details

However, we are focussing on Splunk On-Call so close this tab and return to the Splunk On-Call UI.

4. Similar Incidents

What if Splunk On-Call could identify previous incidents within the system which may give you a clue to the best way to tackle this incident.

The Similar Incidents tab does exactly that, surfacing previous incidents allowing you to look at them and see what actions were taken to resolve them, actions which could be easily repeated for this incident.

Similar Incidents Similar Incidents

5 Timeline

On right we have a Time Line view where you can add messages and see the history of previous alerts and interactions.

Incident View Incident View

6 Add Responders

On the far left you have the option of allocating additional resources to this incident by clicking on the Add Responders link.

add-responders add-responders

This allows you build a virtual team specific to this incident by adding other Teams or individual Users, and also share details of a Conference Bridge where you can all get together and collaborate.

Conference Bridge Conference Bridge

Once the system has built up some incident data history, it will use Machine Learning to suggest Teams and Users who have historically worked on similar incidents, as they may be best placed to help resolve this incident quickly.

You can select different Teams and/or Users and also choose from a pre-configured conference bridge, or populate the details of a new bridge from your preferred provider.

We do not need to add any Responders in this exercise so close the Add Responders dialogue by clicking Cancel.

7 Reroute

If it’s decided that maybe the incident could be better dealt with by a different Team, the call can be Rerouted by clicking the Reroute Button at the top of the left hand panel.

Reroute Reroute

In a similar method to that used in the Add Responders dialogue, you can select Teams or Users to Reroute the Incident to.

Reroute Incident Reroute Incident

We do not need to actually Reroute in this exercise so close the Reroute Incident dialogue by clicking Cancel.

8 Snooze

You can also snooze this incident by clicking on the alarm clock Button at the top of the left hand panel.

Snnoze Snnoze

You can enter an amount of time upto 24 hours to snooze the incident. This action will be tracked in the Timeline, and when the time expires the paging will restart.

This is useful for low priority incidents, enabling you to put them on a back burner for a few hours, but it ensures they do not get forgotten thanks to the paging process starting again.

Snooze Incident Snooze Incident

We do not need to actually Snooze in this exercise so close the Snooze Incident dialogue by clicking Cancel.

9 Action Tracking

Now lets fix this issue and update the Incident with what we did. Add a new message at the top of the right hand panel such as Discovered rogue process, terminated it.

Add Message Add Message

All the actions related to the Incident will be recorded here, and can then be summarized is a Post Incident Review Report available from the Reports tab

10 Resolution

Now kill off the process we started in the VM to max out the CPU by switching back the Shell session for the VM and pressing ctrl+c

Within no more than 10 seconds SignalFx should detect the new CPU value, clear the alert state in SignalFx, then automatically update the Incident in VictorOps marking it as Resolved.

Resolved Resolved

As we have two way integration between Splunk Infrastructure Monitoring and Splunk On-Call we could have also marked the incident as Resolved in Splunk On-Call, and this would have resulted in the alert in Splunk Infrastructure Monitoring being resolved as well.


That completes this introduction to Splunk On-Call!