Splunk OnCall
1 hour 30 minutes Author Geoff HigginbottomAim
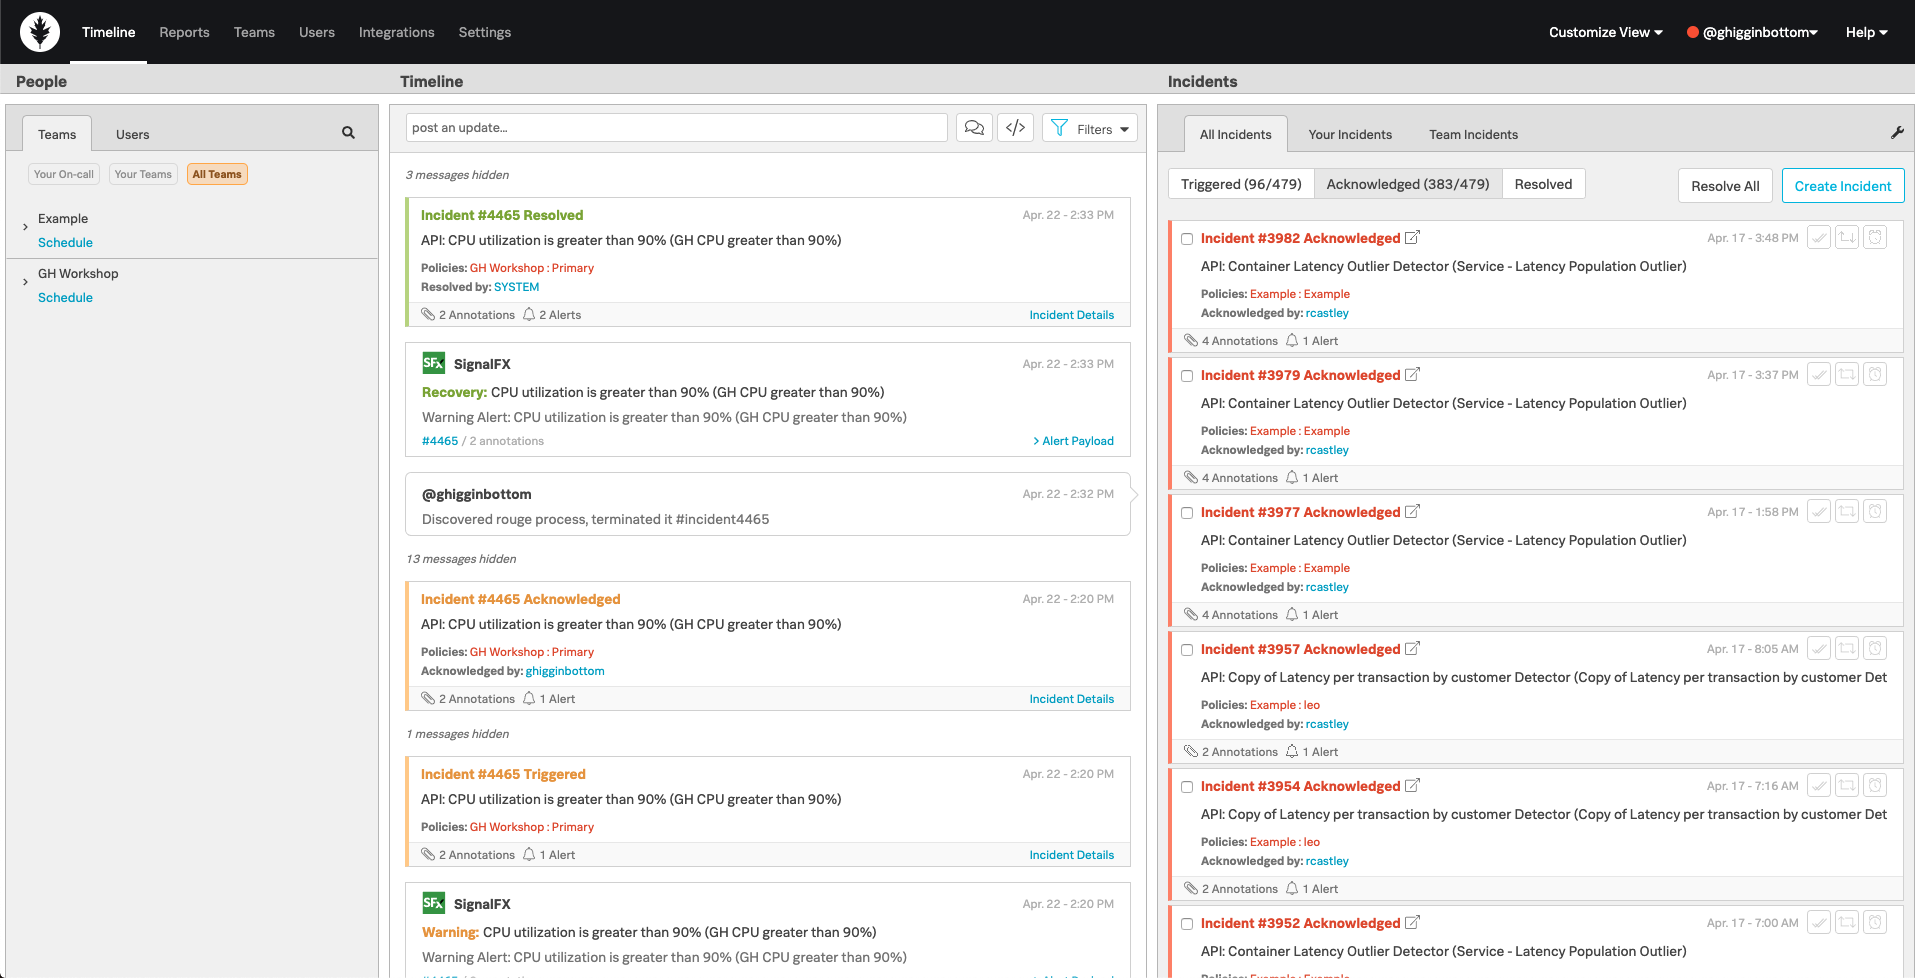
This module is simply to ensure you have access to the Splunk On-Call UI (formerly known as VictorOps), Splunk Infrastructure Monitoring UI (formerly known as SignalFx) and the EC2 Instance which has been allocated to you.
Once you have access to each platform, keep them open for the duration of the workshop as you will be switching between them and the workshop instructions.
1. Activate your Splunk On-Call Login
You should have received an invitation to Activate your Splunk On-Call account via e-mail, if you have not already done so, click the Activate Account link and follow the prompts.
If you did not receive an invitation it is probably because you already have a Splunk On-Call login, linked to a different organization.
If so log in to that Org, then use the organization dropdown next to your username in the top left to switch to the Observability Workshop Org.
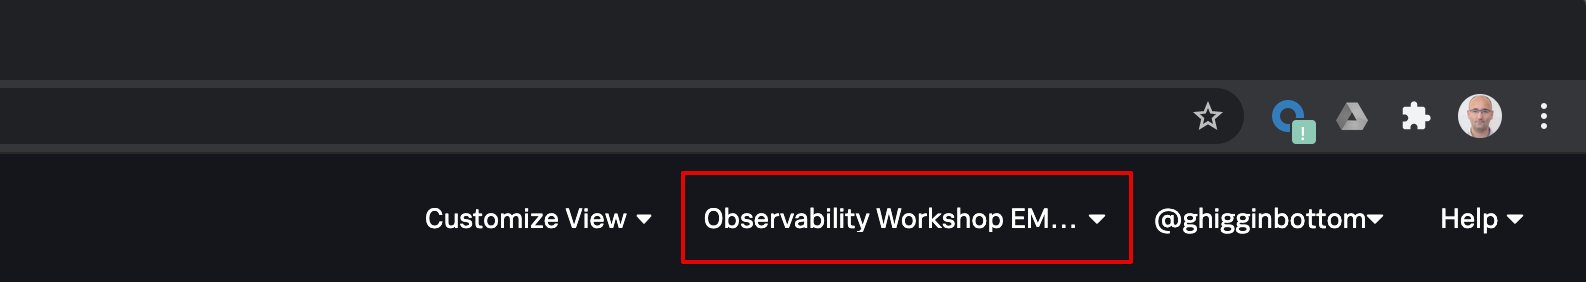
If you do not see the Organisation dropdown menu item next to your name with Observability Workshop EMEA that is OK, it simply means you only have access to a single Org so that menu is not visible to you.
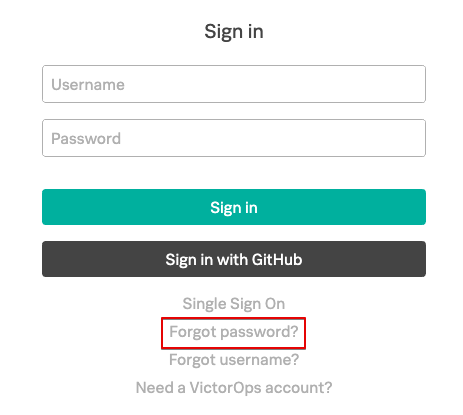
If you have forgotten your password go to the https://portal.victorops.com/membership/#/ page and use the forgotten password link to reset your password.
2. Activate your Splunk Infrastructure Monitoring Login
You should have received an invitation to join the Splunk Infrastructure Monitoring - Observability Workshop. If you have not already done so click the JOIN NOW button and follow the prompts to set a password and activate your login.
3. Access your EC2 Instance
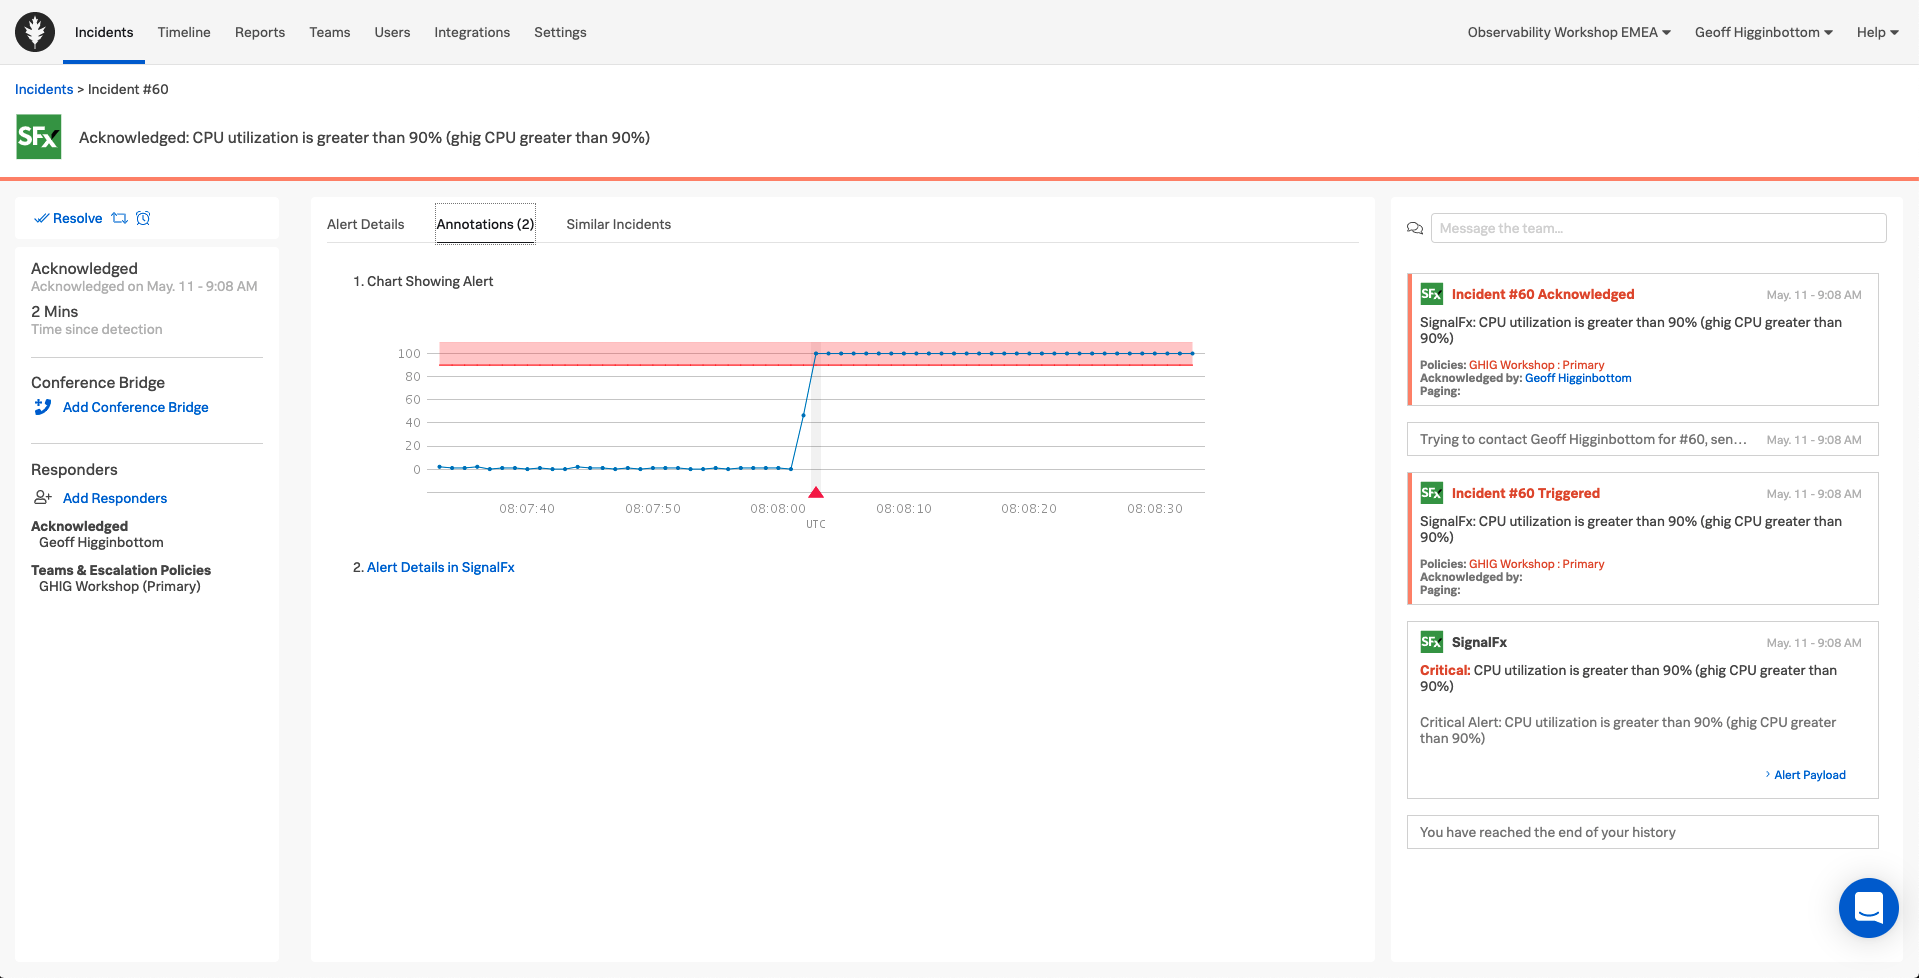
Splunk has provided you with a dedicated EC2 Instance which you can use during this workshop for triggering Incidents the same way the instructor did during the introductory demo. This VM has Splunk Infrastructure Monitoring deployed and has an associated Detector configured. The Detector will pass Alerts to Splunk On-Call which will then create Incidents and page the on-call user.
The welcome e-mail you received providing you all the details for this Workshop contain the instructions for accessing your allocated EC2 Instance.
SSH (Mac OS/Linux)
Most attendees will be able to connect to the workshop by using SSH from their Mac or Linux device.
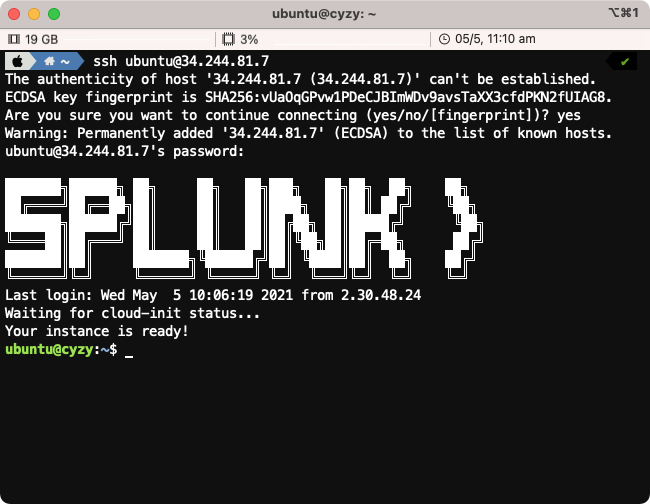
To use SSH, open a terminal on your system and type ssh splunk@x.x.x.x (replacing x.x.x.x with the IP address found in your welcome e-mail).
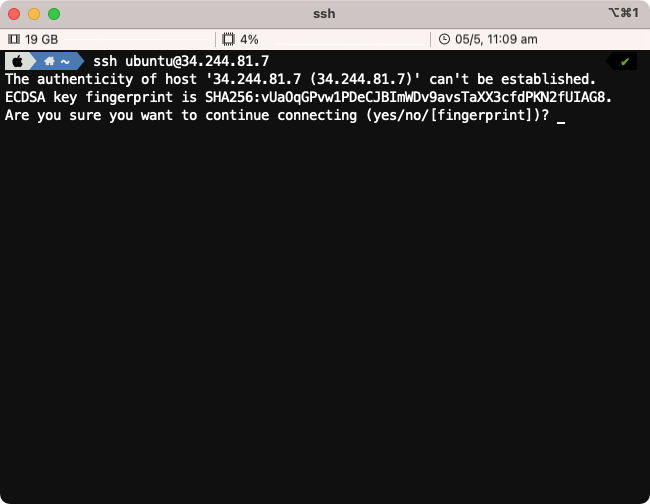
When prompted Are you sure you want to continue connecting (yes/no/[fingerprint])? please type yes.
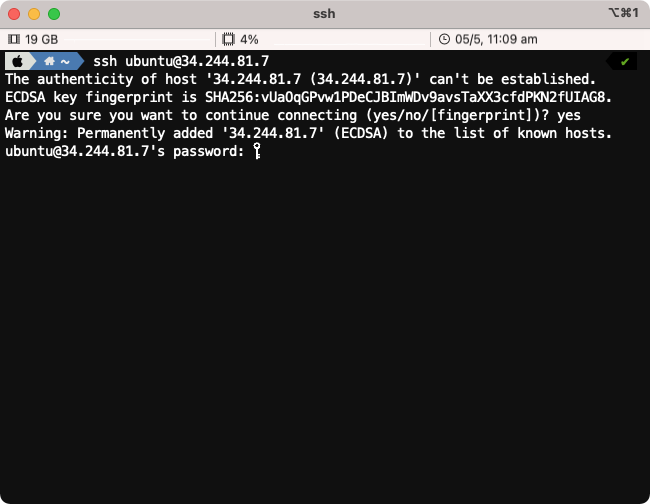
Enter the password provided in the welcome e-mail.
Upon successful login you will be presented with the Splunk logo and the Linux prompt.
At this point you are ready to continue with the workshop when instructed to do so by the instructor
Putty (Windows users only)
If you do not have ssh pre-installed or if you are on a Windows system, the best option is to install putty, you can find the downloads here.
!!! important If you cannot install Putty, please go to Web Browser (All).
Open Putty and in the Host Name (or IP address) field enter the IP address provided in the welcome e-mail.
You can optionally save your settings by providing a name and pressing Save.
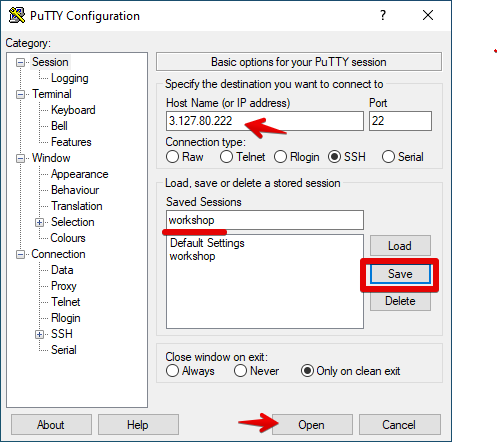
To then login to your instance click on the Open button as shown above.
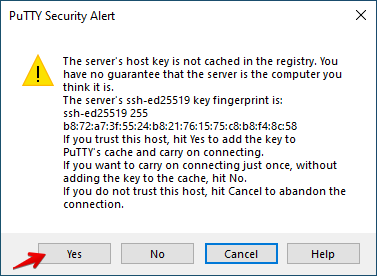
If this is the first time connecting to your EC2 instance, you will be presented with a security dialogue, please click Yes.
Once connected, login in as splunk using the password provided in the welcome e-mail.
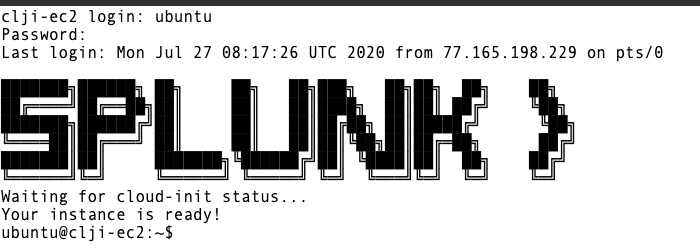
Once you are connected successfully you should see a screen similar to the one below:
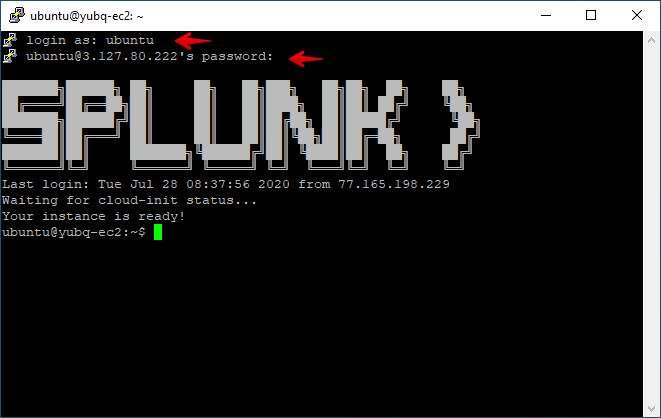
At this point you are ready to continue with the workshop when instructed to do so by the instructor
Web Browser (All)
If you are blocked from using SSH (Port 22) or unable to install Putty you may be able to connect to the workshop instance by using a web browser.
!!! note This assumes that access to port 6501 is not restricted by your company’s firewall.
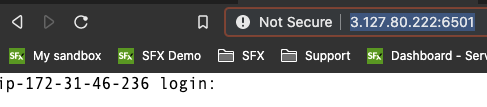
Open your web browser and type http://x.x.x.x:650 (where x.x.x.x is the IP address from the welcome e-mail).

Once connected, login in as splunk and the password is the one provided in the welcome e-mail.
Once you are connected successfully you should see a screen similar to the one below:
Copy & Paste in browser
Unlike when you are using regular SSH, copy and paste does require a few extra steps to complete when using a browser session. This is due to cross browser restrictions.
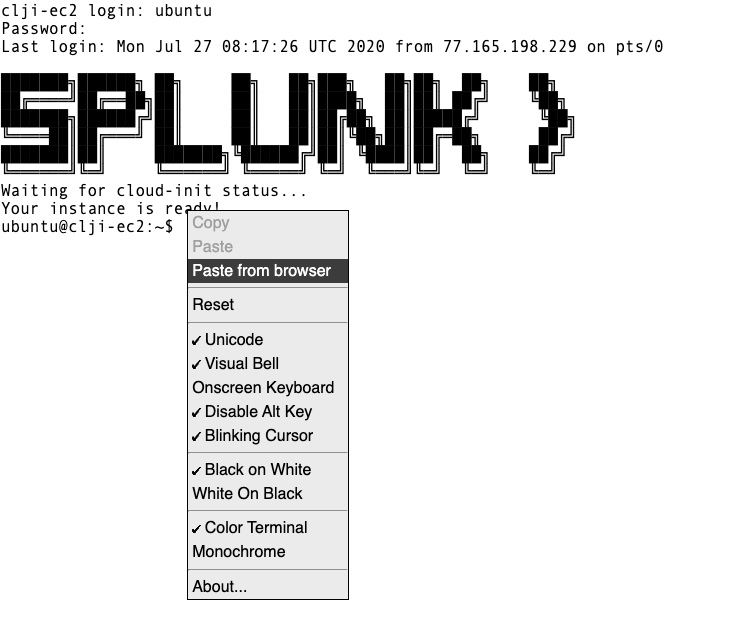
When the workshop asks you to copy instructions into your terminal, please do the following:
Copy the instruction as normal, but when ready to paste it in the web terminal, choose Paste from browser as show below:
This will open a dialogue box asking for the text to be pasted into the web terminal:
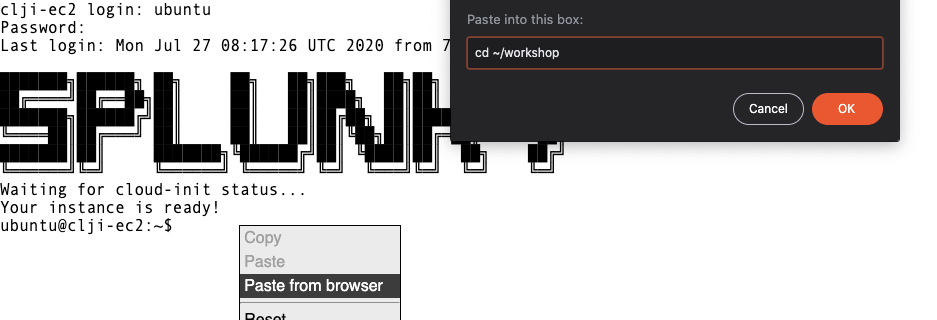
Paste the text in the text box as show, then press OK to complete the copy and paste process.
Unlike regular SSH connection, the web browser has a 60 second time out, and you will be disconnected, and a Connect button will be shown in the center of the web terminal.
Simply click the Connect button and you will be reconnected and will be able to continue.
At this point you are ready to continue with the workshop when instructed to do so by the instructor