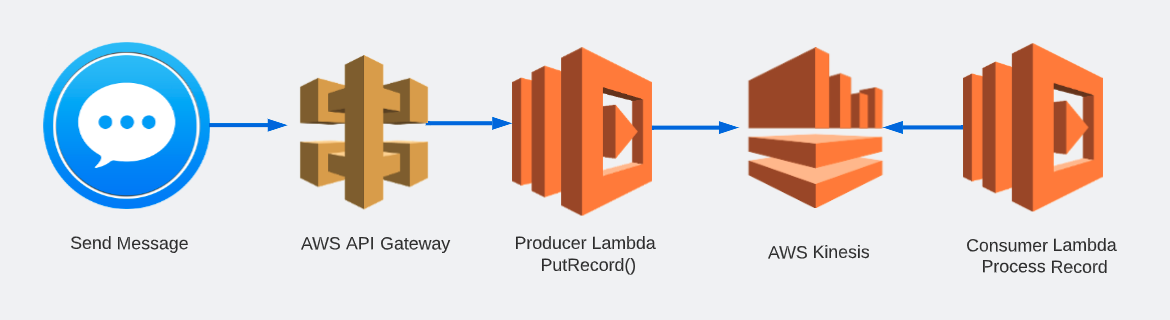
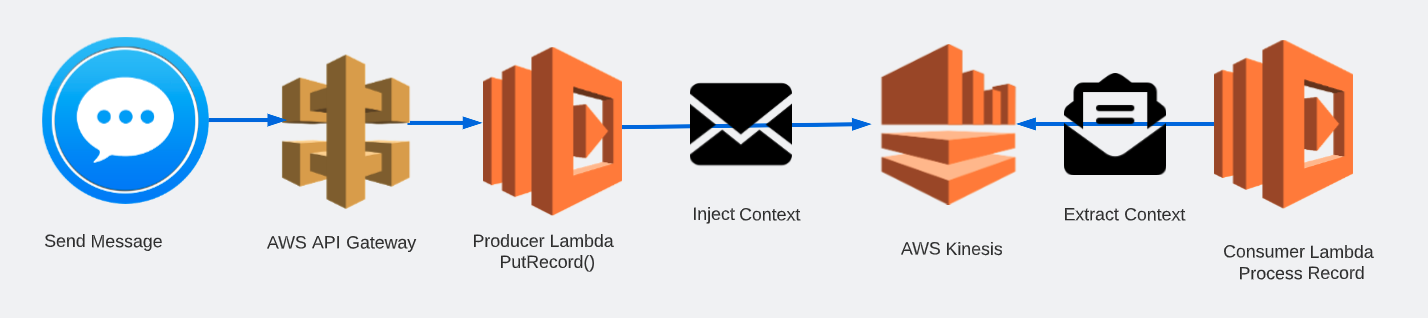
This workshop will equip you with how a distributed trace is constructed for a small serverless application that runs on AWS Lambda, producing and consuming a message via AWS Kinesis.
We will see how auto-instrumentation works with manual steps to force a Producer function’s context to be sent to Consumer function via a Record put on a Kinesis stream.
For this workshop Splunk has prepared an Ubuntu Linux instance in AWS/EC2 all pre-configured for you.
To get access to the instance that you will be using in the workshop, please visit the URL provided by the workshop leader.d
Subsections of Build a Distributed Trace in Lambda and Kinesis
Setup
This lab will make a tracing superhero out of you!
In this lab you will learn how a distributed trace is constructed for a small serverless application that runs on AWS Lambda, producing and consuming your message via AWS Kinesis.
Pre-requisites
You should already have the lab content available on your EC2 lab host.
Ensure that this lab’s required folder o11y-lambda-lab is on your home directory:
cd ~ && ls
o11y-lambda-lab
Note
If you don’t see it, fetch the lab contents by running the following command:
In your Splunk Observability Cloud Organisation (Org) obtain your Access Token and Realm Values.
Please reset your environment variables from the earlier lab. Take care that for this lab we may be using different names - make sure to match the Environment Variable names below.
Examine the output of the updated serverless.yml contents (you may need to scroll up to the relevant section).
cat ~/o11y-lambda-lab/auto/serverless.yml
# USER SET VALUES ===================== custom:accessToken:<updated to your Access Token>realm:<updated to your Realm>prefix:<updated to your Hostname>#======================================
Update Manual instrumentation template
Update your manual instrumentation Serverless template to include new values from the Enviornment variables.
Examine the output of the updated serverless.yml contents (you may need to scroll up to the relevant section).
cat ~/o11y-lambda-lab/manual/serverless.yml
# USER SET VALUES ===================== custom:accessToken:<updated to your Access Token>realm:<updated to your Realm>prefix:<updated to your Hostname>#======================================
Set your AWS Credentials
You will be provided with AWS Access Key ID and AWS Secret Access Key values - substitue these values in place of AWS_ACCESS_KEY_ID and AWS_ACCESS_KEY_SECRET in the bellow command:
This command will create a file ~/.aws/credentials with your AWS Credentials populated.
Note that we are using sls here, which is a Serverless framework for developing and deploying AWS Lambda functions. We will be using this command throughout the lab.
Now you are set up and ready go!
Auto-Instrumentation
Auto-Instrumentation
Navigate to the auto directory that contains auto-instrumentation code.
cd ~/o11y-lambda-lab/auto
Inspect the contents of the files in this directory. Take a look at the serverless.yml template.
cat serverless.yml
Workshop Question
Can you identify which AWS entities are being created by this template?
Can you identify where OpenTelemetry instrumentation is being set up?
Can you determine which instrumentation information is being provided by the Environment Variables?
You should see the Splunk OpenTelemetry Lambda layer being added to each fuction.
Using the environment variables we are configuring and enriching our auto-instrumentation.
Here we provide minimum information, such as NodeJS wrapper location in the Splunk APM Layer, environment name, service name, and our Splunk Org credentials. We are sending trace data directly to Splunk Observability Cloud. You could alternatively export traces to an OpenTelemetry Collector set up in Gateway mode.
Take a look at the function code.
cat handler.js
Workshop Question
Can you identify the code for producer function?
Can you identify the code for consumer function?
Notice there is no mention of Splunk or OpenTelemetry in the code. We are adding the instrumentation using the Lambda layer and Environment Variables only.
Deploy your Lambdas
Run the following command to deploy your Lambda Functions:
sls deploy
Deploying hostname-lambda-lab to stage dev (us-east-1)
...
...
endpoint: POST - https://randomstring.execute-api.us-east-1.amazonaws.com/dev/producer
functions:
  producer: hostname-lambda-lab-dev-producer (1.6 kB)
  consumer: hostname-lambda-lab-dev-consumer (1.6 kB)
This command will follow the instructions in your serverless.yml template to create your Lambda functions and your Kinesis stream. Note it may take a 1-2 minutes to execute.
Note
serverless.yml is in fact a CloudFormation template. CloudFormation is an infrastructure as code service from AWS. You can read more about it here - https://aws.amazon.com/cloudformation/
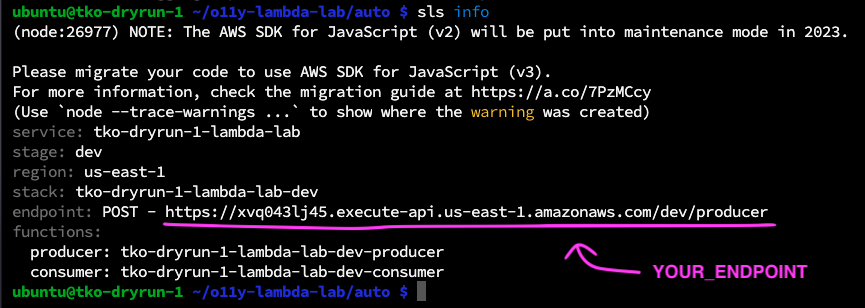
Check the details of your serverless functions:
sls info
Take note of your endpoint value:
Send some Traffic
Use the curl command to send a payload to your producer function. Note the command option -d is followed by your message payload.
Try changing the value of name to your name and telling the Lambda function about your superpower. Replace YOUR_ENDPOINT with the endpoint from your previous step.
You should see the following output if your message is successful:
{"message":"Message placed in the Event Stream: hostname-eventSteam"}
If unsuccessful, you will see:
{"message": "Internal server error"}
If this occurs, ask one of the lab facilitators for assistance.
If you see a success message, generate more load: re-send that messate 5+ times. You should keep seeing a success message after each send.
Check the lambda logs output:
Producer function logs:
sls logs -f producer
Consumer function logs:
sls logs -f consumer
Examine the logs carefully.
Workshop Question
Do you see OpenTelemetry being loaded? Look out for lines with splunk-extension-wrapper.
Lambdas in Splunk APM
Lambdas in Splunk APM
Now it’s time to check how your Lambda traffic has been captured in Splunk APM.
Navigate to your Splunk Observability Cloud
Select APM from the Main Menu and then select your APM Environment. Your APM environment should be in the format $INSTANCE-apm-lambda where the hostname value is a four letter name of your lab host. (Check it by looking at your command prompt, or by running echo $INSTANCE).
Note
It may take a few minutes for you traces to appear in Splunk APM. Try hitting refresh on your browser until you find your environement name in the list of Envrionments
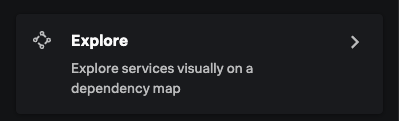
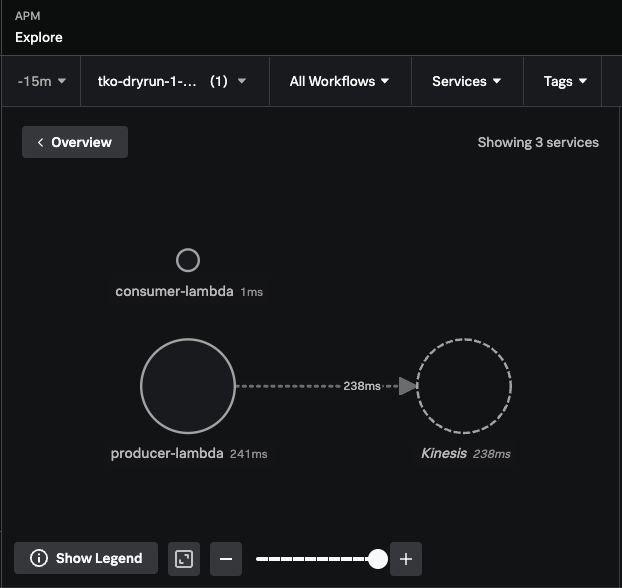
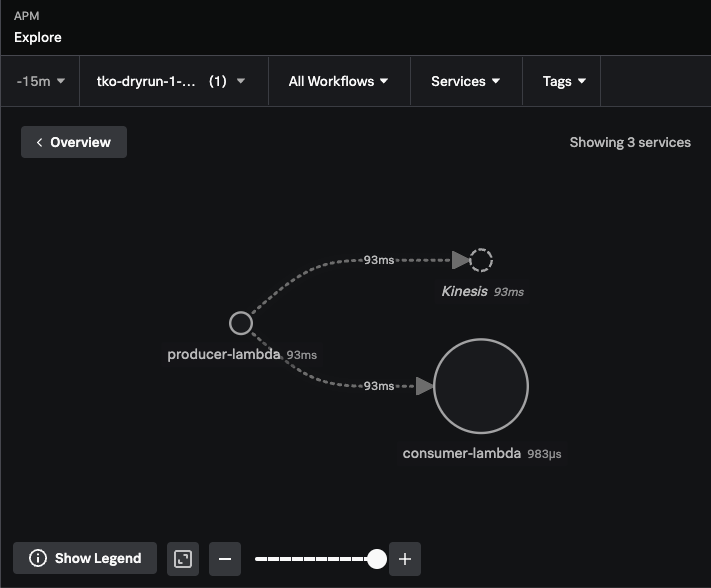
Go to Explore the Service Map to see the Dependencies between your Lambda Functions.
You should be able to see the producer-lambda and the call it is making to Kinesis service.
Workshop Question
What about your consumer-lambda?
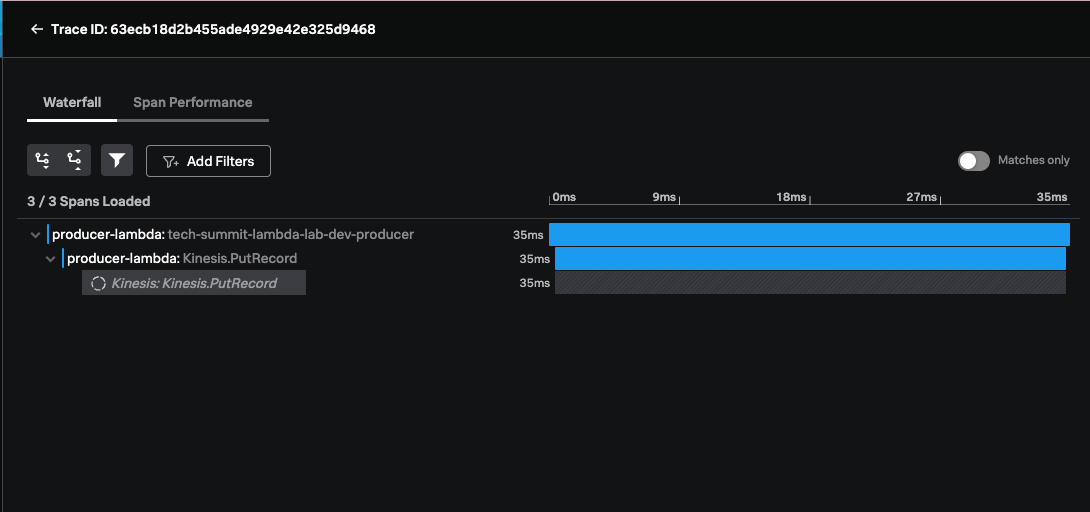
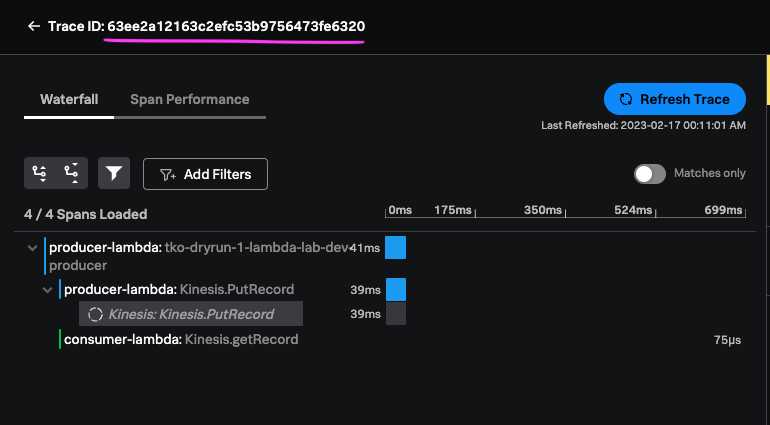
Click into Traces and examine some traces that container procuder function calls and traces with consumer function calls.
We can see the producer-lambda putting a Record on the Kinesis stream. But the action of consumer-function is disconnected!
This is because the Trace Context is not being propagated.
This is not something that is supported automatically Out-of-the-Box by Kinesis service at the time of this lab. Our Distributed Trace stops at Kinesis inferred service, and we can’t see the propagation any further.
Not yet…
Let’s see how we work around this in the next section of this lab.
Manual Instrumentation
Manual Instrumentation
Navigate to the manual directory that contains manually instrumentated code.
cd ~/o11y-lambda-lab/manual
Inspect the contents of the files in this directory. Take a look at the serverless.yml template.
cat serverless.yml
Workshop Question
Do you see any difference from the same file in your auto directory?
While remaining in your manual directory, run the following commandd to re-deploy your Lambda Functions:
sls deploy -f producer
Deploying function producer to stage dev (us-east-1)

✔ Function code deployed (6s)
Configuration did not change. Configuration update skipped. (6s)
sls deploy -f consumer
Deploying function consumer to stage dev (us-east-1)

✔ Function code deployed (6s)
Configuration did not change. Configuration update skipped. (6s)
Note that this deployment now only updates the code changes within the function. Our configuration remains the same.
Check the details of your serverless functions:
sls info
You endpoint value should remain the same:
Send some Traffic again
Use the curl command to send a payload to your producer function. Note the command option -d is followed by your message payload.
Try changing the value of name to your name and telling the Lambda function about your superpower. Replace YOUR_ENDPOINT with the endpoint from your previous step.
You should see the following output if your message is successful:
{"message":"Message placed in the Event Stream: hostname-eventSteam"}
If unsuccessful, you will see:
{"message":"Internal server error"}
If this occurs, ask one of the lab facilitators for assistance.
If you see a success message, generate more load: re-send that messate 5+ times. You should keep seeing a success message after each send.
Check the lambda logs output:
sls logs -f producer
sls logs -f consumer
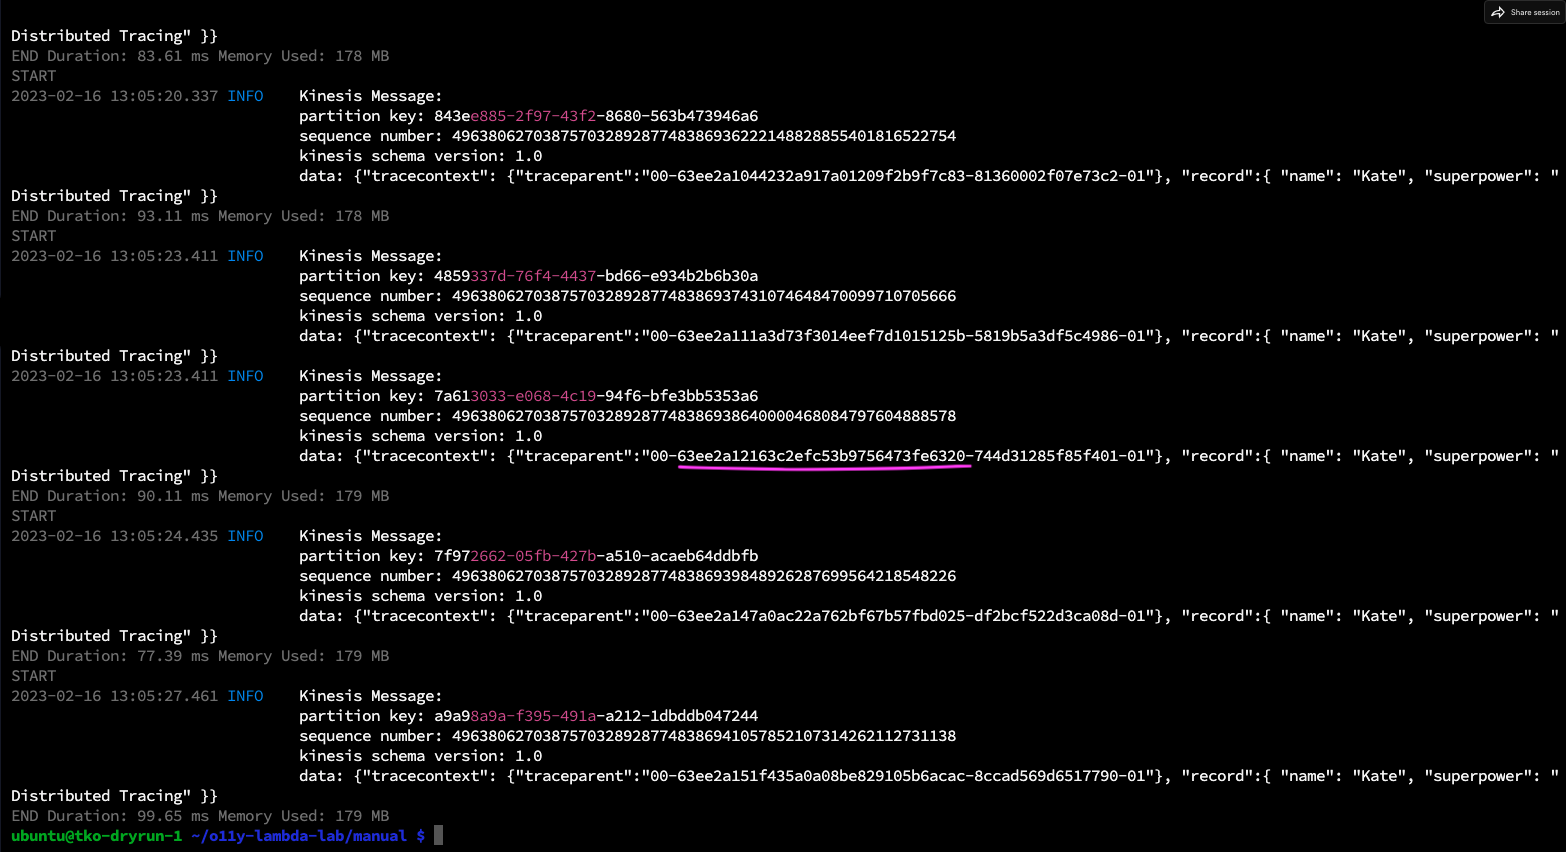
Examine the logs carefully.
Workshop Question
Do you notice the difference?
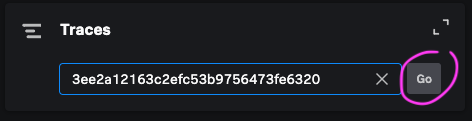
Note that we are logging our Record together with the Trace context that we have added to it. Copy one of the underlined sub-sections of your trace parent context, and save it for later.
It should be self-explanatory from the Propagator we are creating in the Functions
Workshop Question
Bonus Question: What happens if we mix and match the W3C and B3 headers?
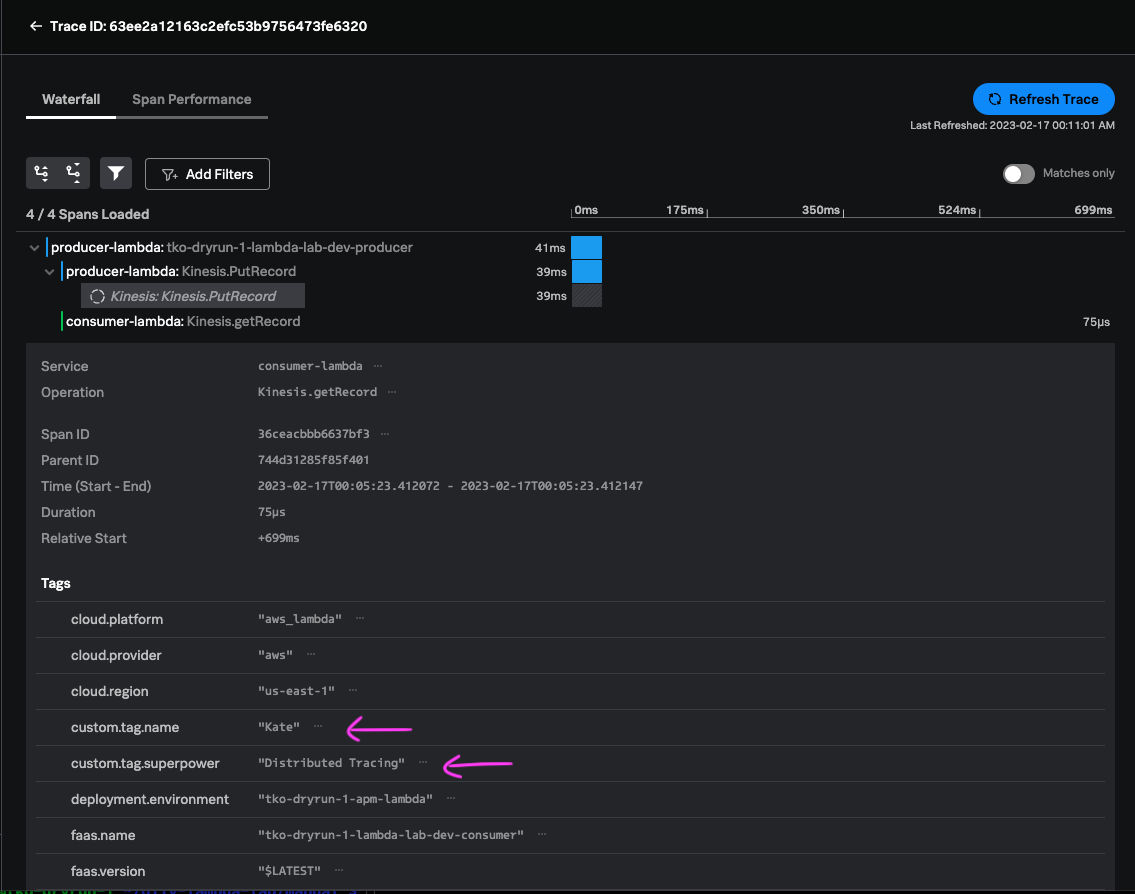
Expand the consumer-lambda span.
Workshop Question
Can you find the attributes from your message?
Summary
Before you Go
Please kindly clean up your lab using the following command:
sls remove
Conclusion
Congratuations on finishing the lab. You have seen how we complement auto-instrumentation with manual steps to force Producer function’s context to be sent to Consumer function via a Record put on a Kinesis stream. This allowed us to build the expected Distributed Trace.
You can now build out a Trace manually by linking two different functions together. This is very powerful when your auto-instrumenation, or third-party systems, do not support context propagation out of the box.