これをこなうには、ディストリビューションに file_storage エクステンションモジュールがインストールされていることを確認する必要があります。確認するには、otelcol-contrib components コマンドを実行します:
otelcol-contrib components
# ... truncated for clarity
extensions:
  - file_storage
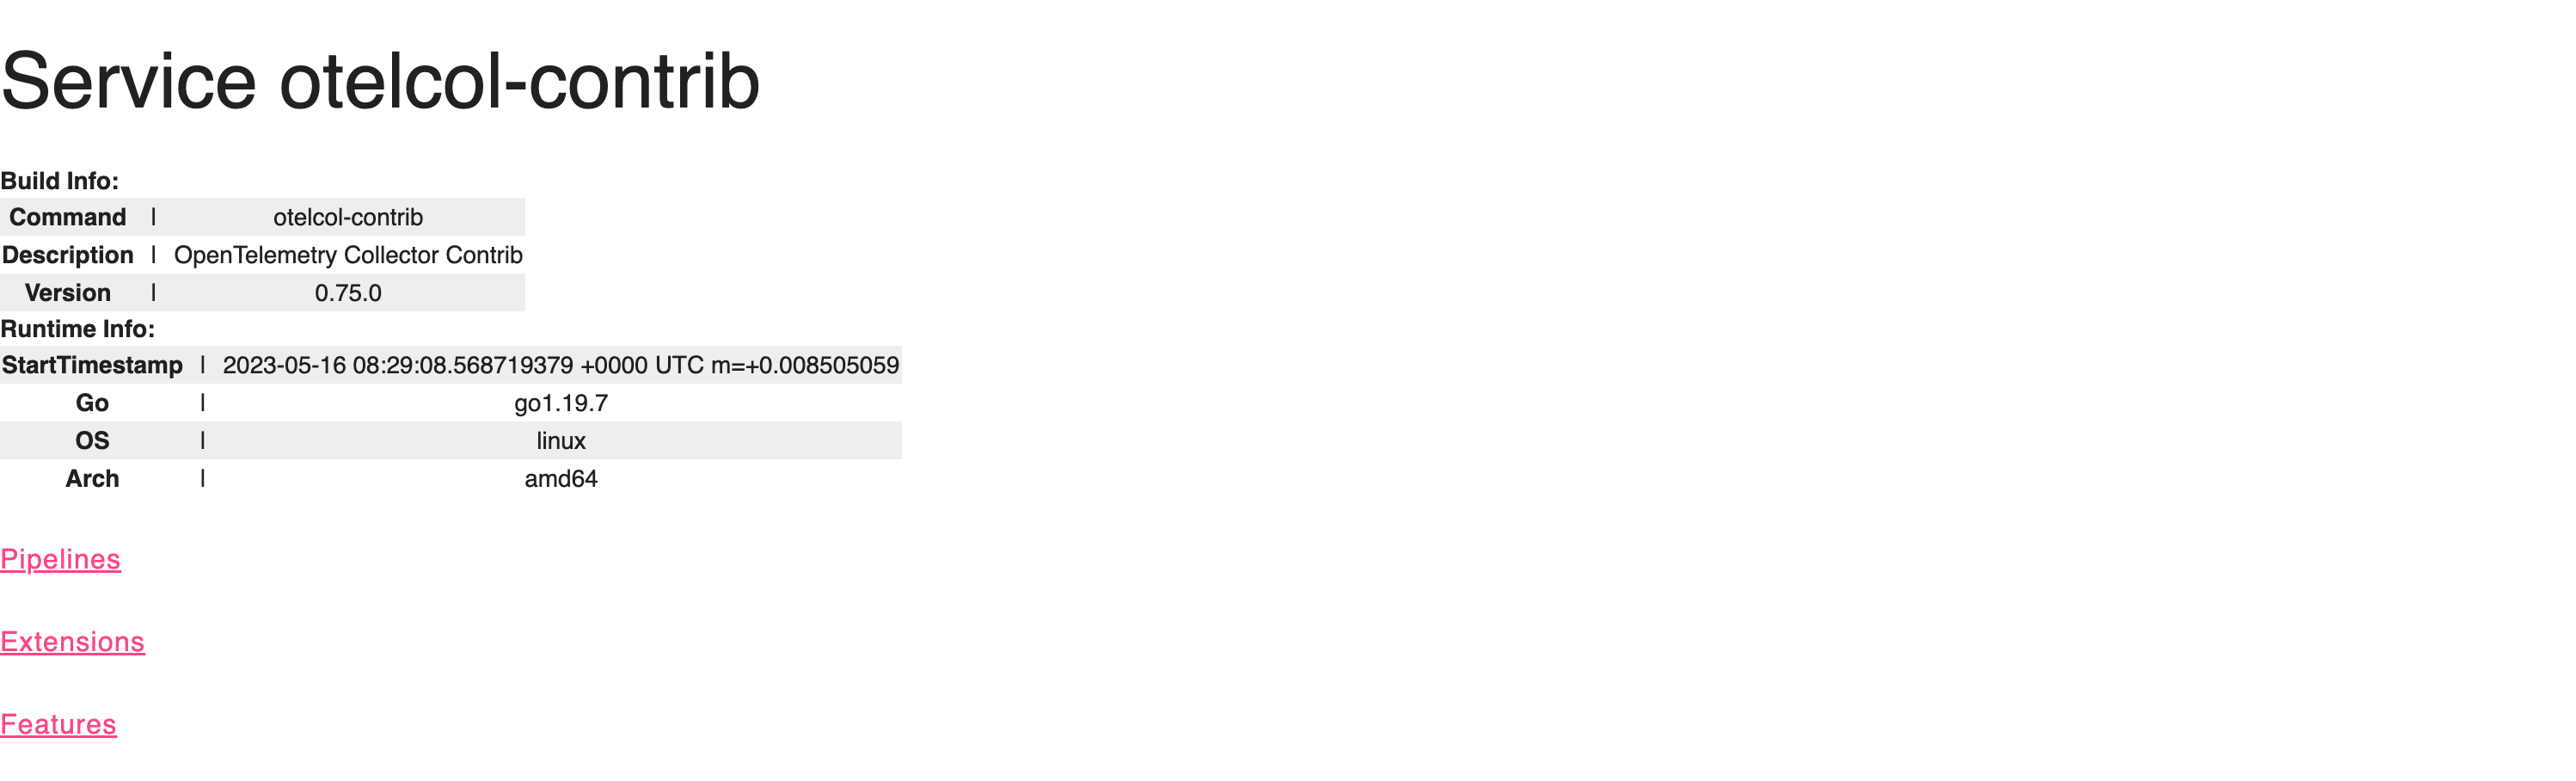
buildinfo:
    command: otelcol-contrib
    description: OpenTelemetry Collector Contrib
    version: 0.80.0
receivers:
    - prometheus_simple
    - apache
    - influxdb
    - purefa
    - purefb
    - receiver_creator
    - mongodbatlas
    - vcenter
    - snmp
    - expvar
    - jmx
    - kafka
    - skywalking
    - udplog
    - carbon
    - kafkametrics
    - memcached
    - prometheus
    - windowseventlog
    - zookeeper
    - otlp
    - awsecscontainermetrics
    - iis
    - mysql
    - nsxt
    - aerospike
    - elasticsearch
    - httpcheck
    - k8sobjects
    - mongodb
    - hostmetrics
    - signalfx
    - statsd
    - awsxray
    - cloudfoundry
    - collectd
    - couchdb
    - kubeletstats
    - jaeger
    - journald
    - riak
    - splunk_hec
    - active_directory_ds
    - awscloudwatch
    - sqlquery
    - windowsperfcounters
    - flinkmetrics
    - googlecloudpubsub
    - podman_stats
    - wavefront
    - k8s_events
    - postgresql
    - rabbitmq
    - sapm
    - sqlserver
    - redis
    - solace
    - tcplog
    - awscontainerinsightreceiver
    - awsfirehose
    - bigip
    - filelog
    - googlecloudspanner
    - cloudflare
    - docker_stats
    - k8s_cluster
    - pulsar
    - zipkin
    - nginx
    - opencensus
    - azureeventhub
    - datadog
    - fluentforward
    - otlpjsonfile
    - syslog
processors:
    - resource
    - batch
    - cumulativetodelta
    - groupbyattrs
    - groupbytrace
    - k8sattributes
    - experimental_metricsgeneration
    - metricstransform
    - routing
    - attributes
    - datadog
    - deltatorate
    - spanmetrics
    - span
    - memory_limiter
    - redaction
    - resourcedetection
    - servicegraph
    - transform
    - filter
    - probabilistic_sampler
    - tail_sampling
exporters:
    - otlp
    - carbon
    - datadog
    - f5cloud
    - kafka
    - mezmo
    - skywalking
    - awsxray
    - dynatrace
    - loki
    - prometheus
    - logging
    - azuredataexplorer
    - azuremonitor
    - instana
    - jaeger
    - loadbalancing
    - sentry
    - splunk_hec
    - tanzuobservability
    - zipkin
    - alibabacloud_logservice
    - clickhouse
    - file
    - googlecloud
    - prometheusremotewrite
    - awscloudwatchlogs
    - googlecloudpubsub
    - jaeger_thrift
    - logzio
    - sapm
    - sumologic
    - otlphttp
    - googlemanagedprometheus
    - opencensus
    - awskinesis
    - coralogix
    - influxdb
    - logicmonitor
    - signalfx
    - tencentcloud_logservice
    - awsemf
    - elasticsearch
    - pulsar
extensions:
    - zpages
    - bearertokenauth
    - oidc
    - host_observer
    - sigv4auth
    - file_storage
    - memory_ballast
    - health_check
    - oauth2client
    - awsproxy
    - http_forwarder
    - jaegerremotesampling
    - k8s_observer
    - pprof
    - asapclient
    - basicauth
    - headers_setter
このエクステンションは、エクスポーターが設定されたエンドポイントにデータを送信できない事象が発生したときに、データをディスクにキューイングする機能をエクスポーターに提供します。
このエクステンションを設定するには、以下の情報を含むように設定を更新する必要があります。まず、 /tmp/otel-data ディレクトリを作成し、読み取り/書き込み権限を与えてください:
extensions:
...
  file_storage:
    directory: /tmp/otel-data
    timeout: 10s
    compaction:
      directory: /tmp/otel-data
      on_start: true
      on_rebound: true
      rebound_needed_threshold_mib: 5
      rebound_trigger_threshold_mib: 3

# ... truncated for clarity

service:
  extensions: [health_check, pprof, zpages, file_storage]
なぜキューデータをディスクに書くの?
コレクターはネットワークの不調(および、コレクターの再起動)を乗り切って、アップストリームプロバイダーに確実にデータを送信できるようになります。
キューデータをディスクに書く時の注意事項は?
ディスクの性能により、データスループットの性能に影響を与える可能性があります
参照
- https://community.splunk.com/t5/Community-Blog/Data-Persistence-in-the-OpenTelemetry-Collector/ba-p/624583
- https://github.com/open-telemetry/opentelemetry-collector-contrib/tree/main/extension/storage/filestorage