Splunk Observability Workshops
Get insights into your applications and infrastructure in real-time with the help of the monitoring, analytics and response tools of the Splunk Observability Cloud
These workshops are going to take you through the best-in-class observability platform for ingesting, monitoring, visualizing and analyzing metrics, traces and logs.
- Splunk4Rookies - Observability Cloud
In this workshop, we will be showing how Splunk Observability Cloud provides instant visibility of the user experience – from the perspective of the front-end application to its back-end services – Letting you experience some of the most compelling product features and differentiators of Splunk Observability Cloud.
- 1. Workshop Overview
Workshop Overview
- 2. OpenTelemetry
Learn about OpenTelemetry and why you should care about it.
- 3. UI - Quick Tour
A quick tour of the Splunk Observability Cloud UI.
- 4. Shopping at the Online Boutique
Interact with the Online Boutique web application to generate data for Splunk Observability Cloud.
- 5. Splunk RUM
This section helps you understand how to use Splunk RUM to monitor the performance of your applications from the end user's perspective.
- 6. Splunk APM
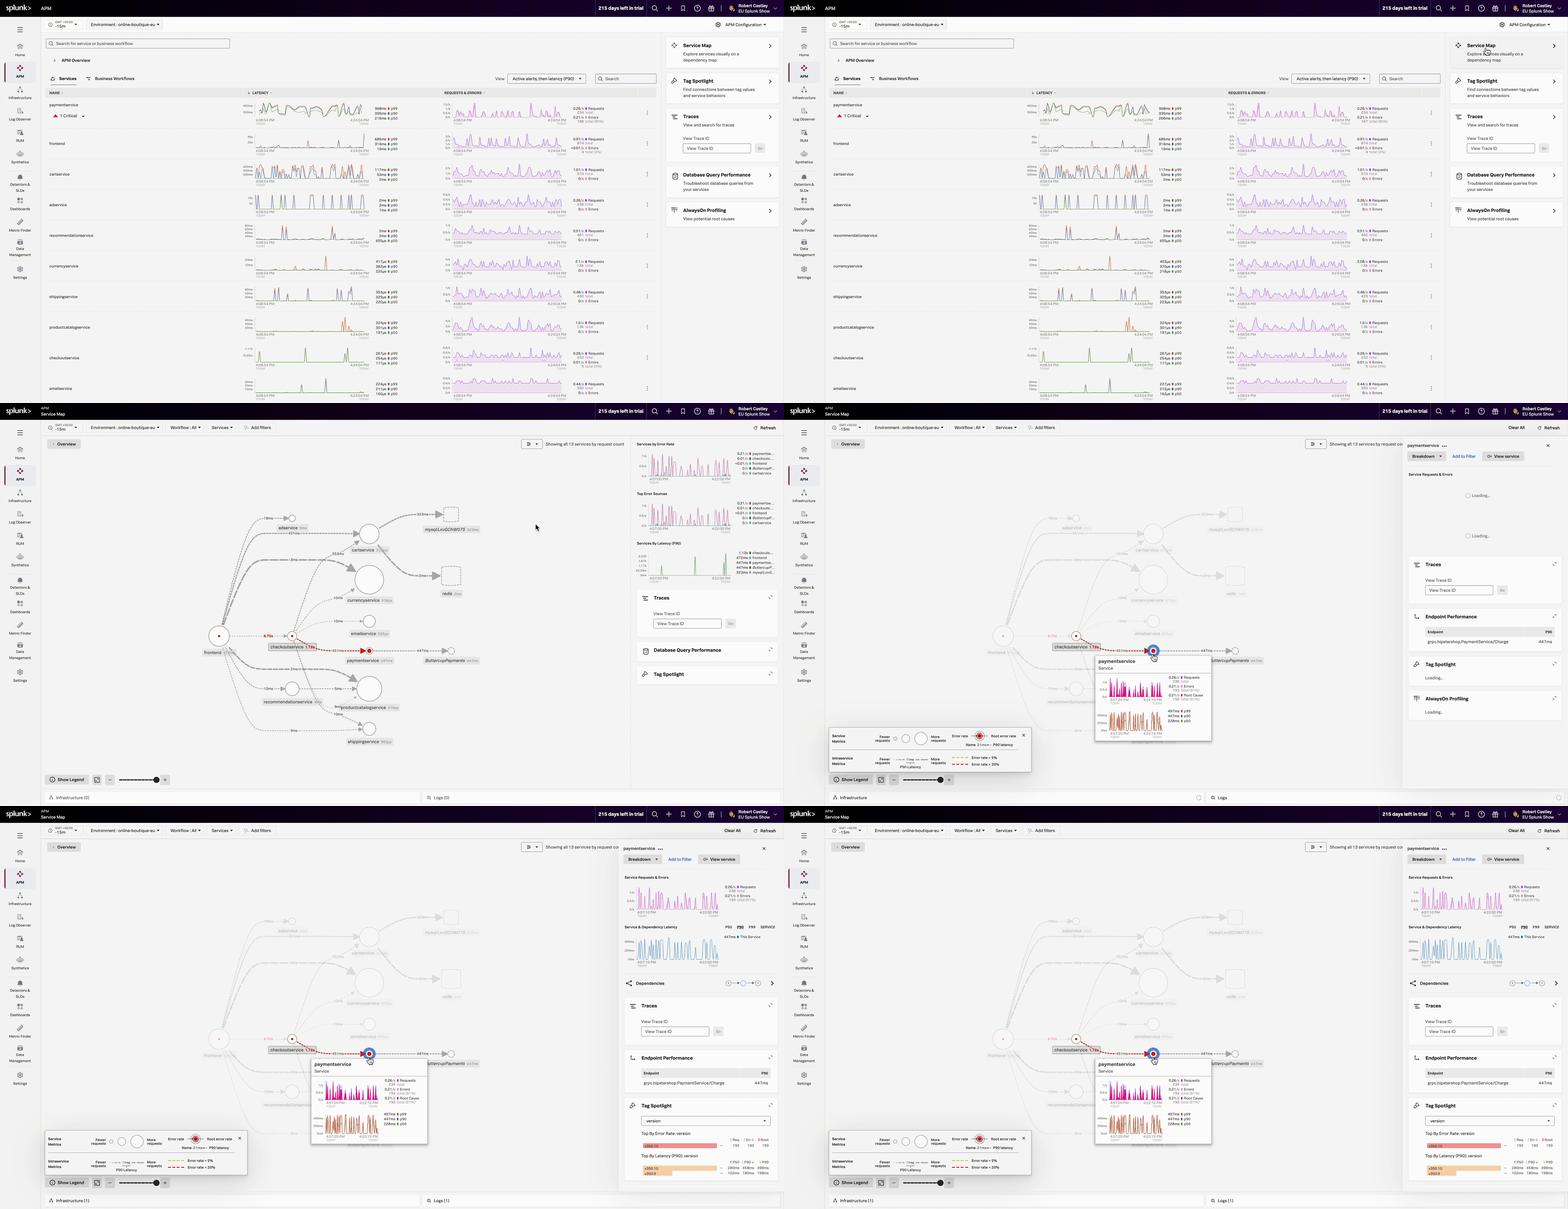
In this section, we will use APM to drill down and identify where the problem is.
- 7. Splunk Log Observer
In this section, we will use Log Observer to drill down and identify what the problem is.
- 8. Splunk Synthetics
In this section, you will learn how to use Splunk Synthetics to monitor the performance and availability of your applications.
- 9. Service Health Dashboard
In this section, you will learn how to build a custom Service Health Dashboard to monitor the health of your services.
- 10. Workshop Wrap-up
Congratulations, you have completed the Splunk4Rookies - Observability Cloud Workshop. Today, you have become familiar with how to use Splunk Observability Cloud to monitor your applications and infrastructure.
- 1. Workshop Overview
- Ninja Workshops
The following workshops require Ninja skills, wax on, wax off.
- Automatic Discovery Workshops
Automatic Discovery Workshops
- Horizontal Pod Autoscaling
This workshop will equip you with the basic understanding of monitoring Kubernetes using the Splunk OpenTelemetry Collector
- OpenTelemetry Collector
Learn the concepts of the OpenTelemetry Collector and how to use it to send data to Splunk Observability Cloud.
- Splunk Synthetic Scripting
Proactively find and fix performance issues across user flows, business transactions and APIs to deliver better digital experiences.
- Lambda Tracing
This workshop will enable you to build a distributed trace for a small serverless application that runs on AWS Lambda, producing and consuming a message via AWS Kinesis
- Automatic Discovery Workshops
- Scenarios
Learn how to build observability solutions with Splunk
- Optimize Cloud Monitoring
This scenario is for ITOps teams managing a hybrid infrastructure that need to troubleshoot cloud-native performance issues, by correlating real-time metrics with logs to troubleshoot faster, improve MTTD/MTTR, and optimize costs.
- Debug Problems in Microservices
This scenario helps engineering teams identify and fix issues caused by planned and unplanned changes to their microservices-based applications.
- Optimize End User Experiences
Use Splunk Real User Monitoring (RUM) and Synthetics to get insight into end user experience, and proactively test scenarios to improve that experience.
- Self-Service Observability
This scenario helps platform engineering (or central tools) teams enable engineers with self-service observability tooling at scale, so developers and SREs can spend less time managing their toolchain and more time building and delivering cool software.
- Optimize Cloud Monitoring
- Resources
Resources for learning about Splunk Observability Cloud
- Dimension, Properties and Tags
One conversation that frequently comes up is Dimensions vs Properties and when you should use one verus the other.
- OpenTelemetry Tagging
When deploying OpenTelemetry in a large organization, it’s critical to define a standardized naming convention for tagging, and a governance process to ensure the convention is adhered to.
- Local Hosting
Resources for setting up a locally hosted workshop environment.
- Dimension, Properties and Tags
- Unsupported Field Workshops
- Splunk IM
Splunk delivers real-time monitoring and troubleshooting to help you maximize infrastructure performance with complete visibility.
- NodeJS Zero-Config Workshop
A workshop using Zero Configuration Auto-Instrumentation for NodeJS.
- GDI (OTel & UF)
Learn how to get data into Splunk Observability Cloud with OpenTelemetry and the Splunk Universal Forwarder.
- Splunk OnCall
Make expensive service outages a thing of the past. Remediate issues faster, reduce on-call burnout and keep your services up and running.
- Splunk IM
- Splunk IM
