Detectors

20 minutes  

After we have a good understanding of our performance baseline, we can start to create Detectors so that we receive alerts when our KPIs are unexpected. If we create detectors before understanding our baseline, we run the risk of generating unnecessary alert noise.

For RUM and Synthetics, we will explore how to create detectors:

  1. on a single Synthetic test
  2. on a single KPI in RUM
  3. on a dashboard chart

For more Detector resources, please see our Observability docs, Lantern, and consider an Education course if you’d like to go more in depth with instructor guidance.

Last Modified Apr 2, 2024

Subsections of Detectors

Test Detectors

Why would we want a detector on a single Synthetic test? Some examples:

  • The endpoint, API transaction, or browser journey is highly critical
  • We have deployed code changes and want to know if the resulting KPI is or is not as we expect
  • We need to temporarily keep a close eye on a specific change we are testing and don’t want to create a lot of noise, and will disable the detector later
  • We want to know about unexpected issues before a real user encounters them
  1. On the test overview page, click Create Detector on the top right. create detector on a single synthetic test create detector on a single synthetic test

  2. Name the detector with your team name and your initials and LCP (the signal we will eventually use), so that the instructor can better keep track of everyone’s progress.

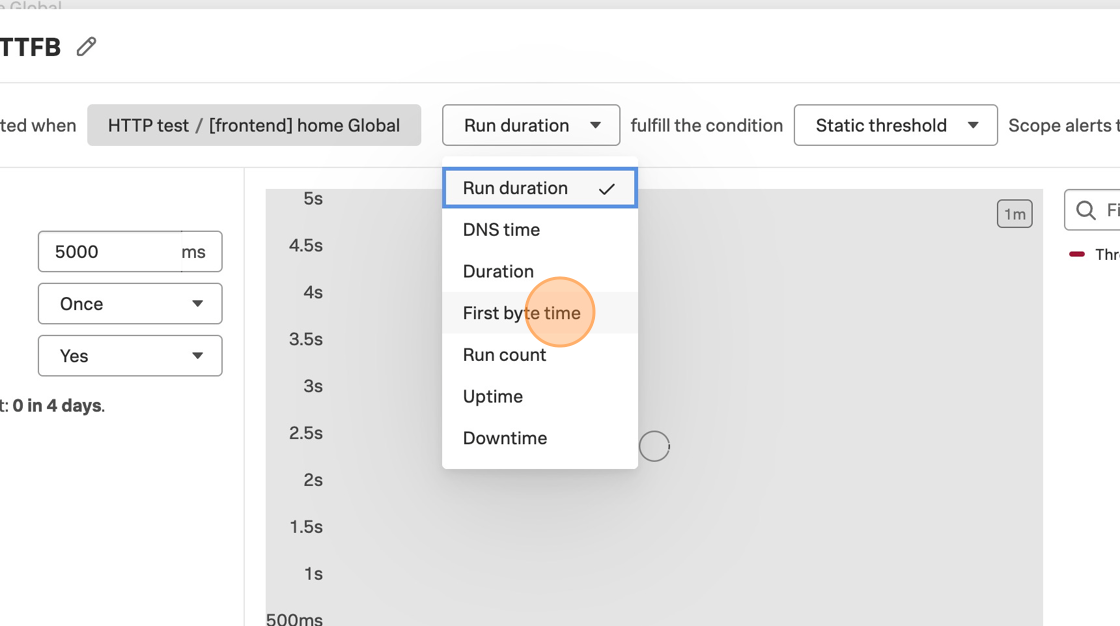
  3. Change the signal to First byte time. change the signal change the signal

  4. Change the alert details, and see how the chart to the right shows the amount of alert events under those conditions. This is where you can decide how much alert noise you want to generate, based on how much your team tolerates. Play with the settings to see how they affect estimated alert noise. alert noise preview alert noise preview

  5. Now, change the signal to Largest contentful paint. This is a key web vital related to the user experience as it relates to loading time. Change the threshold to 2500ms. It’s okay if there is no sample alert event in the detector preview.

  6. Scroll down in this window to see the notification options, including severity and recipients. notification options notification options

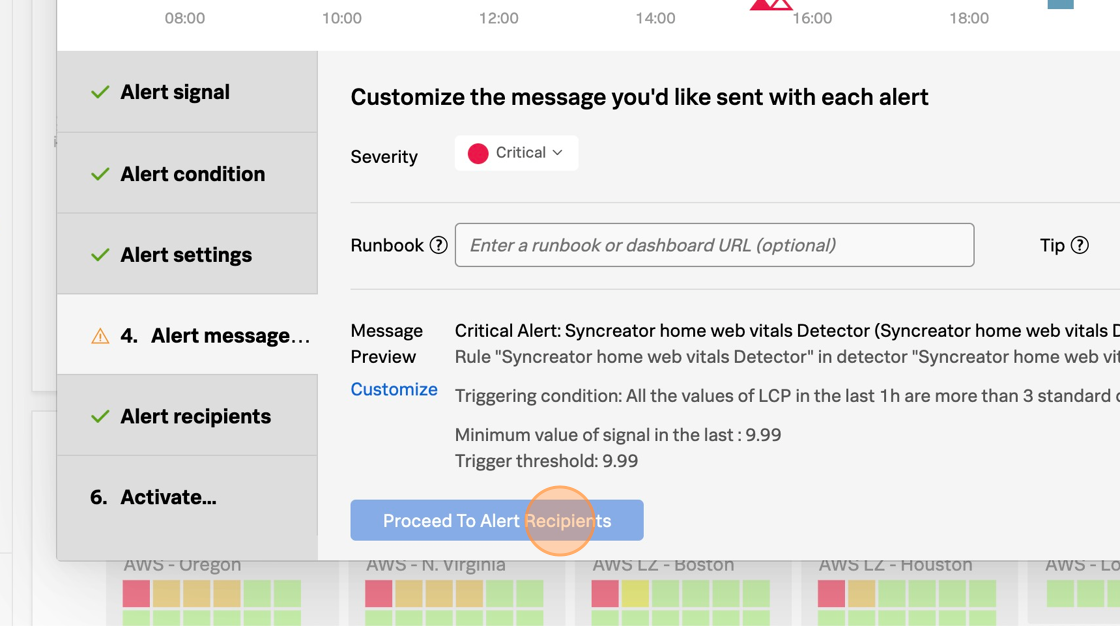
  7. Click the notifications link to customize the alert subject, message, tip, and runbook link. notification customization dialog notification customization dialog

  8. When you are happy with the amount of alert noise this detector would generate, click Activate. activate the detector activate the detector

Last Modified Nov 8, 2024

RUM Detectors

Let’s say we want to know about an issue in production without waiting for a ticket from our support center. This is where creating detectors in RUM will be helpful for us.

  1. Go to the RUM overview of our App. Scroll to the LCP chart, click the chart menu icon, and click Create Detector. RUM LCP chart with action menu flyout RUM LCP chart with action menu flyout

  2. Rename the detector to include your team name and initials, and change the scope of the detector to App so we are not limited to a single URL or page. Change the threshold and sensitivity until there is at least one alert event in the time frame. RUM alert details RUM alert details

  3. Change the alert severity and add a recipient if you’d like, and click Activate to save the Detector.

Exercise

Now, your workshop instructor will change something on the website. How do you find out about the issue, and how do you investigate it?

Tip

Wait a few minutes, and take a look at the online store homepage in your browser. How is the experience in an incognito browser window? How is it different when you refresh the page?

Last Modified Nov 8, 2024

Chart Detectors

With our custom dashboard charts, we can create detectors focussed directly on the data and conditions we care about. In building our charts, we also built signals that can trigger alerts.

Static detectors

For many KPIs, we have a static value in mind as a threshold.

  1. In your custom End User Experience dashboard, go to the “LCP - all tests” chart.

  2. Click the bell icon on the top right of the chart, and select “New detector from chart” new detector from chart new detector from chart

  3. Change the detector name to include your team name and initials, and adjust the alert details. Change the threshold to 2500 or 4000 and see how the alert noise preview changes. alert details alert details

  4. Change the severity, and add yourself as a recipient before you save this detector. Click Activate. activate the detector activate the detector

Advanced: Dynamic detectors

Sometimes we have metrics that vary naturally, so we want to create a more dynamic detector that isn’t limited by the static threshold we decide in the moment.

  1. To create dynamic detectors on your chart, click the link to the “old” detector wizard. click the link to open this detector in the old editor click the link to open this detector in the old editor

  2. Change the detector name to include your team name and initials, and Click Create alert rule name and create alert rule name and create alert rule

  3. Confirm the signal looks correct and proceed to Alert condition. alert signal details alert signal details

  4. Select the “Sudden Change” condition and proceed to Alert settings list of dynamic conditions list of dynamic conditions

  5. Play with the settings and see how the estimated alert noise is previewed in the chart above. Tune the settings, and change the advanced settings if you’d like, before proceeding to the Alert message. alert noise marked on chart based on settings alert noise marked on chart based on settings

  6. Customize the severity, runbook URL, any tips, and message payload before proceeding to add recipients. alert message options alert message options

  7. For the sake of this workshop, only add your own email address as recipient. This is where you would add other options like webhooks, ticketing systems, and Slack channels if it’s in your real environment. recipient options recipient options

  8. Finally, confirm the detector name before clicking Activate Alert Rule activate alert rule button activate alert rule button