Splunk OnCall

1 hour 30 minutes   Author Geoff Higginbottom

Aim

This module is simply to ensure you have access to the Splunk On-Call UI (formerly known as VictorOps), Splunk Infrastructure Monitoring UI (formerly known as SignalFx) and the EC2 Instance which has been allocated to you.

Once you have access to each platform, keep them open for the duration of the workshop as you will be switching between them and the workshop instructions.

1. Activate your Splunk On-Call Login

You should have received an invitation to Activate your Splunk On-Call account via e-mail, if you have not already done so, click the Activate Account link and follow the prompts.

If you did not receive an invitation it is probably because you already have a Splunk On-Call login, linked to a different organization.

If so log in to that Org, then use the organization dropdown next to your username in the top left to switch to the Observability Workshop Org.

Switch Org Switch Org

Note

If you do not see the Organisation dropdown menu item next to your name with Observability Workshop EMEA that is OK, it simply means you only have access to a single Org so that menu is not visible to you.

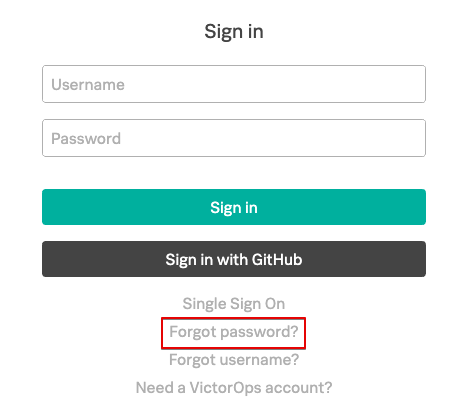
If you have forgotten your password go to the https://portal.victorops.com/membership/#/ page and use the forgotten password link to reset your password.

Reset Pwd Reset Pwd

2. Activate your Splunk Infrastructure Monitoring Login

You should have received an invitation to join the Splunk Infrastructure Monitoring - Observability Workshop. If you have not already done so click the JOIN NOW button and follow the prompts to set a password and activate your login.

3. Access your EC2 Instance

Splunk has provided you with a dedicated EC2 Instance which you can use during this workshop for triggering Incidents the same way the instructor did during the introductory demo. This VM has Splunk Infrastructure Monitoring deployed and has an associated Detector configured. The Detector will pass Alerts to Splunk On-Call which will then create Incidents and page the on-call user.

The welcome e-mail you received providing you all the details for this Workshop contain the instructions for accessing your allocated EC2 Instance.

SSH (Mac OS/Linux)

Most attendees will be able to connect to the workshop by using SSH from their Mac or Linux device.

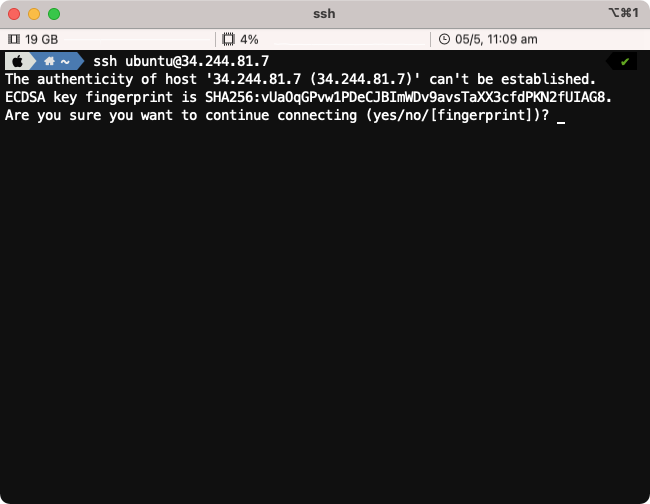
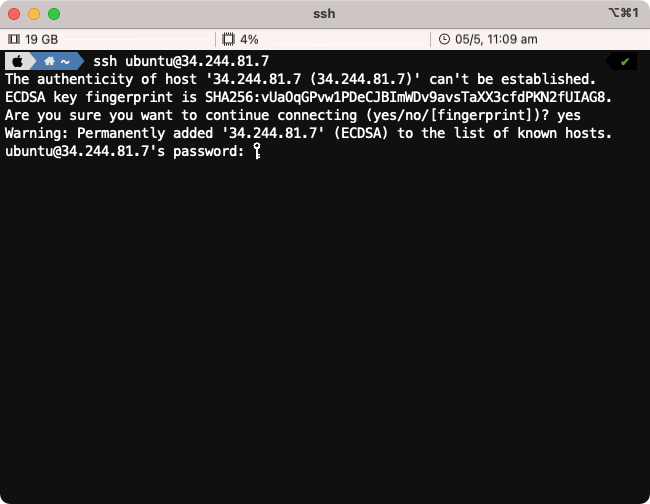
To use SSH, open a terminal on your system and type ssh splunk@x.x.x.x (replacing x.x.x.x with the IP address found in your welcome e-mail).

ssh login ssh login

When prompted Are you sure you want to continue connecting (yes/no/[fingerprint])? please type yes.

ssh password ssh password

Enter the password provided in the welcome e-mail.

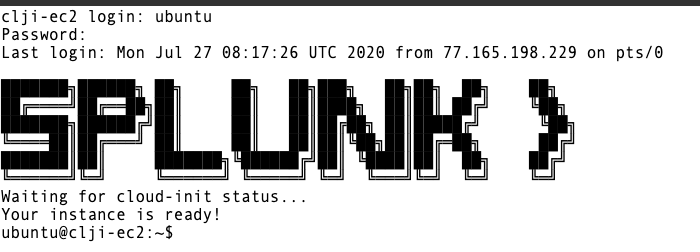
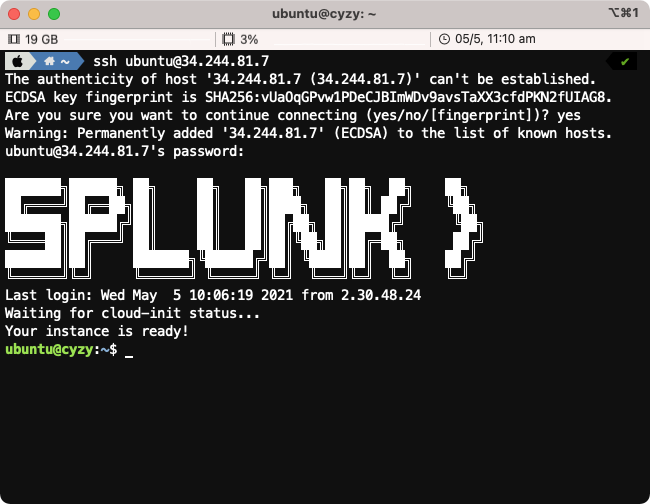
Upon successful login you will be presented with the Splunk logo and the Linux prompt.

ssh connected ssh connected

At this point you are ready to continue with the workshop when instructed to do so by the instructor

Putty (Windows users only)

If you do not have ssh pre-installed or if you are on a Windows system, the best option is to install putty, you can find the downloads here.

!!! important If you cannot install Putty, please go to Web Browser (All).

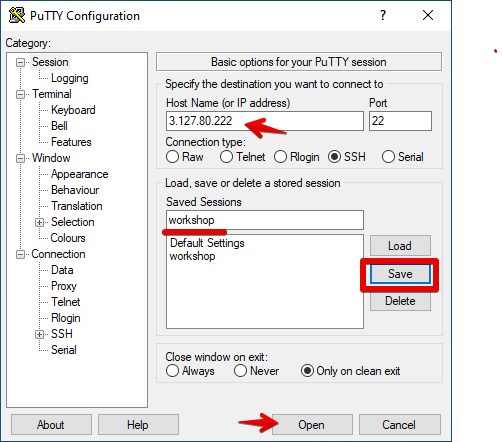
Open Putty and in the Host Name (or IP address) field enter the IP address provided in the welcome e-mail.

You can optionally save your settings by providing a name and pressing Save.

putty-2 putty-2

To then login to your instance click on the Open button as shown above.

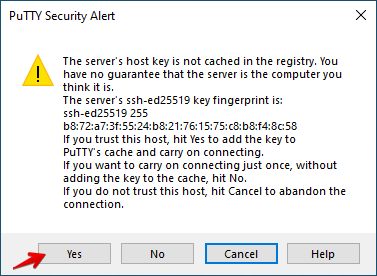
If this is the first time connecting to your EC2 instance, you will be presented with a security dialogue, please click Yes.

putty-3 putty-3

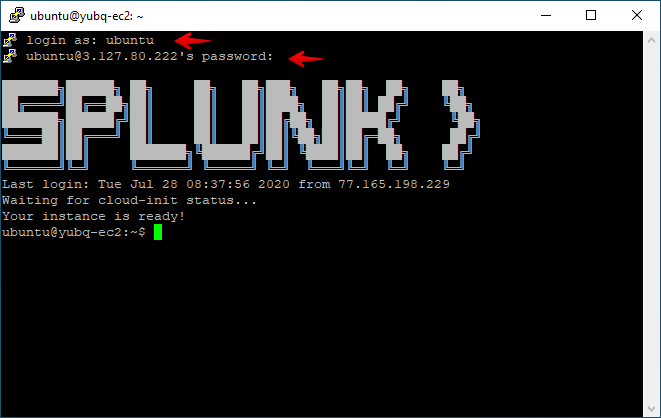
Once connected, login in as splunk using the password provided in the welcome e-mail.

Once you are connected successfully you should see a screen similar to the one below:

putty-4 putty-4

At this point you are ready to continue with the workshop when instructed to do so by the instructor

Web Browser (All)

If you are blocked from using SSH (Port 22) or unable to install Putty you may be able to connect to the workshop instance by using a web browser.

!!! note This assumes that access to port 6501 is not restricted by your company’s firewall.

Open your web browser and type http://x.x.x.x:650 (where x.x.x.x is the IP address from the welcome e-mail).

http-6501 http-6501

Once connected, login in as splunk and the password is the one provided in the welcome e-mail.

http-connect http-connect

Once you are connected successfully you should see a screen similar to the one below:

web login web login


Copy & Paste in browser

Unlike when you are using regular SSH, copy and paste does require a few extra steps to complete when using a browser session. This is due to cross browser restrictions.

When the workshop asks you to copy instructions into your terminal, please do the following:

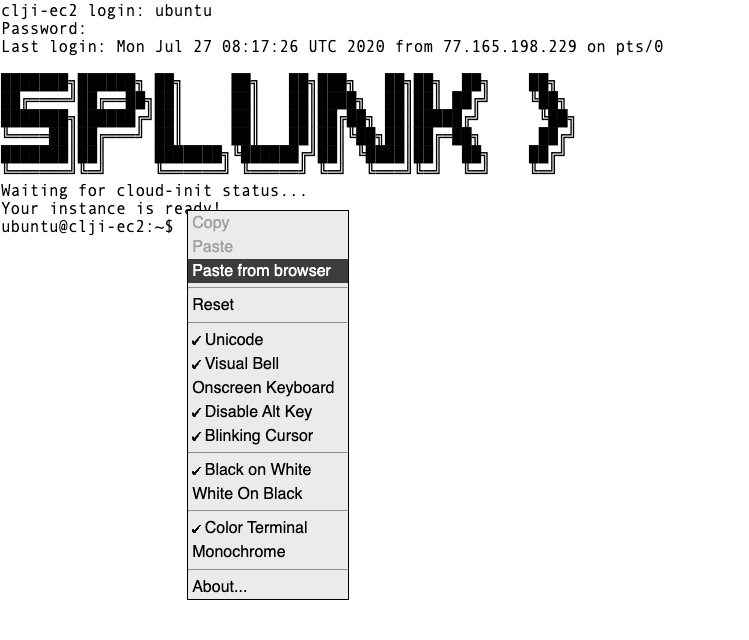
Copy the instruction as normal, but when ready to paste it in the web terminal, choose Paste from browser as show below:

web paste 1 web paste 1

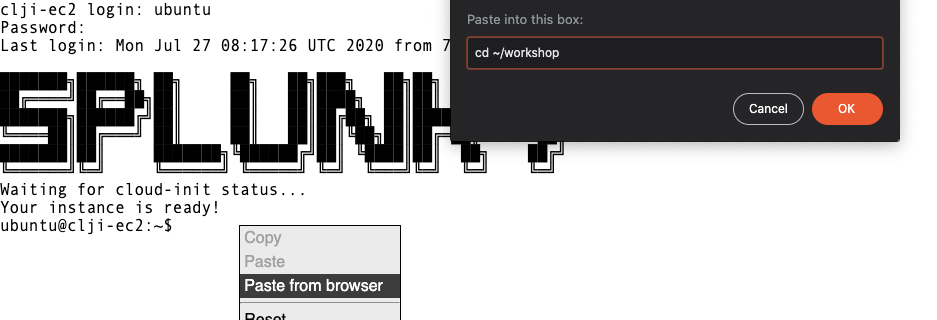
This will open a dialogue box asking for the text to be pasted into the web terminal:

web paste 3 web paste 3

Paste the text in the text box as show, then press OK to complete the copy and paste process.

Details

Unlike regular SSH connection, the web browser has a 60 second time out, and you will be disconnected, and a Connect button will be shown in the center of the web terminal.

Simply click the Connect button and you will be reconnected and will be able to continue.

At this point you are ready to continue with the workshop when instructed to do so by the instructor
Last Modified Sep 19, 2024

Subsections of Splunk OnCall

User Profile

Aim

The aim of this module is for you to configure your personal profile which controls how you will be notified by Splunk On-Call whenever you get paged.

1. Contact Methods

Switch to the Splunk On-Call UI and click on your login name in the top right hand corner and chose Profile from the drop down. Confirm your contact methods are listed correctly and add any additional phone numbers and e-mail address you wish to use.

2. Mobile Devices

To install the Splunk On-Call app for your smartphone search your phones App Store for Splunk On-Call to find the appropriate version of the app. The publisher should be listed as VictorOps Inc.

Apple Store

Google Play

Configuration help guides are available:

Install the App and login, then refresh the Profile page and your device should now be listed under the devices section. Click the Test push notification button and confirm you receive the test message.

3. Personal Calendar

This link will enable you to sync your on-call schedule with your calendar, however as you do not have any allocated shifts yet this will currently be empty. You can add it to your calendar by copying the link into your preferred application and setting it up as a new subscription.

4. Paging Policies

Paging Polices specify how you will be contacted when on-call. The Primary Paging Policy will have defaulted to sending you an SMS assuming you added your phone number when activating your account. We will now configure this policy into a three tier multi-stage policy similar to the image below.

Paging Policy Paging Policy

4.1 Send a push notification

Click the edit policy button in the top right corner for the Primary Paging Policy.

  • Send a push notification to all my devices
  • Execute the next step if I have not responded within 5 minutes

Step 1 Step 1

Click Add a Step

4.2 Send an e-mail

  • Send an e-mail to [your email address]
  • Execute the next step if I have not responded within 5 minutes

Step 2 Step 2

Click Add a Step

4.3 Call your number

  • Every 5 minutes until we have reached you
  • Make a phone call to [your phone number]

Click Save to save the policy.

Step 3 Step 3

When you are on-call or in the escalation path of an incident, you will receive notifications in this order following these time delays.

To cease the paging you must acknowledge the incident. Acknowledgements can occur in one of the following ways:

  • Expanding the Push Notification on your device and selecting Acknowledge
  • Responding to the SMS with the 5 digit code included
  • Pressing 4 during the Phone Call
  • Slack Button

For more information on Notification Types, see here.

5. Custom Paging Policies

Custom paging polices enable you to override the primary policy based on the time and day of the week. A good example would be to get the system to immediately phone you whenever you get a page during the evening or weekends as this is more likely to get your attention than a push notification.

Create a new Custom Policy by clicking Add a Policy and configure with the following settings:

5.1 Custom evening policy

Policy Name: Evening

  • Every 5 minutes until we have reached you
    • Make a phone call to [your phone number]
    • Time Period: All 7 Days
    • Time zone
      • Between 7pm and 9am

Evening Evening

Click Save to save the policy then add one more.

5.2 Custom weekend policy

Policy Name: Weekend

  • Every 5 minutes until we have reached you
    • Make a phone call to [your phone number]
    • Time Period: Sat & Sun
    • Time zone
      • Between 9am and 7pm

Click Save to save the policy.

Weekends Weekends

These custom paging policies will be used during the specified times in place of the Primary Policy. However, admins do have the ability to ignore these custom policies, and we will highlight how this is achieved in a later module.

The final option here is the setting for Recovery Notifications. These are typically low priority, will default to Push, but can also be email, sms or phone call. Your profile is now fully configured using these example configurations.

Organizations will have different views on how profiles should be configured and will typically issue guidelines for paging policies and times between escalations etc.

Please wait for the instructor before proceeding to the Teams module.

Last Modified Sep 19, 2024

Subsections of 1. Getting Started

Teams

Aim

The aim of this module is for you to complete the first step of Team configuration by adding users to your Team.

1. Find your Team

Navigate to the Teams tab on the main toolbar, you should find you that a Team has been created for you as part of the workshop pre-setup and you would have been informed of your Team Name via e-mail.

If you have found your pre-configured Team, skip Step 2. and proceed to Step 3. Configure Your Team. However, if you cannot find your allocated Team, you will need to create a new one, so proceed with Step 2. Create Team

2. Create Team

Only complete this step if you cannot find your pre-allocated Team as detailed in your workshop e-mail. Select Add Team, then enter your allocated team name, this will typically be in the format of “AttendeeID Workshop” and then save by clicking the Add Team button.

3. Configure Your Team

You now need to add other users to your team. If you are running this workshop using the Splunk provided environment, the following accounts are available for testing. If you are running this lab in your own environment, you will have been provided a list of usernames you can use in place of the table below.

These users are dummy accounts who will not receive notifications when they are on call.

NameUsernameShift
Duane ChowduanechowEurope
Steven GomezgomezEurope
Walter WhiteheisenbergEurope
Jim HalpertjimhalpertAsia
Lydia Rodarte-QuaylelydiaAsia
Marie SchradermarieAsia
Maximo ArciniegamaximoWest Coast
Michael ScottmichaelscottWest Coast
Tuco SalamancatucoWest Coast
Jack Welkerjackwelker24/7
Hank Schraderhank24/7
Pam Beeslypambeesly24/7

Add the users to your team, using either the above list or the alternate one provided to you. The value in the Shift column can be ignored for now, but will be required for a later step.

Click Invite User button on the right hand side, then either start typing the usernames (this will filter the list), or copy and paste them into the dialogue box. Once all users are added to the list click the Add User button.

Add Team Members Add Team Members

To make a team member a Team Admin, simply click the :fontawesome-regular-edit: icon in the right hand column, pick any user and make them an Admin.

Add Admin Add Admin

Tip

For large team management you can use the APIs to streamline this process.

Continue and also complete the Configure Rotations module.

Last Modified Sep 19, 2024

Configure Rotations

Aim

A rotation is a recurring schedule, that consists of one or more shifts, with members who rotate through a shift.

The aim of this module is for you to configure two example Rotations, and assign Team Members to the Rotations.


Navigate to the Rotations tab on the Teams sub menu, you should have no existing Rotations so we need to create some.

The 1st Rotation you will create is for a follow the sun support pattern where the members of each shift provide cover during their normal working hours within their time zone.

The 2nd will be a Rotation used to provide escalation support by more experienced senior members of the team, based on a 24/7, 1 week shift pattern.

1. Follow the Sun Support - Business Hours

Click Add Rotation

Add Rotation Add Rotation

Enter a name of “Follow the Sun Support - Business Hours” and Select Partial day from the three available shift templates.

Follow the Sun Follow the Sun

  • Enter a Shift name of “Asia
  • Time Zone set to “Asia/Tokyo
  • Each user is on duty from “Monday through Friday from 9.00am to 5.00pm
  • Handoff happens every “5 days
  • The next handoff happens - Select the next Monday using the calendar
  • Click Save Rotation

Asia Shift Asia Shift

You will now be prompted to add Members to this shift; add the Asia members who are Jim Halpert, Lydie Rodarte-Quayle and Marie Schrader, but only if you’re using the Splunk provided environment for this workshop.

If you’re using your own Organisation refer to the specific list provided separately.

Asia Members Asia Members

Now add an 2nd shift for Europe by again clicking +Add a shift → Partial Day

  • Enter a Shift name of “Europe
  • Time Zone set to “Europe/London
  • Each user is on duty from “Monday through Friday from 9.00am to 5.00pm
  • Handoff happens every “5 days
  • The next handoff happens - Select the next Monday using the calendar
  • Click Save Shift

Europe Shift Europe Shift

You will again be prompted to add Members to this shift; add the Europe members who are Duane Chow, Steven Gomez and Walter White, but only if you’re using the Observability Workshop Org for this workshop.

If you’re using your own Organisation refer to the specific list provided separately.

Europe Members Europe Members

Now add a 3rd shift for West Coast USA by again clicking +Add a shift - Partial Day

  • Enter a Shift name of “West Coast
  • Time Zone set to “US/Pacific
  • Each user is on duty from “Monday through Friday from 9.00am to 5.00pm
  • Handoff happens every “5 days
  • The next handoff happens - Select the next Monday using the calendar
  • Click Save Shift

West Coast Shift West Coast Shift

You will again be prompted to add Members to this shift; add the West Coast members who are Maximo Arciniega, Michael Scott and Tuco Salamanca, but only if you’re using the Observability Workshop Org for this workshop.

If you’re using your own Organisation refer to the specific list provided separately.

West Coast Members West Coast Members

The first user added will be the ‘current’ user for that shift.

You can re-order the shifts by simply dragging the users up and down, and you can change the current user by clicking Set Current on an alternate user

You will now have three different Shift patterns, that provide cover 24hr hours, Mon - Fri, but with no cover at weekends.

We will now add another Rotation for our Senior SRE Escalation cover.


2. Senior SRE Escalation

  • Click Add Rotation
  • Enter a name of “Senior SRE Escalation
  • Select 24/7 from the three available shift templates
  • Enter a Shift name of “Senior SRE Escalation
  • Time Zone set to “Asia/Tokyo
  • Handoff happens every “7 days at 9.00am
  • The next handoff happens [select the next Monday from the date picker]
  • Click Save Rotation

24/7 Shift 24/7 Shift

You will again be prompted to add Members to this shift; add the 24/7 members who are Jack Welker, Hank Schrader and Pam Beesly, but only if you’re using the Observability Workshop Org for this workshop.

If you’re using your own Organisation refer to the specific list provided separately.

24/7 Members 24/7 Members


Please wait for the instructor before proceeding to the Configuring Escalation Policies module.

Last Modified Sep 19, 2024

Configure Escalation Policies

Aim

Escalation policies determine who is actually on-call for a given team and are the link to utilizing any rotations that have been created.

The aim of this module is for you to create three different Escalation Policies to demonstrate a number of different features and operating models.

The instructor will start by explaining the concepts before you proceed with the configuration.


Navigate to the Escalation Polices tab on the Teams sub menu, you should have no existing Polices so we need to create some.

No Escalation Policies No Escalation Policies

We are going to create the following Polices to cover off three typical use cases.

Escalation Policies Escalation Policies

1. 24/7 Policy

Click Add Escalation Policy

  • Policy Name: 24/7
  • Step 1
  • Immediately
    • Notify the on-duty user(s) in rotation → Senior SRE Escalation
    • Click Save

24/7 Escalation Policy 24/7 Escalation Policy

2. Primary Policy

Click Add Escalation Policy

  • Policy Name: Primary
  • Step 1
  • Immediately
  • Notify the on-duty user(s) in rotation → Follow the Sun Support - Business Hours
  • Click Add Step

Pri Escalation Policy Step 1 Pri Escalation Policy Step 1

  • Step 2
  • If still un-acknowledged after 15 minutes
  • Notify the next user(s) in the current on-duty shift → Follow the Sun Support - Business Hours
  • Click Add Step

Pri Escalation Policy Step 2 Pri Escalation Policy Step 2

  • Step 3
  • If still un-acknowledged after 15 more minutes
  • Execute Policy → [Your Team Name] : 24/7
  • Click Save

Pri Escalation Policy Step 3 Pri Escalation Policy Step 3

3. Waiting Room Policy

Click Add Escalation Policy

  • Policy Name: Waiting Room
  • Step 1
  • If still un-acknowledged after 10 more minutes
  • Execute Policy → [Your Team Name] : Primary
  • Click Save

WR Escalation Policy WR Escalation Policy

You should now have the following three escalation polices:

Escalation Policies Escalation Policies

You may have noticed that when we created each policy there was the following warning message:

Warning

There are no routing keys for this policy - it will only receive incidents via manual reroute or when on another escalation policy

This is because there are no Routing Keys linked to these Escalation Polices, so now that we have these polices configured we can create the Routing Keys and link them to our Polices..


Continue and also complete the Creating Routing Keys module.

Last Modified Sep 19, 2024

Creating Routing Keys

Aim

Routing Keys map the incoming alert messages from your monitoring system to an Escalation Policy which in turn sends the notifications to the appropriate team.

Note that routing keys are case insensitive and should only be composed of letters, numbers, hyphens, and underscores.

The aim of this module is for you to create some routing keys and then link them to your Escalation Policies you have created in the previous exercise.


1. Instance ID

Each participant requires a unique Routing Key so we use the Hostname of the EC2 Instance you were allocated. We are only doing this to ensure your Routing Key is unique and we know all Hostnames are unique. In a production deployment the Routing Key would typically reflect the name of a System or Service being monitored, or a Team such as 1st Line Support etc.

Your welcome e-mail informed you of the details of your EC2 Instance that has been provided for you to use during this workshop and you should have logged into this as part of the 1st exercise.

The e-mail also contained the Hostname of the Instance, but you can also obtain it from the Instance directly. To get your Hostname from within the shell session connected to your Instance run the following command:

echo ${HOSTNAME}
zevn

It is very important that when creating the Routing Keys you use the 4 letter hostname allocated to you as a Detector has been configured within Splunk Infrastructure Monitoring using this hostname, so any deviation will cause future exercises to fail.

2 Create Routing Keys

Navigate to Settings on the main menu bar, you should now be at the Routing Keys page.

You are going to create the following two Routing Keys using the naming conventions listed in the following table, but replacing {==HOSTNAME==} with the value from above and replace TEAM_NAME with the team you were allocated or created earlier.

Routing KeyEscalation Policies
HOSTNAME_PRITEAM_NAME : Primary
HOSTNAME_WRTEAM_NAME : Waiting Room

There will probably already be a number of Routing Keys configured, but to add a new one simply scroll to the bottom of the page and then click Add Key

In the left hand box, enter the name for the key as per the table above. In the Routing Key column, select your Teams Primary policy from the drop down in the Escalation Polices column. You can start typing your Team Name to filter the results.

Add Routing Key Add Routing Key

Note

If there are a large number of participants on the workshop, resulting in an unusually large number of Escalation Policies sometimes the search filter does not list all the Policies under your Team Name. If this happens instead of using the search feature, simply scroll down to your team name, all the policies will then be listed.

Repeat the above steps for both Keys, xxxx_PRI and xxxx_WR, mapping them to your Teams Primary and Waiting Room policies.

You should now have two Routing Keys configured, similar to the following:

Routing Keys Routing Keys

Tip

You can assign a Routing Key to multiple Escalation Policies if required by simply selecting more from the list

If you now navigate back to Teams → [Your Team Name] → Escalation Policies and look at the settings for your Primary and Waiting Room polices you will see that these now have Routes assigned to them.

Routing Keys Assigned Routing Keys Assigned

The 24/7 policy does not have a Route assigned as this will only be triggered via an Execute Policy escalation from the Primary policy.


Please wait for the instructor before proceeding to the Incident Lifecycle/Overview module.

Last Modified Sep 19, 2024

Incident Lifecycle

Aim

The aim of this module is for you to get more familiar with the Timeline Tab and the filtering features.

1. Timeline

The aim of Splunk On-Call is to make being on call more bearable, and it does this by getting the critical data, to the right people, at the right time.

The key to making it work for you is to centralize all your alerting sources, sending them all to the Splunk On-Call platform, then you have a single pane of glass in which to manage all of your alerting.

Login to the Splunk On-Call UI and select the Timeline tab on the main menu bar, you should have a screen similar to the following image:

Splunk On-Call UI Splunk On-Call UI

2. People

On the left we have the People section with the Teams and Users sub tabs. On the Teams tab, click on All Teams then expand [Your Team name].

Users with the Splunk On-Call Logo against their name are currently on call. Here you can see who is on call within a particular Team, or across all Teams via Users → On-Call.

If you click into one of the currently on call users, you can see their status. It shows which Rotation they are on call for, when their current Shift ends and their next Shift starts (times are displayed in your time zone), what contact methods they have and which Teams they belong to (dummy users such as Hank do not have Contact Methods configured).

User Detail User Detail

3. Timeline

In the centre Timeline section you get a realtime view of what is happening within your environment with the newest messages at the top. Here you can quickly post update messages to make your colleagues aware of important developments etc.

You can filter the view using the buttons on the top toolbar showing only update messages, GitHub integrations, or apply more advanced filters.

Lets change the Filters settings to streamline your view. Click the Filters button then within the Routing Keys tab change the Show setting from all routing keys to selected routing keys. Change the My Keys value to all and the Other Keys value to selected and deselect all keys under the Other Keys section.

Click anywhere outside of the dialogue box to close it.

Timeline Filters Timeline Filters

You will probably now have a much simpler view as you will not currently have Incidents created using your Routing Keys, so you are left with the other types of messages that the Timeline can display.

Click on Filters again, but this time switch to the Message Types tab. Here you control the types of messages that are displayed.

For example, deselect On-call Changes and Escalations, this will reduce the amount of messages displayed.

Timeline Filters Message Types Timeline Filters Message Types

4. Incidents

On the right we have the Incidents section. Here we get a list of all the incidents within the platform, or we can view a more specific list such as incidents you are specifically assigned to, or for any of the Teams you are a member of.

Select the Team Incidents tab you should find that the Triggered, Acknowledged & Resolved tabs are currently all empty as you have had no incidents logged.

Let’s change that by generating your first incident!

Continue with the Create Incidents module.

Last Modified Sep 19, 2024

Subsections of 2. Incident Lifecycle

Create Incidents

Aim

The aim of this module is for you to place yourself ‘On-Call’ then generate an Incident using the supplied EC2 Instance so you can then work through the lifecycle of an Incident.


1. On-Call

Before generating any incidents you should assign yourself to the current Shift within your Follow the Sun Support - Business Hours Rotation and also place yourself On-Call.

  • Click on the Schedule link within your Team in the People section on the left, or navigate to Teams → [Your Team] → Rotations
  • Expand the Follow the Sun Support - Business Hours Rotation
  • Click on the Manage members icon (the figures) for the current active shift depending on your time zone Manage Members Manage Members
  • Use the Select a user to add… dropdown to add yourself to the shift
  • Then click on Set Current next to your name to make yourself the current on-call user within the shift
  • You should now get a Push Notification to your phone informing you that You Are Now On-Call On Duty On Duty

2. Trigger Alert

Switch back to your shell session connected to your EC2 Instance; all of the following commands will be executed from your Instance.

Force the CPU to spike to 100% by running the following command:

openssl speed -multi $(grep -ci processor /proc/cpuinfo)
Forked child 0
+DT:md4:3:16
+R:19357020:md4:3.000000
+DT:md4:3:64
+R:14706608:md4:3.010000
+DT:md4:3:256
+R:8262960:md4:3.000000
+DT:md4:3:1024

This will result in an Alert being generated by Splunk Infrastructure Monitoring which in turn will generate an Incident within Splunk On-Call within a maximum of 10 seconds. This is the default polling time for the OpenTelemetry Collector installed on your instance (note it can be reduced to 1 second).


Continue with the Manage Incidents module.

Last Modified Sep 19, 2024

Manage Incidents

1. Acknowledge

Use your Splunk On-Call App on your phone to acknowledge the Incident by clicking on the push notification

Push Notification Push Notification

…to open the alert in the Splunk On-Call mobile app, then clicking on either the single tick in the top right hand corner, or the Acknowledge link to acknowledge the incident and stop the escalation process.

The :fontawesome-solid-check: will then transform into a :fontawesome-solid-check::fontawesome-solid-check:, and the status will change from TRIGGERED to ACKNOWLEDGED.

Triggered IncidentAcknowledge Incident
Acknowledge Alert Acknowledge AlertAlert Acknowledged Alert Acknowledged

2. Details and Annotations

Still on your phone, select the Alert Details tab. Then on the Web UI, navigate back to Timeline, select Team Incidents on the right, then select Acknowledged and click into the new Incident, this will open up the War Room Dashboard view of the Incident.

You should now have the Details tab displayed on both your Phone and the Web UI. Notice how they both show the exact same information.

Now select the Annotations tab on both the Phone and the Web UI, you should have a Graph displayed in the UI which is generated by Splunk Infrastructure Monitoring.

UI Annotations UI Annotations

On your phone you should get the same image displayed (sometimes it’s a simple hyperlink depending on the image size)

Phone Link Phone Link

Splunk On-Call is a ‘Mobile First’ platform meaning the phone app is full functionality and you can manage an incident directly from your phone.

For the remainder of this module we will focus on the Web UI however please spend some time later exploring the phone app features.

Sticking with the Web UI, click the 2. Alert Details in SignalFx link.

Alert Details Alert Details

This will open a new browser tab and take you directly to the Alert within Splunk Infrastructure Monitoring where you could then progress your troubleshooting using the powerful tools built into its UI.

SFX Alert Details SFX Alert Details

However, we are focussing on Splunk On-Call so close this tab and return to the Splunk On-Call UI.

4. Similar Incidents

What if Splunk On-Call could identify previous incidents within the system which may give you a clue to the best way to tackle this incident.

The Similar Incidents tab does exactly that, surfacing previous incidents allowing you to look at them and see what actions were taken to resolve them, actions which could be easily repeated for this incident.

Similar Incidents Similar Incidents

5 Timeline

On right we have a Time Line view where you can add messages and see the history of previous alerts and interactions.

Incident View Incident View

6 Add Responders

On the far left you have the option of allocating additional resources to this incident by clicking on the Add Responders link.

add-responders add-responders

This allows you build a virtual team specific to this incident by adding other Teams or individual Users, and also share details of a Conference Bridge where you can all get together and collaborate.

Conference Bridge Conference Bridge

Once the system has built up some incident data history, it will use Machine Learning to suggest Teams and Users who have historically worked on similar incidents, as they may be best placed to help resolve this incident quickly.

You can select different Teams and/or Users and also choose from a pre-configured conference bridge, or populate the details of a new bridge from your preferred provider.

We do not need to add any Responders in this exercise so close the Add Responders dialogue by clicking Cancel.

7 Reroute

If it’s decided that maybe the incident could be better dealt with by a different Team, the call can be Rerouted by clicking the Reroute Button at the top of the left hand panel.

Reroute Reroute

In a similar method to that used in the Add Responders dialogue, you can select Teams or Users to Reroute the Incident to.

Reroute Incident Reroute Incident

We do not need to actually Reroute in this exercise so close the Reroute Incident dialogue by clicking Cancel.

8 Snooze

You can also snooze this incident by clicking on the alarm clock Button at the top of the left hand panel.

Snnoze Snnoze

You can enter an amount of time upto 24 hours to snooze the incident. This action will be tracked in the Timeline, and when the time expires the paging will restart.

This is useful for low priority incidents, enabling you to put them on a back burner for a few hours, but it ensures they do not get forgotten thanks to the paging process starting again.

Snooze Incident Snooze Incident

We do not need to actually Snooze in this exercise so close the Snooze Incident dialogue by clicking Cancel.

9 Action Tracking

Now lets fix this issue and update the Incident with what we did. Add a new message at the top of the right hand panel such as Discovered rogue process, terminated it.

Add Message Add Message

All the actions related to the Incident will be recorded here, and can then be summarized is a Post Incident Review Report available from the Reports tab

10 Resolution

Now kill off the process we started in the VM to max out the CPU by switching back the Shell session for the VM and pressing ctrl+c

Within no more than 10 seconds SignalFx should detect the new CPU value, clear the alert state in SignalFx, then automatically update the Incident in VictorOps marking it as Resolved.

Resolved Resolved

As we have two way integration between Splunk Infrastructure Monitoring and Splunk On-Call we could have also marked the incident as Resolved in Splunk On-Call, and this would have resulted in the alert in Splunk Infrastructure Monitoring being resolved as well.


That completes this introduction to Splunk On-Call!